Embed Size (px)
Citation preview
www.elsevier.com/locate/marpolbul
Marine Pollution Bulletin 55 (2007) 136–150
Using attached macroalgae to assess ecological status ofBritish estuaries for the European Water Framework Directive
Martin Wilkinson a,*, Paul Wood a, Emma Wells b, Clare Scanlan c
a School of Life Sciences, Heriot-Watt University, Riccarton, Edinburgh, EH14 4AS, UKb Wells Marine Surveys, Kings Lynn, UK
c Scottish Environment Protection Agency, Aberdeen, UK
Abstract
The EC Water Framework Directive requires that ecological quality be assessed in transitional waters using the abundance and spe-cies composition of macroalgae. In estuaries, which form the majority of transitional waters, species composition is not a suitable mea-sure. This arises from two features: (i) there is a continuous, natural change in species composition along the gradient of estuarineconditions which makes it difficult to know where within an estuary the species composition should be assessed, (ii) the inner estuarinemacroalgal community of mat-forming species is very tolerant to both natural and anthropogenic stress and species poor which makes itinsensitive to environmental variations in terms of species composition. An alternative feature is proposed based on the extent ofupstream penetration of perennial fucoid algae. This proposal is founded on a series of case studies of the changes in fucoid limits, withina number of estuaries in the British Isles, consequent upon changes in pollution status over the last three decades. This also has to takeinto account variations of fucoid penetration owing to natural factors such as range of salinity variation and turbidity. The abundancecriterion is taken to mean the absence of macroalgal blooms or ‘‘green tides’’, because general abundance of species is hard to quantifymeaningfully in the upper estuarine mat-forming species and in the lower estuary is subject to great variation owing to the physical var-iability of estuary types.� 2006 Elsevier Ltd. All rights reserved.
Keywords: Macroalgae; Seaweeds; Estuaries; Water Framework Directive
1. Introduction
The EC Water Framework Directive (WFD, 2000/60/EC) distinguishes tidal waters into coastal and transitionalwaters. Transitional waters encompass a range of situa-tions, intermediate between seawater and freshwater, ofwhich the dominant one is estuaries. This study is con-cerned only with estuarine transitional waters. It does notrelate to lagoons. It only relates to rias, sealochs and fjordswhere there is a riverine input which can be regarded as asmall river estuary in its own right. The WFD requiresassessment of ecological quality of water bodies on a five-
0025-326X/$ - see front matter � 2006 Elsevier Ltd. All rights reserved.
doi:10.1016/j.marpolbul.2006.09.004
* Corresponding author. Tel.: +44 131 451 3468; fax: +44 131 451 3009.E-mail address: [email protected] (M. Wilkinson).
point scale (high, good, moderate, poor, bad) using a rangeof biological quality elements. Quality is assessed by com-paring the state of the quality elements in any particularwater body with reference conditions, which are theexpected state of the quality elements in a pristine waterbody. An important feature of the WFD is the use of awide range of plant types (phytoplankton, macroalgae,seagrasses, salt-marsh plants) as biological quality elementsso that assessment is broadened to include primary produc-ers as well as the more customarily used macrobenthicfauna and fish. For reference conditions for macroalgaein transitional waters the WFD has two requirements.The composition of macroalgal taxa should be consistentwith undisturbed conditions and there should be no detect-able changes in macroalgal abundance due to anthropo-genic activities.

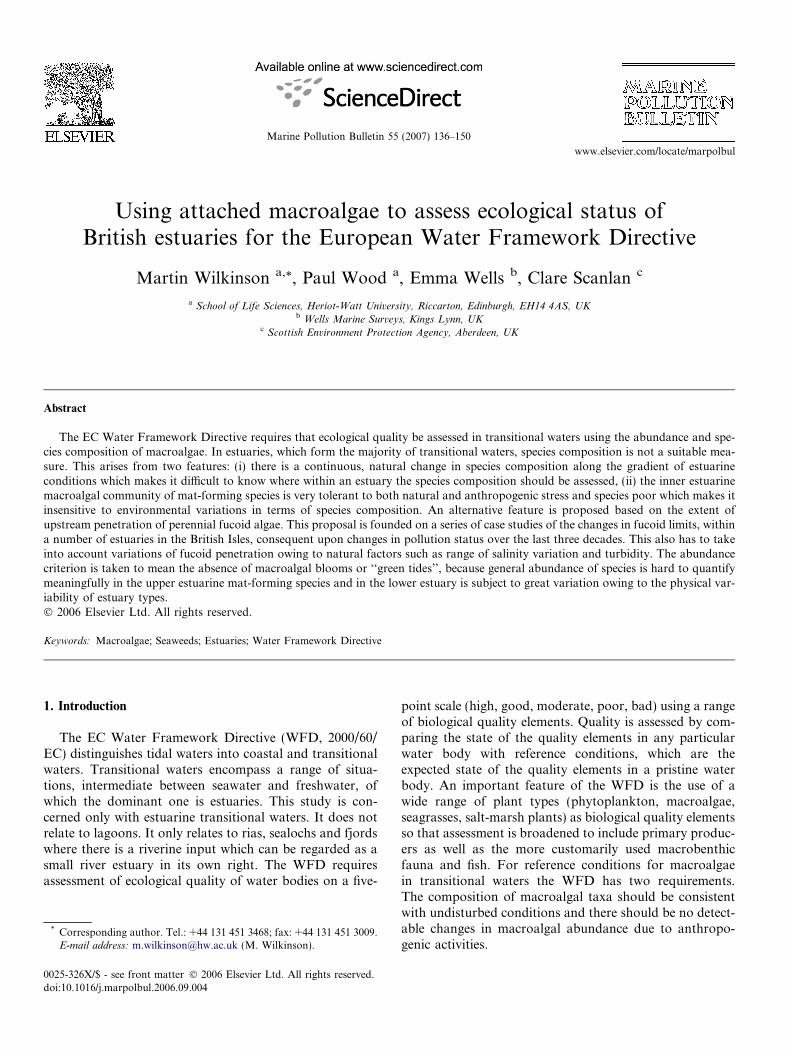
Fig. 1. The three zones into which estuarine algal macroflora may bedivided (from Wilkinson et al., 1995a). The width of the species numbercone reflects the decrease in species richness in an upstream direction.
M. Wilkinson et al. / Marine Pollution Bulletin 55 (2007) 136–150 137
The absence of macroalgal blooms (or ‘‘green tides’’)suggested by the latter point is an accepted feature of goodecological quality for both transitional and coastal waters,intertidal and sublittoral, and a separate quality assessmenttool is being developed for this criterion (Scanlan et al., thisvolume). These are similar to the requirements of the WFDfor reference conditions using macroalgae in coastal waters(Vincent et al., 2002). Various approaches have been sug-gested for use in WFD of monitoring species compositionand abundance of seaweeds on the open coast (Orfanidiset al., 2001, 2003; Panayotidis et al., 2004; Borja et al.,2004). However the composition of macroalgal taxa inestuaries is more problematical. The following review ofthe distribution of macroalgae in estuaries in relation toenvironmental factors illustrates this point, leading to thepossibility that species composition may not be a good toolfeature in the mid and upper parts of estuaries, despite itsspecification in the WFD.
1.1. Distributions of attached algae in estuaries
The nature of the transitional water environment is veryvaried. There is a wide range of estuary types (McLuskyand Elliott, 2004) – fjordic and coastal plain; mixed, par-tially mixed and stratified with respect to salinity; largeand small; completely flushed (i.e. bed above surroundingcoastal low water mark so that the estuary empties on eachtide) and not completely flushed. These vary considerablyin salinity distribution pattern and the magnitude of salin-ity variation at any one station during a single tidal cycle,with the spring/neap cycle, seasonally and with river flow.Salinity is the major factor determining macroalgal speciespresence and distribution and different salinity patternscould present different situations to which algae have toadapt (Wilkinson, 1981). These features require an assess-ment of whether all these types of estuaries have the samemacroalgal features. Transitional waters also includebrackish lagoons and some sea lochs but these may havesubstantially different macroalgal features from conven-tional river estuaries and are not treated in this paper.The following description of the distribution of macroalgaeinto estuaries is for river estuaries only. The general patternin British estuaries can be summarised as explained below(Wilkinson, 1980; Wilkinson et al., 1976) but also hasgeneral applicability elsewhere than Britain in hydro-graphically similar situations (Wilkinson, 1980; Wilkinsonet al., 1995a).
Colonisation is almost entirely by marine species. A fewfreshwater species may occur in the uppermost reaches.Truly brackish water species are very few in number andare largely restricted to the larger rockweed, Fucus cerano-
ides, and several species of the mat-forming filamentousxanthophyte, Vaucheria. There is considerable reductionof species number (species richness) going upstream fromthe mouth to the head of the estuary. This reduction of spe-cies number is achieved by selective attenuation, firstly ofred algae (Rhodophyta), then of brown algae (Pha-
eophyta). Green species (Chlorophyta) penetrate through-out the estuary although their species richness may alsodecline slightly going upstream. In the upper reaches ofthe estuary there is naturally increased dominance of greenalgae independent of any nutrient enrichment, togetherwith cyanobacteria and xanthophytes.
The predominant form of the algae changes in anupstream direction from a mixture of both perennial andsimple forms near the mouth to only simple opportunistand mat-forming types in the inner reaches. In the upperpart of the estuary algae which are not conventionallyregarded as macroalgae, such as filamentous diatoms,may form macroscopically visible mats which can in somecases be mistaken for filamentous brown algae. Particularlyimportant to include in the macroalgae in this context arediatoms of the genus, Melosira, (Rendall and Wilkinson,1983) and estuarine schizonemoid (tube-dwelling) diatoms(Cox, 1977).
One way of viewing the distribution pattern aboveinvolves recognition of three algal zones (A, B and C) asshown in Fig. 1. Zone A is the sheltered open coast atthe mouth of the estuary and the lowermost part of theestuary. Essentially it has a coastal seaweed flora with typ-ically 50–100 seaweed species on a shore drawn from about630 species of red, green and brown seaweed which occur inthe British Isles (South and Tittley, 1986), and, as a shel-tered shore, it is fucoid dominated with many of the widerange of other species, both perennial and annual, formingan understorey under the fucoid canopy. Zone B containsthe lower estuarine flora. As this is the more saline partof the estuary it is fucoid dominated but, with the estuarineinfluence, species richness is reduced relative to the opencoast, often to between 10 and 40 species per shore. ZoneC contains the upper estuarine flora. In this zone fucoidsare completely absent and the flora is characterised bymat forming opportunists, including groups other thanred, green and brown seaweeds. There are about 20 specieswhich occur commonly in this zone in the British Isles, ofwhich many occur in most estuaries, but often with only0–10 species per shore. This pattern of estuarine algal dis-tribution was presented by Wilkinson et al. (1995a).

138 M. Wilkinson et al. / Marine Pollution Bulletin 55 (2007) 136–150
The Venice System (den Hartog, 1960) for the classifica-tion of brackish waters into salinity zones, such as oligo-haline, polyhaline etc., has only been applied to themacroalgal vegetation of one British estuary, the Thames,by Tittley and Price (1977). As the Thames is relativelylong it has reaches with restricted salinity ranges which per-mit easy application of the Venice system. In general it doesnot seem worth attempting to apply this classification tomacroflora of most other British estuaries as the salinityenvironment is too variable at individual locations for itto be easily applied.
There may be exclusion of species from estuaries, partic-ularly by high water column turbidity and the smotheringof substratum by sediment, or by lack of suitable substra-tum, all of which are natural features of estuaries. There isoften no sublittoral algal macroflora in much of the lengthof an estuary, except in the outer part of Zone B, and some-times there may even be no intertidal macroflora in upperreaches of particularly sediment laden estuaries. Brackishwater species are very few – mainly Vaucheria and Fucus
ceranoides but they do not necessarily occur in every estu-ary so that some estuaries have no particular specialisedbrackish water flora.
There appears to be a relatively small pool of upperestuarine species over all estuaries (Wilkinson and Rendall,1985) so that there may only be small differences in theupper estuarine species composition between different estu-aries. The general pattern of estuarine algal distributiondescribed above is probably a widespread pattern over awider area of the world based on a comparison of estuariesin Europe and America (Wilkinson et al., 1995a).
1.2. Problems with this algal distribution pattern for WFD
requirements
Meeting the strict wording of the ecological qualityrequirements of the WFD with estuarine macroalgae maypresent difficulty because of two features described above:the nature of the habitat and the nature of the community.In addition there is a dearth of quantitative data for algaein estuaries (as noted by Middleboe and Sand-Jensen(2000) in attempting to describe changes in a Danish estu-ary), meaning that more reliance must be placed only onqualitative data if comparisons are to be made with thepast.
(1) The nature of the habitat. The estuarine habitat isnaturally very disturbed. The salinity is variable and isnot continuously freshwater or full seawater – the twoalternative salinities to which most species are adapted.In addition there is often naturally high turbidity. The var-iability of the salinity is particularly distressing to the mar-ine flora as exemplified by the fact that in the more stablebrackish salinities of the Baltic Sea many more marine spe-cies can penetrate into the brackish environment, and tolower salinities, than in river estuaries (den Hartog,1967). This immensely physical habitat results in an opencommunity with few species. Major natural factors may
exclude species in similar manner to pollutants – particu-larly turbidity and substratum.
(2) The nature of the community. Community composi-tion changes continuously along much of the estuarine gra-dient from mouth to head of the estuary and this gives riseto problems in community sampling. It is difficult to knowwhere within the estuary should one measure communitycomposition for WFD reference conditions or whetherone should use the whole estuary. By contrast with the var-iable composition of Zone B flora, Zone C flora is relativelyconstant within a single estuary. It could be that the upperestuarine algal vegetation is so hardy due to natural distur-bance that it is relatively insensitive to further anthropo-genic disturbance and is so poor in species number thatthere can be little scope for variation in either species rich-ness or species composition with anthropogenic influence.This would suggest that Zone C species composition maybe so species poor and robust in tolerance to difficult envi-ronmental conditions that it may be of little indicatorvalue, and Zone B species vary so much along estuary thatthere is no single place to sample. An alternative feature ofestuarine macroalgae that is easily observed, and the indi-cator value of which is being assessed in this paper, maybe the Zone B/C boundary i.e. the boundary along thelength of the estuary between communities dominated byperennial algae and communities consisting solely ofopportunist mat-forming species. Perennial algae are thespecies which live for more than one year, are physicallytough in texture, and are usually a significant componentof open coastal floras e.g. Mastocarpus stellatus. Effectivelythis boundary is the fucoid penetration limit since the mostupstream penetrating, perennial species are invariably fuc-oids in British estuaries. The present study considers if thisboundary occurs at a specific position in an estuary andwhether this position might vary with anthropogenic influ-ence, and also if there might be variation between estuariesin the particular fucoid species responsible for this bound-ary, and if this might change over time.
2. Results from investigations on estuarine algae
Investigations were carried out on two aspects of thedevelopment of a macroalgal tool for ecological qualityassessment in estuaries using macroalgae. These were thespecies composition of Zone C compared between manydifferent estuaries, and the fucoid penetration limits in arange of estuaries.
2.1. Species composition of Zone C
A range of estuaries in the United Kingdom and Repub-lic of Ireland was sampled between 1971 and 2005. Thisincludes some estuaries undergoing considerable recoveryfrom pollution which were sampled at widely differentdates and so allowed stability or otherwise of species com-position to be evaluated. Samples for qualitative identifica-tion of attached macroalgae were collected from the 151

Table 1The estuaries investigated in the British Isles for species composition of Zone C and for the dominant species of fucoid present
Site numberas shown inFig. 2
Name of estuary (orof locality for smallestuarine streams)
Zone C sampled for attachedmacroalgae (++) or not sampled (ns) inthe particular estuary
Fucus species penetrating furthest into estuary (O indicatesthat sites at which Fucus would be expected were not visited inthe particular estuary)
Northern Ireland
1 Bann ++ O2 Bush ++ F. spiralis
3 Dun ns F. ceranoides
4 Dall ns F. ceranoides
5 Carnlough ++ F. ceranoides
6 Glencloy ++ F. ceranoides
7 Glenarm ns F. ceranoides
8 Larne ns F. ceranoides
9 Glynn ns F. ceranoides
10 Magheramorne ns F. ceranoides
11 Castlerocklands ++ O12 Whiteabbey ++ O13 Whitehouse ++ O14 Lagan ++ O15 Newtownards ns F. ceranoides
16 Comber ++ F. ceranoides
17 Mill view ns F. ceranoides
18 Blackstaff ++ O19 Annalong ns F. ceranoides
20 Newry ++ O
Republic of Ireland
21 Tolka ++ O22 Liffey ns F. ceranoides
23 Dodder ns F. ceranoides
24 Avoca ++ No fucoids present in estuary25 Slaney ++ F. ceranoides
26 Barrow ++ F. ceranoides
27 Suir ++ F. ceranoides
28 Mahon ns F. ceranoides
29 Colligan ns F. ceranoides
30 Blackwater ++ F. ceranoides
31 Lee ns F. ceranoides
32 Bandon ++ F. ceranoides
33 Ilen ++ F. ceranoides
34 Shannon ++ F. ceranoides
Scotland
35 Urr ++ F. ceranoides
36 Dee/Tarff ++ F. ceranoides
37 Fleet ++ F. ceranoides
38 Bladnoch ++ O39 Irvine ns F. ceranoides
40 Garnock ++ F. ceranoides
41 White Cart ++ O42 Clyde ++ F. ceranoides
43 Leven (Clyde) ++ F. ceranoides
44 Gareloch ns F. ceranoides
45 Gairletter Burn ++ F. ceranoides
46 Add ++ F. ceranoides
47 Laggan ++ F. ceranoides
48 Gruinart ++ F. ceranoides
49 Awe (Taynuilt) ++ O50 Sallachan ++ F. ceranoides
51 Strontian ns F. ceranoides
52 Loch Ailort ns F. ceranoides
53 Ord ++ F. ceranoides
54 Brittle ++ F. ceranoides
55 Gairloch ++ O56 Ewe ++ O57 Thurso ++ O
(continued on next page)
M. Wilkinson et al. / Marine Pollution Bulletin 55 (2007) 136–150 139

Table 1 (continued)
Site numberas shown inFig. 2
Name of estuary (orof locality for smallestuarine streams)
Zone C sampled for attachedmacroalgae (++) or not sampled (ns) inthe particular estuary
Fucus species penetrating furthest into estuary (O indicatesthat sites at which Fucus would be expected were not visitedin the particular estuary)
58 Wick ++ O59 Ness ns F. ceranoides
60 Deveron ++ O61 Ugie ++ F. ceranoides
62 Ythan ns F. ceranoides
63 Dee ++ F. ceranoides
64 Don ++ F. ceranoides
65 North Esk ns F. ceranoides
66 South Esk ns F. ceranoides
67 Lunan ++ O68 Tay ++ F. vesiculosus
69 Eden ++ O70 Kinness Burn ++ F. ceranoides
71 Cambo ++ O72 Dreel Burn ++ O73 Boghall Burn ++ O74 Leven (Fife) ++ O75 Teil Burn ++ O76 Dour Burn ++ O77 Keithing Burn ++ O78 Devon (Forth) ++ O79 Forth ++ F. spiralis
80 Carron ++ F. vesiculosus
81 Grange Burn ++ F. vesiculosus
82 Avon ++ No fucoids present in estuary83 Almond ++ F. ceranoides
84 Esk ++ F. ceranoides
85 Peffer Burn ++ O86 Pilmur Burn ++ O87 North Tyne ns F. ceranoides
88 Biel Water (Forth) ++ O89 Tweed ++ F. ceranoides
England
90 Aln ++ F. ceranoides
91 Coquet ++ F. ceranoides
92 Wansbeck ++ F. ceranoides
93 Sleekburn ++ F. ceranoides
94 Blyth ++ F. ceranoides
95 Tyne ++ F. vesiculosus
96 Wear ++ F. ceranoides
97 Billingham Beck ++ No fucoids present in estuary98 Tees – before 1990 ++ No fucoids present in estuary99 Tees – after 1990 ns F. spiralis
100 Esk ns F. ceranoides
101 Stone Creek ++ F. vesiculosus
102 Humber ++ F. vesiculosus
103 Louth Canal (Tetney) ++ F. ceranoides
104 Grainthorpe Haven ++ O105 Saltfleet Haven ++ F. vesiculosus
106 Witham ns F. vesiculosus
107 Welland ++ F. vesiculosus
108 Nene ++ F. vesiculosus
109 Hun ++ O110 West Stiffkey ++ O111 East Stiffkey ++ O112 Glaven ++ O113 Yare ++ O114 Waveney ++ O115 Blyth ++ F. ceranoides
116 Alde ++ F. vesiculosus
117 Blackwater ns F. ceranoides
140 M. Wilkinson et al. / Marine Pollution Bulletin 55 (2007) 136–150

Table 1 (continued)
Site numberas shown inFig. 2
Name of estuary (orof locality for smallestuarine streams)
Zone C sampled for attachedmacroalgae (++) or not sampled (ns) inthe particular estuary
Fucus species penetrating furthest into estuary (O indicatesthat sites at which Fucus would be expected were not visitedin the particular estuary)
118 Thames ++ F. vesiculosus
119 Medway ++ F. vesiculosus
120 Itchen ++ F. ceranoides
121 Test ns F. ceranoides
122 Medina ++ F. vesiculosus
123 Axe ++ O124 Otter ++ F. ceranoides
125 Clyst ++ F. ceranoides
126 Exe ++ F. ceranoides
127 Teign ++ F. ceranoides
128 Dart ++ F. ceranoides
129 Yealm ++ F. ceranoides
130 Plym ++ O131 Tamar ++ O132 Tavy ++ F. ceranoides
133 Lynher ++ O134 Polbathic ++ O135 Kenwyn ++ F. ceranoides
136 Allen ++ F. ceranoides
137 Carnon River andRestronguet Creek
++ O
138 Penryn ++ O139 Helford ns F. ceranoides
140 Hayle ++ F. vesiculosus
141 Gannel ++ O142 Porth ++ O143 Bristol Avon ++ O144 Severn ++ F. vesiculosus
Wales
145 Usk ++ O146 Rhymney ++ No fucoids present in estuary147 Taff ++ F. ceranoides
148 Ely ++ O149 Ogmore ++ O150 Afan ++ No fucoids present in estuary151 Neath ++ F. vesiculosus
152 Tawe (pre-barrage) ns F. vesiculosus
153 Lliw ++ O154 Loughor ns F. vesiculosus
155 Tywi ++ F. vesiculosus
156 Taf ++ F. vesiculosus
157 Carew ns F. ceranoides
158 Cresswell ++ F. ceranoides
159 E. Cleddau ++ F. vesiculosus
160 W. Cleddau ++ F. vesiculosus
161 Sandyhaven Pill ns F. ceranoides
162 Solva ns F. ceranoides
163 Nyfer ns F. ceranoides
164 Teifi ns F. ceranoides
165 Aberaeron ns F. vesiculosus
166 Ywstyth ++ F. ceranoides
167 Rheidol ++ F. ceranoides
168 Leri ns F. ceranoides
169 Dovey ns F. ceranoides
170 Mawddach ++ F. ceranoides
171 Dywyrd/Glaslyn ++ F. ceranoides
172 Seiont ++ F. ceranoides
173 Cefni ns F. ceranoides
174 Ffraw ++ F. ceranoides
175 Afon Goch ++ No fucoids present in estuary176 Conwy ns F. ceranoides
177 Dulas ns F. vesiculosus
(continued on next page)
M. Wilkinson et al. / Marine Pollution Bulletin 55 (2007) 136–150 141

Table 1 (continued)
Site numberas shown inFig. 2
Name of estuary (orof locality for smallestuarine streams)
Zone C sampled for attachedmacroalgae (++) or not sampled (ns) inthe particular estuary
Fucus species penetrating furthest into estuary (O indicatesthat sites at which Fucus would be expected were not visitedin the particular estuary)
178 Llanbedr ns F. ceranoides
179 Clwyd ++ F. vesiculosus
180 Nant-y-Flint Brook ++ O181 Dee ++ F. vesiculosus
England
182 Manchester Ship Canal ++ O183 Mersey ++ F. vesiculosus
184 Alt ++ O185 Crossens ++ O186 Ribble ++ O187 Savick Book ++ O188 Lune ++ O189 Keer ++ O
Isle of Man
190 Douglas ++ F. ceranoides
191 Silver Burn ++ F. ceranoides
192 Neb ++ F. ceranoides
193 Sulby ++ F. ceranoides
194 Laxey ++ F. ceranoides
England
195 Derwent ++ F. ceranoides
196 Ellen ++ F. ceranoides
197 Eden (Cumbria) ++ O
As these are collated records from a long time period rather than a concerted survey both features were not recorded in all estuaries so the third and fourthcolumns indicate what was investigated.
142 M. Wilkinson et al. / Marine Pollution Bulletin 55 (2007) 136–150
estuaries listed in Table 1 with locations shown in Fig. 2. Atotal of 216 samples was analysed since more than one sitewas taken in the larger estuaries, and a few samples in ini-tially highly polluted estuaries had repeat samples fromwidely separated dates. The physical range of this largenumber of estuaries varied from tidal burns dischargingto the sea with a small tidal stretch of as little as 100 m,e.g. the Dour Burn discharging into Aberdour Harbour,Fife, Scotland, to the largest estuaries in Britain such asthe Humber and Severn. All the major industrialised estu-aries of Britain were included. For consistency of identifi-cation all Zone C species recordings are from samplingby Wilkinson from 1971 to 2004 and some from samplingby Wilkinson and Wood in 2004–2005, with the exceptionof the Thames which are taken from Tittley and Price(1977). The range of estuaries covered included highlyand partially stratified and well-mixed estuaries as well ascompletely flushed and not completely flushed estuaries.
The average number of species per sample was 8.5 with arange from 1 to 20 species. Only 26 (12%) samples hadmore than 10 species. This contrasts sharply with up to100 species per shore on the open coast (Wilkinson andWood, 2003). The species recorded in total over all 216samples only included 37 red, green and brown macroalgaecompared with a total of about 630 seaweed species listedin total for England, Scotland and Wales combined (Southand Tittley, 1986). In addition the analysis included six
taxa of filamentous diatoms, one taxon of Xanthophyta(Vaucheria spp.), and six taxa of cyanobacteria. Vaucheria
may have been represented by several species but thesewere treated only as the one taxon because in many casesit was not possible to identify to species level since thisrequires reproductive material which was rarely found.Similarly the cyanobacterial genus Phormidium was proba-bly represented by several species but cyanobacteria wereonly identified to genus level because of the lack of univer-sal agreement about specific delimitation and the high mor-phological plasticity of the entities encountered.
Table 2 shows that only 15 taxa were found in morethan 10% of the 216 samples. These were largely greenalgae (11 taxa) with one taxon each of xanthophytes andcyanobacteria and two of filamentous diatoms. Theseresults confirm that very few macroalgal species are regu-larly found in the upper reaches of estuaries. This tableof common species is little different from that presentedby Wilkinson and Rendall (1985) on the basis of subjectiveobservation of many fewer estuaries so this more extensiveand objective analysis confirms those earlier suggestions.
With so few species being commonly present there is lit-tle variation in Zone C community composition with estu-ary type or water quality. On the basis of only 15 estuaries,Wilkinson et al. (1976) had suggested that there might havebeen three algal types of estuary that could be related towater quality. A larger survey of about 60 estuaries

Fig. 2. Map showing locations of estuaries studied. Table 2 lists those from which Zone C samples were analysed for species composition and those inwhich fucoids were sought.
M. Wilkinson et al. / Marine Pollution Bulletin 55 (2007) 136–150 143
(Wilkinson et al., 1983) with an ordination analysis of com-munity composition suggested that there was not such adistinction. With the present much larger dataset a furtherordination was carried out. Three ordination approaches(Principal Components Analysis, Detrended Correspon-dence Analysis and Multidimensional Scaling (MDS)) onthe basis of species presence/absence all showed the samebasic conclusion – that there was no clustering of estuarinesamples into discrete groups that might correspond to dif-
ferent Zone C community types. The result from oneapproach, MDS, is illustrated in Fig. 3.
In order to show the lack of distinction between floras inZone C of estuaries with different levels of anthropogeniceffect, in Fig. 3 some samples which were taken from estu-aries which were particularly highly polluted at the time ofsampling (Avoca, Clyde, Avon (tributary estuary of theForth estuary – Scotland), Billingham Beck (tributary ofthe Tees estuary), Afon Goch, Tees, Carnon River,

Table 2The attached macroalgal taxa found in more than 10% of samples fromZone C of estuaries in the British Isles listed in Table 1
Higher taxonomic groupto which identified taxonbelongs
% of samples inwhich taxon wasfound
Rhizoclonium tortuosum Chlorophyta 93.1Blidingia minima Chlorophyta 80.5Vaucheria sp. Xanthophyte 72.2Phormidium sp. Cyanobacteria 67.6Enteromorpha intestinalis Chlorophyta 66.2Enteromorpha prolifera Chlorophyta 48.6Blidingia marginata Chlorophyta 47.2Ulothrix implexa Chlorophyta 45.4Monostroma oxyspermum Chlorophyta 28.2Rosenvingiella polyrhiza Chlorophyta 22.7Melosira nummuloides Diatom 21.3Ulothrix subflaccida Chlorophyta 18.5Ulothrix flacca Chlorophyta 13.0Melosira varians Diatom 11.6Cladophora glomerata Chlorophyta 10.2
Fig. 3. Ordination by MDS (stress = 0.23) on basis of species presence orabsence of 216 upper estuarine (Zone C) macroalgal samples from theupper reaches of 151 estuaries listed in Table 1 as having algal samplesfrom Zone C. Inverted triangles represent illustrative grossly pollutedsamples and squares are samples from illustrative relatively unpollutedsites. Black triangles are samples from the remaining sites which have notbeen subjectively categorised as to pollution status.
144 M. Wilkinson et al. / Marine Pollution Bulletin 55 (2007) 136–150
Mersey, Alt), and some from relatively unpolluted ones,particularly in remote areas of Scotland (Awe, Add, Lag-gan, Ord, Brittle, Thurso), are indicated. These specimensamples are generally dispersed among the rest of the estu-arine samples and mixed with each other suggesting thatthere are no Zone C species assemblages that could be usedas clear indicators of water quality. A recent more detailedseasonal study (Wilkinson and Slater, 1997) with quantita-tive sampling compared two physically similar sub-estuar-ies of the Forth, the River Almond and the KeithingBurn, which had very different water quality, one enriched
with mine-drainage water and one with sewage-derivednutrients, and concluded that there was little difference inthe upper estuarine flora.
In the following section changes in the fucoid penetra-tion limit due to recovery from pollution are described. InZone C of some estuaries changes in the Zone C speciescomposition occurred, with recovery from pollution, beforefucoid (re)colonisation had also occurred in the Tees, Car-ron and Billingham Beck estuaries. All these have sufficientdata recorded at different times to show an initial rise inrichness of Zone C species number followed by a slightdecrease on fucoid recolonisation, reminiscent of the inter-mediate disturbance hypothesis of Connell (1978). How-ever, even with the increased numbers of Zone C speciesat the site during recovery, there are no species present thatare not normal Zone C species and the richness is not abovethe range recorded here for Zone C sites anyway. Thereforeno use can be made of this phenomenon in measuringecological quality using Zone C species lists.
2.2. Perennial algal penetration
A series of papers on algal distributions along estuaries(Wilkinson, 1973a,b, 1975; Wilkinson and Roberts, 1974;Tittley and Price, 1977; Wilkinson et al., 1980, 1986,1987; Wilkinson and Telfer, 2000), together with manyunpublished observations of the present authors, suggestthat Fucus species are always the most upstream penetrat-ing perennial macroalgae in British estuaries. But there canbe differences between estuaries in which species of fucoidare present in the mid and upper reaches and how farupstream they penetrate.
Two of the open coast fucoid species, Fucus spiralis andFucus vesiculosus, can penetrate estuaries to the limit ofperennial algal penetration. The other open coast species,Fucus serratus, prefers more marine conditions and, whileit may occur in the outer part of Zone B, it has not beenfound to be the furthest upstream penetrating fucoid inany estuary in Britain. In addition, the brackish speciesFucus ceranoides, which only rarely occurs on the opencoast in the strongest freshwater inflows over the shore,occurs in many estuaries.
Table 1 shows that F. ceranoides is usually, but notalways, the furthest penetrating fucoid. Indeed there aresome estuaries in which it has not been found despite thecommon belief that it is the classic estuarine alga. Out ofthe 143 estuaries in which fucoids were sought, shown inTable 1, 103 estuaries (or 72%) have F. ceranoides as thefurthest upstream penetrating species. Almost all of theseestuaries also contain the other two species but it is onlyin the estuaries where F. ceranoides is absent where theseare the most upstream penetrating species – that is for F.
vesiculosus 29 estuaries (20%) and for F. spiralis four estu-aries (3%). There were seven estuaries (5%) where Fucus
was sought that did not have any fucoids.The reason why F. ceranoides is sometimes completely
absent from an estuary is not clear. Burrows (1964), Khfaji

M. Wilkinson et al. / Marine Pollution Bulletin 55 (2007) 136–150 145
and Norton (1979), Lein (1984), Back et al. (1992) andSuryono and Hardy (1997) explain its occurrence in estuar-ies by comparing its salinity tolerance with that of otherfucoids and show that it thrives better in reduced salinitythan do open coast species. But this does not explainwhy sometimes F. ceranoides appears to be completelyabsent from estuaries in which these supposedly less welladapted species thrive. Burrows (1964) showed that F. cer-
anoides eggs develop resistance to freshwater faster thanthose of other fucoids and Brawley (1992) has shown thesalinity requirements for successful fertilisation but thesedo not explain it either.
The brackish Baltic Sea lacks F. ceranoides (Back et al.,1992) although it has F. vesiculosus. These authors mainly
Table 3Estuaries in which fucoids are presently absent, or were formerly so, or have
Estuary Type of change
Afan (South Wales) Colonisation by F. vesiculosus between 1978 and 20001978 this estuary lacked fucoids and much of it wasdominated by mats of cyanobacteria over strongly anmud. In 2000 there was a very well developed fucoidgoing much of the way up the estuary
Thames Movement of F. vesiculosus upstream from BelvedereWoolwich between 1976 and 1993 (although absent aWoolwich in 2001)
Mersey Movement upstream of Fucus vesiculosus between 19782005 by about 3 km
Tyne Movement upstream of Fucus vesiculosus from Hebbu1972 to Blaydon in 2004 by about 17 km
Tees Colonisation by Fucus spiralis at the lowermost end anrecorded sustained spread upstream to the furthest polimit at the physical barrier of the Tees Barrage betw1990 and 2002
Carron (Forth) Colonisation of the estuary by Fucus spiralis betweenand 2000
Humber Colonisation by fucoids between 1982 and 1996 of a stof the lower estuary about 4 km long, surrounded onsides by Zone B flora, but in which Zone B flora was ain 1982, being replaced by Zone C flora (Wilkinson aTelfer, 2000)
Billingham Beck No fucoid colonisation despite surface salinities up toin lower estuary
Avoca (RoI) No fucoid colonisation despite surface salinities overlower estuary. Believed to be similar severe effects onbenthic fauna (Wilson, 1980, 2003, personalcommunication)
Avon (Forth) No fucoid colonisation despite surface salinities overDon Colonisation by Fucus ceranoides between 1976 and 2
Garnock Colonisation and upstream movement to tidal freshwby Fucus ceranoides between 1980 and 1986 (Wilkinsoet al., 1980, 1986)
Almond (Forth) Upstream movement of F.ceranoides. between 1978 a1994. This is only a very small completely flushed estless than 1 km long so a movement of only c.0.3 kmsignificant change
All examples except the Thames are from personal observations of M.Wilkins
consider whether or not it has had sufficient evolutionarytime to invade the Baltic. However an alternative hypothe-sis would be that it is not particularly favoured by the sta-bility of the salinity in the Baltic, although this stabilitymay allow more marine species to survive there (den Har-tog, 1967). In many smaller completely flushed estuaries itis the only fucoid which lives in such a position that it hasto survive constant immersion in flowing freshwater whenthe tide is out and yet withstand full salinity when the tideis in. This may suggest that it performs better than theother fucoids when the salinity is particularly variable. Thiscould explain its absence from the Baltic and could alsoexplain its absence from the larger macrotidal estuaries ofBritain, which are believed to be more well-mixed, in which
moved substantially upstream in the last 30 years
Possible cause Possible classification on WFDfive-point scale
. In
oxiczone
Abatement of severe sewageand mine-drainage waterpollution
Change from poor to good
tot
Abatement of pollution butalso possible surface salinitychange from c.1.9 to c.6.7
Change from moderate to good
and Abatement of pollution Moderate
rn in Abatement of pollution Moderate
d itsssibleeen
Abatement of very severeindustrial pollution
An improvement from poor to atleast moderate but no finalclassification possible as theestuary is now artificiallyinterrupted in mid reaches by anon-tidal barrage preventingfucoids from penetrating to theirpossible salinity limit
1978 Abatement of very severeindustrial pollution
Change from poor to moderate
retchboth
bsentnd
Abatement of very severeindustrial pollution
Change from moderate to good
c.20 Severe industrial pollution Poor
20 in Severe heavy metal pollution Poor
20 Severe pollution Poor003 Abatement of severe paper
mill pollutionChange from poor to good
atern
Abatement of very severeindustrial pollution(Hammerton et al., 1980)
Change from poor to good
nduaryis a
Abatement of nutrientpollution
Change from moderate to good
on. (Thames observations from Tittley, 2001; Tittley and John, 1998.)

146 M. Wilkinson et al. / Marine Pollution Bulletin 55 (2007) 136–150
the salinity at particular stations may be more stable e.g.Severn, Humber, Mersey, Thames, Tay. Burrows (1964)showed in culture that F. ceranoides and F. serratus bothsurvived at constant low salinity but when a daily alterna-tion of salinity was simulated F. ceranoides performedmuch better than F. serratus. Stability of salinity cannotbe the full explanation as it is also absent from some smal-ler more mixed estuaries e.g. Welland, Witham, Nene.These particular smaller estuaries may have in commonwith the larger estuaries the presence of high turbidity. Per-haps F. ceranoides is intolerant of high suspended solids.Chater (1927) in Aberdeenshire estuaries (Scotland) andCotton (1912) in western Ireland commented that the sizeof F. ceranoides was much reduced in estuaries with highersediment loads and together with Gillham (1957) in the Exeestuary (south-west England) they commented that sedi-ment load was more likely to affect F. ceranoides distribu-tion than was salinity. A third possibility for the absenceof F. ceranoides is water pollution. Suryono and Hardy(1997) explain the absence of F. ceranoides from the Tynecompared with its presence in the Wear and Tweed as pos-sibly being due to the higher nutrient status of the Tyne.However there is another instance of where F. ceranoides
was tolerant to heavy metal pollution in a Spanish estuary(Barreiro et al., 1993). It is noticeable that in the casesdescribed below, and in Table 3, of upstream movementor colonisation of estuaries by fucoids, consequent uponabatement of pollution, with one exception the colonisingspecies are not F. ceranoides. The exception is the Garnockestuary which is believed to have exceedingly variable salin-ity which, as suggested above, may be another factor whichfavours F. ceranoides. Not all estuaries lacking F. cerano-
ides have all the features discussed above – particularly var-iable salinity, absence of excessive turbidity, low levels ofnutrient pollution – maybe there is more than one causeworking separately or in concert to explain why F. cerano-
ides is absent from some estuaries. In view of these contra-dictory findings it is not possible to say that presence of F.ceranoides indicates better water quality and so presence ofthis species cannot be used by itself as a criterion in arrivingat ecological quality classification for the WFD.
How far upstream do fucoids penetrate? It is difficult toanswer this question precisely as few estuaries have ade-quate salinity data. Also it is not clear what salinity mea-surement would be the most appropriate – should it bemaximum, minimum, or average, or should there be someestimate of variability over a single tidal cycle. Good salin-ity data are available for only a few estuaries, and crudedata for some others but for many of the estuaries in Table1 there are no suitable data which give specific salinities atparticular sites. In most cases it has been necessary to makea subjective judgement of the likely salinity at the fucoidlimit on the basis of the physical features of the estuary.In many cases it seems that the fucoid limit is in a farupstream part of the estuary that is relatively shallowand riverine and so suggests that it is at low salinity oralmost in tidal freshwater.
3. A possible macroalgal tool for quality classification of
estuaries
Estuaries which have shown a movement upstream, ofFucus (where fucoids are already present in the estuary)or colonisation by Fucus (where fucoids have been absentfrom the estuary) consequent on abatement of pollutionsuggest that the fucoid penetration limit, i.e. the Zone B/Zone C boundary might be a quality criterion. The estuar-ies in which this has been observed are listed in Table 3,from observations by the present authors except whereotherwise shown. This table and Table 1 also show thatthere are a few estuaries (only 7 out of over 143 that havebeen observed) which still lack fucoid colonisation andthese are all highly polluted estuaries. Evidence from else-where in Europe suggests that pollution may be moreimportant than salinity in determining fucoid distribution(Lindgren, 1965; Lein et al., 1974; Pekkari, 1973) althoughthese examples are from fjordic and Baltic situations and soare not directly comparable with all British estuaries.
It is suggested that the presence of a fucoid zone, ZoneB, is a normal part of a healthy estuarine ecosystem and theextent to which this zone penetrates up stream can be ameasure of quality. It was originally thought that the pres-ence of F. ceranoides was an indication of high quality but,for the reasons discussed above about the possible disad-vantage of this species in well-mixed and especially turbidestuaries, that view can no longer be upheld without fur-ther research. In addition there is a problem in setting ref-erence conditions for estuaries in that, in contrast to theopen coastal shore, there are very few pristine examplesavailable to use as a standard. Accordingly it is proposedto unite the good and high classes in the possible tool, aspresented in the present paper, pending further work toseek ways to differentiate the classes.
3.1. Some qualifications that must be applied to the proposed
tool
Before giving details of a possible tool it is necessary toreview some qualifications that must be placed on it. Someenvironmental factors may negate upstream penetration offucoids even if the anthropogenic influence is low. Theseare turbidity, substratum, and the type of estuarine reachbeing considered.
(1) Turbidity. Particularly high turbidity and/or a highlevel of settlement of suspended solids on the substratummay prevent fucoid colonisation, just as they also preventthe occurrence of Zone C species. This is not likely to applyto a large number of estuaries as turbidity is a standard fea-ture of most estuaries to which the algae are adapted, but itis not possible to specify, in the light of present knowledge,a numerical level of suspended solids at which it will apply.However it is likely that it will also be seen in such estuariesthat the Zone C flora is also sparse or absent. An examplewould be the Severn estuary where the fucoid penetrationlimit is Sharpness which is in the wide part of the estuary

Table 4Possible classification scheme for estuaries on the basis of the presence of afucoid zone
Bad Poor Moderate Good/high
No macroscopicalgalcommunityvisible inestuary
No Zone B(fucoiddominatedzone) present inthe estuary –only Zone Cspecies presenteven in lowerestuary
Zone B (fucoiddominatedzone) is presentin lower estuarybut either it doesnot extendupstream to lowmean surfacesalinity c.5
Zone B (fucoiddominatedzone) extendsupstream to atleast five meansurface salinity
or there aresignificantinterruptions inthe continuity ofZone Boccupied onlyby Zone Cspecies
Salinity figures are based on annual mean surface salinities as it is surfacewater which bathes the intertidal plants at high tide.
M. Wilkinson et al. / Marine Pollution Bulletin 55 (2007) 136–150 147
with a massive tidal range of about 13m and receives salinewater at high tide. Upstream of this point, where the estu-ary becomes more riverine and sediment laden, the mat-forming flora has very sparse cover and is few in specieson mud covered substrata.
(2) Substratum. There needs to be suitable hard sub-strata to which fucoids can attach. This does not needextensive bedrock shores, only occasional boulders andwooden pilings, but rarely these may be absent.
(3) Type of estuarine reach being considered. The pro-posed fucoid penetration tool relates to reaches of riverestuaries with salinity change – not to sealochs, fjords orrias which are more likely to have high and less variablesalinity. The coastal tools being developed separately forseaweed communities on open coastal rocky shores maybe more appropriate to use if the lower estuarine site beingstudied is well seaward in Zone B.
Table 4 shows a suggested qualitative classificationscheme based on fucoid presence. The choice of 5 as a crit-ical salinity boundary is approximate, at present, pendingobtaining salinity data for more estuaries. It is based onthe penetration to or above this point in most of the estu-aries of reasonable quality for which good salinity datahave been seen and on the subjective visual estimate inother estuaries of the fucoid penetration limit being closeto the limit of salt penetration.
3.2. Examples of different classes
(1) Bad – The Tees estuary mid reach (Bamlett’s Reach)in the early 1970s, at the height of industrial pollution ofthe estuary, was devoid of all macroflora (Edwards, 1972)and so would have been classified as bad at that time butmacroalgae had recolonised by the early 1990s as waterquality improved (Hardy et al., 1993).
(2) Poor – The Tees (in the mid-1990s), Afan (in 1978)and Carron (in 1978) estuaries before pollution abatementwhen Zone C species were present throughout each estuarybut fucoids did not penetrate beyond the mouth.
(3) Moderate – The Clyde estuary (fucoids not up to fivemean surface salinity) is an example of an estuary classifiedas moderate because fucoids only penetrate part of the pos-sible extent up the estuary. The Clyde has F. ceranoides butit does not penetrate further upstream than Erskine, in themid estuary, where the salinity is about 15 on average. Thedistribution has altered little from that described by Wil-kinson (1973a).
The Humber estuary before pollution abatement is anexample of an estuary which would be classified as moder-ate because of the interruption of the Zone B flora in thelower reaches by a Zone C flora. The Humber had a4 km long interruption to the continuity of Zone B in thelowermost part of the estuary which was occupied onlyby green mat-forming Zone C species, between Grimsbyand Immingham (Wilkinson and Telfer, 2000). A widerrange of marine species would have been expected as thesalinity was almost fully marine and more diverse commu-nities were present both upstream and downstream.
(4) Good/high – The Forth estuary has F. spiralis up toabout 5 mean surface salinity, between Throsk and Cam-bus, in the upper estuary.
The River Add estuary in Argyllshire, in a sparsely pop-ulated area of the Scottish Highlands, is probably as nearas can be found in Britain to a pristine estuary. It hasF. ceranoides almost to tidal freshwater (Wilkinson andRoberts, 1974).
The problem of merging the good and high classes wasdiscussed earlier. It is not possible to separate them at pres-ent on the basis of the fucoid species present as there maybe both natural and anthropogenic reasons for presence orabsence of F. ceranoides. The limit upstream seems the keyfactor irrespective of the fucoid species. Good/high asopposed to moderate boundary can be clearly seen withthe fucoid limit irrespective of species – though this mightbe pushed downstream by excessive turbidity. For theWFD the really critical boundary is that between moderateand good as this is the one that water bodies are supposedto exceed by 2015.
A further reason for not separating the good and highclasses at this stage is the absence of comparable data onenvironmental quality for each of the estuaries for whichfucoid data have been collected. It is assumed that all ormost estuaries are polluted to a greater or lesser degreebut without quantitative data on this to compare withfucoid limits in all the estuaries, only the most seriousand well-known pollution situations can be taken intoaccount. Consequently in the present state of developmentthis is a relatively crude tool in which a variety of estuarinequalities are subsumed into the good and high categories.
It is a qualitative tool for simple categorical character-isation only. It does not involve numerical measurementsof the biota that can be subjected to statistical testing. It

148 M. Wilkinson et al. / Marine Pollution Bulletin 55 (2007) 136–150
will be necessary to use it with other quality elements if it isto be more quantitative. But there could be a concern thatin upper and mid estuaries nutrients are naturally highwithout necessarily causing adverse effects so there is aneed to beware of failing many estuaries on nutrients any-way. The Fucoid Penetration Tool effectively covers thewhole length of an estuary rather than a single shore withinit, unlike the macroalgal tools being suggested for rockyshores in coastal waters (Wells et al., this volume). Anadvantage of the proposed tool is that the sampling periodis irrelevant in comparison with coastal macroalgal toolssince the fucoid limit does not change over the year (andeven Zone C species composition is relatively constant).
3.3. An additional possible investigative tool with macroalgae
Many of the tools being developed using biota for theWFD are primarily measuring the state of the communityat one point in time in terms of species richness, speciespresence or various measures of abundance. This has beencriticised, for example by de Jonge et al. (2006), as notbeing an approach to ecosystem functioning as the realintent of the WFD for monitoring ecological quality ofwater bodies. Using estuarine macroalgae there could bean enhanced approach to determining possible changes inecological quality by measuring incipient recovery frompollution of an estuarine site using explants of excised api-cal segments of fucoid species (Snelgrove and Wilkinson,1998). Fucoid explants to a field site can indicate by theirgrowth rate, physiological condition or mere survival, aftera period of explantation, the capacity of site to allow adultgrowth of fucoids and possible incipient recovery, or alter-natively point to other possible causes of absence of fuc-oids. There has been a steady advance of fucoids up theTees estuary as it has recovered from pollution subsequentto the situation described by Hardy et al. (1993). Thisstarted about 1993 and F. spiralis has progressively movedupstream in stages over the period to 2002 about 16 km tothe Tees Barrage, a non-tidal estuarine barrage which is abarrier that the plants cannot pass which was completedin 1994. In 1929, before the effect of pollutants on macro-algae in the estuary had became severe, fucoids did extenda further 6 km upstream of the barrage (Alexander et al.,1935). This recovery was predicted from the early 1990sonwards. Fucoid explants made to various sites withinthe estuary over the period 1992–1998 survived at sites a lit-tle upstream of the particular fucoid limit one or two yearsbefore the natural colonisation occurred at each site. How-ever fucoids remained absent in 1996 from a short reach ofthe lower estuary immediately downstream of the Wiltonoutfall, a large canalised industrial outfall into which muchof the effluent formerly entering the mid estuary had beenconcentrated, although they had otherwise penetrated toseveral km upstream of this site by 1993. (This means thatthere is a Zone C reach in the Zone B so that the Teeswould be classified as moderate.) Fucoid explants to theshores just downstream of this large combined outfall did
not survive and this was correlated with the water qualitythere.
In the South Esk estuary at Montrose, Scotland,absence of fucoids due to sand scour rather than pollutinginfluence from adjacent crude sewage and pharmaceuticaloutfalls was verified using fucoid explants, so demonstrat-ing the utility of this tool for ascertaining non-anthropo-genic causes of fucoid absence. Further examples of thepossible uses of this additional investigative tool are givenin Wilkinson et al. (1995b) and the protocol for this addi-tional tool is thoroughly investigated in Telfer (1995). Thisinvestigative tool is not part of the tool for the WFD basedon the fucoid penetration extent in an estuary but is anadditional possible future development which might movemore towards looking at the possibility for communitychange rather than just the static state at one moment intime.
4. Concluding comment
This paper has shown that there are problems in devis-ing tools that will work for ecological quality assessmentin the mid and upper reaches of estuaries based on speciescomposition of the macroalgal flora. The fucoid extent toolsuggested here is a very simple qualitative tool which sepa-rates out rather gross categories of estuarine quality. Prob-lems in devising anything more sophisticated are the lack ofprevious quantitative data on macroalgae in estuaries thatwould enable long-term changes in communities to beassessed and the existence of comparative indices of bothquality and salinity for many of the estuaries investigated.
The lack of quantitative data was pointed out by Mid-dleboe and Sand-Jensen (2000) who attempted to assesslong-term changes in the macroalgae of a Danish estuary(Isefjord/Roskildefjord) that had suffered from nutrientenrichment and reduced light penetration over about 50years from the early 1940s. They did not find large changesin species present but did find that relative abundances hadchanged as had the morphological types of macroalgaepresent. As might be expected the abundances of thoseforms which respond to nutrient enrichment (macroalgalblooming species) had increased at the expense of perennialforms such as fucoids. However inspection of their specieslists suggests that they are dealing with what would beequivalent to the outer part of Zone B in British estuariesand which we might assess with a version of the coastalmacroalgal tools rather than with an estuarine tool. Thesalinities at their sites are lower (c.23) than we would expectwith similar species lists in Britain, but this is probably areflection of the more stable salinity in their estuary whichdischarges into the relatively tideless outer Baltic Sea andpermits marine species to survive at lower salinities (denHartog, 1967). Therefore their findings are not directlyapplicable to British estuaries.
Some examples of estuarine recovery may not involvefucoid recolonisation. Hawkins et al. (1999) studied therecolonisation of the Mersey Docks after becoming

M. Wilkinson et al. / Marine Pollution Bulletin 55 (2007) 136–150 149
disused. There was an increase in species richness whichcoincided with pollution reduction, decreased turbidity,and lack of disturbance. This allowed various red andbrown algae to recolonise though not, in this case, well-developed fucoids. However, the closed environment of adock, no matter how saline, may not be comparable withan open shore.
There can also be a decline over time in estuarine com-munities due to natural changes in factors that might beconnected with the normal growth processes of an estuary.Russell et al. (1999) have recorded the loss of various spe-cies and particularly the loss of a sublittoral community atHilbre Island just inside the Cheshire Dee estuary betweenthe late 19th and late 20th Centuries. This could be corre-lated with an increase in turbidity with extensive seawardspread of salt marsh due to Spartina colonisation. All threeof these examples illustrate the effect of turbidity in bring-ing about community changes, but also illustrate that thesecan be an improvement or decline of species richness,depending on the change in turbidity, and can be anthropo-genic or natural.
Another factor that might be thought to interfere withthis tool could be climate change. This could work in twoways. Increased water temperatures could affect the geo-graphic distribution of the species of algae being usedand rising sea level could affect the hydrography, particu-larly the extent of salinity penetration, of the estuaries. Thistool is being proposed for estuaries in the British Isleswhich are firmly in the centre of the geographic distributionrange of the fucoid species which penetrate estuaries (Lun-ing, 1990). The fucoids at their southern limit in Britain, F.
distichus, which may be indicators of climate change incoastal waters, do not penetrate estuaries. FurthermoreWilkinson et al. (1995a) have commented on the wide-spread geographical nature of the estuarine algal distribu-tion pattern in the north Atlantic so it seems unlikelythat this tool being developed primarily for use in the Brit-ish Isles will be subject to amendment by climate change.Also it was earlier pointed out that the estuarine algal com-munity was particularly hardy since it withstands largefluctuations in environmental conditions. While small aver-age changes in water temperature might be expected tohave some effects on the composition of open coastal com-munities, this is less likely for the very hardy estuarineflora.
Much scientific literature which appears to deal in detailwith algal changes in estuaries in community composition,or in ecosystem processes such as primary production,often turns out to be dealing with the marine environmentjust inside the mouths of the estuaries. This proposed toolby contrast attempts to cover the whole estuary and con-centrates on the mid and upper reaches which are not wellstudied for macroalgae in the scientific literature.
This tool has only been suggested based on estuaries inthe British Isles and may not cover larger European estuar-ies with large freshwater tidal reaches e.g. Rhine, withoutfurther investigation. The tool is still under development
and further work will be directed at seeking to separatethe good and high classes and considering more practicaldetails of the application of the tool such as how it canbe applied to a wider range of transitional waters such asfjordic sealochs. When this has been done a precise proto-col for its application will be published.
Acknowledgements
We thank the Countryside Council for Wales for sup-plying some of the fucoid presence data in Table 1 andthe Environmental Protection Agency of the Republic ofIreland for funding surveys of some of the Irish estuaries.
References
Alexander, W.B., Southgate, B.A., Bassindale, R. 1935. Survey of the riverTees. Part II. The estuary – chemical and biological. Water PollutionResearch Technical Paper number 5, Department of Scientific andIndustrial Research, His Majesty’s Stationery Office, London.
Back, S., Collins, J.C., Russell, G., 1992. Recruitment of the Baltic flora:the Fucus ceranoides enigma. Botanica Marina 35, 53–59.
Barreiro, R., Real, C., Carballeira, A., 1993. Heavy-metal accumulationby Fucus ceranoides in a small estuary in north-west Spain. MarineEnvironmental Research 36, 39–61.
Borja, A., Franco, J., Valencia, V., Bald, J., Muxika, I., Belzunce, M.J.,Solaun, O., 2004. Implementation of the European water frameworkdirective from the Basque country (northern Spain): a methodologicalapproach. Marine Pollution Bulletin 48, 209–218.
Brawley, S.H., 1992. Fertilization in natural populations of the dioeciousbrown alga Fucus ceranoides and the importance of the polyspermyblock. Marine Biology 113, 145–157.
Burrows, E.M., 1964. Ecological experiments with species of Fucus.Proceedings of the International Seaweed Symposium 4, 166–170.
Chater, E.H., 1927. On the distribution of larger brown algae inAberdeenshire estuaries. Transactions and Proceedings of the Botan-ical Society of Edinburgh 29, 362–380.
Connell, J.H., 1978. Diversity in tropical rain forests and coral reefs.Science 199, 1302–1310.
Cotton, A.D., 1912. Marine Algae. In: Praeger, R.L. (Ed.), A biologicalsurvey of Clare Island in the County of Mayo, Ireland, and of theadjoining district. Proceedings of the Royal Irish Academy 31 (15), 1–178.
Cox, E.J., 1977. The distribution of tube-dwelling diatom species in theSevern estuary. Journal of the Marine Biological Association of theUnited Kingdom 57, 19–27.
de Jonge, V.N., Elliott, M., Brauer, V.S., 2006. Marine monitoring: itsshortcomings and mismatch with the EU Water Framework Direc-tive’s objectives. Marine Pollution Bulletin 53, 5–19.
den Hartog, C., 1960. Comments on the Venice System for theclassification of brackish waters. Internationale Revue der GesamtenHydrobiologie 45, 481–485.
den Hartog, C., 1967. Brackish water as an environment for algae. Blumea15, 31–43.
Edwards, P., 1972. Benthic algae in polluted estuaries. Marine PollutionBulletin 3, 55–60.
Gillham, M.E., 1957. Vegetation of the Exe estuary in relation to watersalinity. Journal of Ecology 45, 735–756.
Hammerton, D., Newton, A.J., Allcock, R., 1980. Determination ofmarine consent conditions. Effluent and Water Treatment Journal 11,215–223.
Hardy, F.G., Evans, S.M., Tremayne, M.A., 1993. Long-term changes inthe marine macroalgae of three polluted estuaries in north-eastEngland. Journal of Experimental Marine Biology & Ecology 172,81–92.

150 M. Wilkinson et al. / Marine Pollution Bulletin 55 (2007) 136–150
Hawkins, S.J., Allen, J.R., Fielding, N.J., Wilkinson, S.B., Wallace, I.D.,1999. Liverpool Bay and the estuaries: human impact, recent recoveryand restoration. In: Greenwood, E.F. (Ed.), Ecology and LandscapeDevelopment: A History of the Mersey Basin. Liverpool UniversityPress for National Museums and Galleries on Merseyside, Liverpool,pp. 155–165.
Khfaji, A.K., Norton, T.A., 1979. The effects of salinity on thedistribution of Fucus ceranoides. Estuarine and Coastal Marine Science8, 433–439.
Lein, T.E., 1984. Distribution, reproduction and ecology of Fucus
ceranoides L. (Phaeophyceae) in Norway. Sarsia 69, 75–81.Lein, A., Rueness, J., Wiik, O.O., 1974. Algologische observasjoner I
Iddefjorden og Singlefjorden. Blyttia 32, 155–168.Lindgren, L., 1965. Coastal algae off Goteborg in relation to gradients of
salinity and pollution. Acta Phytogeographica Suecica 50, 92–96.Luning, K., 1990. Seaweeds: Their Environment, Biogeography and
Ecophysiology. Wiley, London, 540pp.McLusky, D.S., Elliott, M., 2004. The Estuarine Ecosystem: Ecol-
ogy, Threats and Management. Oxford University Press, Oxford, 226pp.Middleboe, A.L., Sand-Jensen, K., 2000. Long-term changes in macro-
algal communities in a Danish estuary. Phycologia 39, 245–257.Orfanidis, S., Panayotidis, P., Stamatis, M., 2001. Ecological evaluation of
transitional and coastal waters: a marine benthic macrophytes-basedmodel. Mediterranean Marine Science 2, 45–65.
Orfanidis, S., Panayotidis, P., Stamatis, M., 2003. An insight into theecological evaluation index. Ecological Indicators 3, 27–33.
Panayotidis, P., Montesanto, B., Orfanidis, S., 2004. Use of low budgetmonitoring of macroalgae to implement the European Water Frame-work Directive. Journal of Applied Phycology 16, 49–59.
Pekkari, S., 1973. Effects of sewage water on benthic vegetation. Oikos 15(Suppl.), 185–188.
Rendall, D.A., Wilkinson, M., 1983. The seasonal and spatial distributionof attached Melosira species in the upper Clyde estuary, Scotland.Botanica Marina 26, 249–253.
Russell, G., Jemmett, A.W.L., Wilkinson, S.B., 1999. Marine algae:diversity and habitat exploitation. In: Greenwood, E.F. (Ed.), Ecologyand Landscape Development: A History of the Mersey Basin.Liverpool University Press for National Museums and Galleries onMerseyside, Liverpool, pp. 177–184.
Scanlan, C.M., Foden, J., Wells, E., Best, M.A. this volume. Themonitoring of opportunistic macroalgal blooms for the WaterFramework Directive. Marine Pollution Bulletin, doi:10.1016/j.marpolbul.2006.09.017.
Snelgrove, J.M., Wilkinson, M., 1998. Predicting incipient changes inpollution-damaged estuarine floras using in-situ seaweed bioassays. In:Scott, G.W., Tittley, I. (Eds.), Changes in the Marine Flora of theNorth Sea. Centre for Environmental Research into Coastal Issues,Scarborough, p. 51.
South, G.R., Tittley, I. 1986. A Check-list and distributional index of thebenthic marine algae of the North Atlantic Ocean. Huntsman MarineLaboratory and British Museum (Natural History), St. Andrews (NewBrunswick) and London.
Suryono, C.A., Hardy, F.G., 1997. Studies on the distribution of Fucus
ceranoides L. (Phaeophyta, Fucales) in estuaries on the north-eastcoast of England. Transactions of the Natural History Society ofNorthumbria 57, 153–168.
Telfer, T.C., 1995. Use of seaweed field bioassays in the assessment ofmarine environmental quality. Ph.D. Thesis, Department of BiologicalSciences, Heriot-Watt University.
Tittley, I., 2001. Changes in the marine algal flora of the tidal Thames: amillennium review. London Naturalist 80, 135–146.
Tittley, I., John, D.M., 1998. The algae of the Thames estuary: areappraisal. In: Attrill, M.J. (Ed.), A Rehabilitated Estuarine Ecosys-tem. Kluwer, London, pp. 49–65.
Tittley, I., Price, J.H., 1977. The marine algae of the tidal Thames.London Naturalist 56, 10–17.
Vincent, C., Heinrich, H., Edwards, A., Nygaard, K., Haythornthwaite, J.2002. Guidance on typology, reference conditions and classification
systems for transitional and coastal waters. Produced by CIS WorkingGroup 2.4 (Coast). Common Implementation Strategy of the WaterFramework Directive, European Commission, 119pp.
Wells, E., Wood, P., Wilkinson, M., Scanlan, C., this volume. The use ofmacroalgae species richness and composition on intertidal rockyseashores in the assessment of ecological quality under the EuropeanWater Framework Directive. Marine Pollution Bulletin, doi:10.1016/j.marpolbul.2006.08.031.
Wilkinson, M., 1973a. A preliminary survey of the intertidal benthic algaeof the Clyde estuary. Western Naturalist 2, 59–69.
Wilkinson, M., 1973b. Distributions of attached algae in estuaries withparticular reference to the River Wear. Vasculum 50, 22–28.
Wilkinson, M., 1975. Intertidal algae of some estuaries in Galloway.Western Naturalist 4, 42–50.
Wilkinson, M., 1980. Benthic estuarine algae and their environment: areview. In: Price, J.H., Irvine, D.E.G., Farnham, W.F. (Eds.), TheShore Environment: Methods and Ecosystems, vol 2. Academic Press,London, pp. 425–486.
Wilkinson, M., 1981. Survival strategies of attached algae in estuaries. In:Jones, N.V., Wolff, W.J. (Eds.), Feeding and Survival Strategies ofEstuarine Organisms. Plenum Publishing Company, New York, pp.29–38.
Wilkinson, M., Rendall, D.A., 1985. The role of benthic algae in estuarinepollution assessment. In: Wilson, J., Halcrow, W. (Eds.), EstuarineManagement and Quality Assessment. Plenum Publishing Company,New York, pp. 71–81.
Wilkinson, M., Roberts, C., 1974. Intertidal algae of the estuary of theRiver Add, Argyllshire. Western Naturalist 3, 73–82.
Wilkinson, M., Slater, E.M., 1997. Estuarine algal communities in twosubestuaries of the Forth with different water quality. BotanicalJournal of Scotland 49, 387–396.
Wilkinson, M., Telfer, T.C., 2000. Attached intertidal macroalgae of theHumber estuary and changes consequent upon reduction of severeindustrial pollution. Coastal Zone Topics 4, 61–65.
Wilkinson, M., Wood, P. 2003. Type-specific reference conditions formacroalgae and angiosperms in Scottish transitional and coastalwaters. Report to Scottish Environment Protection Agency fromSchool of Life Sciences, Heriot-Watt University, Edinburgh. SEPAProject Ref 230/4136. 200pp.
Wilkinson, M., Henderson, A.R., Wilkinson, C., 1976. Distributionof attached algae in estuaries. Marine Pollution Bulletin 10, 183–184.
Wilkinson, M., Macleod, L., Fuller, I., 1980. A first account of estuarinealgae under combined conditions of very low pH and metal enrich-ment. Botanica Marina 23, 475–477.
Wilkinson, M., Hickman, C., Moore, C.G., 1983. Intertidal algalcommunities of British estuaries. EBSA Bulletin 36, 21.
Wilkinson, M., Fuller, I., Rendall, D.A., 1986. The attached algae of theClyde and Garnock estuaries. Proceedings of the Royal Society ofEdinburgh 90B, 143–150.
Wilkinson, M., Scanlan, C.M., Tittley, I., 1987. The attached algal flora ofthe estuary and Firth of Forth. Proceedings of the Royal Society ofEdinburgh 93B, 343–354.
Wilkinson, M., Telfer, T.C., Grundy, S., 1995a. Geographical variationsin the distribution of macroalgae in estuaries. Netherlands Journal ofAquatic Ecology 29, 359–368.
Wilkinson, M., Telfer, T.C., Cruz, R., Conroy-Dalton, S., Cunningham,E., Grundy, S., 1995b. The utility of field transplants of seaweeds inthe study of polluted estuaries. In: Dyer, K.R., Orth, R.J. (Eds.),Changes in Fluxes in Estuaries: from Science to Management. Olsen &Olsen, Fredensborg, pp. 257–260.
Wilson, J.G., 1980. Heavy metals in the estuarine macrofauna of the eastcoast of Ireland. Journal of Life Sciences of the Royal Dublin Society1, 183–189.
Wilson, J.G., 2003. Evaluation of estuarine quality status at system levelusing the biological quality index and the pollution load index. Biologyand Environment: Proceedings of the Royal Irish Academy 103B (2),49–57.