Embed Size (px)
Citation preview

Using Authentic Discovery Projects to Improve Student Outcomes in
StatisticsJoint Mathematics Meetings
January 16, 2010
Dianna SpenceBrad BaileyRobb Sinn
Department of Mathematics & Computer ScienceNorth Georgia College & State University
Dahlonega, Georgia
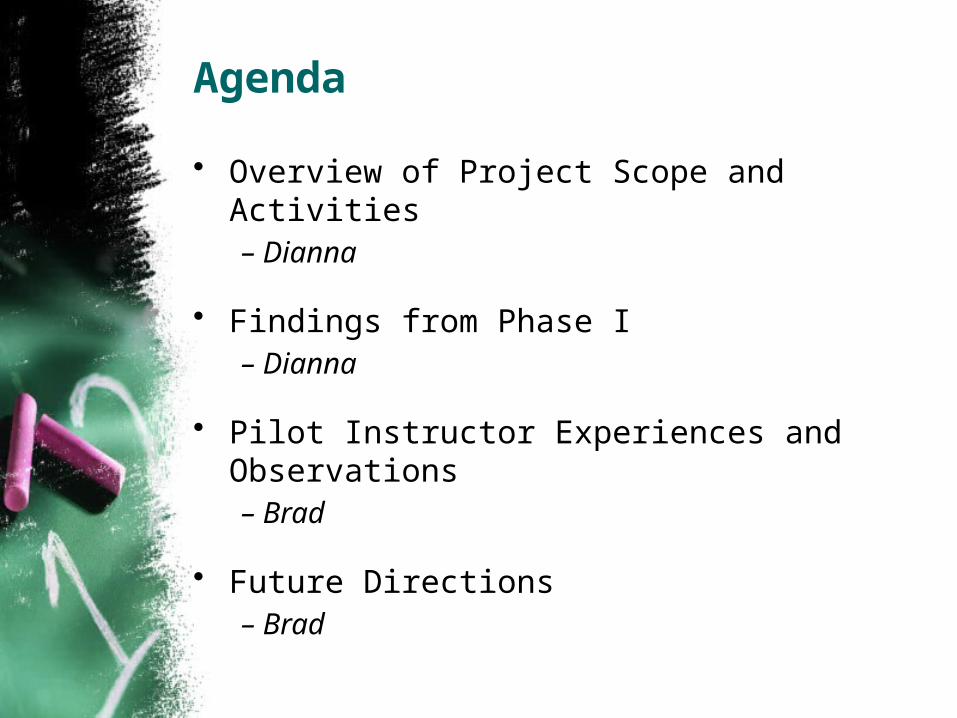
Agenda
• Overview of Project Scope and Activities – Dianna
• Findings from Phase I – Dianna
• Pilot Instructor Experiences and Observations – Brad
• Future Directions– Brad
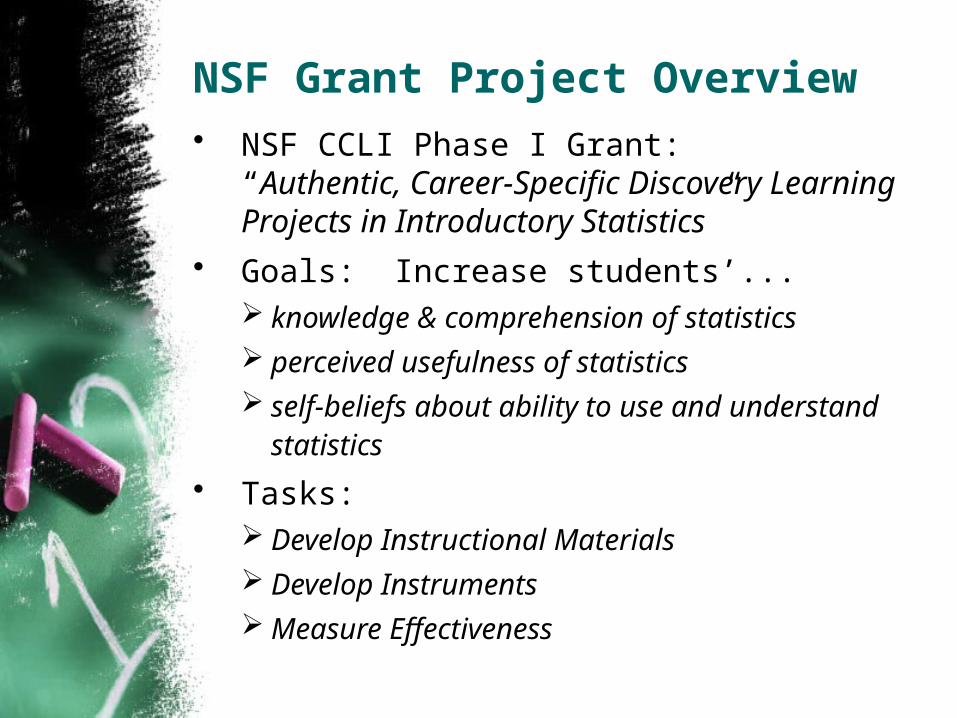
NSF Grant Project Overview• NSF CCLI Phase I Grant:
“Authentic, Career-Specific Discovery Learning Projects in Introductory Statistics”
• Goals: Increase students’... knowledge & comprehension of statistics perceived usefulness of statistics self-beliefs about ability to use and understand
statistics
• Tasks: Develop Instructional Materials Develop Instruments Measure Effectiveness
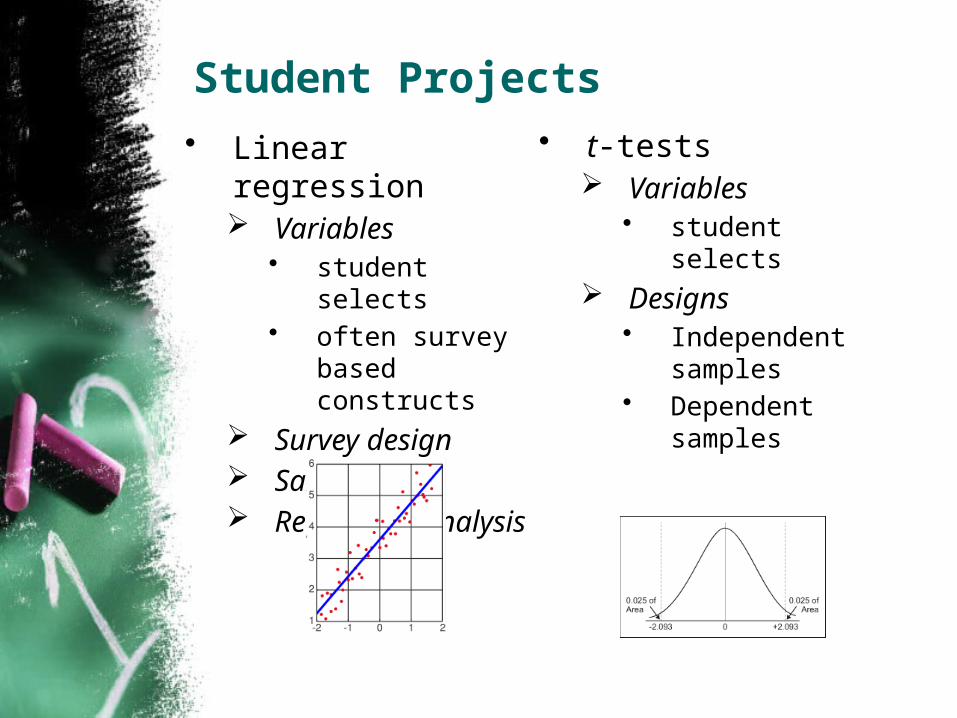
Student Projects• Linear regression
Variables• student selects• often survey
based constructs Survey design Sampling Regression analysis
• t-tests Variables
• student selects Designs
• Independent samples
• Dependent samples

Materials Developed(Web-Based)
• Instructor GuideProject overview
• Timelines• Best practices
Student handoutsEvaluation rubrics
• Student GuideProject Guide
• Help for each project phase
Technology GuideVariables and
Constructs

Instruments Developed: Content Knowledge
• Instrument 21 multiple choice items KR-20 analysis: score = 0.63
• Exploratory Results treatment group significantly higher (p < .0001) effect size = 0.59
• Instrument shortened to 18 items for main pilot

Instruments Developed: Perceived Usefulness of Statistics
• Instrument 12-item Likert style survey; 6-point scale Cronbach alpha = 0.93
• Exploratory Results treatment group significantly higher (p < .01) effect size = 0.295
• Instrument unchanged for main pilot
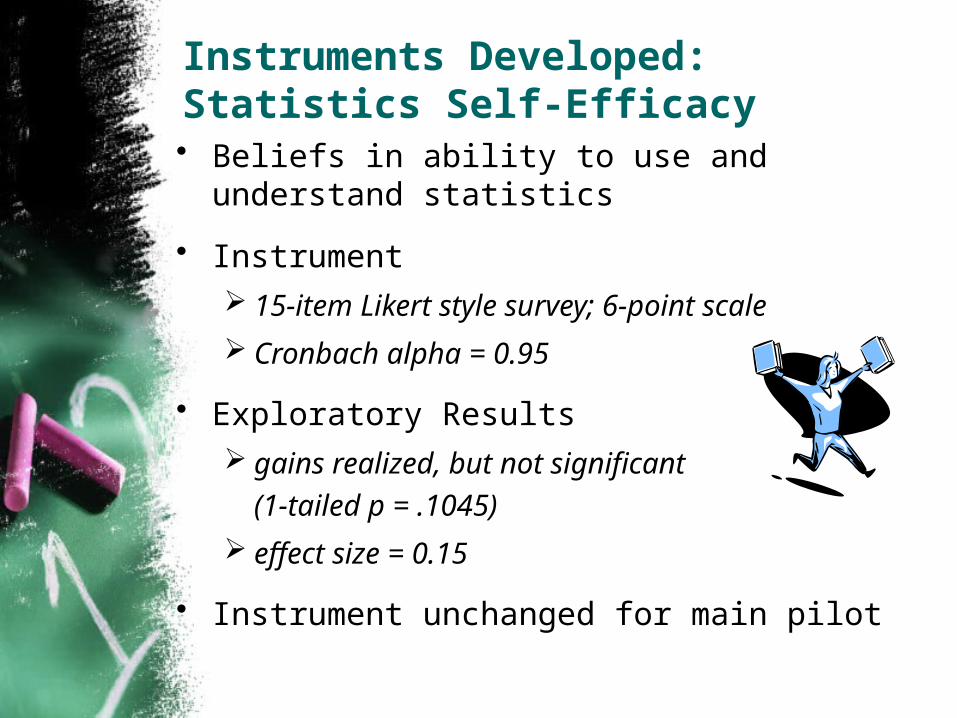
Instruments Developed: Statistics Self-Efficacy• Beliefs in ability to use and understand statistics
• Instrument 15-item Likert style survey; 6-point scale
Cronbach alpha = 0.95
• Exploratory Results gains realized, but not significant
(1-tailed p = .1045)
effect size = 0.15
• Instrument unchanged for main pilot
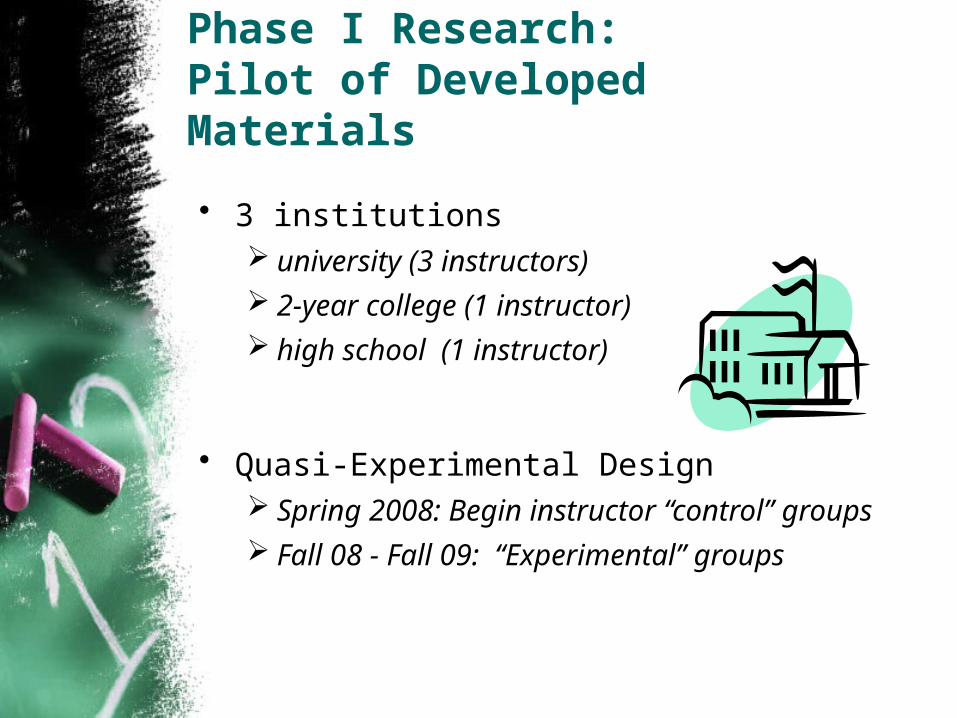
Phase I Research:Pilot of Developed Materials
• 3 institutions university (3 instructors) 2-year college (1 instructor) high school (1 instructor)
• Quasi-Experimental Design Spring 2008: Begin instructor “control” groups Fall 08 - Fall 09: “Experimental” groups

Results: t-Tests• Perceived Usefulness
Pretest: 50.42Posttest: 51.40Significance: p = 0.208
• Self-Efficacy for StatisticsPretest: 59.64Posttest: 62.57Significance: p = 0.032**
• Content KnowledgePretest: 6.78Posttest: 7.21Significance: p = 0.088*

Subscales: Statistics Self-Efficacy
• Strong Gains
SE for Regression Techniques ( p = 0.035 )
SE for General Statistical Tasks ( p = 0.018 )
• Little or No Improvement
SE for t-test Techniques ( p = 0.308 )

Subscales: Content Knowledge
• Regression Techniques
Moderate Gains ( p = 0.086 )
• T-test Usage
Moderate Gains ( p = 0.097 )
• T-test Inference
No Gain

Multivariate Analysis: Content Knowledge

Multivariate Analysis: Statistics Self-Efficacy
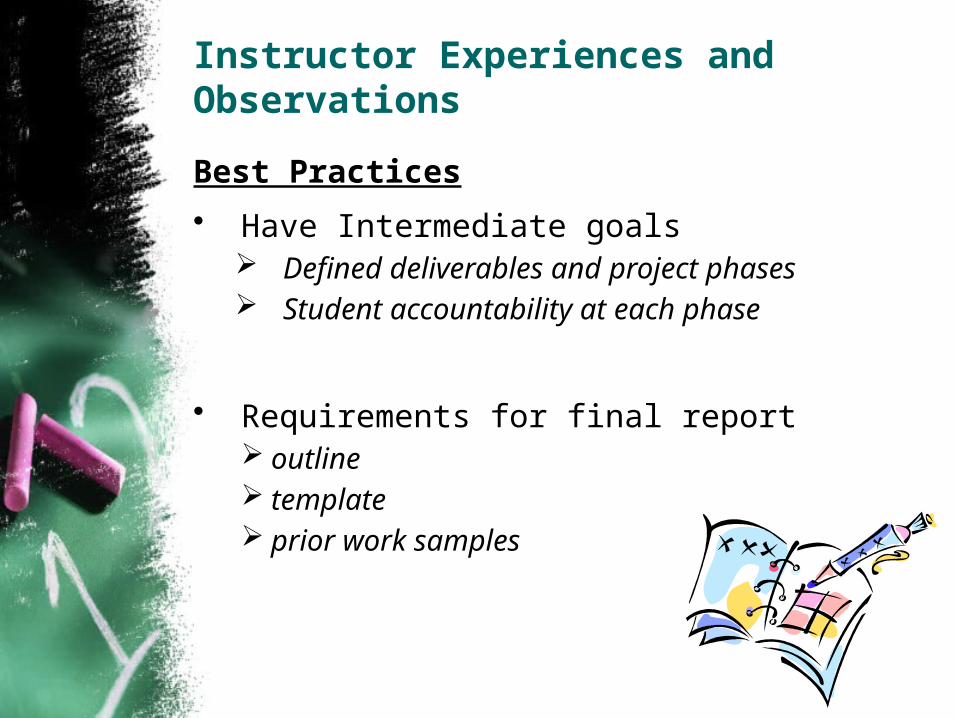
Instructor Experiences and Observations
Best Practices
• Have Intermediate goals Defined deliverables and project phases Student accountability at each phase
• Requirements for final report outline template prior work samples

Instructor Experiences and Observations
• Students need guidance with research question
• Set Student Expectations Students underestimate time/effort required Students often unclear on exactly what to do once
they have collected the data Students should be prepared for results that may be
weak, non-significant, etc.• realistic view of statistics• avoid too much disappointment
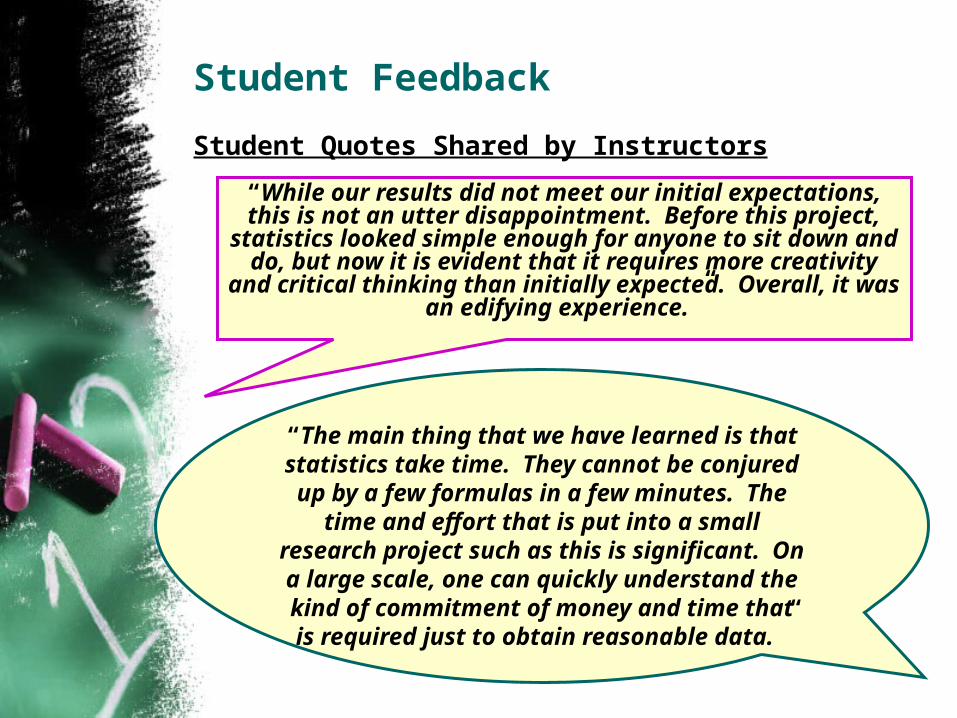
Student Feedback
Student Quotes Shared by Instructors
“The main thing that we have learned is that statistics take time. They cannot be conjured up by a few formulas in a few minutes. The
time and effort that is put into a small research project such as this is significant.
On a large scale, one can quickly understand the kind of commitment of money and time that is required just to obtain reasonable
data.”
“While our results did not meet our initial expectations, this is not an utter disappointment. Before this project, statistics looked simple enough for anyone to sit down
and do, but now it is evident that it requires more creativity and critical thinking than initially expected. Overall, it was
an edifying experience.”
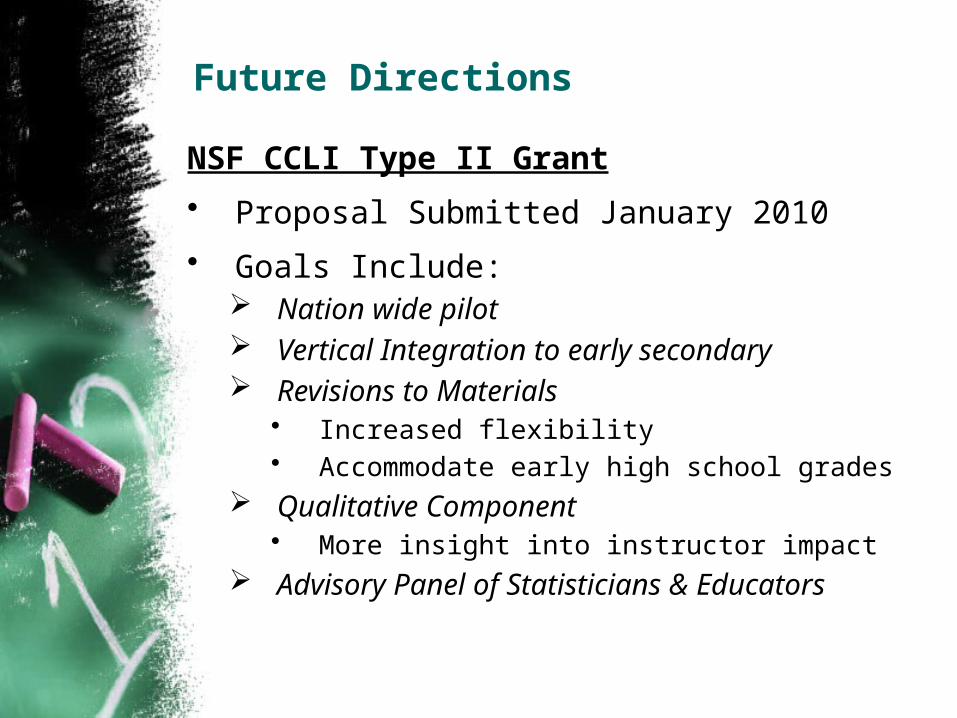
Future Directions
NSF CCLI Type II Grant
• Proposal Submitted January 2010
• Goals Include: Nation wide pilot Vertical Integration to early secondary Revisions to Materials
• Increased flexibility• Accommodate early high school grades
Qualitative Component• More insight into instructor impact
Advisory Panel of Statisticians & Educators
For more information
• Project Website http://radar. northgeorgia.edu/~djspence/nsf/
• Instructional Materials Home http://radar.northgeorgia.edu/~rsinn/nsf/
• Contact Us Dianna: [email protected] Brad: [email protected] Robb: [email protected]