Embed Size (px)
Citation preview
Transport Research Laboratory
Using behavioural measures to evaluate route safety schemes: detailed guidance
for practitioners
by S Helman, H A Ward, N Christie, F P McKenna *
PPR548
PROJECT REPORT
* The order of authorship was determined randomly. All four authors worked together and contributed in equal measure to the content of this report, and to its recommendations.
Project Report
TRL PPR548
Transport Research Laboratory
PROJECT REPORT PPR548
Using behavioural measures to evaluate route safety schemes: detailed guidance for practitioners
by S Helman, H A Ward, N Christie, F P McKenna *
Prepared for: Project Record: Route Safety Behavioural Evaluation Stage 2
Client: ADEPT
Rob Salmon
Copyright Transport Research Laboratory March 2011
This report has been prepared for ADEPT.
The views expressed are those of the author(s) and not necessarily those of ADEPT.
* The order of authorship was determined randomly. All four authors worked together and contributed in equal measure to the content of this report, and to its recommendations.
Name Date
Approved
Project Manager
Shaun Helman 10/03/2011
Technical Referee
Lorna Pearce 10/03/2011

Project Report
TRL PPR548
When purchased in hard copy, this publication is printed on paper that is FSC (Forestry Stewardship Council) and TCF (Totally Chlorine Free) registered.
Contents Amendment Record This report has been issued and amended as follows
Version Date Description Editor Technical Referee
0.1 10/09/10 Final Draft SH LP
1.0 11/10/10 Final Report SH LP
1.1 26/10/10 Final report issue 2 SH LP
1.2 25/11/10 Final report issue 3 SH LP
1.3 10/03/2011 Final report issue 4 SH LP


Project Report
TRL i PPR548
Contents
Executive summary 3
The need for evaluation and the case for examining road user behaviour 3
Which behaviours can be measured? 3
The design of evaluations 5
Good practice examples 5
Conclusions 5
Abstract 6
1 Introduction 7
2 The need for evaluation and the case for examining road user behaviour 9
2.1 The need for evaluation 9
2.2 Possible reasons for reluctance to evaluate 10
2.3 The case for using behaviour in evaluations 11
2.4 From accidents to behaviours to attitudes 12
3 Which behaviours and attitudes should we measure, and how can we measure them? 13
3.1 What types of behaviour are there? 13
3.2 Dynamic vehicle behaviours 14 3.2.1 Spot speed – evidence 15 3.2.2 Spot speed – measurement 15 3.2.3 Speed profiles – evidence 16 3.2.4 Speed profiles – measurement 16 3.2.5 Following distance – evidence 17 3.2.6 Following distance – measurement 17 3.2.7 Driving violations – evidence 17 3.2.8 Driving violations – measurement 17 3.2.9 Overtaking – evidence 17 3.2.10 Overtaking – measurement 17 3.2.11 Gap acceptance – evidence 18 3.2.12 Gap acceptance – measurement 18 3.2.13 Lateral position – evidence 18 3.2.14 Lateral position – measurement 18
3.3 Dynamic person behaviours 19 3.3.1 Distraction, including mobile phone use – evidence 19 3.3.2 Distraction, including mobile phone use – measurement 19 3.3.3 Seat belt wearing – evidence 19 3.3.4 Seat belt wearing – measurement 19 3.3.5 Fatigue – evidence 20 3.3.6 Fatigue – measurement 20 3.3.7 Impairment due to alcohol or drugs – evidence 20 3.3.8 Impairment due to alcohol or drugs – measurement 21 3.3.9 Uninsured and unlicensed driving – evidence 21 3.3.10 Uninsured and unlicensed driving – measurement 21
3.4 Attitudinal variables 21 3.4.1 The case for measuring attitudes and behaviours 21

Project Report
TRL ii PPR548
3.4.2 Using questionnaires to measure attitudes and self-reported behaviours 22
3.4.3 Other uses for surveys and questionnaires measuring attitudes and self-reported behaviours in route safety evaluation 24
3.5 Demographic variables 25
4 The design of the evaluation 26
4.1 Identifying target road user groups 27
4.2 Asking the right questions 27
4.3 Sample size 28
4.4 Controls and background trends 30 4.4.1 Comparison groups and routes 30 4.4.2 Background trends 31
4.5 How to assess whether the route safety scheme (or interventions within it) has been successful 32
4.6 Evaluating the effect of the intervention among different road user groups 33
5 Examples of good practice 34
5.1 Case study 1: Devon’s Country mile rural safety project 2008–2012 34 5.1.1 General background 34 5.1.2 Understanding the road users 35 5.1.3 Use of other evaluation design principles 36 5.1.4 Specifics of the attitudinal evaluation - methodology 36 5.1.5 Specifics related to the use of PVR (per vehicle recording)
data on the A361 37 5.1.6 Specifics of the bend-treatment study on the A377 38
5.2 Case study 2: The Cat and Fiddle: Cheshire’s Road Safety Partnership (CRSP) 40 5.2.1 General background 40 5.2.2 Proposed intervention approach 41 5.2.3 Monitoring Outputs 43 5.2.4 Assessing Outcomes 45 5.2.5 Capturing Learning 47 5.2.6 Using the findings 49
5.3 Other useful resources 51 5.3.1 DfT/RoSPA toolkit 51 5.3.2 DfT resources 51
6 Conclusions 52
References 53
Appendix A The Driver Attitudes Questionnaire (DAQ) 57
Appendix B The Driver Behaviour Questionnaire (DBQ) – violation items 60

Project Report
TRL 3 PPR548
Executive summary This report is intended as a resource which can be used by local authorities as guidance on the use of behavioural measures in the evaluation of route safety schemes.
There are various advantages to using behaviours as outcome evaluation metrics in route safety schemes. These include the length of time over which data can be collected being shorter than the three years normally used for the collection of accident data, and the fact that changes in behaviours targeted by route safety schemes can be used as an early warning system to check that the scheme is likely (or not) to have the desired impact on accidents over the long term.
In this report, the case for carrying out appropriate evaluation of route safety schemes is made. The behaviours that are known to be related to collision risk and should be measurable in route safety settings are identified, along with methods by which they can be measured. In addition, guidance on evaluation study design is given, including advice on sample sizes and the use of appropriate control groups. Finally, examples of good practice that illustrate some of the key points made in the report are given, and additional resources to help road safety professionals plan evaluations are referenced.
The need for evaluation and the case for examining road user behaviour
There has been a tendency in road safety to design interventions on the basis of enthusiastic intuition, rather than sound theory and evidence. The need for better intervention design and evaluation in road safety is now widely accepted by practitioners, and route safety schemes are no different. Route safety interventions need to be subjected to evaluation if we are to know which schemes work, and which ones do not. It is then possible to ensure that the money being spent on route safety approaches is spent wisely, by targeting those approaches that work, and avoiding those that are found wanting in terms of effectiveness.
Evaluation of route safety schemes using behavioural measures has several benefits when used in conjunction with accident statistics. Firstly behavioural outcome measures can be collected over much shorter timeframes than accident data, and therefore can provide an early warning that the scheme is (or is not) having its intended effects. Secondly if behavioural outcomes are shown to change in the ways intended when a route scheme is implemented, then this fact can be used to help interpret any longer term changes in accidents as being due to the intervention rather than due to other factors.
Which behaviours can be measured?
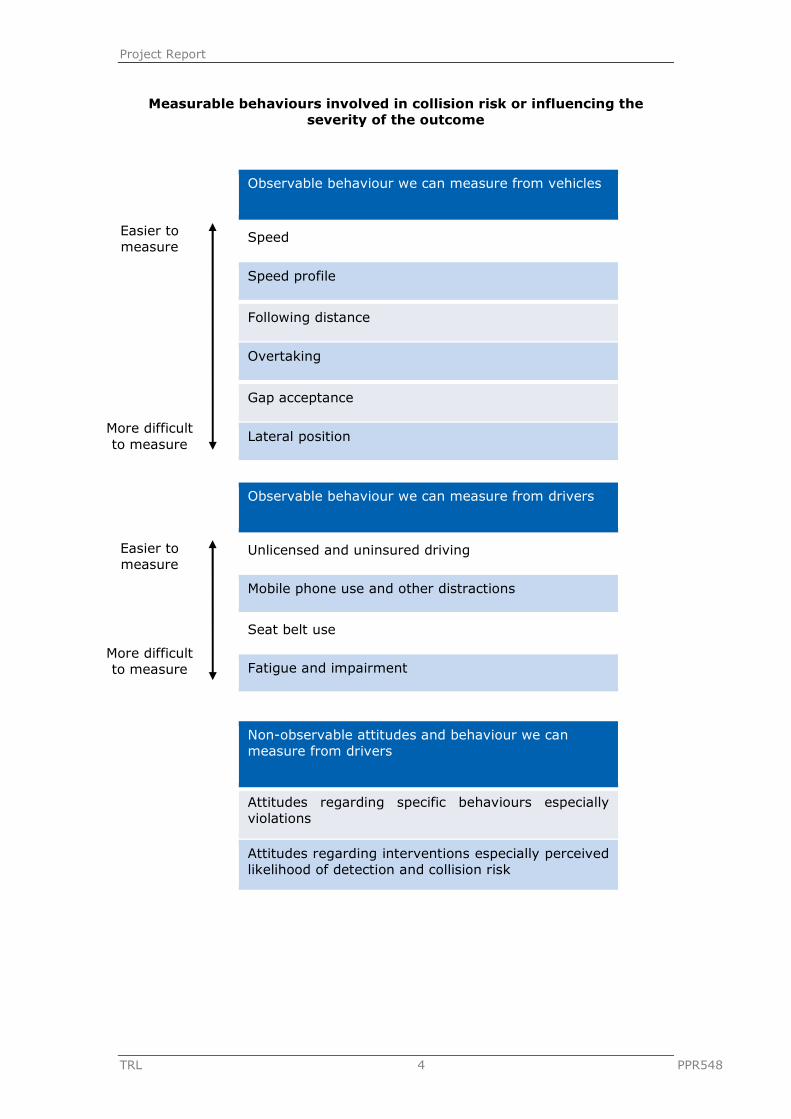
There are a number of behaviours that are either known or strongly suspected to be linked to collision risk. In this report, such behaviours are listed as candidate behavioural metrics for use in the evaluation of route safety schemes. The behaviours are split into a taxonomy based on whether they need to be measured by observing vehicles on the route in question, by observing drivers/road users on the route in question, or by talking directly to road users. The table on the following page lists these behaviours. In the report, the evidence linking these behaviours to collisions risk is briefly reviewed, and the methods by which they can be measured are outlined.
Project Report
TRL 4 PPR548
Measurable behaviours involved in collision risk or influencing the severity of the outcome
Observable behaviour we can measure from vehicles
Speed
Speed profile
Following distance
Overtaking
Gap acceptance
Lateral position
Observable behaviour we can measure from drivers
Unlicensed and uninsured driving
Mobile phone use and other distractions
Seat belt use
Fatigue and impairment
Non-observable attitudes and behaviour we can measure from drivers
Attitudes regarding specific behaviours especially violations
Attitudes regarding interventions especially perceived likelihood of detection and collision risk
Easier to measure
More difficult to measure
Easier to measure
More difficult to measure
Project Report
TRL 5 PPR548
The design of evaluations
There are a number of design principles that need to be followed if evaluation studies are to provide statistically and scientifically robust findings. These are:
1. understanding the types of people who use the routes so that these can be sampled appropriately;
2. asking the correct questions in an evaluation to define what a successful outcome will look like;
3. having an appropriate sample size for the measures being used; and
4. ensuring that appropriate control groups are used, or that background trends in the behaviours measures utilised (e.g. speed) are controlled for using statistical methods.
These principles are discussed.
Good practice examples
A number of good practice examples of route safety or route safety-like schemes that illustrate some of the principles explored in the report are described. External resources for further detail on evaluation are also given.
Conclusions
It is concluded that evaluation of the effectiveness of route safety schemes is crucial, and that the use of behavioural measures in such evaluation will bring considerable benefits. This report, and the accompanying short guidance document that summarises its contents, should be used as a starting point for understanding how to achieve robust evaluation of route safety schemes.
Project Report
TRL 6 PPR548
Abstract There are various advantages to using behaviours as outcome evaluation metrics in route safety schemes. These include the length of time over which data can be collected being shorter than the three years normally used for the collection of accident data, and the fact that changes in behaviours targeted by route safety schemes can be used as an early warning system to check that the scheme is likely (or not) to have the desired impact on accidents over the long term.
In this report, the case for carrying out appropriate evaluation of route safety schemes is made. The behaviours that are known to be related to collision risk and should be measurable in route safety settings are identified, along with methods by which they can be measured. In addition guidance on evaluation study design is given, including advice on sample sizes and the use of appropriate comparison groups and routes. Finally, examples of good practice that illustrate some of the key points made in the report are given, and additional resources to help road safety professionals plan evaluations are referenced.
Project Report
TRL 7 PPR548
1 Introduction This report was prepared as a resource that can be used by local authorities to guide them in the use of behavioural measures in the evaluation of route safety schemes.
Following Lawton, Helman and Summersgill (2008) a ‘route’ in this context is defined as “…consisting of roads with broad consistency in terms of usage, traffic flow and other characteristics. Most…will be at least several if not many kilometres long and are likely to carry a good deal of through traffic along the route. However, there will also be routes that are shorter particularly on urban and semi-urban roads, some of which may have sections with mixed priority. Routes may contain major as well as minor junctions.” (Lawton et al., 2008, p39).
Route safety schemes, again following Lawton et al. (2008) are defined as consisting of “…package(s) of interventions to reduce accident risk and severity along a route. The aim is to treat accidents that are distributed along a route rather than clustered at a specific location. …treatments will tend to be low cost interventions (that) may involve any of the three ‘E’s (engineering, enforcement and educations) or a combination of them.” (Lawton et al., 2008, p39).
The primary aims of the report are to:
1. Identify a set of measurable behaviours that are relevant to the impact assessment of route safety schemes and programmes.
2. Determine the methods of evaluation that provide reliable, consistent and repeatable results for the changes in behaviours linked to route safety interventions.
3. Define the outputs by road user class, e.g. driver, rider, pedestrian, cyclist, including any sub-divisions appropriate for measurement of national road safety targets in the UK.
4. Produce national guidance on methods and good practice for evaluating future route safety schemes in respect of road user behaviours.
These aims are met through the following objectives:
1. Identification of the key behaviours that route safety schemes should focus on as part of evaluation.
2. Identification of:
a. specific methods for measuring these behaviours; and
b. general methodological issues to ensure good quality evaluation
3. A review of examples of best practice from local authorities.
4. Reporting of the above through a guidance document usable by local authorities, to be delivered alongside this report.
The remainder of this report is structured in the following way.
Section 2 introduces the rationale for why good evaluation is required in route safety approaches, just as it is needed in other road safety interventions. In addition, the case for measuring behavioural variables is considered.
Section 3 identifies a list of the top candidate behaviours that, based on the evidence linking them to collision risk, should be considered for use in route safety evaluations.
Section 4 considers some of the key issues related to the design of interventions, including how to define what ‘success’ will look like, how to control for extraneous

Project Report
TRL 8 PPR548
factors such as background trends in speeds, and what samples sizes are required to permit robust comparisons to be drawn.
Section 5 gives examples from some local authorities that illustrate some of the ‘best practice’ from previous sections, and lists some other resources.
Section 6 draws conclusions, and presents a set of recommendations in the form of high-level guidance for local authorities based on the previous sections of the report.
The guidance document that accompanies this report is available separately at the following web address:
http://www.adeptnet.org.uk/assets/userfiles/documents/000281.pdf.

Project Report
TRL 9 PPR548
2 The need for evaluation and the case for examining road user behaviour
In this section we consider why evaluation of road safety interventions is important, and some of the reasons why people are sometimes reluctant to evaluate. We then briefly discuss the reasoning behind using behavioural variables in evaluations.
2.1 The need for evaluation
It is quite clear that to reduce the number of road casualties we need road safety interventions that are effective, be they road engineering treatments, educational interventions, or route safety approaches that use multiple methods. How then do we know if our interventions will or do work?
In advance of designing and implementing the intervention we can examine the past evidence and if this supports the effectiveness of our chosen intervention we can be reasonably confident that it should produce a positive result. This method is often used in the preliminary stages of scheme design to assess the likely size of effect of the measure on casualties or road user behaviour or to help choose between possible options. We would still wish to ensure that we are designing the intervention in the same way that it has been employed in the past and that we are using the intervention in the same circumstances that have been employed in the past. Clearly if we change the intervention or change the conditions under which it is used then we would have less confidence that it will remain equally effective in our case and this would need to be assessed by using data from a well designed monitoring programme.
While it is generally acknowledged that practitioners act with the best of intentions it is increasingly apparent across a broad range of public health interventions that good intentions are not enough. Perhaps one of the most important arguments for having explicit demonstrations of effectiveness has been outlined by Chalmers (2001): “Because professionals sometimes do more harm than good when they intervene in the lives of other people, their policies and practices should be informed by rigorous, transparent, up-to-date evaluations.” (p22) The fact that it is possible to do more harm than good is sometimes a surprise but there are unfortunately a wide range of examples of this. For example, to reduce the risk of delinquency, young people were introduced to “Scared Straight” interventions in which they were provided first-hand experience of prison life. Unfortunately, these interventions were associated with an increase in offending (Petrosino et al. 2004).
We might consider another example; it did seem plausible that placing babies to sleep on their tummies was sensible advice since this is similar to the recovery position and might reducing choking. However, it has turned out that this has placed babies at increased risk of Sudden Infant Death syndrome (Wennegren et al. 1997). Perhaps closer to home, in reviewing driver education in schools Roberts et al. (2001) conclude that there is no evidence that driver education reduces crash involvement and “may lead to a modest but potentially important increase in the proportion of teenagers involved in traffic crashes”.
Sometimes practitioners rely on the overall plausibility of the intervention. Indeed Ezra Hauer (2007) argued that much of road safety is “rooted in opinion, intuition and folklore” (p1). Relying on general plausibility and opinion is not likely to provide a guarantee of success. Although evaluation is often discussed as if it were a separate, optional activity establishing whether interventions work, it is

Project Report
TRL 10 PPR548
surely neither optional nor separate from the key task of producing successful casualty reduction. A crucial general point being proposed in this report is that evidence and evaluation should be seen as a basis for providing an overall general understanding of transport issues and should not be considered as a separate activity.
Without evidence of effectiveness how can one determine whether to:
1) Continue the intervention or stop it? 2) Expand or reduce the intervention? 3) Modify or leave the intervention intact?
Evaluation is the mechanism by which we assess how effective the intervention has been in achieving the objectives of the route safety schemes which, by their nature, are complex and can involve more than one agency. This can lead to a multiplicity of objectives such as:
• a reduction in:
o the number of casualties o the number of people exceeding the speed limit o close following o the number of people using mobile phones while driving o the number of people overtaking
• an increase in:
o seat belt wearing or child restraint use o knowledge of road safety messages o community involvement
Evaluation gives us the evidence we need to enable us to detect unintended consequences that lead to increases in casualties or unwanted road user behaviours, thereby to learn from experience of what works and what doesn’t for designing and implementing future schemes and for assessing cost effectiveness of our current schemes.
2.2 Possible reasons for reluctance to evaluate
Two reasons might be offered to support a reluctance to evaluate.
One is that we might obtain an answer that we do not want to find. In other words we may find that the intervention either produces no result or perhaps through unintended consequences produces harm. Having invested time and resources to get the intervention in place this could be an embarrassment. As we will see later there are ways of providing an early warning that an intervention is not working as planned so this problem can actually be decreased by appropriate monitoring and evaluation. As we move further towards an evidence-informed policy making culture in road safety this problem will diminish. At its most stark the issue is whether it is in the public interest to know that an intervention is causing harm and can be modified or terminated, or instead is it preferable to remain in ignorance and continue the harm? (It might also be noted that there is often more information in failure than in success. It is often the case that success just confirms current understanding whereas failure can question that understanding.)
A second reason for a reluctance to evaluate may be that it is thought preferable to spend the money on more implementation. The argument here is that the money and resources spent on evaluation could have extended the reach of the intervention. Of course, it is possible to take a quite different view on this. Here
Project Report
TRL 11 PPR548
the question would be whether it is appropriate to fund an intervention if there is no evidence to support its use and no plan to demonstrate that it is effective or cost effective. Extending the reach of an intervention with unknown effectiveness would in the best case extend an effective intervention, but in the worst case it would increase the harm produced or have no effect and be a waste of money. Here the question is what should be the default position? Should the default position be that interventions can be implemented with no supporting evidence and no plan to provide supporting evidence? If this were the case then at the end of the project on what basis would one make the decision to extend, modify, or terminate the intervention? What is the case for introducing an intervention that has no supporting evidence and has no plans to produce a supporting evidence base? In medicine well intentioned but disastrous interventions such as thalidomide resulted in the requirement for interventions to be thoroughly evaluated. Given the public health consequences, should transport be considered any differently?
When the above issues are considered, it is the conclusion of this report that evidence obtained through reliable evaluation should be seen as essential, and can underpin the justification for route safety programmes and support bids for future funding.
2.3 The case for using behaviour in evaluations
Another important reason for evaluating, in addition to demonstrating that an intervention does work, is to establish why it works. There are a number of reasons why it is important to know the mechanism by which an intervention has its effect, in addition to actually demonstrating its effectiveness. One important reason is that if we know how the intervention works then we have an early warning system in place to determine if our intervention is not working as planned. Suppose an intervention is designed to reduce crash1 involvement by reducing speed. If speed was measured and found to be increasing rather than decreasing then we would have an early warning system in place and could change the intervention before that behaviour resulted in an increase in casualties. In addition, if we know the mechanism by which an intervention is going to have its effect (in our example, decreasing speed) then changes in the behaviour associated with that mechanism will permit us greater confidence in claiming that any reduction in collisions seen in the long term was due to our intervention, and not simply due to random fluctuations in the data.
In addition, if we know how an intervention works then there is the opportunity for improvement. By contrast, if we have no idea how an intervention works then we have no idea how to improve it.
As we move forward and gain success in reducing casualties then it will become increasingly difficult to employ casualties as the only measure of safety, unless we have time periods longer than three to five years in which to carry out monitoring. The reason is that as the number of casualties becomes low then this number becomes more subject to random variability and thus it is difficult to assess whether a change has taken place. With low numbers, from year to year the casualties may vary for reasons that appear random. Under these circumstances, what is needed is a measure that is more frequent than collision involvement yet is a predictor of collision involvement. In other words we need to consider the precursors of collisions. The precursors of collision involvement often involve behaviours which if absent would have prevented the accident. For
1 There are strongly held views for and against the use of terms such as ‘accident’, ‘collision’ and ‘crash’. For those interested in this debate we refer you to Davies and Pless (2001), Elvik and Vaa, (2004), and McKenna, (2007). For the present purpose we have chosen to use all these terms interchangeably.
Project Report
TRL 12 PPR548
example, excessive speed may have meant that a driver was unable to stop in time and collides with a pedestrian. If excessive speed was avoided then, in the same circumstances the driver may have been able to stop in time. In other words by understanding the key behaviours that predict collisions we can use these behaviours to:
1) Provide an early warning system to monitor the effectiveness of the intervention.
2) Inform the design of more effective interventions. 3) Lend credibility to interpreting any long term reductions in casualties. 4) Provide a supplementary method of assessing road safety. 5) Assess progress in achieving scheme objectives which may be broader
than casualty reduction (e.g. speed reduction to improve quality of life for local pedestrians).
2.4 From accidents to behaviours to attitudes
Following this same line of argument we might ask what are the precursors of behaviour and how may they help in our understanding of collision involvement. In considering the precursors of behaviour we might also consider attitudes and intentions since these have been linked to behaviour. So for example, we could consider intentions to speed and attitudes to speeding to help in our understanding of collision involvement and the interventions that might change collision involvement; in other words one argument for considering attitudes is that they are part of the causal chain that leads to behaviour and collision involvement. An additional argument for considering attitudes is that they may play an important part in the support for, or opposition to, an intervention. Consider, for example, the media attention that speed camera enforcement has received over the years. In British Columbia it has been noted that following lobbying by interest groups a speed camera enforcement program was terminated (Delaney et al., 2005). In circumstances in which an intervention may arouse a range of attitudes that may have consequences for the support of that intervention then it would be appropriate to sample these attitudes.
Project Report
TRL 13 PPR548
3 Which behaviours and attitudes should we measure, and how can we measure them?
It has been clear for some time that human factors and road user behaviour play an important role in accident involvement. The key questions that need to be answered are:
1. Which human factors / behaviours play a role? 2. What is the evidence relating them to collision risk? 3. How can we measure them?
In this chapter, we attempt to provide a concise set of answers to these questions. Importantly, we aim to include only human factors that are known (or very strongly suspected) to be related to accident risk. The intention is to focus practitioners’ attention (when designing interventions and when evaluating them) on behaviours that are most likely to lead to safety outcomes.
3.1 What types of behaviour are there?
From a practical perspective, it is first useful to consider how the various behaviours associated with driving can actually make themselves apparent, as this will begin to guide us in terms of how we will measure them. Here we distinguish between three important categories of behaviour, according to the sources and approach that we need to use to measure them. These are dynamic ‘vehicle behaviours’, dynamic ‘people behaviours’, and ‘attitudinal’ variables. Put simply, we can observe things about vehicles (e.g. speed), or we can observe things about people (e.g. drivers not wearing seat belts); in addition, when observing things about people we can either do this directly (as in the case of observing whether or not a driver is wearing a seat belt when driving) or indirectly (for example drivers can be asked for their attitudes on wearing a seat belt).
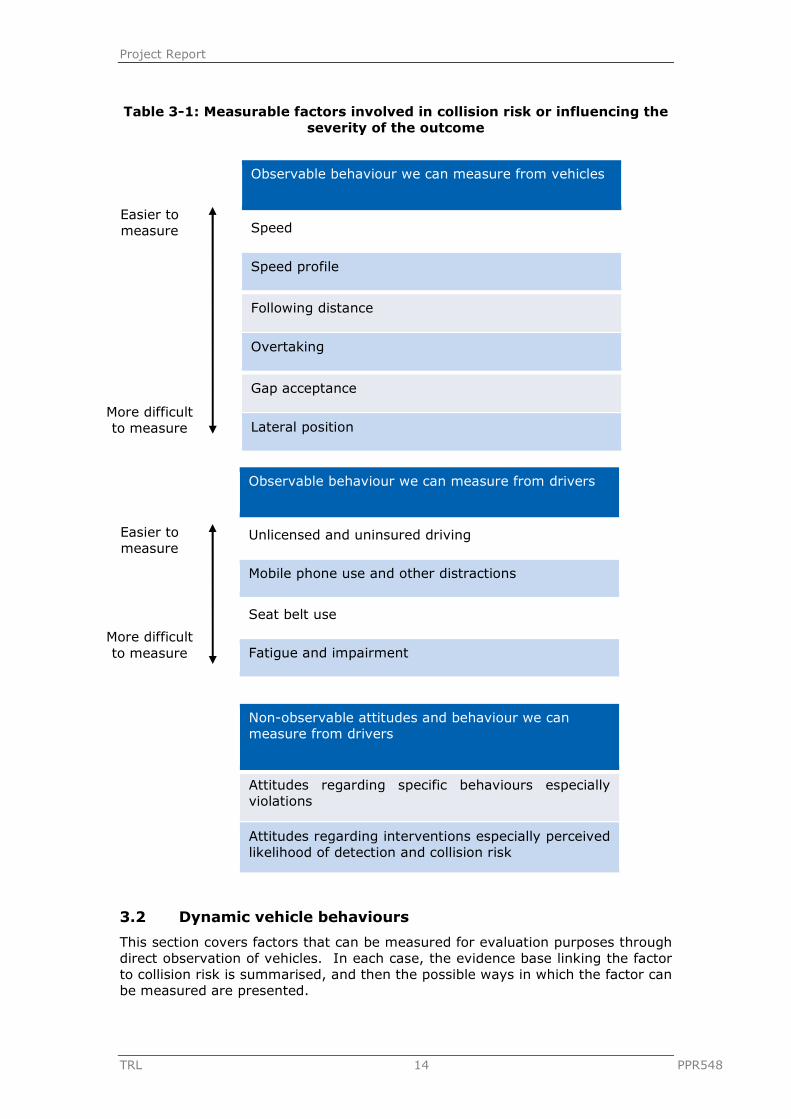
Table 3-1 summarises these factors associated with collision risk and the relative ease with which we believe they can be measured within a route safety context. The following sections then discuss each in turn.
One important point to make is that we are advocating the measurement of behavioural and attitudinal variables directly; this allows us to get a direct handle on the causal mechanisms by which drivers and road users on a given route may be increasing (or decreasing) the risk of accidents.
Project Report
TRL 14 PPR548
Table 3-1: Measurable factors involved in collision risk or influencing the severity of the outcome
3.2 Dynamic vehicle behaviours
This section covers factors that can be measured for evaluation purposes through direct observation of vehicles. In each case, the evidence base linking the factor to collision risk is summarised, and then the possible ways in which the factor can be measured are presented.
Observable behaviour we can measure from vehicles
Speed
Speed profile
Following distance
Overtaking
Gap acceptance
Lateral position
Observable behaviour we can measure from drivers
Unlicensed and uninsured driving
Mobile phone use and other distractions
Seat belt use
Fatigue and impairment
Non-observable attitudes and behaviour we can measure from drivers
Attitudes regarding specific behaviours especially violations
Attitudes regarding interventions especially perceived likelihood of detection and collision risk
Easier to measure
More difficult to measure
Easier to measure
More difficult to measure

Project Report
TRL 15 PPR548
3.2.1 Spot speed – evidence
There is a straightforward relationship between speed and crash involvement such that as speed goes up so also does crash involvement (Aarts & van Schagen, 2006; Finch et al., 1994; Richter et al., 2006). It is clear that there are biological constraints on the forces that the human body can tolerate without injury or death. For example the OECD (2008) argues that for pedestrians, survival chances diminish rapidly if hit at speeds greater than 30km/h. They argue that for side impacts on a properly restrained car occupant then the critical threshold is 50km/h and for a head-on crash involving restrained occupants the threshold is 70 km/h. Given that one can measure the amount of vulnerable road-user exposure, the history of side impact crashes, and the history of head-on crashes, then speed provides an important indicator of exposure to risk.
3.2.2 Spot speed – measurement
Spot speeds are those measured at a single location either by the use of tubes laid across the road (temporary), detectors cut into the road surface (permanent) or by hand held radar devices. Spot speed measurements give a quick and easy (though not cheap) guide to vehicle speeds at a single location on a route. Care needs to be taken regarding site selection to ensure speed is measured in relation to the effect of the intervention and as far as possible the speed measurements should be in free flowing conditions and not in times of congestion.
Table 3-2 summarises the benefits and disbenefits of each type of measurement.
Measurements of speed should be taken before an intervention takes place and again afterwards so as to determine whether any change in drivers speed choice behaviour has occurred. Ideally speed measurements in the after period should take place once the new desired behaviour has had time to settle down. A period of about one month to six weeks after is usual.
An intervention may be designed to affect the speed of all drivers or it may focus on the speeds of the fastest. In either case a distribution of speeds before and afterwards is needed to be able to judge whether any changes have occurred. Details of how to measure spot speed are described in Road Safety Good Practice Guide2.
2 Road Safety Good Practice Guide, speed monitoring section http://webarchive.nationalarchives.gov.uk/+/http://www.dft.gov.uk/pgr/roadsafety/laguidance/roadsafetygoodpracticeguide?page=6

Project Report
TRL 16 PPR548
Table 3-2: Summary of benefits and disbenefits of automatic versus radar/laser vehicle speed measurement
Automated traffic counters Radar or laser guns Benefits Record all time periods (i.e. possible to
isolate results for particular times or days of week)
Immediate (no installation of equipment required)
Large amounts of data Easy to isolate readings for individual vehicles, exclude certain vehicles etc
Traffic flows also collected Good to get indicative rather than comprehensive result
Repeat monitoring periods easy if loop/tube equipment remains on site
Disbenefits May be difficult to install tubes/loops (unsuitable position, difficulty in fixing to road, may require traffic management)
Often hard to use discretely which might affect vehicle speeds
May not be able to isolate individual vehicle speeds (depending on logger type)
On low flow roads, hard to get sufficient sample size without intensive use of staff resources
May require cabinet installation Source Road Safety Good Practice Guide
3.2.3 Speed profiles – evidence
There has been a revolution in what can be readily measured and transmitted from in-vehicle data recorders (IVDRs). It is now becoming relatively straightforward to record not just the speed of a vehicle but also a whole range of data such as acceleration forces (lateral, longitudinal, and vertical), and whether specific systems are being used (e.g. windscreen wipers, headlights).
One useful measure is the amount of force that the vehicle is subjected to by the driver. It might seem plausible for example that those drivers who subject the vehicle to hard decelerations might be at higher risk of a collision. The evidence would appear to support the proposal that the forces applied to the vehicle are associated with crash involvement (Wahlberg, 2007).
3.2.4 Speed profiles – measurement
Speed profiles are especially important to consider in the case of route treatments where interventions of different types may be introduced along a route. No driver drives at a steady speed along an entire route as there are constant adjustments for bends, junctions, crossings and other road features as well as presence of other road users. Route treatments are specifically designed to alter road user behaviour along a route so if an instrumented vehicle (car or motorcycle) is available journey time and speed profiles are preferable to spot speeds. There may be specific interventions along the route such as speed reducing features or new signage. The use of speed profiles and journey time measurements can help on the assessment of effectiveness of these interventions and how they contribute to the whole.
As noted above driving style is also important and its measurement is by use of an instrumented vehicle. Hard braking and acceleration is associated with increased noise and exhaust emissions as well as there being evidence to support the link between these behaviours and collisions.
In Section 5.1.6 we discuss an example of using speed profile data in a route safety context.

Project Report
TRL 17 PPR548
3.2.5 Following distance – evidence
Following too close to the vehicle in front reduces the opportunity to respond to any incident should the need arise. In one study it was noted that 30% of all crashes were rear end collisions (Ben-Yaacov et al., 2002). An observational study (Evans & Wasielewski, 1983) found a clear relationship between the following distances that people choose and their crash involvement.
3.2.6 Following distance – measurement
Following distance is technically known as headway. It is measured from the front of vehicle A to the front of the following vehicle B. It can be measured either in distance or in time. Headways are not constant and change with traffic conditions, flows, vehicle mix and general vehicle speeds. Slow and large vehicles tend to have larger gaps in front of them. If close following has been a problem behaviour which the route intervention is designed to change either by the introduction of chevrons or by a speed management intervention the measurement of headways is of importance to measure.
Along high flow roads and motorways this is usually measured using permanently installed loop detectors but for the purposes of route interventions this is an expensive option. In Section 5.1.5 we present an example of the use of PVR loop detectors to measure headway as well as speed.
3.2.7 Driving violations – evidence
If we consider driving violations in general then it has been found that those with a driving violation are three times more likely to have a subsequent crash (Gerbers & Peck, 2003). A variety of self report violation measures (see Section 3.4.2.2) also indicate that those with a greater tendency to violate are also more involved in crashes (Parker et al., 1995; McKenna, 2008).
3.2.8 Driving violations – measurement
Drivers’ tendencies to commit violations, and their self-reported rate of violations over a given time period can be measured using questionnaires (see Section 3.4.2.2). In addition, it should be possible to measure other violations using roadside observational methods. For red-light running, camera technology is a potential method.
3.2.9 Overtaking – evidence
Overtaking (on single carriageway roads) is believed to be associated with collision risk, in that it increases the exposure of drivers to potential head-on collisions – one of the four types of collision that account for 80% of fatalities on European rural main roads according to the OECD (1998, see also Hegeman, 2004). Clarke et al. (1999) studied records of fatal collisions and found that the most dangerous speed to overtake at was around the speed limit.
3.2.10 Overtaking – measurement
Injudicious overtaking is one of the manoeuvres which causes the most deaths and injuries on the roads of industrialised countries. To counter this Sweden has introduced a system on single carriageway rural roads by which overtaking can take place but collisions with oncoming vehicles cannot occur because a barrier is erected in the centre of the road. Whilst this is an intervention which is expensive and can only be used where the single carriageway is able to accommodate three lanes and a barrier, it illustrates the problem associated with overtaking

Project Report
TRL 18 PPR548
especially of large goods vehicles (>7.5 tonnes) whose national speed limit is lower (40 mph) than that that of cars (60mph)
Overtaking is a problem mainly because of the speed generated in the overtaking manoeuvre which may lead to loss of control or collision with oncoming traffic. Measurement therefore centres on the type of intervention planned for the parts of the route where overtaking is a safety issues. Speed measurement of the traffic stream is one of the necessary measurements and this has been described above, the number of overtaking vehicles along the section is the other critical measurement along with flows. Headways shorten as traffic bunches up behind the slower vehicle.
3.2.11 Gap acceptance – evidence
There is general acceptance that if drivers were to increase the size of gaps they accept when joining or turning across flows of traffic, this would be likely to have a positive impact on safety. This is especially true for the safety impact on motorcycles, which are over-represented in collisions with cars at junctions, in which the car violates the path of the motorcycle (Hawkes, 1968; Road user Safety Good Practice Guide).
3.2.12 Gap acceptance – measurement
Gap acceptance is commonly measured using filmed footage of a given location (or multiple locations along a route). The size of gaps accepted by vehicles crossing the path of major traffic flow can be measured by counting frames on the video between vehicles moving oncoming vehicles reaching a reference point, and converting this into time. Traffic flow and conditions of the major road needs to be taken into account – preferably by taking ‘before and after’ measurements at similar times of the day, and in similar weather conditions. There is also some evidence that suggests that mobile phone use and other distractions affect the number of unsafe gaps accepted (Cooper & Zheng, 2002).
3.2.13 Lateral position – evidence
It can be argued that the lateral position taken up by vehicles as they travel, especially on single carriageway roads, may be relevant in determining the risk of head-on and run-off accidents, collisions with vulnerable road users such as cyclists who use the near-side of the road, and sideways collisions with other vehicles by entering their lane. This latter collision type may be associated with fatigue. Edge lining is the usual countermeasure for nearside run off accidents on straight roads and has the effect of moving vehicles more to the centre, especially in darkness. However, driving speed does increase marginally (Steyyers & De Waard, 2000). Lateral position and high speeds at bends are important; drivers tend to straighten their travel path and to avoid run-off accidents so good delineation is needed especially to reduce approach speeds (Lawton, Helman & Summersgill, 2009).
3.2.14 Lateral position – measurement
Lateral position can be measured through on-site observations using filmed footage that can be analysed later by scaling a computer screen and measuring lateral distances against a reference point (Gunay & Woodford, 2007).
This is labour-intensive, but can provide useful data especially where vehicles drift off the road to the left on the straight and to the centre line on approaches to bends where speed measurements could also be taken as these have an effect on vehicle position.
Project Report
TRL 19 PPR548
3.3 Dynamic person behaviours
This section covers factors that can be measured for evaluation purposes through direct observation of people (e.g. drivers or other road users). In each case, the evidence base linking the factor to collision risk is summarised, and then the possible ways in which the factor can be measured are presented.
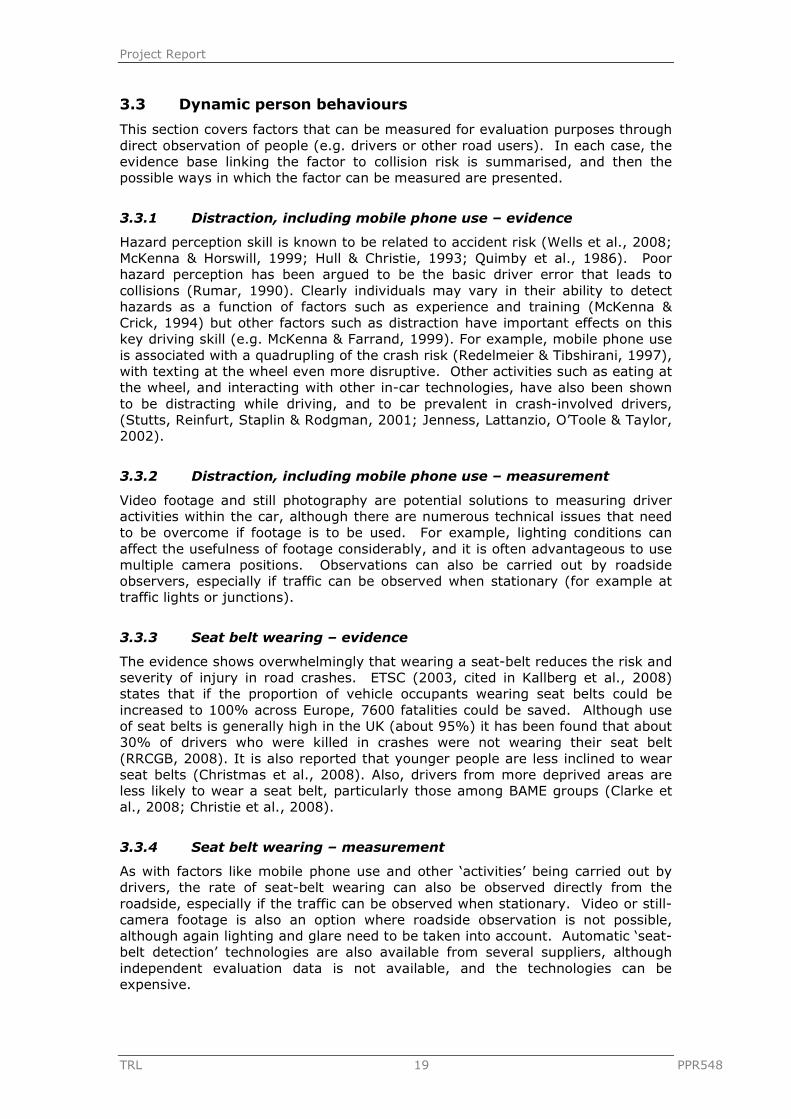
3.3.1 Distraction, including mobile phone use – evidence
Hazard perception skill is known to be related to accident risk (Wells et al., 2008; McKenna & Horswill, 1999; Hull & Christie, 1993; Quimby et al., 1986). Poor hazard perception has been argued to be the basic driver error that leads to collisions (Rumar, 1990). Clearly individuals may vary in their ability to detect hazards as a function of factors such as experience and training (McKenna & Crick, 1994) but other factors such as distraction have important effects on this key driving skill (e.g. McKenna & Farrand, 1999). For example, mobile phone use is associated with a quadrupling of the crash risk (Redelmeier & Tibshirani, 1997), with texting at the wheel even more disruptive. Other activities such as eating at the wheel, and interacting with other in-car technologies, have also been shown to be distracting while driving, and to be prevalent in crash-involved drivers, (Stutts, Reinfurt, Staplin & Rodgman, 2001; Jenness, Lattanzio, O’Toole & Taylor, 2002).
3.3.2 Distraction, including mobile phone use – measurement
Video footage and still photography are potential solutions to measuring driver activities within the car, although there are numerous technical issues that need to be overcome if footage is to be used. For example, lighting conditions can affect the usefulness of footage considerably, and it is often advantageous to use multiple camera positions. Observations can also be carried out by roadside observers, especially if traffic can be observed when stationary (for example at traffic lights or junctions).
3.3.3 Seat belt wearing – evidence
The evidence shows overwhelmingly that wearing a seat-belt reduces the risk and severity of injury in road crashes. ETSC (2003, cited in Kallberg et al., 2008) states that if the proportion of vehicle occupants wearing seat belts could be increased to 100% across Europe, 7600 fatalities could be saved. Although use of seat belts is generally high in the UK (about 95%) it has been found that about 30% of drivers who were killed in crashes were not wearing their seat belt (RRCGB, 2008). It is also reported that younger people are less inclined to wear seat belts (Christmas et al., 2008). Also, drivers from more deprived areas are less likely to wear a seat belt, particularly those among BAME groups (Clarke et al., 2008; Christie et al., 2008).
3.3.4 Seat belt wearing – measurement
As with factors like mobile phone use and other ‘activities’ being carried out by drivers, the rate of seat-belt wearing can also be observed directly from the roadside, especially if the traffic can be observed when stationary. Video or still-camera footage is also an option where roadside observation is not possible, although again lighting and glare need to be taken into account. Automatic ‘seat-belt detection’ technologies are also available from several suppliers, although independent evaluation data is not available, and the technologies can be expensive.
Project Report
TRL 20 PPR548
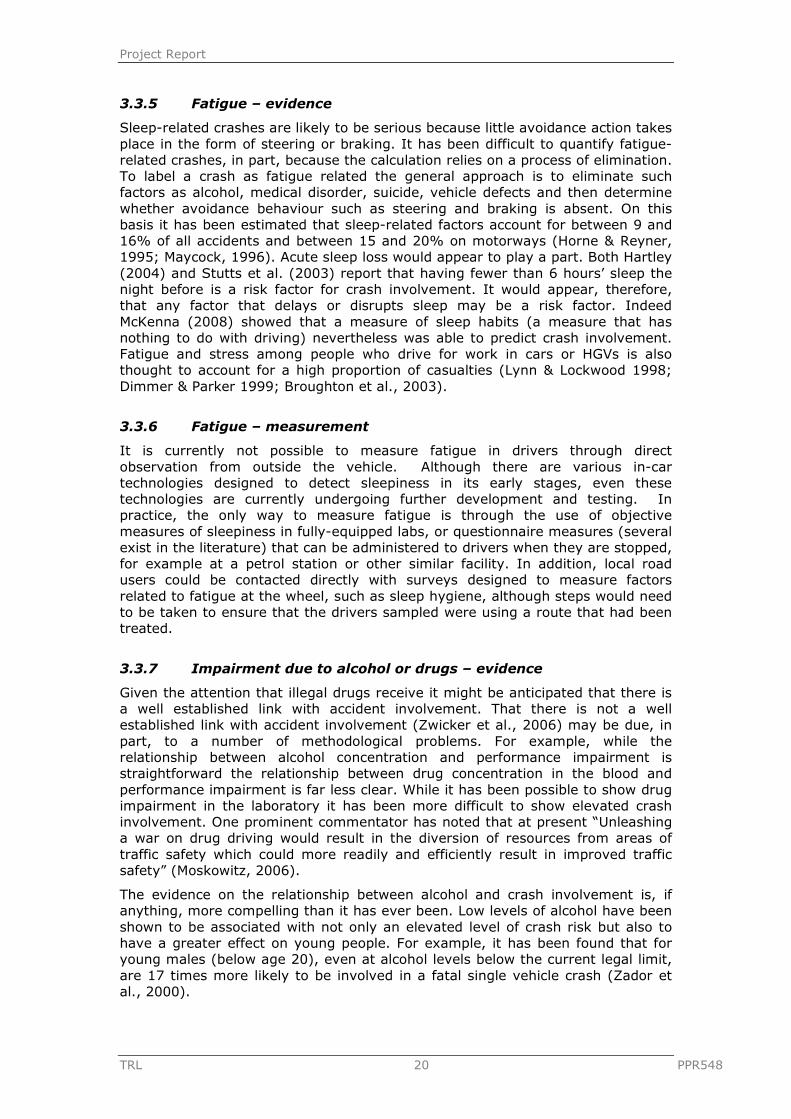
3.3.5 Fatigue – evidence
Sleep-related crashes are likely to be serious because little avoidance action takes place in the form of steering or braking. It has been difficult to quantify fatigue-related crashes, in part, because the calculation relies on a process of elimination. To label a crash as fatigue related the general approach is to eliminate such factors as alcohol, medical disorder, suicide, vehicle defects and then determine whether avoidance behaviour such as steering and braking is absent. On this basis it has been estimated that sleep-related factors account for between 9 and 16% of all accidents and between 15 and 20% on motorways (Horne & Reyner, 1995; Maycock, 1996). Acute sleep loss would appear to play a part. Both Hartley (2004) and Stutts et al. (2003) report that having fewer than 6 hours’ sleep the night before is a risk factor for crash involvement. It would appear, therefore, that any factor that delays or disrupts sleep may be a risk factor. Indeed McKenna (2008) showed that a measure of sleep habits (a measure that has nothing to do with driving) nevertheless was able to predict crash involvement. Fatigue and stress among people who drive for work in cars or HGVs is also thought to account for a high proportion of casualties (Lynn & Lockwood 1998; Dimmer & Parker 1999; Broughton et al., 2003).
3.3.6 Fatigue – measurement
It is currently not possible to measure fatigue in drivers through direct observation from outside the vehicle. Although there are various in-car technologies designed to detect sleepiness in its early stages, even these technologies are currently undergoing further development and testing. In practice, the only way to measure fatigue is through the use of objective measures of sleepiness in fully-equipped labs, or questionnaire measures (several exist in the literature) that can be administered to drivers when they are stopped, for example at a petrol station or other similar facility. In addition, local road users could be contacted directly with surveys designed to measure factors related to fatigue at the wheel, such as sleep hygiene, although steps would need to be taken to ensure that the drivers sampled were using a route that had been treated.
3.3.7 Impairment due to alcohol or drugs – evidence
Given the attention that illegal drugs receive it might be anticipated that there is a well established link with accident involvement. That there is not a well established link with accident involvement (Zwicker et al., 2006) may be due, in part, to a number of methodological problems. For example, while the relationship between alcohol concentration and performance impairment is straightforward the relationship between drug concentration in the blood and performance impairment is far less clear. While it has been possible to show drug impairment in the laboratory it has been more difficult to show elevated crash involvement. One prominent commentator has noted that at present “Unleashing a war on drug driving would result in the diversion of resources from areas of traffic safety which could more readily and efficiently result in improved traffic safety” (Moskowitz, 2006).
The evidence on the relationship between alcohol and crash involvement is, if anything, more compelling than it has ever been. Low levels of alcohol have been shown to be associated with not only an elevated level of crash risk but also to have a greater effect on young people. For example, it has been found that for young males (below age 20), even at alcohol levels below the current legal limit, are 17 times more likely to be involved in a fatal single vehicle crash (Zador et al., 2000).
Project Report
TRL 21 PPR548
3.3.8 Impairment due to alcohol or drugs – measurement
As is the case with fatigue, it is not currently possible to measure impairment due to drugs and alcohol without using stop-and-test procedures using suitable survey instruments that ask people to self-report their use of such substances.
3.3.9 Uninsured and unlicensed driving – evidence
Analysis of fatality and casualty data shows a relationship between driving violations (failure to licence; tax, insure; driver over the alcohol limit and reckless driving) and collision involvement which is especially strong for young drivers from more deprived backgrounds (Knox et al., 1993; Clarke et al., 2008). In addition, Broughton (1996) reports that there is a correlation between motoring offences and other types of offences such as parking in disabled bays.
3.3.10 Uninsured and unlicensed driving – measurement
As a first indication of whether there may be a problem with uninsured3 driving, interrogating the ‘hit and run’ record within STATS19 to assess numbers of collisions in this category is a useful starting point. The most commonly used method of detecting these drivers is for the police to use ANPR (automatic number plate recognition) at different times of day or year (see Section 4.1).
3.4 Attitudinal variables
This section covers factors that cannot be observed directly, but which can be measured indirectly through the use of tools such as questionnaires. The section is structured slightly differently to those on dynamic behaviours. First the evidence for a general link between various attitudinal factors and accident involvement is explored. Second, two validated questionnaire measures are presented that will be useful practitioner tools. Third, other aspects of attitudes (for example attitudes to the route in general, or to enforcement) are discussed.
3.4.1 The case for measuring attitudes and behaviours
The Route Safety approach is likely to comprise a package of measures aimed at changing behaviour and attitudes which evidence suggests may contribute to reducing collision and injury rates (Delhomme et al., 1999). Arguably, changing attitudes is a cost effective approach because it would extend the influence of a Route Safety intervention across the road network not just on a specific route.
The evidence suggests that road safety behaviour change campaigns need to focus on four key areas:
• Drivers’ attitudes to risky driving behaviour i.e. whether they view it as
positive or negative. • Drivers’ attitudes towards the penalties and enforcement of risky
behaviour i.e. whether they view it as positive or negative. • Propensity to violate driving regulations. • Perception of the risk of being caught or having an accident.
Attitudes represent the way we ‘favour or disfavour’ something and may predict the way we behave. Therefore if we strongly disfavour behaving in a certain way such as drinking and driving we are less likely to drink and drive. There is some
3 If a person is driving unlicensed they are also uninsured. From the STATS19 record it is difficult to determine whether the driver was uninsured/unlicensed, drug driving, or some other cause but it's a useful start.

Project Report
TRL 22 PPR548
evidence of a relationship between attitudes, self reported driving behaviour and collision involvement. For example, research among older drivers (Nabi et al., 2007) showed that attitudes to rule violations such as exceeding speed limits in rural roads, driving whilst tired, and risky use of mobile phones were predictors of road traffic collisions and significantly correlated with negative attitudes to speed limits, enforcement and alcohol restrictions. Such drivers also tended to be male, higher mileage and drive more powerful cars.
A propensity to violate, as measured on the Driver Behaviour Questionnaire, has been associated with a greater involvement in collisions (West et al., 1993; Parker et al., 1995). A relationship has also been shown between drivers’ negative attitudes to safety and violations especially for speeding and reckless driving amongst young male drivers who had held a licence for fewer than 10 years. In turn, these behaviours were associated with involvement in both near and actual crashes explaining 21% of the total variance in these measures (Iversen et al., 2004)
We also know that decisions on whether or not to violate will be influenced by whether or not a driver feels they are likely to have a collision or are likely to get caught as a result of committing the violation (Aberg, 1993).
3.4.2 Using questionnaires to measure attitudes and self-reported behaviours
The measurement of self-reported behaviours and attitudes requires the use of appropriate questionnaires or survey tools. Such tools often require considerable development work before we can be sure that they are valid and reliable measures of the behaviours and attitudes we want to assess. Generally speaking, when designing a questionnaire ‘from scratch’, practitioners should seek help from academics or other individuals who have expertise in the area. However there are also existing questionnaire tools that can be used by practitioners who are focusing on some of the key behaviours listed in Table 3-1.
The Driver Attitude Questionnaire (DAQ) (Parker et al., 1996) and the Driver Behaviour Questionnaire (DBQ) (Parker et al., 1995) are validated tools to measure attitudes and behaviours that are linked to collision involvement. The following section is based on a short note (for practitioners) on the DAQ and DBQ, developed by Frank Lai at the Institute of Transport Studies, Leeds.
3.4.2.1 Measuring attitudes using the DAQ
The DAQ taps driver attitude towards road safety via the following four sets of scenarios:
• Speeding • Close following • Dangerous overtaking • Drinking and driving
Each set of scenarios consist of 10 questions. The DAQ could be used as an overall measurement (i.e. all 40 questions). It could also be used as a measure to assess particular problems (e.g. speeding, by using only the 10 questions relating to speeding).
The entire DAQ is reproduced in Appendix A, along with scoring instructions. The questionnaire can be used to calculate an average score relating to attitudes to the behaviour(s) in question, so that it can be determined if a route safety intervention is successful in changing attitudes. For example, Figure 3-1 shows the results from a previous project. The DAQ was used to assess whether drivers

Project Report
TRL 23 PPR548
changed their attitude as a result of attending a driver training course. The DAQ was administered immediately before the course, after the course, and then 6 months and 12 months afterwards.
A higher score on the DAQ means a more positive attitude towards safety. So the results in the example data suggest that the effectiveness of the intervention has lasted over 12 months; the trend dips down a bit at the 12-month point but it is still statistically significantly different from the pre-course score.
Figure 3-1: Data from a previous project showing mean DAQ score before an intervention, and then immediately after, 6 months after, and 12
months after the intervention
Also included in Appendix A is a proposed extension to the DAQ from the authors of this report, extending the questionnaire to encompass a new behaviour – talking on a mobile phone while driving. Note that this proposed extension has not been validated, but has been developed using appropriate design principles.
3.4.2.2 Measuring self-reported behaviours using the DBQ
The DBQ refers to three aspects of driving behaviour: errors, lapses, and violations. We recommend that you only use the violation questions as these are most likely to be related to collisions, and are also the most plausibly targeted by a route safety intervention. We recommend that these questions are related to the specific route in which you are interested.
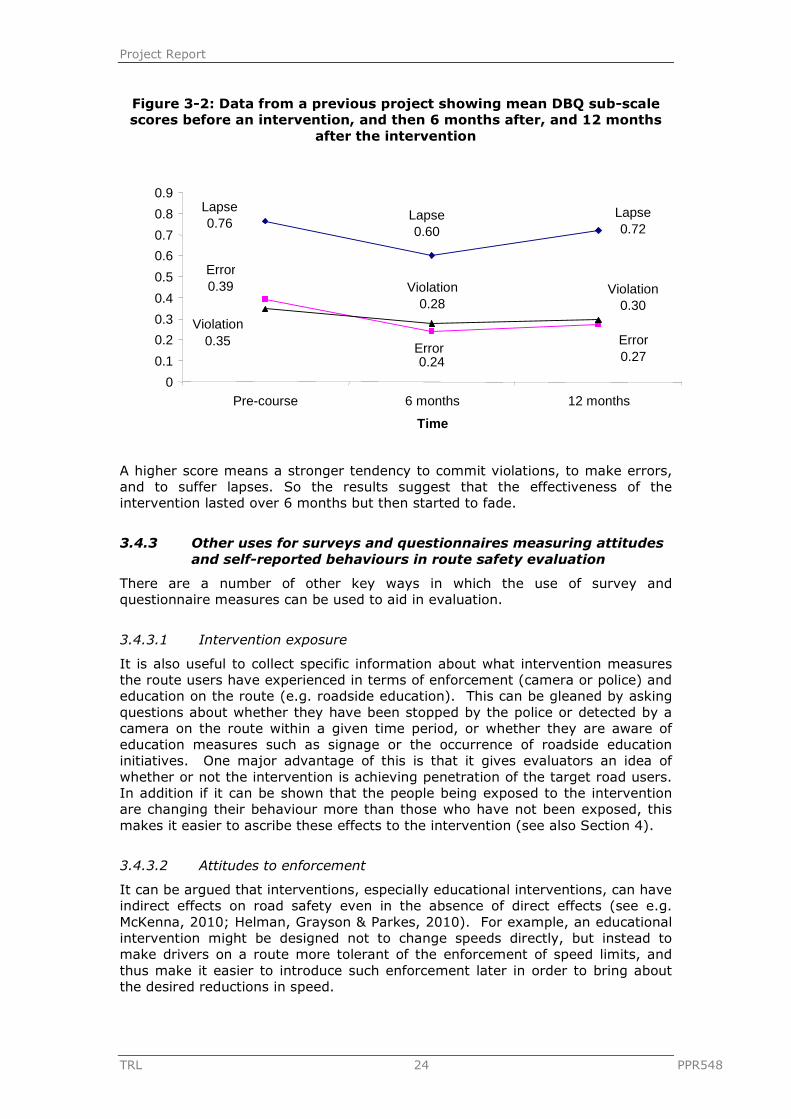
The DBQ items relating to violations are presented in Appendix B, along with instructions relating to a single route, and scoring instructions. Usually it is delivered as a self completion questionnaire but it could just as easily be carried out as a telephone based survey which could be aimed at a sample of drivers who regularly use the route. The items can be used to calculate an average score reflecting the tendency people have to commit various violations, so that it can be seen if an intervention has changed this tendency for the better. For example, Figure 3-2 shows data (in this case from all three sub-scales) from a previous project. The DBQ was used to assess whether drivers changed their behaviour (in terms of self-reported lapses, errors, and violations) as a result of attending a driver training course. The DBQ was administered immediately before the course, and then again 6 months and 12 months after the course.
3.69
3.73
3.77
3.74
3.64
3.66
3.68
3.7
3.72
3.74
3.76
3.78
Pre-course Post-course 6 months 12 months
Time
DAQ
SCORE
Project Report
TRL 24 PPR548
Figure 3-2: Data from a previous project showing mean DBQ sub-scale scores before an intervention, and then 6 months after, and 12 months
after the intervention
A higher score means a stronger tendency to commit violations, to make errors, and to suffer lapses. So the results suggest that the effectiveness of the intervention lasted over 6 months but then started to fade.
3.4.3 Other uses for surveys and questionnaires measuring attitudes and self-reported behaviours in route safety evaluation
There are a number of other key ways in which the use of survey and questionnaire measures can be used to aid in evaluation.
3.4.3.1 Intervention exposure
It is also useful to collect specific information about what intervention measures the route users have experienced in terms of enforcement (camera or police) and education on the route (e.g. roadside education). This can be gleaned by asking questions about whether they have been stopped by the police or detected by a camera on the route within a given time period, or whether they are aware of education measures such as signage or the occurrence of roadside education initiatives. One major advantage of this is that it gives evaluators an idea of whether or not the intervention is achieving penetration of the target road users. In addition if it can be shown that the people being exposed to the intervention are changing their behaviour more than those who have not been exposed, this makes it easier to ascribe these effects to the intervention (see also Section 4).
3.4.3.2 Attitudes to enforcement
It can be argued that interventions, especially educational interventions, can have indirect effects on road safety even in the absence of direct effects (see e.g. McKenna, 2010; Helman, Grayson & Parkes, 2010). For example, an educational intervention might be designed not to change speeds directly, but instead to make drivers on a route more tolerant of the enforcement of speed limits, and thus make it easier to introduce such enforcement later in order to bring about the desired reductions in speed.
Lapse0.76
Lapse0.60
Lapse0.72
Error0.39
Error0.24
Error0.27
Violation0.28
Violation0.30
Violation0.35
0
0.1
0.2
0.3
0.4
0.5
0.6
0.7
0.8
0.9
Pre-course 6 months 12 months
Time
Project Report
TRL 25 PPR548
3.5 Demographic variables
We know that risk of injury is not evenly spread across the population with males of all ages, especially teenage and young adult males having a higher casualty rate than females of the same age. Older people are at risk of injury as pedestrians and car and bus passengers. Some of this is due to exposure where people of a certain age and gender are more active in the road environment as pedestrians, cyclists, motor cyclists or car occupants. For these reasons it is important to obtain information about the demographic mix (age and gender and these are relatively easy to observe) of those people from whom other behavioural data are being collected.
One reason for this is that if changes are observed in some behavioural measures such as seat belt wearing and child restraint use it may then be possible to assess if this change is partly due to more females changing their behaviour than males etc.
Another reason for knowing the numbers of males and females and people in different age groups is that the distribution of males and females in the driving population is not equal (there are still more male drivers than female) and even if five or ten year age bands are used there are different numbers of people in each age band.
We discuss demographic variables further in Section 4; specifically, we discuss how the various sub-groups of road user (car drivers, young car drivers, motorcyclists etc.) can be used to both understand the problem on a route, and also how some behavioural changes observed as a result of route interventions can sometimes be assumed to have a different impact on different road user groups (see Section 4.6).
Project Report
TRL 26 PPR548
4 The design of the evaluation Generally the aim of an evaluation is to assess whether the intervention has had an effect on the target behaviour over and above that which might have happened by chance and to reduce any potential alternative explanations. We might separate this deceptively simple statement into two parts: Part 1 is “Do we have a real effect that is over and above what we would expect by chance?” and Part 2 is “Can we eliminate alternative explanations?”
Let’s consider Part 1. In carrying out any monitoring of an intervention there is always underlying random variation in the observations or data. What is needed is a way of distinguishing whether the difference between two observations or data is greater than the underlying random ‘noise’. In the case of speed measurements for example, each person driving along a road in free flow conditions will choose a different speed. The question is whether and to what extent the route safety intervention changes that choice in a systematic manner. We would generally undertake a significance test and use the output of this (for example a chi squared value or a t value – see Section 4.5) to compare with tables of significance. The significance value gives us the probability of incorrectly concluding that the intervention worked when in truth it does not (because in fact the differences observed may have just been due to natural variation in the data).
Clearly we wish the probability of finding an effect by chance to be low; but how low? In considering significance tests Ronald Fisher came up with the guideline that .05 (or 5%, or 1 in 20) might be regarded as a useful rule of thumb. Conversely this is often quoted as 95% which means we are 95% confident that the change we have observed is not due to chance. An important, though frequently forgotten, point is that this is only a rule of thumb. Unfortunately, many people translate this into a binary characteristic – it is significant or it is not significant. This is not appropriate; a significance level is merely a statement of how likely our result is to have occurred by chance factors alone.
There are two other misconceptions that are important to avoid. One is that a low probability value means a large intervention effect and the other that statistical significance means theoretical or practical significance. Neither of these statements is correct. The fact that an intervention is associated with a low probability and hence is “significant” does not mean that the intervention has a large effect. Nor does it mean that the intervention is of practical significance. It simply means that the effect that was observed was not likely to be due to chance. You need to consider other factors to make an assessment of the effect size and practical significance. It is a good idea to know what kind of effect size you are hoping to achieve before you run the evaluation, so that you can choose an appropriate number of cars, drivers or other road users to measure, interview or send a questionnaire to (this is known as sample size; see Section 4.3).
Table 4-1 shows quite clearly that the larger the sample size for any given behaviour the smaller the effect that can be detected with confidence. Having established that the effect observed is not likely to be due to chance alone, we also need to establish that it is due to the intervention. In other words we wish to eliminate alternative interpretations. Suppose, for example, that we created a road safety education program and found that those who have been on the course have safer crash records than those who have not been on the course. The difference between the two groups is statistically significant so there is a low probability that this is a chance result. Does this mean that the intervention was a success? Yes, but only if we can eliminate alternative interpretations. Suppose, for example, that those who were already safe were attracted to safety education courses and those who were not safe had no interest in attending safety education courses. The statistically significant result that we observed may have
Project Report
TRL 27 PPR548
had nothing to do with the intervention but simply reflected pre-existing differences.
4.1 Identifying target road user groups
The first thing to establish when designing a route safety scheme and its evaluation is who are the road user groups most at risk of, or involved in, collisions along the route? There are several fundamental questions that need to be asked in order to target interventions and to evaluate the impact of route safety interventions:
1. Who is using the route? 2. Who is having collisions on the route? 3. Who is violating the regulations on the route? 4. Where do they come from? 5. What do we know about which ‘social groups’ they belong to? 6. Why are they using the route i.e. business or other?
There are databases already to help answer some of these questions (Q2,3,5):
• STATS 19 for casualties • Police records for offences • MAST – to provide with socio-demographic information related to the
above. There may be questions about unlicensed and other illegal driving (see Sections 3.3.9 and 3.3.10), where the police as partners can identify such drivers using Automatic Number Plate Recognition (ANPR), for example, at a number of points during the day at different times in the year (perhaps chosen to represent key times when collisions have occurred.)
Mapping these data using GIS and linking it with MAST and DVLA4 data gives a feel for where people come from, their social profile and whether or not they are registered to a company. These data will allow groups who are in need of influence to be targeted and will provide the basis of a sample to evaluate the impact of interventions. In addition, it will permit the assessment of the likely impact of an intervention on different road user groups, which is often useful with regard to meeting national targets where these are set with reference to different groups (for example young drivers, or child pedestrians).
Ideally a monitoring plan should be set up at the outset when the scheme is being designed and objectives set. Data should be collected before the intervention and once or twice after the intervention usually four to six weeks after and 12 months after to allow for driving behaviour to stabilise.
4.2 Asking the right questions
To be able to know whether the intervention is working the right questions need to be asked in terms of what you are trying to achieve with your intervention. In other words the objectives of the route safety scheme, and individual elements within it, need to be set out clearly. In this report, we have identified a number of behaviours which the evidence indicates are associated with crash risk. A route safety scheme will have a set of objectives and a corresponding set of interventions to address them. Therefore it is only necessary to measure the behaviours that you are seeking to change.
4 It should be noted that DVLA data may be more easily obtained by the Police, meaning that this part of the partnership should take action on using such data.
Project Report
TRL 28 PPR548
For example, if you were implementing an intervention with the objective of increasing the number of people wearing seatbelts on a given route (having identified that wearing rates on the route are low, for example), then this is the behaviour you would monitor in order to establish whether the intervention had been effective.
In order to know what you need to measure, you should always begin an evaluation with the question:
“What is this intervention trying to achieve?”
Importantly, the answer to this question needs to be specific, and refer to a measurable behaviour. So for example, saying “this intervention is designed to improve road safety” is not enough; instead you need to involve a specific, measurable outcome in your answer, related to something people on the route are going to ‘do’ differently. For example, you might answer by saying:
“The objective is to lower the speeds at which people drive.” This indicates that in order to measure the effectiveness of the intervention you need to measure speeds. The treatment may be more specific than this. For example:
“The objective is to lower the speed at which people drive when they are approaching junctions.” This would guide you to monitor speed at specific sites on the route. The specificity might refer to different types of road users, and multiple measures:
“The objective of the intervention is to reduce motorcycle speeds on bends, and also to discourage overtaking by motorcycles near junctions.” Again the specificity in the answer to the original “what is the intervention trying to achieve?” question, in terms of specific, measurable behaviours, leads naturally to the detail on what you are going to monitor (and in whom, and where).
Asking this simple question, and answering it as described here, is the important first step in an evaluation, and no intervention should proceed until you have specified precisely what the objectives are, what the target behaviour is and whether an increase or a decrease in the target behaviour is expected.
4.3 Sample size
Another key consideration when deciding to evaluate using any of the behavioural measures included in this report (whether dynamic or attitudinal) is the number of observations or participants required. If too few observations are gathered, it is very likely that any small or modest changes after an intervention may be ‘lost in the noise’ of naturally variability that is typically seen in behavioural measures—the design would be said to ‘lack statistical power’. If more observations are gathered than are actually needed, this represents a waste of money. The number of observations required to provide a robust assessment of whether a particular variable changes after an intervention will depend on two things: firstly, the amount of natural variation in the variable (for example, people will not always choose the same speed on the same stretch of road, but will vary this due to a large number of factors such as their mood, weather conditions, and so-on); the second is the size of difference in which you are interested in detecting (for example, if you interested in detecting a very small change, then larger sample sizes are required).

Project Report
TRL 29 PPR548
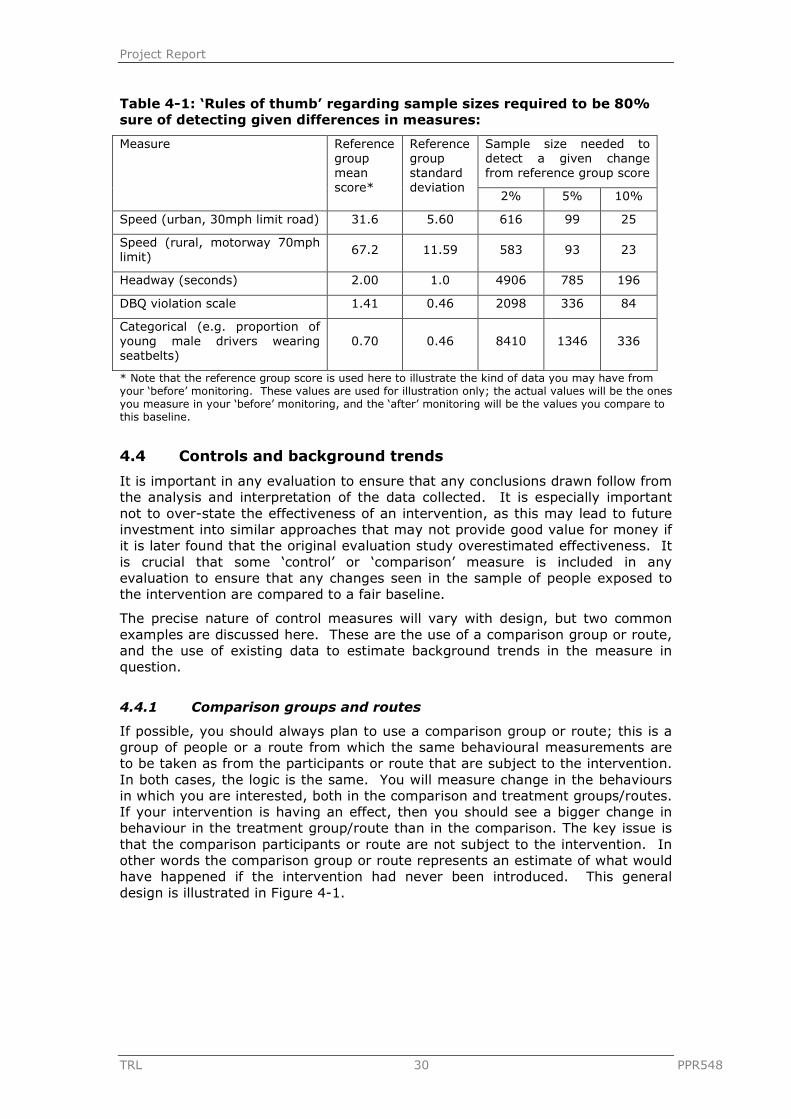
Table 4-1 gives rules of thumb as to the number of observations needed to detect changes (expressed as percentage changes from a hypothetical reference value) of a given magnitude, for some of the measures we have proposed in this report, at a commonly accepted level of statistical power (80%)5. An example will help to understand what the table is designed to illustrate: say we were to measure spot speeds on a route before the route safety scheme was implemented, and find that the average was 67.2mph (as in the ‘speed – rural motorway’ row in Table 4-1). If we were interested in seeing whether our route safety scheme led to a 5% reduction in this mean speed (a reduction of 3.36mph to 63.84mph) then we would need to measure spot speeds in a sample of just under 100 motorists after the scheme had been implemented (taking account of all the issues around control groups discussed later in this section) to be 80% sure that we were able to detect the change as statistically significant. Similarly, if we wished to detect just a 2% change in mean speed in this example (a reduction of 1.344mph to 65.856mph) then we would need nearly 600 data points. This illustrates the point made above where if a 2% reduction is not practically meaningful but a 5% reduction is, then it is wasteful of resources to collect nearly 600 observations when just under 100 would do. But, if 2% is important to detect and of practical use then collecting only just under 100 observations would also be wasteful as we could not know with certainty whether the after speeds were different from those before.
The purpose of the table is to illustrate that the number of observations required is dependent on both the variability in the measure, and the size of the difference we are interested in detecting. For example, consider the relative variability of the measures ‘headway’ and ‘DBQ violations’. The ‘headway’ measure is more variable (its standard deviation is a greater proportion of its mean), and therefore to detect a difference in the headway measure requires more participants than detecting the same size difference in the DBQ measure.
It should be remembered that the figures given are rules of thumb, and if it is possible to use data from the route being treated to carry out a formal power analysis (data analysts in your authority will know how to do this), then this is preferable, if time and budget allow it. However the figures in the table do give you an idea of the order of magnitude of sample sizes required for different measures and different sizes of effect.
5 Statistical power tells us, in probability terms, the capability of a test to detect an effect that does exist. That is, it tells us how often we are likely to reach a correct interpretation about the effect. For example a power of 80% means that a survey (or study) is likely to produce a statistically significant result 8 times out of 10 when there really is an effect.
Project Report
TRL 30 PPR548
Table 4-1: ‘Rules of thumb’ regarding sample sizes required to be 80% sure of detecting given differences in measures:
Measure Reference group mean score*
Reference group standard deviation
Sample size needed to detect a given change from reference group score
2% 5% 10%
Speed (urban, 30mph limit road) 31.6 5.60 616 99 25
Speed (rural, motorway 70mph limit) 67.2 11.59 583 93 23
Headway (seconds) 2.00 1.0 4906 785 196
DBQ violation scale 1.41 0.46 2098 336 84
Categorical (e.g. proportion of young male drivers wearing seatbelts)
0.70 0.46 8410 1346 336
* Note that the reference group score is used here to illustrate the kind of data you may have from your ‘before’ monitoring. These values are used for illustration only; the actual values will be the ones you measure in your ‘before’ monitoring, and the ‘after’ monitoring will be the values you compare to this baseline.
4.4 Controls and background trends
It is important in any evaluation to ensure that any conclusions drawn follow from the analysis and interpretation of the data collected. It is especially important not to over-state the effectiveness of an intervention, as this may lead to future investment into similar approaches that may not provide good value for money if it is later found that the original evaluation study overestimated effectiveness. It is crucial that some ‘control’ or ‘comparison’ measure is included in any evaluation to ensure that any changes seen in the sample of people exposed to the intervention are compared to a fair baseline.
The precise nature of control measures will vary with design, but two common examples are discussed here. These are the use of a comparison group or route, and the use of existing data to estimate background trends in the measure in question.
4.4.1 Comparison groups and routes
If possible, you should always plan to use a comparison group or route; this is a group of people or a route from which the same behavioural measurements are to be taken as from the participants or route that are subject to the intervention. In both cases, the logic is the same. You will measure change in the behaviours in which you are interested, both in the comparison and treatment groups/routes. If your intervention is having an effect, then you should see a bigger change in behaviour in the treatment group/route than in the comparison. The key issue is that the comparison participants or route are not subject to the intervention. In other words the comparison group or route represents an estimate of what would have happened if the intervention had never been introduced. This general design is illustrated in Figure 4-1.
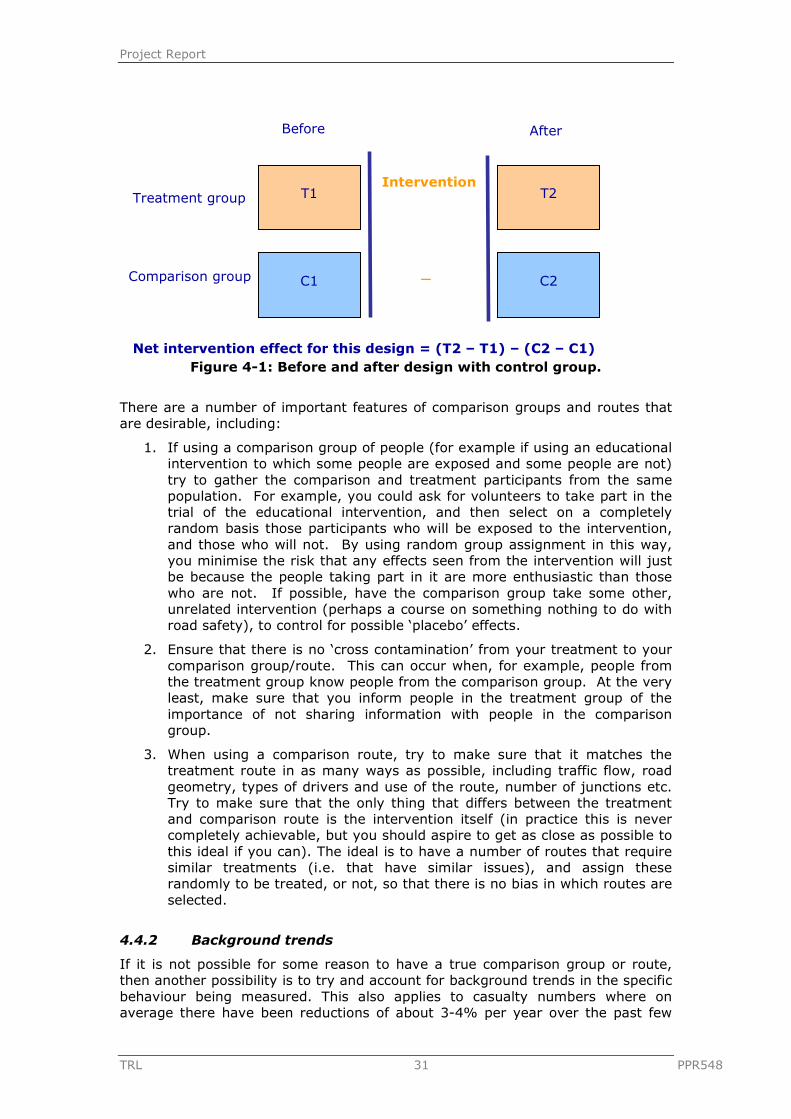
Project Report
TRL 31 PPR548
Figure 4-1: Before and after design with control group.
There are a number of important features of comparison groups and routes that are desirable, including:
1. If using a comparison group of people (for example if using an educational intervention to which some people are exposed and some people are not) try to gather the comparison and treatment participants from the same population. For example, you could ask for volunteers to take part in the trial of the educational intervention, and then select on a completely random basis those participants who will be exposed to the intervention, and those who will not. By using random group assignment in this way, you minimise the risk that any effects seen from the intervention will just be because the people taking part in it are more enthusiastic than those who are not. If possible, have the comparison group take some other, unrelated intervention (perhaps a course on something nothing to do with road safety), to control for possible ‘placebo’ effects.
2. Ensure that there is no ‘cross contamination’ from your treatment to your comparison group/route. This can occur when, for example, people from the treatment group know people from the comparison group. At the very least, make sure that you inform people in the treatment group of the importance of not sharing information with people in the comparison group.
3. When using a comparison route, try to make sure that it matches the treatment route in as many ways as possible, including traffic flow, road geometry, types of drivers and use of the route, number of junctions etc. Try to make sure that the only thing that differs between the treatment and comparison route is the intervention itself (in practice this is never completely achievable, but you should aspire to get as close as possible to this ideal if you can). The ideal is to have a number of routes that require similar treatments (i.e. that have similar issues), and assign these randomly to be treated, or not, so that there is no bias in which routes are selected.
4.4.2 Background trends
If it is not possible for some reason to have a true comparison group or route, then another possibility is to try and account for background trends in the specific behaviour being measured. This also applies to casualty numbers where on average there have been reductions of about 3-4% per year over the past few
T1 T2
C1 C2
After
Treatment group
Comparison group
Net intervention effect for this design = (T2 – T1) – (C2 – C1)
Intervention
_
Before

Project Report
TRL 32 PPR548
years. If this is not taken into account then analysis of casualty reductions as a result of the route safety scheme will be overstated. In practice the only behaviour where it is feasible to measure background trends is if speed is the behaviour in question, since there are datasets that can be accessed (e.g. from DfT) that show how speed behaviour is changing on different types of the road network over time (because of shifting attitudes to speeding, greater awareness of enforcement across the whole network etc.) The logic of this approach is that you can observe changes in spot speed (free flowing) at relevant locations on your route, and then compare these to any changes observed on similar roads nationally over the same time period. If your intervention is having an effect over and above what is going on at the national level, you would expect to see a larger shift in speeds in your route than nationally.
4.5 How to assess whether the route safety scheme (or interventions within it) has been successful
Up until this point the discussion has centred on:
• how to develop a set of objectives for the route safety scheme,
• for which behaviours there is evidence of effectiveness, and
• how to measure these behaviours, including how many observations are needed
For an evaluation of effectiveness we need to know with some accuracy whether the changes have indeed made a difference over and above what would have been expected in the absence of the intervention. To help in this task Section 4.4 describes
• how to choose a control or comparison area
• how to measure background trends
As already described the most common design for an evaluation is to collect data through the monitoring process in the before and after implementation of the intervention. This same data need to be collected simultaneously (or as close in time as possible) for both the route (or road user group) being treated and the control or comparison route (or road user group). The Road Safety Good Practice Guide gives more detailed information about data collection and monitoring.
The collection of data is only half the process. The assessment of effectiveness requires proper analysis of the data to establish how different it is and whether this difference could have occurred by chance (i.e. as a result of random fluctuations in the behaviour being observed).
This report is not the place for detailed descriptions on statistical analysis of data as the Good Practice Guide gives in Appendix B information on which test to use under what circumstances and how to conduct the analysis. Many of the tests are straightforward and a helpful spreadsheet for practitioners to use is also given by the TMS Consultancy.6
In general the t-distribution is used for data which are continuous such as speeds or flows. By this we mean the data can have any value in the range (including decimal places) and usually follow a normal (bell shaped) distribution. Tables for the distribution of t values are given in any statistical textbook and can be found on the internet.
The next most common test for differences between data is the chi-squared test. This is used to test for differences between before and after in the numbers of 6http://www.tmsconsultancy.co.uk/resources/analysis-tools/statistics-tests-fyrrhttp://www.tmsconsultancy.co.uk/files/file3.xls
Project Report
TRL 33 PPR548
accidents or collisions. This test is used rather than the t-test because accident numbers can only be whole numbers and cannot take a negative value. The distribution of accidents is considered to be Poisson. Some caution needs to be exercised when analysing casualty numbers as they are not Poisson distributed because there can be varying numbers of casualties per accident. However, the chi-squared test is commonly used on casualty numbers to give an approximation.
The Road Safety Good Practice Guide gives information on how to conduct a test on proportions. This is really useful in the case of cyclists and pedestrians where it is difficult to match flows across routes (intervention and control for example) where the proportion on one route showing a particular behaviour vs. the proportion on another is a better indicator than raw numbers. There is generally a lack of help for practitioners in the road safety literature on how to analyse the results of questionnaires which use scales.
4.6 Evaluating the effect of the intervention among different road user groups
Often a key motivation for any road safety intervention is to reduce casualties among a specific road user group, especially when national, regional and local targets sometimes refer to some road user groups specifically. The 2020 targets set out in Scotland’s Road Safety Framework, for example, list children under 16 with more stringent targets for killed or seriously injured people in this group than targets for people of all ages.
One way in which the evaluation of behavioural measures can feed into the effects of interventions on different road user groups has already been discussed (see Section 4.1); through understanding who is using a particular route (and therefore who is being exposed to the risks on that route, either through accident data or through local intelligence) it should be possible to estimate the relative effects of changes in risk (due to improvements in the behaviours in question) on these different road user groups, due to their relative exposure.
Another way in which behavioural measures can help is through understanding that particular groups of road users have a higher risk of collision compared to others especially on routes as defined in this report (for example Section 3.3.3). For example, young drivers are most likely to be involved in a collision in the dark, on bends and are less likely to wear their seat belts than older drivers whilst business drivers might be more likely to drive whilst under pressure and whilst tired. Understanding whether these behaviours have been effectively targeted can be seen through collision data looking at types of different types of collisions involving different types of road user and by using survey data which have sampled high risk groups in sufficient numbers to establish whether there have been significant changes in reported behaviours. In other words differential effects of interventions on different road users can be established from routinely collected data and by purpose built surveys.
Different road user groups engage in different risk taking behaviours. In this report we have argued that it is beneficial to evaluate route safety schemes on the basis of behavioural change. The next step might be to use behavioural change measures (where those behaviours have an evidential link to casualty reduction) as indicators for improved route (and road) safety. Although the ‘end goal’ targets from a health perspective might always need to be in terms of injury reduction (often to specific groups of road users) it is only through understanding the behavioural precursors of such injuries (often in specific groups of road users) that we can begin to adopt an approach to route safety (and road safety more widely) that is based more on risk-management, rather than only responding to casualties.
Project Report
TRL 34 PPR548
5 Examples of good practice In this section, we give some examples of route safety type approaches that illustrate some of the issues covered in previous sections of this report.
It should be noted that these schemes are high profile, and well funded, compared to everyday schemes run by local authorities. However they illustrate best-practice, and even in smaller schemes, a moderate amount of well-targeted evaluation following the principles in this guidance document should be seen as an essential part of route safety interventions.
5.1 Case study 1: Devon’s Country mile rural safety project 2008–2012
5.1.1 General background
A good example of how the principles covered in this report are used in practice is in the Rural Road Demonstration Project run by Devon County Council (DCC). While this is an area based approach the evaluation approach is equally applicable to a single route. The project was one of the rural safety demonstration projects funded by the Department for Transport (DfT) in 2008. DCC took an evidence led, strategic approach to develop a set of intervention measures and evaluate their effectiveness in what was known locally as the ‘Country Mile’ project (http://www.devon.gov.uk/countrymile). The overall aims for the country mile project were to reduce the incidence and severity of road collisions that occur in the project area, to achieve improvements to public perceptions and awareness regarding road safety, and to identify and document the methodologies used to deliver the programme for wider demonstration purposes. Route treatments were adopted as the desired approach, including an aspiration to improve the ‘readability’ and consistency of signing and marking of the rural road network, especially road curvature on ‘A’ roads within the overall project area (see Figure 5-1). The overall project area was chosen on the basis of the distribution of injury collisions across the county, taking into account the shared road safety concerns of partnership agencies but with those on the Highways Agency network removed. An area was sought that collected around 1000 casualties over a 5 year period on county roads that were ‘rural’, and did not include any casualties in settlements of over 5,000 population. Consideration was then given to routes that had a higher than average collision rate, to routes that met the DfT criteria and to an area that had a mixed demographic. As a result an area bordered by the A361, A377 and A396 was identified as meeting all the criteria.

Project Report
TRL 35 PPR548
Figure 5-1: Rural Road Safety Demonstration Project area in Devon
The approach within this area (specifically on the two main routes – the A361 running from Tiverton to Barnstaple, and the A377 running from Exeter to Barnstaple) then involved a multidisciplinary team with clear project governance and structured management. The interventions comprised a package of measures aimed to address factors related to collisions on the two main routes:
• Environmental changes to the roadscape (e.g. signage, bend treatment) • Police deterrence and enforcement or specific behaviours (e.g. speeding) • Public awareness campaigns • Targeted driver and rider training • Injury mitigation measures which included ambulance response times,
unforgiving roadside objects, seat belt wearing, child restraints, safe driving strategies for elderly drivers, awareness of occupant vulnerability in small and older cars, motorcyclists
• Practical coaching of high risk drivers/riders In all these cases, the interventions were designed to achieve changes in defined behavioural outcome measures which were measurable; the key behaviours focused on were speed and following distance at specific locations on the A361, and speed on bends on the A377. Any changes seen in terms of collision reductions on either road would be more easily attributable to the package of interventions if it could be shown that any casualty reductions were accompanied by changes in these key behaviours too.
5.1.2 Understanding the road users
The project evaluation in the Country Mile project involved extensive research to understand road use, casualties and offence levels and sociodemographic profiling to identify high risk groups using STATS19, DVLA, police data and MOSAIC database (now MAST). One way in which this led to real added value was in differentiating the intervention approaches on the two key routes in the project area. Through postcode analysis of casualties from STATS19 it was discovered that the A361 had a much larger proportion (than the A377) of ‘non-resident’ crash-involved drivers, with a wide dispersion of post-codes indicating that the
Project Report
TRL 36 PPR548
A361 is used largely as a commuting and tourist route between the M5 (Junction 27) and North Devon. Conversely, the A377 crash-involved drivers were mainly local to the road area. This information proved useful as it indicated that a local, targeted media campaign was likely to be more effective in and around the A377, in that it was likely to reach the majority of people at risk; the same cannot be said for the A361 (the users of this road being more dispersed, making a media campaign targeted on a small area less cost-effective).
5.1.3 Use of other evaluation design principles
The project made use of a number of other general principles of best practice in terms of the design of the evaluation. For example:
• Injury monitoring 3 years before and planned for 3 years after the various interventions – this ensures that a large enough dataset of accident data is gathered to permit meaningful statistical comparisons
• Monitoring of speed and traffic counter data planned before, during and after – this is useful as it means that traffic flow (i.e. the numbers of people exposed to risk) can be taken into account in analyses, and also any casualty savings attributable to speed changes (one of the key outcome variables targeted on the A361) can be accounted for
• Monitoring of enforcement data and enforcement schedules planned before, during and after – this is important as it makes it possible to attribute any short term or local changes to the enforcement-related activities separately from other parts of the intervention
• Attitudinal and self reported behaviour surveys planned before, during and after the intervention which included a range of appropriate measures. The sample at each stage was large enough at 600 people to be able detect even relatively modest changes in attitudes (significant at the 5% level). Such surveys represent a high level of public engagement
• A clear analysis plan seeking to explore the impact of measures on different groups such as drivers of different ages, motorcyclists and occupational drivers – this is important as road safety targets tend to be broken down into these different road user groups
• Exploration of both intended and unintended outcomes i.e. possible impacts on crime
In addition the inclusion of a project Risk Register and Case Submission history documents (for individual elements of the project) to monitor and address barriers and how they were overcome and lessons for the future to ensure sustainability
5.1.4 Specifics of the attitudinal evaluation - methodology
Whilst the evaluation was designed to look at an area, aspects of the evaluation can equally apply to a route. A number of features of the attitudinal study represent best practice in terms of methodology:
• The sample was chosen to be representative in terms of age, gender, and car ownership within the area
• Interviews were completed door to door and street interviews within the project boundary area
• Interviewers recorded personal collision involvement in the area (planned before (baseline), during and after)

Project Report
TRL 37 PPR548
• In the baseline survey the interviewer obtained agreement from the participant to be re-contacted in six months time (meaning that follow-up interviews were made easier)
• Interviewers sought information on vehicles driven, drivers, route usage and reasons why route was used – all helping with audience segregation
• Information was sought on existing perceptions of the route, including:
o Ratings of most dangerous aspects of driving on the road o Ratings of confidence and perceived safety in driving on road in the
local area covering built up areas, country lanes and dual carriageways and why they might feel unsafe (if rated so)
o Ratings of the seriousness of five offences and what police should focus on
o Ratings of the most common driving offences All of this is useful in understanding the way in which people use the route, and the perceived threats to safety that people have when using it
• Information was also sought on several key outcome measures related to the interventions used, including:
o Awareness of new signage o Changes in speed limits on specific roads o Knowledge of maximum speed limits for vehicles on different roads o Rating of likelihood of being detected speeding on specific routes -
this is important as it represents a mechanism by which driver behaviour may change (increased perception of likelihood of being caught should lead to speed reductions)
In all these cases, it is possible to see whether or not these key variables (if they are targeted by an intervention) change.
Whilst ‘one size’ will not fit all we recommend that there should be a move toward standardising areas of questioning and that validated measures such as DAQ and DBQ should be used where possible. These can be integrated alongside specific questions that test aspects of the intervention.
5.1.5 Specifics related to the use of PVR (per vehicle recording) data on the A361
The DCC team established that PVR data could be used to measured speed and following distance between vehicles on the A361. PVR data can be collected from loops installed in the road surface at specific points; the counters can calculate (through measuring wheelbase) vehicle type across different categories (e.g. car, heavy goods vehicle, motorcycle). Figure 5-2 and Figure 5-3 show such data for cars and heavy goods vehicles respectively, with lines indicating the speed limit for each, and the proposed safe following time of 2 seconds in dry conditions. Data analysts in-house at DCC were able to use these data to do two things. Firstly they were able to establish that one key problem with speed on the road was due to heavy goods vehicles travelling well above the speed limit for their vehicle class (40mph) – this is seen in Figure 5-3 as the vast majority of vehicles are to the right of the 40mph limit. This information could be used to design interventions, leading to proposed educational campaigns and signage to remind heavy goods vehicle drivers of the speed limits they should have been following. Secondly, the data analysts were able to use the PVR counters to measure speed at the same locations after various parts of the route safety interventions had been used. For example, it is the intention of DCC to measure speed at sites

Project Report
TRL 38 PPR548
both with, and without visible police enforcement, using sites on the route that are upstream and downstream of this to establish comparisons.
Figure 5-2: PVR data for cars from the A361
Figure 5-3: PVR data for heavy goods vehicles from the A361
5.1.6 Specifics of the bend-treatment study on the A377
A final part of the Country Mile project illustrates how the use of instrumented vehicles can help deliver an understanding of speed profiles in evaluation. This work, like the attitudinal survey work, was outsourced to an external research company.
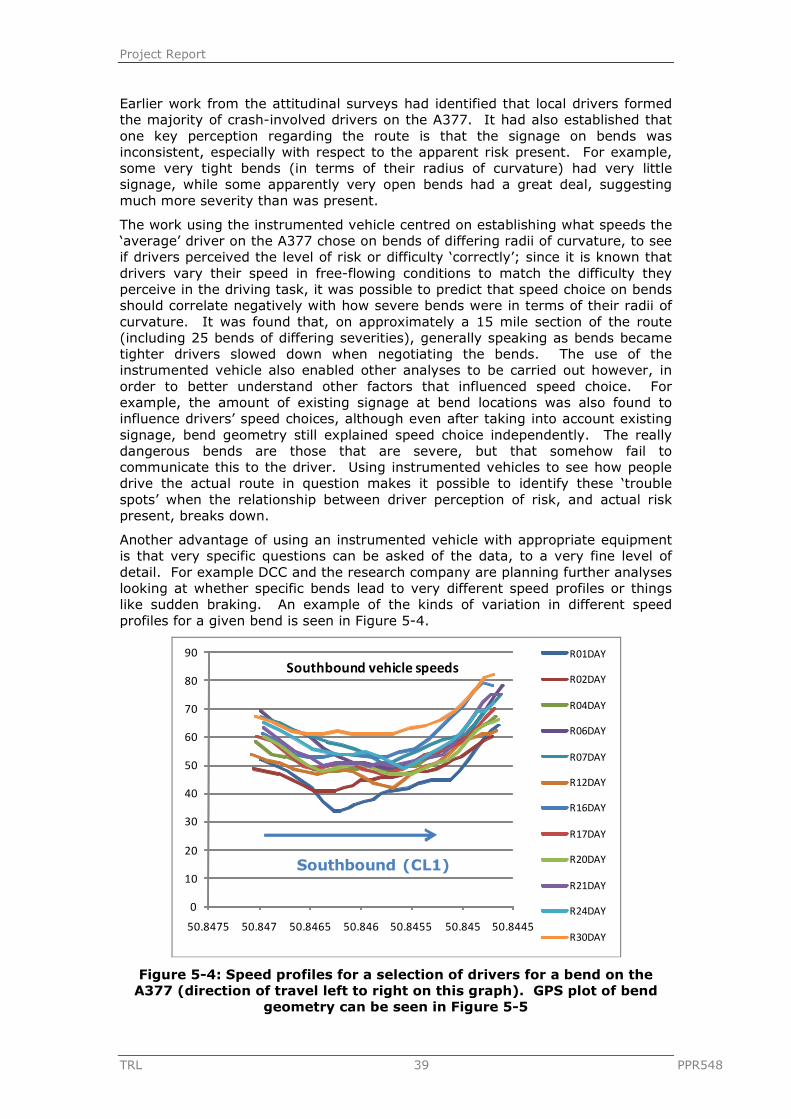
Project Report
TRL 39 PPR548
Earlier work from the attitudinal surveys had identified that local drivers formed the majority of crash-involved drivers on the A377. It had also established that one key perception regarding the route is that the signage on bends was inconsistent, especially with respect to the apparent risk present. For example, some very tight bends (in terms of their radius of curvature) had very little signage, while some apparently very open bends had a great deal, suggesting much more severity than was present.
The work using the instrumented vehicle centred on establishing what speeds the ‘average’ driver on the A377 chose on bends of differing radii of curvature, to see if drivers perceived the level of risk or difficulty ‘correctly’; since it is known that drivers vary their speed in free-flowing conditions to match the difficulty they perceive in the driving task, it was possible to predict that speed choice on bends should correlate negatively with how severe bends were in terms of their radii of curvature. It was found that, on approximately a 15 mile section of the route (including 25 bends of differing severities), generally speaking as bends became tighter drivers slowed down when negotiating the bends. The use of the instrumented vehicle also enabled other analyses to be carried out however, in order to better understand other factors that influenced speed choice. For example, the amount of existing signage at bend locations was also found to influence drivers’ speed choices, although even after taking into account existing signage, bend geometry still explained speed choice independently. The really dangerous bends are those that are severe, but that somehow fail to communicate this to the driver. Using instrumented vehicles to see how people drive the actual route in question makes it possible to identify these ‘trouble spots’ when the relationship between driver perception of risk, and actual risk present, breaks down.
Another advantage of using an instrumented vehicle with appropriate equipment is that very specific questions can be asked of the data, to a very fine level of detail. For example DCC and the research company are planning further analyses looking at whether specific bends lead to very different speed profiles or things like sudden braking. An example of the kinds of variation in different speed profiles for a given bend is seen in Figure 5-4.
0
10
20
30
40
50
60
70
80
90
50.844550.84550.845550.84650.846550.84750.8475
Southbound vehicle speedsR01DAY
R02DAY
R04DAY
R06DAY
R07DAY
R12DAY
R16DAY
R17DAY
R20DAY
R21DAY
R24DAY
R30DAY
Southbound (CL1)
Figure 5-4: Speed profiles for a selection of drivers for a bend on the A377 (direction of travel left to right on this graph). GPS plot of bend
geometry can be seen in Figure 5-5
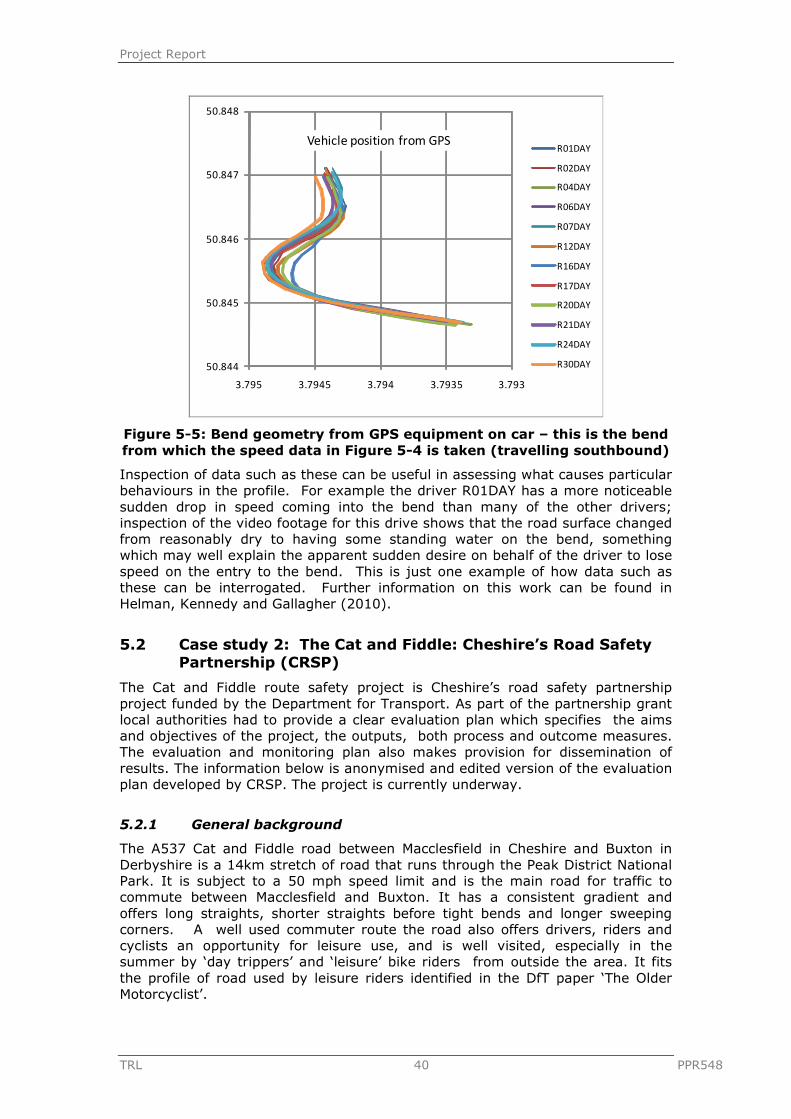
Project Report
TRL 40 PPR548
50.844
50.845
50.846
50.847
50.848
3.7933.79353.7943.79453.795
Vehicle position from GPSR01DAY
R02DAY
R04DAY
R06DAY
R07DAY
R12DAY
R16DAY
R17DAY
R20DAY
R21DAY
R24DAY
R30DAY
Figure 5-5: Bend geometry from GPS equipment on car – this is the bend from which the speed data in Figure 5-4 is taken (travelling southbound)
Inspection of data such as these can be useful in assessing what causes particular behaviours in the profile. For example the driver R01DAY has a more noticeable sudden drop in speed coming into the bend than many of the other drivers; inspection of the video footage for this drive shows that the road surface changed from reasonably dry to having some standing water on the bend, something which may well explain the apparent sudden desire on behalf of the driver to lose speed on the entry to the bend. This is just one example of how data such as these can be interrogated. Further information on this work can be found in Helman, Kennedy and Gallagher (2010).
5.2 Case study 2: The Cat and Fiddle: Cheshire’s Road Safety Partnership (CRSP)
The Cat and Fiddle route safety project is Cheshire’s road safety partnership project funded by the Department for Transport. As part of the partnership grant local authorities had to provide a clear evaluation plan which specifies the aims and objectives of the project, the outputs, both process and outcome measures. The evaluation and monitoring plan also makes provision for dissemination of results. The information below is anonymised and edited version of the evaluation plan developed by CRSP. The project is currently underway.
5.2.1 General background
The A537 Cat and Fiddle road between Macclesfield in Cheshire and Buxton in Derbyshire is a 14km stretch of road that runs through the Peak District National Park. It is subject to a 50 mph speed limit and is the main road for traffic to commute between Macclesfield and Buxton. It has a consistent gradient and offers long straights, shorter straights before tight bends and longer sweeping corners. A well used commuter route the road also offers drivers, riders and cyclists an opportunity for leisure use, and is well visited, especially in the summer by ‘day trippers’ and ‘leisure’ bike riders from outside the area. It fits the profile of road used by leisure riders identified in the DfT paper ‘The Older Motorcyclist’.

Project Report
TRL 41 PPR548
Named as the highest risk road in Great Britain in the 2008 Eurorap report, the Cat and Fiddle provides a consistent challenge to the Road Safety profession. Despite the fact the level of casualties on the road has fallen significantly since the mid 1990s there are still too many people killed and injured on the road.
The casualty data for the road since 2001 shows us:
• 13 KSI Casualties per year on average
• Motorcyclists account for 68% of the casualties
• Rider error is the single biggest factor for causation
• The majority of the casualties live outside the area so are not local
• They tend to be male, average 35 years old and ride bigger CC bikes
• All possible engineering measures have been considered and actually undertaken
• The route is seen as a race track with a significant number of riders exceeding the speed limit
• Casualties were seen to reduce when the road was subject to significant enforcement
5.2.2 Proposed intervention approach
The aim of the intervention was to make the Cat and Fiddle and surrounding roads safe to use, visit and enjoy. The specific objectives were to introduce average speed cameras along the Cat and Fiddle route to:
• Reduce the number of people killed and seriously injured on this road by 35%
• Reduce the number of people killed and seriously injured on high powered 2 wheelers in Cheshire by 10%
• Increase public confidence in our agencies’ response to these roads and make the public feel safer using this road
• Decrease the number of bikers who think that road death is inevitable
• Change the public preconception that the Cat and Fiddle is a race track
• Improve the road’s rating in the EuroRap Table The proposed intervention involves:
• Installation of average speed cameras along the full length of the A537
between Macclesfield and Buxton
• Proactive marketing of the Cat and Fiddle as a safe place to ride with no fear of race track riders providing a threatening environment
• Proactive policing of the roads and associated ‘leisure rider’ roads within the Macclesfield, Buxton and Leek Triangle in line with the National Motorcycle Enforcement Strategy
• Provide information to riders of the specific risks on riding the roads and provide tactics to mitigate those risks
• Undertake a wider communications plan to reduce the number of bikers who feel it is inevitable that people are killed or seriously injured on our roads

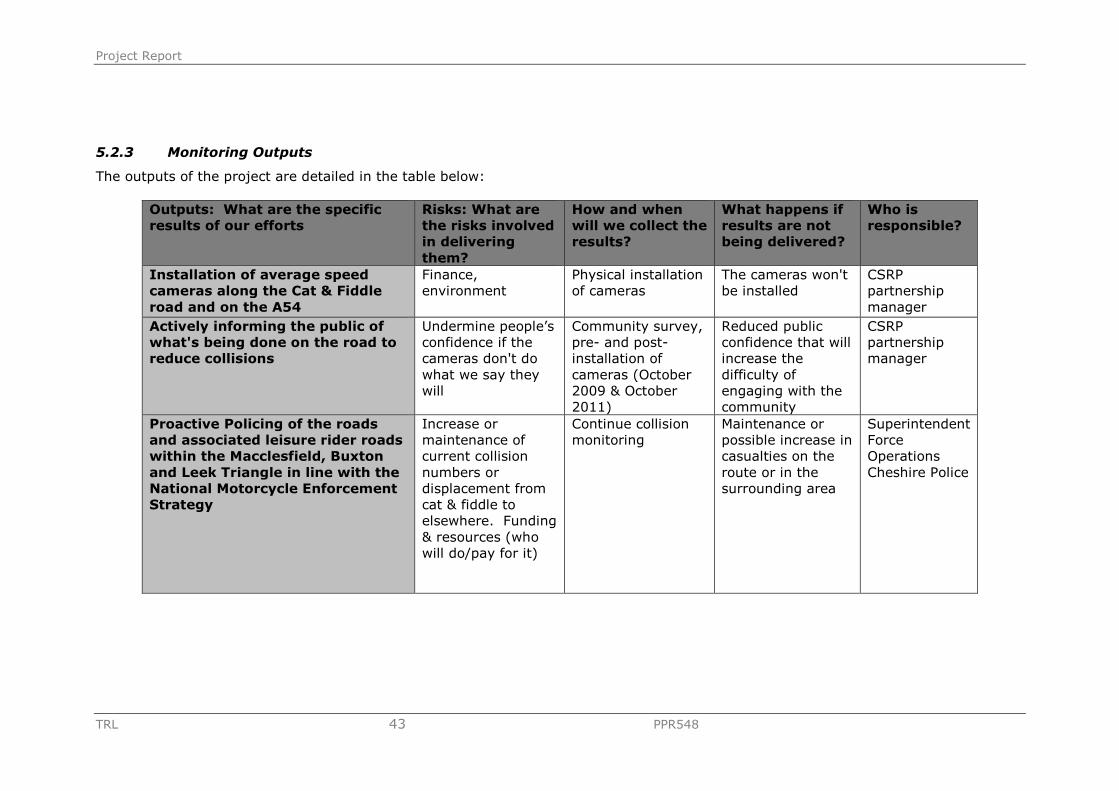
Project Report
TRL 43 PPR548
5.2.3 Monitoring Outputs
The outputs of the project are detailed in the table below:
Outputs: What are the specificresults of our efforts
Risks: What arethe risks involvedin deliveringthem?
How and whenwill we collect theresults?
What happens ifresults are notbeing delivered?
Who isresponsible?
Installation of average speedcameras along the Cat & Fiddleroad and on the A54
Finance,environment
Physical installationof cameras
The cameras won'tbe installed
CSRPpartnershipmanager
Actively informing the public ofwhat's being done on the road toreduce collisions
Undermine people’sconfidence if thecameras don't dowhat we say theywill
Community survey,pre- and post-installation ofcameras (October2009 & October2011)
Reduced publicconfidence that willincrease thedifficulty ofengaging with thecommunity
CSRPpartnershipmanager
Proactive Policing of the roadsand associated leisure rider roadswithin the Macclesfield, Buxtonand Leek Triangle in line with theNational Motorcycle EnforcementStrategy
Increase ormaintenance ofcurrent collisionnumbers ordisplacement fromcat & fiddle toelsewhere. Funding& resources (whowill do/pay for it)
Continue collisionmonitoring
Maintenance orpossible increase incasualties on theroute or in thesurrounding area
SuperintendentForceOperationsCheshire Police
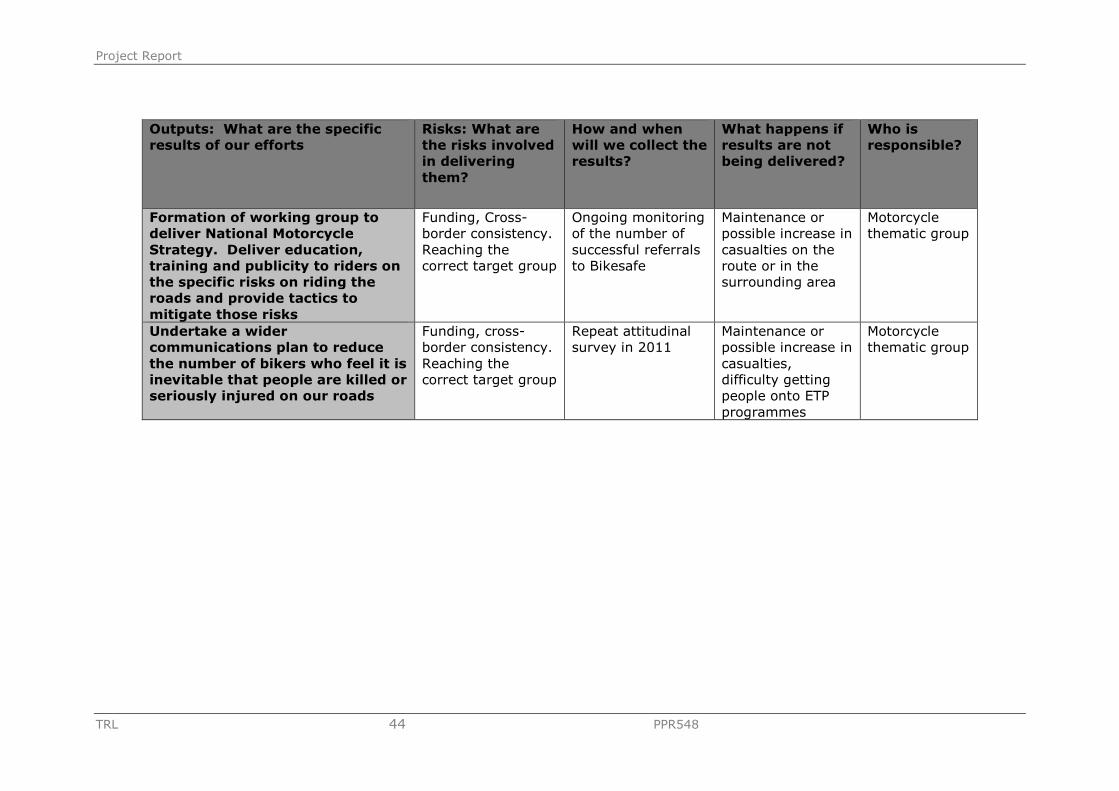
Project Report
TRL 44 PPR548
Outputs: What are the specificresults of our efforts
Risks: What arethe risks involvedin deliveringthem?
How and whenwill we collect theresults?
What happens ifresults are notbeing delivered?
Who isresponsible?
Formation of working group todeliver National MotorcycleStrategy. Deliver education,training and publicity to riders onthe specific risks on riding theroads and provide tactics tomitigate those risks
Funding, Cross-border consistency.Reaching thecorrect target group
Ongoing monitoringof the number ofsuccessful referralsto Bikesafe
Maintenance orpossible increase incasualties on theroute or in thesurrounding area
Motorcyclethematic group
Undertake a widercommunications plan to reducethe number of bikers who feel it isinevitable that people are killed orseriously injured on our roads
Funding, cross-border consistency.Reaching thecorrect target group
Repeat attitudinalsurvey in 2011
Maintenance orpossible increase incasualties,difficulty gettingpeople onto ETPprogrammes
Motorcyclethematic group

Project Report
TRL 45 PPR548
5.2.4 Assessing Outcomes
A successful outcome to the project was defined as a reduction in the number of KSI casualties on the Cat & Fiddle, whilst not dispersingthe casualties elsewhere across the county. Additionally an increase in public confidence in our ability to reduce casualties and make theroad a safer place to use and a reduction in the number of bikers who think that road death is inevitable would indicate a successfuloutcome. Below are the key indicators for the project:
Indicator How will we collect data?When will wecollect data? Comments
Who'sresponsible
35% reduction in KSIs on theCat & Fiddle
Data are already collected aspart of Stats 19
Ongoingcollection, yearlyreview
3 yr rolling average ofKSIs. Baseline period2006–2008 with anannual average of 13KSIs
IntelligenceAnalyst
10% reduction in motorcyclecasualties in Cheshire
Data are already collected aspart of Stats 19
Ongoingcollection, yearlyreview
3 yr rolling average ofKSIs. Baseline period2006–2008 with anannual average of 154KSIs
IntelligenceAnalyst
A reduction in average speedto below the 50mph speedlimit
Data are already collectedvia a permanent loop on theDerbyshire side of the routeGrid Ref: 401990371003
Monthly collection,yearly review
Both short-term & long-term monitoring
Provided toIntelligenceAnalyst
A reduction in 85thpercentile speed to 50mph
Data are already collectedvia a permanent loop on theDerbyshire side of the routeGrid Ref: 401990371003
Monthly collection,yearly review
Both short-term & long-term monitoring toensure the camerasmaintain any effect theyhave
Provided toIntelligenceAnalyst
A 10% reduction in thenumber of people feelingfairly or very unsafe whenthey use the A537
Local residents telephonesurvey—400 residents
Prior toinstallation and bi-annuallythereafter
Cn research will carry outcommunity survey
CSRPProjectmanager

Project Report
TRL 46 PPR548
Indicator How will we collect data?When will wecollect data? Comments
Who isresponsible
A 10% reduction in thenumber of people that saythere is an issue with thedanger of speedingmotorbikes on the Cat &Fiddle
Local residents telephonesurvey—400 residents
Prior toinstallation and bi-annuallythereafter
Cn research will carry outcommunity survey
CSRPProjectmanager
A 10% reduction in thenumber of high poweredbikers who thought it wasinevitable that people die onthe roads
Community motorcyclingsurvey
Prior toinstallation and bi-annuallythereafter
Baseline completedNovember 08
CSRPProjectmanager
Remove the Cat & Fiddle roadfrom number 1 in theEurorap ratings
Data are already collected aspart of Stats 19. Analysis iscarried out by Eurorap
Ongoing Rating is based on 3years’ of figures with2009 ratings based on2005–2007, therefore thefull impact of the projectwill only be realised inthe 2014 report
N/A

Project Report
TRL 47 PPR548
5.2.5 Capturing Learning
The table below identifies the key questions that CRSP felt they needed to ask to ensure we develop the way they work together inpartnership in the future:
Evaluation Questions Who do we needto ask
What do we need to ask How will wecollect the data
When? Who isresponsible?
Was the projectcompleted on schedule?If not why not?
CSRP manager What were the barriers?How were they overcome?What could we learn fromit? Did we have asufficient risk managementstrategy? Was the planrealistic?
End stage report &closure report
End ofstage &end ofproject
CSRPManager
What the projectcompleted on budget? Ifnot why not?
CSRP Manger What were the barriers?How were they overcome?What could we learn fromit?
End stage report &closure report
End ofstage &end ofproject
CSRPManager
Has the project met thetargets set? If not whynot?
CSRPmanager/dataanalyst
What targets haven't beenmet? By what extent?Why? Can anything bedone to aid meeting thetarget?
End stage report &closure report
End ofstage &end ofproject
Data analyst
Have there been anyunintendedconsequences of theproject? E.g.displacement ofcasualties to elsewhere
Project board/Dataanalyst/Key stakeholders
What unintendedconsequences haveoccurred? Why/how has ithappened? What impactwill it have? Is itdetrimental, if so what canbe done to reduce theimpact?
End stage report &closure report &environmentalscan
End ofstage &end ofproject
Data analyst

Project Report
TRL 48 PPR548
Evaluation Questions Who do we needto ask
What do we need to ask How will wecollect the data
When? Who isresponsible?
Were there anyunexpected benefitsdelivered that weren'tanticipated?
Project board/Dataanalyst/Key stakeholders
What unexpected benefitshave occurred? Why/howhas it happened? Whatimpact will it have?
End stage report &closure report &environmentalscan
End ofstage &end ofproject
Data analyst
Are there any unexpectedexterior variablesimpacting on the project?
Project board/Dataanalyst/Key stakeholders
What exterior variableshave impacted on theproject? Why/how has ithappened? What level ofimpact has it had? Is itdetrimental, if so what canbe done to reduce theimpact?
End stage report &closure report &environmentalscan
End ofstage &end ofproject
Data analyst
Has the partnershipworked effectivelytogether? If so why? Ifnot why not?
Project board What were the barriers?How were they overcome?What could we learn fromit?
Learning log End ofproject
CSRPManager
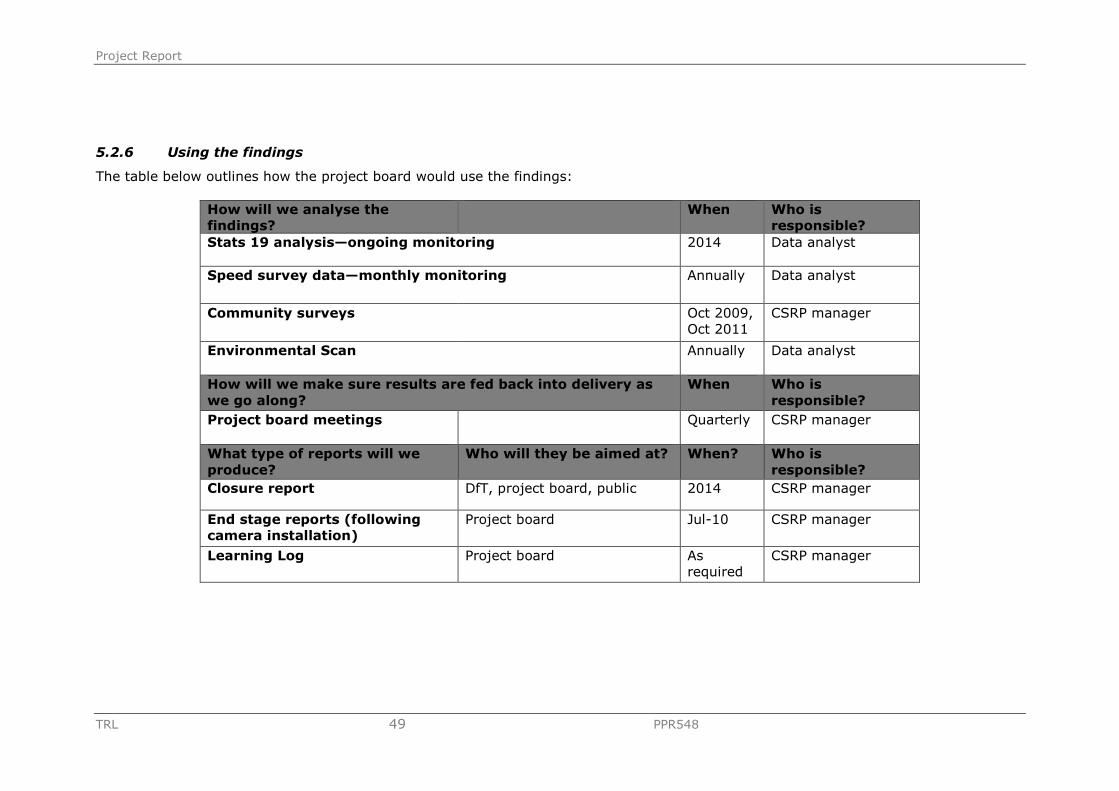
Project Report
TRL 49 PPR548
5.2.6 Using the findings
The table below outlines how the project board would use the findings:
How will we analyse thefindings?
When Who isresponsible?
Stats 19 analysis—ongoing monitoring 2014 Data analyst
Speed survey data—monthly monitoring Annually Data analyst
Community surveys Oct 2009,Oct 2011
CSRP manager
Environmental Scan Annually Data analyst
How will we make sure results are fed back into delivery aswe go along?
When Who isresponsible?
Project board meetings Quarterly CSRP manager
What type of reports will weproduce?
Who will they be aimed at? When? Who isresponsible?
Closure report DfT, project board, public 2014 CSRP manager
End stage reports (followingcamera installation)
Project board Jul-10 CSRP manager
Learning Log Project board Asrequired
CSRP manager

Project Report
TRL 51 PPR548
5.3 Other useful resources
There a numerous resources that can be consulted regarding the evaluation of road safety schemes in general. These are listed here for completeness.
5.3.1 DfT/RoSPA toolkit
DfT and RoSPA have created an evaluation toolkit (‘E-valu-it’) to go live online from October 2010. The URL is www.roadsafetyevaluation.com
The toolkit is designed to assist users to design evaluations that are specific, measurable, achievable, realistic and time based (SMART) through having them answer questions about their project, including its aims and objectives, who it is designed to benefit, and various other aspects of the scheme. The toolkit offers advice on which options are best suited to a given scheme, based on these answers. In addition, it is hoped that users will be able to enter the results of their evaluations in a database on the website, so that others can share and learn from previous evaluations.
5.3.2 DfT resources
The Department for Transport provides general guidance on evaluation here: http://www.dft.gov.uk/pgr/evaluation/evaluationlinks
The ‘measuring effectiveness’ section of the road user safety good practice guide provides some useful information on evaluation. The guide overall is designed to be used as a resource for all those interested in road safety, and the chapter on measuring effectiveness seeks to provide advice on how effectiveness can be monitored on a scheme-by-scheme basis. It covers many of the issues covered in this report, and is a useful resource for further reading around the issue of evaluation. It is archived at: http://webarchive.nationalarchives.gov.uk/+/http://www.dft.gov.uk/pgr/roadsafety/laguidance/roadsafetygoodpracticeguide?page=6
Note however that at the time of this report being published, the appendices for this resource are not available in the archived link above. Therefore .pdf documents have been made available on the ADEPT website at these links: http://www.adeptnet.org.uk/assets/userfiles/documents/000283.pdf
http://www.adeptnet.org.uk/assets/userfiles/documents/000284.pdf
http://www.adeptnet.org.uk/assets/userfiles/documents/000285.pdf
DfT has produced recent guidance for evaluators to help choose an evaluation approach to achieve better attribution of effectiveness to interventions rather than confounding factors. http://www.dft.gov.uk/pgr/evaluation/evaluationguidance/transportimpact/
Another relevant resource is a review of health behaviour interventions from other related domains. http://www.dft.gov.uk/pgr/roadsafety/research/rsrr/theme3/inventionmodalities.pdf

Project Report
TRL 52 PPR548
6 Conclusions
The conclusion of the report authors is that, as with all road safety approaches, if spending on route safety schemes is to be justified then sound evaluation of their effectiveness is essential. Such evaluation should include measuring the ability of those interventions to change the behavioural variables targeted by route safety schemes; this will enable understanding of which schemes work, which ones do not, and why.
This report was designed to serve as guidance for practitioners on the evaluation of route safety schemes using behavioural measures. In the report, various behaviours have been identified for which there is some evidence of a link to accident risk. Methods by which these behaviours can be measured have also been given, along with an indication of the ease or difficulty of measurement. Design principles that are important for the scientific robustness of evaluations in route safety have been discussed and good practice examples given.
The accompanying short guidance document that summarises the contents of this report (http://www.adeptnet.org.uk/assets/userfiles/documents/000281.pdf), and this report itself, should be used as a starting point for understanding how to achieve a robust evaluation of route safety schemes.
Project Report
TRL 53 PPR548
References Aarts, L., and van Schagen, I. (2006). Driving speed and the risk of road crashes:
A review. Accident Analysis and Prevention 38, 215–224.
Aberg, L. (1993). Drinking and driving: Intentions, attitudes and social norms of Swedish male drivers, Accident Analysis and Prevention, 25, 289–296.
Ben-Yaacov, A., Malz, M., and Shinar, D. (2002). Effects of an in-vehicle collision avoidance warning system on short-and long-term driving performance. Human Factors, 44, 335–342.
Broughton, J., (2006). The Correlation between Motoring Offences and Other Types of Offence (TRL650). Crowthorne: Transport Research Laboratory.
Broughton, J., Baughan, C., Pearce, L., Smith, L., and Buckle G. (2003). Work-related road accidents, Prepared for Road Safety Division, Department for Transport (TRL582). Crowthorne: Transport Research Laboratory. http://www.orsa.org.uk/guidance/pdfs/trl582.pdf
Chalmers, I. (2003). Trying to do more good than harm in policy and practice: The role of rigorous, transparent, up-to-date evaluations. Annals of the American Academy of Political and Social Science, 589, 22–40.
Christie, N., Kimberlee, R., Lyons, R.A., Towner, E.M.L., and Ward, H. (2008) Ethnicity, deprivation and road traffic injury risk: a survey of risk and road safety and implications for injury prevention. International Journal of Health Promotion and Education, 46(4), 133–138.
Christmas, S. et al. (2008). Strapping yarns: Why people do and do not wear seat belts. Department for Transport: London.
Clarke, D., Ward, P. J. and Jones, J. (1999). Processes and countermeasures in overtaking road accidents, Ergonomics, 42(6), 846–867.
Clarke, D., Ward, P., Truman, W., and Bartle, C. (2008). A poor way to die: social deprivation and road traffic fatalities. Paper presented at the Department for Transport Behavioural Studies Seminar.
Cooper P. J., and Zheng, Y. (2002). Turning gap acceptance decision-making: The impact of driver distraction. Journal of Safety Research, 33(1), 321–335.
Davies, R. M., and Pless, B. (2001). BMJ bans accidents: accidents are not unpredictable. British Medical Journal, 322, 1321–1322.
Delaney, A., Ward, H., and Cameron, M. (2005). The history and development of speed camera use. Monash University Accident Research Centre, Report No. 242.
Delhomme, P., Truls, V., Thierry, M., Harland, G., Goldenbeld, C., Stina, J., Christie, N and Vlasta, R. (1999). GADGET Deliverable 4 - Evaluated road safety media campaigns: an overview of 265 evaluated campaigns and some meta-analysis on accidents. Arceuil, INRETS.
Dimmer A. R., and Parker, D. (1999). The accidents, attitudes and behaviour of company car drivers. In: G.B. Grayson (Ed.) Behavioural Research in Road Safety IX. Crowthorne: Transport Research Laboratory.
Elvik, R., and Vaa, T (2004). The Handbook of road safety measures. Elsevier.
Evans, L., and Wasielewski, P. (1983). Risky driving related to driver and vehicle characteristics. Accident Analysis and Prevention, 15, 121–136.
Finch, D. J., Kompfner, P., Lockwood, C. R., and Maycock, G. (1994). Speed, speed limits and crashes. Project Record S211G/RB/Project Report PR58. Crowthorne: Transport Research Laboratory.

Project Report
TRL 54 PPR548
Gerbers, M. A. & Peck, R. C. (2003). Using traffic conviction correlates to identify high accident-risk drivers. Accident Analysis and Prevention, 35, 903–912.
Gunay, B., and Woodford, D. (2007). Lateral position of traffic negotiating horizontal bends. Proceedings of the Institution of Civil Engineers Transport, 160(Issue TR1) 1–11.
Hartley, L. R. (2004). Fatigue and driving. In T. Rothengatter and R Huguenin, (Eds.) Traffic and Transport Psychology, Amsterdam: Elsevier. 221–230.
Hauer, E. (2007). A case for evidence-based road safety delivery. American Automobile Association Foundation for Traffic Safety.
Hawkes, A. G. (1968). Gap-acceptance in road traffic. Journal of Applied Probability, 5(1), 84–92.
Hegeman, G. (2004). Overtaking prohibition safety effects on two lane rural roads. Proceedings of the 17th Ictct Workshop, Tartu, Estonia, October 2004.
Helman, S., Grayson, G., and Parkes, A. M. (2010). How can we produce safer new drivers? A review of the effects of experience, training, and limiting exposure on the collision risk of new drivers. TRL Insight Report INS005. Crowthorne: Transport Research Laboratory.
Helman, S., Kennedy, J., and Gallagher, A. (2010). Bend treatments on the A377 between Cowley and Bishops Tawton: final report (PPR494). Crowthorne: Transport Research Laboratory.
Horne, J. A., and Reyner, L. A. (1995). Sleep-related vehicle accidents. British Medical Journal, 310, 565–567.
Hull, M. A., and Christie, R. J. (1993). The hazard perception test: the Geelong trial and future developments. VicRoads Report GR 93–113.
Iversen, H., and Torbjørn, R. (2004). Attitudes towards traffic safety, driving behaviour and accident involvement among the Norwegian public. Ergonomics, 47(5), 555–572
Jenness, J. W., Lattanzio, R. J., O’Toole, M., and Taylor, N. (2002). Voice-activated dialling or eating a cheeseburger: Which is more distracting during simulated driving? Proceedings of the Human Factors and Ergonomics Society 46th Annual Meeting. Pittsburgh, PA.
Knox, D., Turner, B., Silcock, D., Silcock, B. R., and Beuret, K. (2003). Research into Unlicensed Driving. Road Safety Research Report No. 48. London: Department for Transport.
Lawton, B., Helman, S., and Summersgill, I. (2008). Route safety management and evaluation (CPR328). Crowthorne: Transport Research Laboratory.
Lawton, B., Helman, S., and Summersgill, I. (2009). Route safety management and evaluation guide (PPR398). Crowthorne: Transport Research Laboratory.
Lynn, P. and Lockwood, C. R. (1998). The Accident Liability of Company Car Drivers (TRL317). Crowthorne: Transport Research Laboratory.
Maycock, G. (1996). Sleepiness and driving: the experience of UK car drivers. Journal of Sleep Research, 5, 229–237.
McKenna, F. P. (2007) Road Traffic accidents: human factors. In S Ayers, A. Baum, C. McManus, S. Newman, K. Wallston, J. Weinman & R. West (Eds.) Cambridge Handbook of Psychology Health and Medicine. Cambridge University Press.

Project Report
TRL 55 PPR548
McKenna, F. P. (2008). What factors are involved in crashes, how do we measure them and what shall we do about them? In L. Dorn (Ed.) Driver Behaviour and Training vol 3. Ashgate
McKenna, F. P. (2010). Education in road safety. Are we getting it right? Report number 10/113. RAC Foundation.
McKenna, F. P., and Crick, J. (1994). Hazard perception in drivers: A methodology for testing and training (TRL 313). Crowthorne: Transport Research Laboratory.
McKenna, F. P. and Farrand, P. (1999) The role of automaticity in driving. In G.B. Grayson (Ed.) Behavioural Research in Road Safety IX, Crowthorne: Transport Research Laboratory.
McKenna, F. P. and Horswill, M. S. (1999). Hazard Perception and its relevance for driver licensing. IATTS Research, 23, 36–41.
Moskowitz, H. (2006). Variability among epidemiological studies of drugs and driving. Transportation Research Circular.
Nabi, H., Salmi, L. R., Lafont, S., Chiron, M., Zins, M., and Lagarde, E. (2007). Attitudes associated with behavioral predictors of serious road traffic crashes: results from the GAZEL cohort. Injury Prevention, 13, 26–31. doi: 10.1136/ip.2006.013342.
OECD (1999). Safety Strategies for Rural Roads. Road Transport and Intermodal Research report, Organisation for Economic Co-operation and Development, Paris.
OECD (2008). Towards Zero: Ambitious road safety targets and the safe system approach. OECD.
Parker, D., Reason, J., Manstead, A. M., and Stradling, S. G. (1995) Driving errors, driving violations and accident involvement. Ergonomics, 38(5), 1036–1048.
Parker, D., Stradling, S. G., and Manstead, A. (1996). Modifying beliefs and attitudes to exceeding the speed limit: An intervention study based on the theory of planned behaviour. Journal of Applied Social Psychology, 26, 1–19.
Petrosino, A., Turpin-Petrosino, C., and Buehler, J. (2004). Scared Straight and other juvenile awareness programs for preventing juvenile delinquency. Campbell Systematic Reviews.
Quimby, A. R., Maycock, G., Carter, L. D., Dixon, R. and Wall, J. G. (1986). Perceptual abilities of accident involved drivers. TRRL Report RR27. Crowthorne: Transport and Road Research Laboratory.
Redelmeier, D. A., and Tibshirani, R. J. (1997). Association between cellular-telephone calls and motor vehicle accidents. New England Journal of Medicine, 336, 453–502.
Richter, E. D., Berman, T., Friedman, L., and Ben-David, G. (2006). Speed, road injury, and public health. Annual Review of Public Health, 27, 125–152.
Roberts, I., Kwan., I and the Cochrane Injuries Group Driver Education Reviewers (2001). School-based driver education for the prevention of traffic crashes. Cochrane Database of Systematic Reviews 2001, Issue 3. Art. No.: CD003201. DOI: 10.1002/14651858.CD003201.
RRCGB (2008). Reported Road Casualties Great Britain. Department of Transport.
Rumar, K. (1990). The basic driver error: Late detection. Ergonomics, 33, 1281–1290.

Project Report
TRL 56 PPR548
Scottish Government (2009). Go Safe on Scotland's roads - it's everyone's responsibility – Scotland’s Road Safety Framework to 2020, Edinburgh: Scottish Government. Retrieved April 2010 from the World Wide Web: http://www.scotland.gov.uk/Resource/Doc/274654/0082190.pdf
Steyvers, F., and de Waard, D. (2000). Road edge delineation in rural areas: effects on driving behaviour. Ergonomics, 43(2). 223–238.
Stutts, J. C., Reinfurt, D. W., Staplin, L., and Rodgman, E. A. (2001). The role of driver distraction in traffic crashes. Report prepared for AAA Foundation for Traffic Safety, Washington, DC.
Stutts, J. C, Wilkins, J. W. Osberg, J. S., and Vaughn, (2003). Driver risk factors for sleep-related crashes. Accident Analysis and Prevention, 35, 321–331.
Wahlberg, A. (2007). Long term prediction of traffic accident record from bus driver celeration behaviour. International Journal of Occupational Safety and Ergonomics, 13, 159–171.
Wells, P., Tong, S., Sexton, B., Grayson, G. and Jones, E. (2008). Cohort II: a study of learner and new drivers. Volume 1: main report. Road Safety Research Report No. 81. London: Department for Transport (DfT).
Wennergren, G., Alm, B., Oyen, N., Helweg-Larsen, K., Milerad, J., Skjaerven, R., Norvenius, S. G., Lagercrantz, H., Wennborg, M., Daltveit, A. K., Markestad, T., and Irgens, L. M. (1997). The decline in the incidence of SIDS in Scandinavia and its relation to risk-intervention campaigns. Acta Paediatrica, 86, 963–968.
West, R., French, D., Kemp, R. and Elander, J. (1993). Direct observation of driving, self reports of driver behaviour, and accident involvement, Ergonomics, 5, 557–567.
Zador, P., Krawchuk, S. A., and Voas, R. B. (2000). Relative risk of fatal crash involvement by BAC, age and gender. National Highway Traffic Safety Administration. DOT HS 809 050.
Zwicker, T., Preusser, D., and Compton, R. (2006). Risks posed by drugs in traffic: Incidence and crash risk of drug impaired driving. In Drugs and Traffic Transportation Research Board of the National Academies, 27–36.
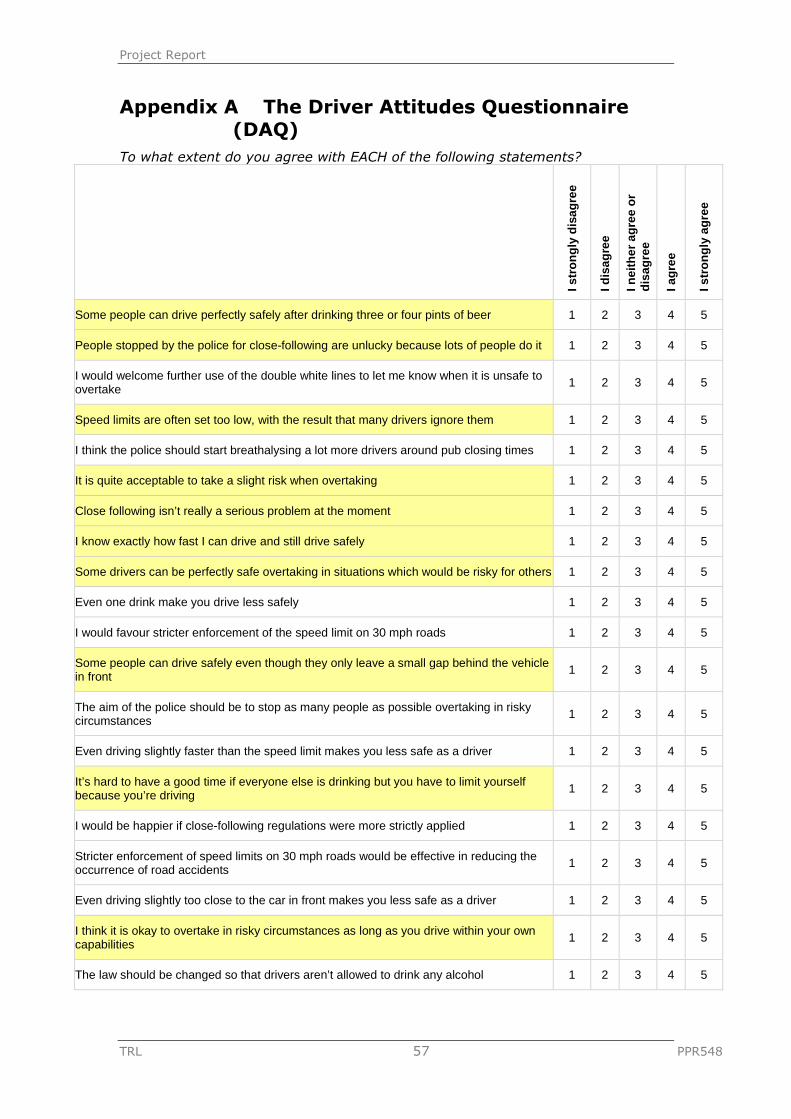
Project Report
TRL 57 PPR548
Appendix A The Driver Attitudes Questionnaire (DAQ)
To what extent do you agree with EACH of the following statements?
Istr
on
gly
dis
agre
e
Idis
agre
e
Inei
ther
agre
eo
rd
isag
ree
Iag
ree
Istr
on
gly
agre
e
Some people can drive perfectly safely after drinking three or four pints of beer 1 2 3 4 5
People stopped by the police for close-following are unlucky because lots of people do it 1 2 3 4 5
I would welcome further use of the double white lines to let me know when it is unsafe toovertake 1 2 3 4 5
Speed limits are often set too low, with the result that many drivers ignore them 1 2 3 4 5
I think the police should start breathalysing a lot more drivers around pub closing times 1 2 3 4 5
It is quite acceptable to take a slight risk when overtaking 1 2 3 4 5
Close following isn’t really a serious problem at the moment 1 2 3 4 5
I know exactly how fast I can drive and still drive safely 1 2 3 4 5
Some drivers can be perfectly safe overtaking in situations which would be risky for others 1 2 3 4 5
Even one drink make you drive less safely 1 2 3 4 5
I would favour stricter enforcement of the speed limit on 30 mph roads 1 2 3 4 5
Some people can drive safely even though they only leave a small gap behind the vehiclein front 1 2 3 4 5
The aim of the police should be to stop as many people as possible overtaking in riskycircumstances 1 2 3 4 5
Even driving slightly faster than the speed limit makes you less safe as a driver 1 2 3 4 5
It’s hard to have a good time if everyone else is drinking but you have to limit yourselfbecause you’re driving 1 2 3 4 5
I would be happier if close-following regulations were more strictly applied 1 2 3 4 5
Stricter enforcement of speed limits on 30 mph roads would be effective in reducing theoccurrence of road accidents 1 2 3 4 5
Even driving slightly too close to the car in front makes you less safe as a driver 1 2 3 4 5
I think it is okay to overtake in risky circumstances as long as you drive within your owncapabilities 1 2 3 4 5
The law should be changed so that drivers aren’t allowed to drink any alcohol 1 2 3 4 5
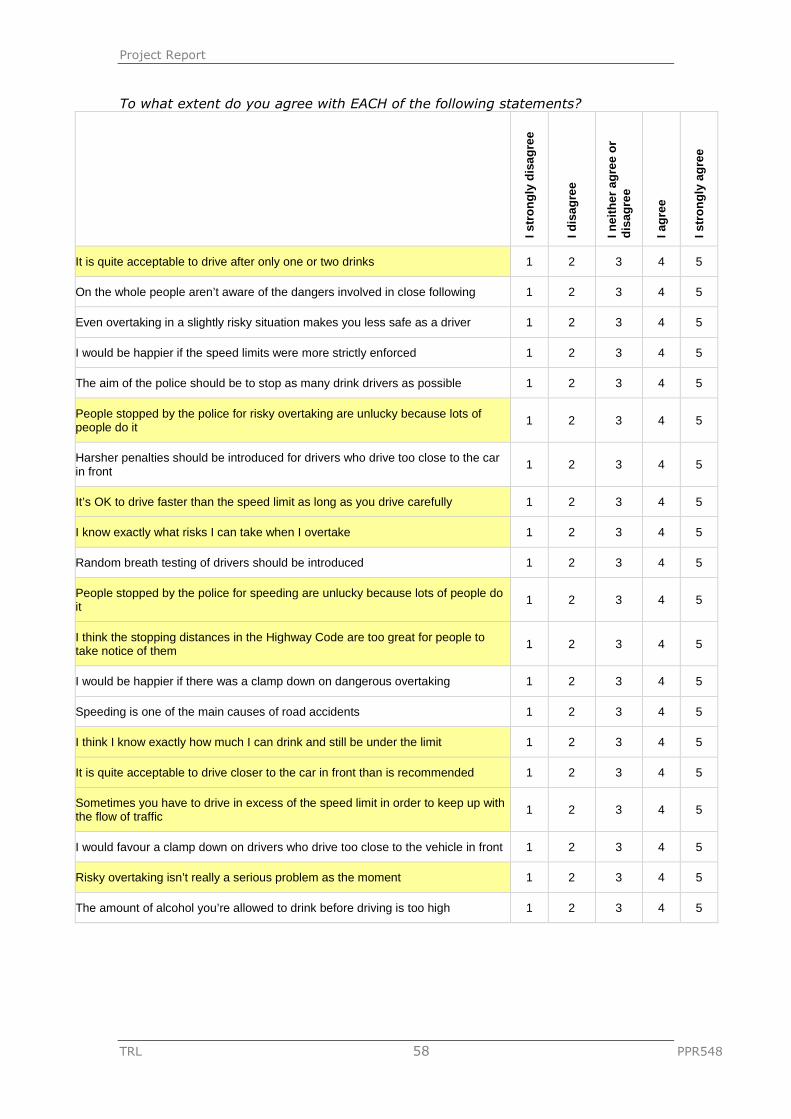
Project Report
TRL 58 PPR548
To what extent do you agree with EACH of the following statements?
Istr
on
gly
dis
agre
e
Idis
agre
e
Inei
ther
agre
eo
rd
isag
ree
Iag
ree
Istr
on
gly
agre
e
It is quite acceptable to drive after only one or two drinks 1 2 3 4 5
On the whole people aren’t aware of the dangers involved in close following 1 2 3 4 5
Even overtaking in a slightly risky situation makes you less safe as a driver 1 2 3 4 5
I would be happier if the speed limits were more strictly enforced 1 2 3 4 5
The aim of the police should be to stop as many drink drivers as possible 1 2 3 4 5
People stopped by the police for risky overtaking are unlucky because lots ofpeople do it 1 2 3 4 5
Harsher penalties should be introduced for drivers who drive too close to the carin front
1 2 3 4 5
It’s OK to drive faster than the speed limit as long as you drive carefully 1 2 3 4 5
I know exactly what risks I can take when I overtake 1 2 3 4 5
Random breath testing of drivers should be introduced 1 2 3 4 5
People stopped by the police for speeding are unlucky because lots of people doit 1 2 3 4 5
I think the stopping distances in the Highway Code are too great for people totake notice of them 1 2 3 4 5
I would be happier if there was a clamp down on dangerous overtaking 1 2 3 4 5
Speeding is one of the main causes of road accidents 1 2 3 4 5
I think I know exactly how much I can drink and still be under the limit 1 2 3 4 5
It is quite acceptable to drive closer to the car in front than is recommended 1 2 3 4 5
Sometimes you have to drive in excess of the speed limit in order to keep up withthe flow of traffic 1 2 3 4 5
I would favour a clamp down on drivers who drive too close to the vehicle in front 1 2 3 4 5
Risky overtaking isn’t really a serious problem as the moment 1 2 3 4 5
The amount of alcohol you’re allowed to drink before driving is too high 1 2 3 4 5

Project Report
TRL 59 PPR548
A.1 Scoring instructions for DAQ:
Some items have to be reverse-coded: 1 = 52 = 43 = 34 = 25 = 1
These questions are marked with a yellow background in the above DAQ questionnaires [Remove the yellow background when using the questionnaire]. After the reverse coding, a mean score can be calculated across all participants.
A.2 Proposed ‘mobile phone’ section for the DAQ:
To what extent do you agree with EACH of the following statements?
Istr
on
gly
dis
agre
e
Idis
agre
e
Inei
ther
agre
eo
rd
isag
ree
Iag
ree
Istr
on
gly
agre
e
People stopped by the police for using a mobile phone whilst driving are unluckybecause lots of people do it 1 2 3 4 5
Using a mobile phone whilst driving isn’t really a serious problem at the moment 1 2 3 4 5
Some people can drive safely even when they are using a mobile phone at thesame time 1 2 3 4 5
I would be happier if the regulations on using a mobile phone whilst driving weremore strictly applied 1 2 3 4 5
Even talking on a mobile phone for a short time makes you less safe as a driver 1 2 3 4 5
On the whole people aren’t aware of the dangers involved in using a mobilephone when driving 1 2 3 4 5
Harsher penalties should be introduced for drivers who use a mobile phone whendriving 1 2 3 4 5
I think that people don’t really take any notice of the risks of using a mobile phonewhen driving 1 2 3 4 5
It is quite acceptable to use a mobile phone whilst driving 1 2 3 4 5
I would favour a clamp down on drivers who use their mobile phone whilst driving 1 2 3 4 5
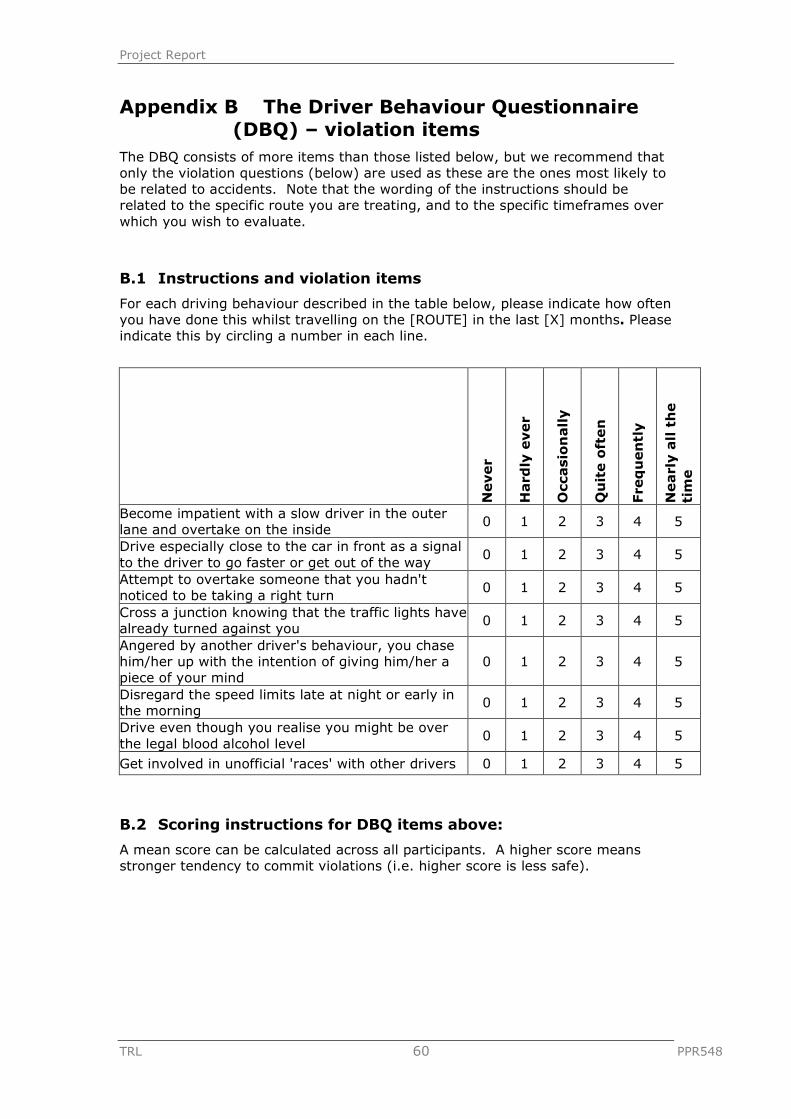
Project Report
TRL 60 PPR548
Appendix B The Driver Behaviour Questionnaire (DBQ) – violation items
The DBQ consists of more items than those listed below, but we recommend that only the violation questions (below) are used as these are the ones most likely to be related to accidents. Note that the wording of the instructions should be related to the specific route you are treating, and to the specific timeframes over which you wish to evaluate.
B.1 Instructions and violation items
For each driving behaviour described in the table below, please indicate how often you have done this whilst travelling on the [ROUTE] in the last [X] months. Please indicate this by circling a number in each line.
Never
Hard
lyever
Occ
asi
on
all
y
Qu
ite
oft
en
Fre
qu
en
tly
Nearl
yall
the
tim
e
Become impatient with a slow driver in the outer lane and overtake on the inside
0 1 2 3 4 5
Drive especially close to the car in front as a signal to the driver to go faster or get out of the way
0 1 2 3 4 5
Attempt to overtake someone that you hadn't noticed to be taking a right turn
0 1 2 3 4 5
Cross a junction knowing that the traffic lights have already turned against you
0 1 2 3 4 5
Angered by another driver's behaviour, you chase him/her up with the intention of giving him/her a piece of your mind
0 1 2 3 4 5
Disregard the speed limits late at night or early in the morning
0 1 2 3 4 5
Drive even though you realise you might be over the legal blood alcohol level
0 1 2 3 4 5
Get involved in unofficial 'races' with other drivers 0 1 2 3 4 5
B.2 Scoring instructions for DBQ items above:
A mean score can be calculated across all participants. A higher score means stronger tendency to commit violations (i.e. higher score is less safe).