Embed Size (px)
Citation preview

GLOBAL HeAdquArters • tHe GreGOr BuiLdinG716 West Ave • Austin, tX 78701-2727 • usA
uSING BENfORD’S LAW tO DEtECt fRAuD

The Digit Tests
Using Benford’s Law 47
VII. THE DIGIT TESTS
The five digit tests developed by Mark Nigrini mentioned earlier are described in detail below. They are
listed in the order in which they would normally be performed. The first-order tests include the first digits
test, the second digits test, and the first two digits test.
The first-order tests are usually run on either the positive numbers or the negative numbers, but not
both in the same analysis. This is because the incentive to manipulate is opposite for positive and
negative numbers. For example, if a company has a positive net income, management is looking to
manipulate this figure and will likely want to inflate it. On the other hand, if the company is reporting a
net loss, management will probably want this amount to be as close to zero as possible.
The first and second digit tests are high-level tests of reasonableness and are merely used to determine
whether the data set appears reasonable. If the first and second digit tests indicate that the data set is
significantly different than Benford’s Law, the first two digits and first three digit tests will be performed
to select audit targets. The last two digits test is used to detect rounding.
First Digit Test
The first digit test compares the actual first digit frequency distribution of a data set with that developed
by Benford. It is an extremely high-level test and will only identify obvious anomalies (i.e., it will only
point you in the right direction). It should not be used to select targets for sampling, as the sample size
will be too large. For example, consider the following graphical comparison of a Benford set (first digit
frequencies conform to Benford’s Law) and another sample data set (Data Set X). Assume Data Set X
represents the first digit frequency of 10,000 vendor invoices.
First Digit Benford’s Set Data Set X Deviation
1 30.10% 24.00% 0.06
2 17.61% 18.00% 0.00
3 12.49% 26.00% -0.14
4 9.69% 11.00% -0.01
5 7.92% 5.00% 0.03
6 6.70% 7.00% 0.00
7 5.80% 5.00% 0.01
8 5.12% 2.00% 0.03
9 4.58% 2.00% 0.03

The Digit Tests
48 Using Benford’s Law
As shown above, the first digit frequency distribution of Data Set X does not conform to Benford’s Law
based on the graph alone. However, as can be seen from the graph, significant anomalies occur with the
first digit 3—invoice amounts beginning with 3 appear 26 percent of the time, as opposed to the 13
percent figure calculated by Benford. Other anomalies occur in which the actual frequency is less than
the expected frequency. However, fraud examiners are concerned with the over-usage of digits, because
fraudsters, when inventing numbers, tend to overuse certain digit patterns. The digits that occur fewer
times than Benford Law predicted (1, 5, 7, 8, and 9) result primarily from the over usage of 3.
Because Data Set X consists of 10,000 invoices, fraud investigators would need to examine
approximately 2,600 invoices (10,000 x .26) to see first-digit frequency distribution for Data Set X in the
graph. Given the fact that this requires a substantial amount of time, this test should not be used to
select the audit sample. Rather, it should only be used as a benchmark.
Second Digit Test
The second digit test is also a high-level test designed to test conformity or reasonableness. Bear in mind
that expected second digit proportions are less skewed than expected first digit proportions. Because
this test results in a large sample selection, it should not be used to select audit samples. However, it can
be used to quickly identify potential problems in a data set, especially if we assess conformity using the
Z-statistic as discussed in the previous chapter.
0%
5%
10%
15%
20%
25%
30%
35%
1 2 3 4 5 6 7 8 9
Pro
po
rtio
n
First Digit
First Digit Test Proportions
Benford's Set
Data Set X

The Digit Tests
Using Benford’s Law 49
First Two Digits Test
The first two digits test combines the previous two tests and identifies manifested deviations that warrant
further review. To that end, it can be used to select efficient audit samples for testing. For example,
consider the sample data in the first digit test above. An abundance of invoices beginning with 3 were
detected. In fact, based upon that review, approximately 2,600 invoices need to be examined. However,
using the first two digits test, it is apparent that not all of the invoices need to be examined (see table
and chart below).
Instead, only those invoices beginning with the first two digits 31 and 33 need to be examined. As seen
in the chart, these are the first two digits whose actual frequencies differ the most from their expected
frequencies (-.40 and -.39, respectively). Therefore, if numbers beginning with 31 or 33 were focused on,
347 (178 + 169) invoices need to be reviewed. This was calculated by multiplying 1.78 percent (actual
frequency percentage for the first two digits 31) by 10,000 (number of total invoices) and adding that to
1.69 percent (actual frequency percentage for the first two digits 33) times 10,000 (number of total
invoices). This test results in a required audit sample of more than 2,000 fewer invoices—certainly a
more efficient and focused sample.
NOTE: The chart below assumes the first digit of the multi-digit number was 3.
Second Digit Benford’s Set Data Set X Deviation
0 1.42% 1.44% -.02
1 1.38% 1.78% -.40
2 1.34% 1.12% .22
3 1.30% 1.69% -.39
4 1.26% 1.29% -.03
5 1.22% 1.00% .22
6 1.19% 0.99% .10
7 1.16% 1.12% .04
8 1.13% 1.15% -.02
9 1.10% 1.05% .05

The Digit Tests
50 Using Benford’s Law
First Three Digits Test
The first three digits test is a highly focused test that is also used to select audit samples. While the first two
digits test tends to indicate broad categories of abnormality, such as payments made just below an
authorized limit, the first three digits test tends to identify unusual amounts that have been duplicated.
An example has not been provided in graphical format here because there are 900 possible three-digit
combinations and such a graph is too large to include on this page. However, please note that this test
will most likely produce a sample to be tested that is smaller than that determined by the first two-digit
test. Therefore, in the example, the audit sample will be less than 347.
Both the first two and first three digit tests tend to identify overused digit patterns indicative of fraud,
representing erroneous inputs, or suggesting the duplicate processing of the same invoice on multiple
occasions.
Nigrini also warns that, when conducting the first two or first three digit tests, it is imperative to delete
all data records fewer than 10, as these numbers are usually immaterial and might skew the results.
Additionally, Nigrini states that all negative numbers (credit memos) should be removed from the data
set when investigating potentially fraudulent invoices because they represent the inverse of an invoice
amount.
0.0%
0.5%
1.0%
1.5%
2.0%
0 1 2 3 4 5 6 7 8 9
Pro
po
rtio
n
Second Digit
First Two Digits Test Proportions
Benford's Set
Data Set X
The Digit Tests
Using Benford’s Law 51
Last Two Digits Test
The last two digits test is used to identify fabricated and rounded numbers. This test is especially handy
because it might be all the fraud examiner needs to select audit targets in populations smaller than
10,000. Because the expected proportion of all possible last two digit combinations is .01, it is very easy
to identify abnormalities via a graph. This test is especially useful if financial statement figures have been
rounded, thereby suggesting that the figures are estimates rather than actual amounts.
Because this test results in small and efficient sample sizes, it can be used to identify patterns that might
not be evident when using the previous four tests.
Applying the Z-Statistic to the Digit Tests
As previously stated, the first and second digit tests are high-level tests of reasonableness and can be
used to judge general conformity to a Benford curve, but they should not be used to select a sample. If
these tests indicate the data is significantly different than a Benford curve, then fraud examiners should
continue with the first two digits and first three digits tests to select audit targets. The last two digits test
is used to detect artificially rounded numbers.
But how is it judged whether a set of data conforms to Benford’s Law? Sometimes the data lends itself
to using professional judgment to assess conformity. That is, a few digits will have significantly larger
deviations from the expected proportion than others, and no calculations are necessary. However,
sometimes it is not as clear which digits are statistically significant. In these instances, fraud examiners
should use an empirical method to determine which digits to focus on.
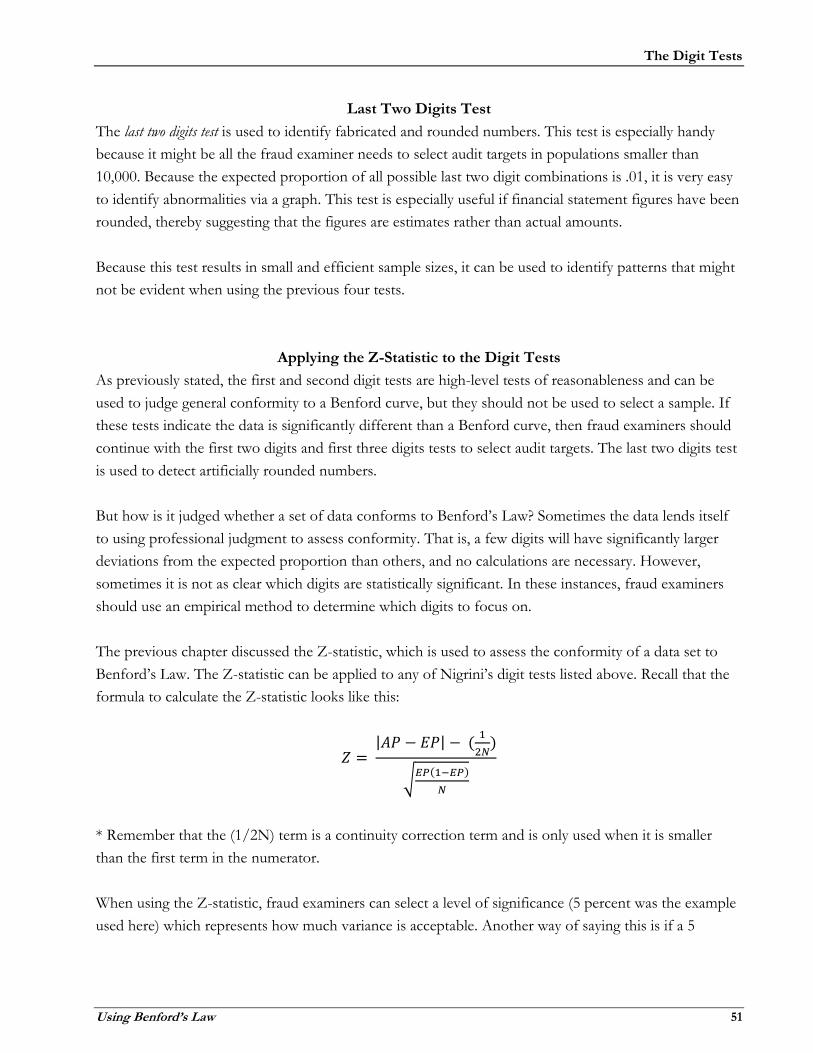
The previous chapter discussed the Z-statistic, which is used to assess the conformity of a data set to
Benford’s Law. The Z-statistic can be applied to any of Nigrini’s digit tests listed above. Recall that the
formula to calculate the Z-statistic looks like this:
𝑍 = |𝐴𝑃 − 𝐸𝑃| − (
1
2𝑁)
√𝐸𝑃(1−𝐸𝑃)
𝑁
* Remember that the (1/2N) term is a continuity correction term and is only used when it is smaller
than the first term in the numerator.
When using the Z-statistic, fraud examiners can select a level of significance (5 percent was the example
used here) which represents how much variance is acceptable. Another way of saying this is if a 5

The Digit Tests
52 Using Benford’s Law
percent level of significance was selected, then 95 percent of the data must conform to a Benford curve
for the data to be acceptable. Recall that the cutoff level for a 5 percent level of significance is 1.96.
For example, assume the second digit test is being performed. Here is an example of the detailed output
of a fictitious set of data (assume the first digit for this set of data is 4 and that Expected Proportion
represents Benford’s Law):
Digit Count Actual
Proportion (AP) Expected
Proportion (EP) Deviation Z-Statistic
0
220 10.73% 12.00% -1.27%
1.775
1
268 13.07% 11.40% 1.67%
2.375
2
260 12.68% 10.90% 1.78%
2.582
3
200 9.75% 10.40% -0.65%
0.962 4
205
10.00%
10.00%
0.00%
0.007
5
199 9.70% 9.70% 0.00%
0.004
6
214 10.43% 9.30% 1.13%
1.768
7
165 8.04% 9.00% -0.96%
1.512
8
140 6.83% 8.80% -1.97%
3.156
9
180 8.78% 8.50% 0.28%
0.449
TOTAL
2,051 1 1
If the digits that are statistically significant at 95 percent are chosen, then all numbers beginning with 41,
42, and 48 will be examined, as these do not conform to Benford’s Law. This is determined because the
Z-statistics for the second digits 1, 2, and 8 are greater than 1.96.

The Digit Tests
Using Benford’s Law 53
Recall from the previous chapter that the Z-statistic suffers from the excess power problem. As a data
set becomes larger, the Z-statistic tolerates smaller and smaller deviations. To illustrate this, take the set
of data above but multiply each count by 10 so that there is a data set of 20,510 units rather than 2,051,
and all the digits have the same proportion as before:
Digit Count Actual
Proportion (AP) Expected
Proportion (EP) Deviation Z-Statistic
0
2,200 10.73% 12.00% -1.27%
5.613
1
2,680 13.07% 11.40% 1.67%
7.511
2
2,600 12.68% 10.90% 1.78%
8.165
3
2,000 9.75% 10.40% -0.65%
3.043
4
2,050 10.00% 10.00% 0.00%
0.023
5
1,990 9.70% 9.70% 0.00%
0.013
6
2,140 10.43% 9.30% 1.13%
5.591
7
1,650 8.04% 9.00% -0.96%
4.780
8
1,400 6.83% 8.80% -1.97%
9.979
9
1,800 8.78% 8.50% 0.28%
1.418
TOTAL
20,510 1 1
The statistically significant digits now include 0, 1, 2, 3, 6, 7, and 8. Either this data truly does not
conform to Benford’s Law and the analysis should not be used, or the excess power problem is to
blame. One solution to overcoming the excess power problem is to ignore the actual numerical value of
the Z-statistics. In other words, only concentrate on the largest statistics without worrying about how
large they are. In this instance, fraud examiners might choose to focus on just 1, 2, and 8 (the same digits
from the previous analysis), which is far more reasonable.
Summary
In this section, it was discussed how Mark Nigrini pioneered a new application of an old mathematical
phenomenon, Benford’s Law, to assist auditors and investigators in identifying potentially fraudulent
transactions. He showed that digital analysis is an easily applied, cost-efficient method of uncovering
fraud and other errors.

The Digit Tests
54 Using Benford’s Law
Nigrini identified five tests that can be used either proactively or reactively to test for fraudulent transactions, inefficiencies, rounded numbers, and duplicate payments. These digit tests include:
The first digit test
The second digit test
The first two digits test
The first three digits test
The last two digits test
The first and second digit tests are high-level tests designed to assess overall conformity and detect
obvious anomalies. Because they are so high-level, these tests should not be used to select an audit
sample. The first two digits test, on the other hand, combines these two tests and identifies clear
deviations that need to be investigated further. Therefore, it can be used to select efficient audit samples
for testing.
The first three digits and last two digit tests are also used to select audit samples. While the first two
digits test tends to indicate broad categories of abnormality, such as payments made just below an
authorized limit, the first three digits test tends to identify unusual amounts that have been duplicated.
The last two digits test is primarily used to identify rounded numbers.
This chapter also explained how to apply the Z-statistic analysis from the previous chapter to the digit
tests. This analysis is used to determine a data set’s conformity with Benford’s Law. When using the Z-
statistic, be cautious with regard to the excess power problem; sometimes a set is so large that the Z-
statistic only tolerates very minor fluctuations and a data set might be inappropriately rejected.

The Digit Tests
Using Benford’s Law 55
Review Questions
Multiple Choice Questions
1. Which of the following is characteristic of the second digit test?
A. It is a high-level test used to test for non-conformity and unreasonableness.
B. It results in a small sample selection.
C. It should be used to select audit samples.
D. It can be used to quickly identify potential problems in a data set.
2. When auditors consider using the first digit test, they should remember that:
A. It is a low-level test.
B. It will not identify obvious anomalies.
C. It should be used to select targets for sampling.
D. It compares the actual first digit frequency distribution of a data set with that developed by
Benford.
3. Which of the following describes a first two digits test?
A. It can be used to select efficient audit samples.
B. It can be used to test conformity and reasonableness.
C. It is a less focused test than the others.
D. It combines the first three digits test and the last two digits test.
4. Which of the following does Nigrini say auditors should do when using the first two or first three
digits test?
A. Be aware that these tests tend to identify underutilized digit patterns indicative of fraud.
B. Delete all amounts more than 10.
C. Remove all negative numbers.
D. Look for amounts that have been rounded.

The Digit Tests
56 Using Benford’s Law
5. The test used to identify invented and rounded numbers is:
A. Last two digits test
B. First two digits test
C. Second digit test
D. First digit test
Short Answer Questions
6. Which of Nigrini’s digit tests should be used to select efficient audit samples?
7. Which of Nigrini’s digit tests is used to test for rounded numbers?
8. Identify three of the seven rules of data set preparation suggested by Nigrini.
Conclusion
Using Benford’s Law 57
VIII. Conclusion
The genesis of Benford’s Law began with an individual who did not have an early formal education, yet
observed an interesting phenomenon that would eventually revolutionize the field of auditing and fraud
analysis. While the underlying principles of the law had been known for more than 100 years, it was only
recently that this technique was applied to auditing. However, many accountants, auditors, and
investigators are still not familiar with Benford’s Law or its application, despite its practical uses.
The application of Benford’s Law in the field of auditing and investigation has gathered momentum
primarily due to Mark Nigrini. A number of tax agencies have reportedly incorporated the theory behind
Benford’s Law when analyzing income tax returns. Additionally, the internal audit departments of many
Fortune 500 companies now apply the theory when analyzing data sets for anomalies and other potential
errors. The field of public accounting is also starting to embrace and incorporate the theory of Benford’s
Law into their audit and investigative divisions.
Analysis using Benford’s Law has also been incorporated into audit software packages, making it easier
for the auditor to use without having to know the specifics of how to calculate differences and measure
the significance of the deviations. Audit Control Language (ACL) has incorporated Benford’s Law into
its software package (www.acl.com). There are also Excel add-ins available to allow this analysis to be
performed in the Microsoft Office Suite. Excel is more cumbersome at performing Benford’s Law
analysis than ACL, but Excel can handle it if resources are limited. Additionally, Mark Nigrini developed
several software products that perform Benford’s Law analysis (www.nigrini.com/datas_software.htm).
Benford’s Law provides the expected frequency of digits in certain types of tabulated data. Auditors and
fraud examiners should consider the technique a high-level overview. It is important to note that
deviations from Benford’s Law do not signal fraud or error with certainty, but rather indicate data sets
that warrant further investigation.
For more information about Benford’s Law, see Mark Nigrini’s book, Benford’s Law: Applications for
Forensic Accounting, Auditing, and Fraud Detection, which is published by John Wiley and Sons and is
available for sale in the bookstore on the ACFE website (www.acfe.com).