Embed Size (px)
Citation preview
8/21/2019 Using BMC Performance Perceiver-V5-20141128_0503
http://slidepdf.com/reader/full/using-bmc-performance-perceiver-v5-201411280503 1/245
BMC Software Confidentia
Using BMC Performance Perceive
BMC Capacity Optimization 9.5
URL:
Date: 28-Nov-2014 05:02
https://docs.bmc.com/docs/display/bcmco95/Using+BMC+Performance+Perceiver
8/21/2019 Using BMC Performance Perceiver-V5-20141128_0503
http://slidepdf.com/reader/full/using-bmc-performance-perceiver-v5-201411280503 2/245
Using BMC Performance Perceiver BMC Software Confidential
BMC Capacity Optimization 9.5 Page of2 245
Table of Contents
1 Using the interface ___________________________________________________________________________ 71.1 Tabs _________________________________________________________________________________ 7
1.2 Key terms _____________________________________________________________________________ 8
2 Reviewing data collected ______________________________________________________________________ 9
2.1 Using the environment ___________________________________________________________________ 9
2.2 Starting BMC Performance Perceiver ______________________________________________________ 10
2.3 Managing physical systems in the data center ________________________________________________ 11
2.3.1 Getting the big picture of the data center _____________________________________________ 12
2.3.2 Discovering which servers stand out _________________________________________________ 14
2.3.3 Creating subset groups ___________________________________________________________ 16
2.3.4 Narrowing the focus _____________________________________________________________ 182.3.5 Exploring resource usage across the group ___________________________________________ 19
2.3.6 Investigating single server resource usage ____________________________________________ 20
3 Determining what to do after exploring the graphs and charts in Perceiver ______________________________ 22
3.1 Conducting a server consolidation _________________________________________________________ 22
3.2 Resolving resource issues with virtual hosts _________________________________________________ 22
3.2.1 Deploy additional guests __________________________________________________________ 23
3.2.2 Rebalance the guests on the virtual hosts ____________________________________________ 23
4 Using Virtualization Planning __________________________________________________________________ 24
4.1 What is Virtualization Planning? ___________________________________________________________ 24
4.2 What is a virtualization study? ____________________________________________________________ 24
4.3 Before you begin a virtualization study in Perceiver ____________________________________________ 25
4.4 Selecting the type of virtualization study ____________________________________________________ 25
4.4.1 To select the type of virtualization study ______________________________________________ 26
4.5 Working with a New Study _______________________________________________________________ 27
4.5.1 Consolidating to virtual hosts ______________________________________________________ 28
4.5.2 Deploying new guests ____________________________________________________________ 43
4.5.3 Rebalancing existing virtual hosts ___________________________________________________ 48
4.6 Working with saved studies ______________________________________________________________ 50
4.6.1 To view or edit saved studies ______________________________________________________ 50
4.6.2 To delete saved studies __________________________________________________________ 50
4.6.3 To convert scenarios to studies _____________________________________________________ 51
4.7 Working with Study Profiles ______________________________________________________________ 51
4.7.1 Predefined study profiles __________________________________________________________ 51
4.7.2 Creating a new Study Profile _______________________________________________________ 52
4.7.3 Editing a Study Profile ____________________________________________________________ 52
4.8 Working with guest profiles _______________________________________________________________ 53
4.9 Changing default Virtualization Planning settings _____________________________________________ 54
8/21/2019 Using BMC Performance Perceiver-V5-20141128_0503
http://slidepdf.com/reader/full/using-bmc-performance-perceiver-v5-201411280503 3/245
Using BMC Performance Perceiver BMC Software Confidential
BMC Capacity Optimization 9.5 Page of3 245
4.10 Customization settings of a virtualization study ______________________________________________ 55
4.10.1 To create a custom filter for a Consolidation Study _____________________________________ 55
4.10.2 Adding or removing computers from a Consolidation Study ______________________________ 56
4.10.3 Adding or removing guests from a Deployment Study __________________________________ 57
4.10.4 Changing computer assignments __________________________________________________ 57
4.10.5 Setting an affinity relationship for computers _________________________________________ 57
4.10.6 Viewing the guests on an existing virtual host _________________________________________ 58
4.10.7 Advanced settings of a virtualization study ___________________________________________ 59
4.11 Troubleshooting Virtualization Planning ____________________________________________________ 61
4.11.1 Analysis exceptions in Virtualization Planning ________________________________________ 61
4.11.2 Data exceptions in Virtualization Planning ___________________________________________ 63
5 Using General Manager _____________________________________________________________________ 65
5.1 Overview of General Manager ____________________________________________________________ 65
5.1.1 Starting General Manager _________________________________________________________ 66
5.1.2 Using General Manager __________________________________________________________ 66
5.2 Features of General Manager ____________________________________________________________ 665.3 Using Console Management _____________________________________________________________ 67
5.3.1 Viewing Consoles _______________________________________________________________ 67
5.3.2 Adding Consoles ________________________________________________________________ 68
5.3.3 Removing Consoles _____________________________________________________________ 68
5.4 Using Console Operations _______________________________________________________________ 69
5.4.1 Listing Nodes ___________________________________________________________________ 69
5.4.2 Viewing Scheduled Runs _________________________________________________________ 71
5.4.3 Creating New Run _______________________________________________________________ 72
5.4.4 Scheduling New Runs ____________________________________________________________ 77
5.4.5 Stopping Scheduled Runs _________________________________________________________ 785.4.6 Recovering Runs ________________________________________________________________ 79
5.4.7 Configuring Console _____________________________________________________________ 79
5.5 Viewing Console Reports ________________________________________________________________ 80
5.5.1 Viewing Node History ____________________________________________________________ 80
5.5.2 Viewing Exception Report _________________________________________________________ 81
5.6 Viewing Console Logs __________________________________________________________________ 82
5.6.1 Viewing Manager Run Logs _______________________________________________________ 82
5.7 Setting General Manager Preferences ______________________________________________________ 83
5.7.1 To view the server logs ___________________________________________________________ 83
5.7.2 To view the client logs ____________________________________________________________ 83
6 Using views and reports _____________________________________________________________________ 84
6.1 Using Perceiver views __________________________________________________________________ 84
6.1.1 Navigating views categories _______________________________________________________ 84
6.1.2 Charts and histograms ___________________________________________________________ 85
6.1.3 Ranking tables __________________________________________________________________ 86
6.2 Predefined Perceiver views ______________________________________________________________ 86
6.2.1 Datacenter views ________________________________________________________________ 86
8/21/2019 Using BMC Performance Perceiver-V5-20141128_0503
http://slidepdf.com/reader/full/using-bmc-performance-perceiver-v5-201411280503 4/245
Using BMC Performance Perceiver BMC Software Confidential
BMC Capacity Optimization 9.5 Page of4 245
6.2.2 Server Profile by Resource views ___________________________________________________ 87
6.2.3 VMware views __________________________________________________________________ 89
6.2.4 KVM views _____________________________________________________________________ 91
6.2.5 MS Hyper-V views _______________________________________________________________ 92
6.2.6 IBM PowerVM views _____________________________________________________________ 93
6.2.7 Oracle Solaris views _____________________________________________________________ 95
6.2.8 HP-UX and HP-IVM views _________________________________________________________ 97
6.2.9 Xen views _____________________________________________________________________ 98
6.2.10 Microsoft Virtual Server views ____________________________________________________ 101
6.2.11 Virtual Datacenter and Server views _______________________________________________ 101
6.2.12 Performance Manager views _____________________________________________________ 103
6.2.13 Configuration Management views _________________________________________________ 104
6.3 Predefined Perceiver views by category ___________________________________________________ 104
6.3.1 Datacenter Overview category ____________________________________________________ 105
6.3.2 Datacenter Summary by Resource view category _____________________________________ 109
6.3.3 Server Profile by Resource view category ___________________________________________ 1146.3.4 Virtual Machine Overview category _________________________________________________ 128
6.3.5 Virtual Host Summary by Resource view category _____________________________________ 132
6.3.6 Virtual Machine Summary by Resource view category __________________________________ 138
6.3.7 Resource Pool Summary view category _____________________________________________ 144
6.3.8 KVM Overview category _________________________________________________________ 145
6.3.9 KVM Server Summary category ___________________________________________________ 150
6.3.10 KVM Partition Summary by Resource category ______________________________________ 155
6.3.11 Cluster Summary view category __________________________________________________ 161
6.3.12 MS Hyper-V view category ______________________________________________________ 164
6.3.13 IBM PowerVM view categories ___________________________________________________ 1686.3.14 Oracle Solaris view category _____________________________________________________ 172
6.3.15 HP-UX and HP-IVM view category ________________________________________________ 178
6.3.16 Xen view category _____________________________________________________________ 182
6.3.17 Microsoft Virtual Server view category _____________________________________________ 184
6.3.18 Virtual Datacenter and Server view category ________________________________________ 185
6.3.19 Performance Manager view category ______________________________________________ 190
6.3.20 Configuration Management view category __________________________________________ 190
6.4 Custom Perceiver views ________________________________________________________________ 193
6.4.1 The Build Views tab and predefined view categories ___________________________________ 194
6.4.2 Creating a new view ____________________________________________________________ 199
6.4.3 Deleting a custom view __________________________________________________________ 206
6.4.4 Editing an existing view __________________________________________________________ 206
6.4.5 Removing view categories _______________________________________________________ 208
6.5 Common Perceiver metrics _____________________________________________________________ 208
6.5.1 Chart types available in BMC Performance Perceiver __________________________________ 209
6.5.2 Memory metrics ________________________________________________________________ 209
6.5.3 Networking metrics _____________________________________________________________ 209
8/21/2019 Using BMC Performance Perceiver-V5-20141128_0503
http://slidepdf.com/reader/full/using-bmc-performance-perceiver-v5-201411280503 5/245
Using BMC Performance Perceiver BMC Software Confidential
BMC Capacity Optimization 9.5 Page of5 245
6.5.4 CPU metrics __________________________________________________________________ 211
6.5.5 IO metrics ____________________________________________________________________ 212
6.5.6 Workload metrics _______________________________________________________________ 214
6.5.7 System configuration metrics _____________________________________________________ 214
6.5.8 System information metrics _______________________________________________________ 214
6.5.9 Configuration metrics ___________________________________________________________ 215
6.5.10 Data availability metrics _________________________________________________________ 215
6.6 Common Perceiver views _______________________________________________________________ 216
6.6.1 UNIX metrics views _____________________________________________________________ 216
6.6.2 Microsoft Virtual Server metrics views ______________________________________________ 223
6.6.3 Virtual computer views __________________________________________________________ 224
6.6.4 VMware metrics views ___________________________________________________________ 227
6.6.5 zSeries views _________________________________________________________________ 229
6.7 Understanding a Server Sizing report _____________________________________________________ 233
6.7.1 Summary section _______________________________________________________________ 233
6.7.2 Virtual Host reports _____________________________________________________________ 2377 Index ___________________________________________________________________________________ 242

8/21/2019 Using BMC Performance Perceiver-V5-20141128_0503
http://slidepdf.com/reader/full/using-bmc-performance-perceiver-v5-201411280503 6/245
Using BMC Performance Perceiver BMC Software Confidential
BMC Capacity Optimization 9.5 Page of6 245
BMC Performance Perceiver is a web-based reporting tool that provides you with easy-to-interpret tables and charts,
organized into logical data views. BMC Performance Perceiver uses data stored in the Visualizer database.
For more information about using BMC Performance Perceiver, see:
Using the interface (see page 7)
Reviewing data collected (see page 9)
Determining what to do after exploring the graphs and charts in Perceiver (see page 22)
Using Virtualization Planning (see page 24)
Using General Manager (see page 65)
Using views and reports (see page 84)
8/21/2019 Using BMC Performance Perceiver-V5-20141128_0503
http://slidepdf.com/reader/full/using-bmc-performance-perceiver-v5-201411280503 7/245
Using BMC Performance Perceiver BMC Software Confidential
BMC Capacity Optimization 9.5 Page of7 245
1 Using the interfaceYou can view data quickly and easily using the main interface of BMC Performance Perceiver, once an administrator
has:
Enabled data sources
Configured the application for you
BMC Performance Perceiver is view-driven, meaning the actions you perform (and the resultant display) are based on
whether you select or from the Getting Started page.computer views group views
For information about using the BMC Performance Perceiver interface, see:
Tabs (see page 7)
Key terms (see page 8)
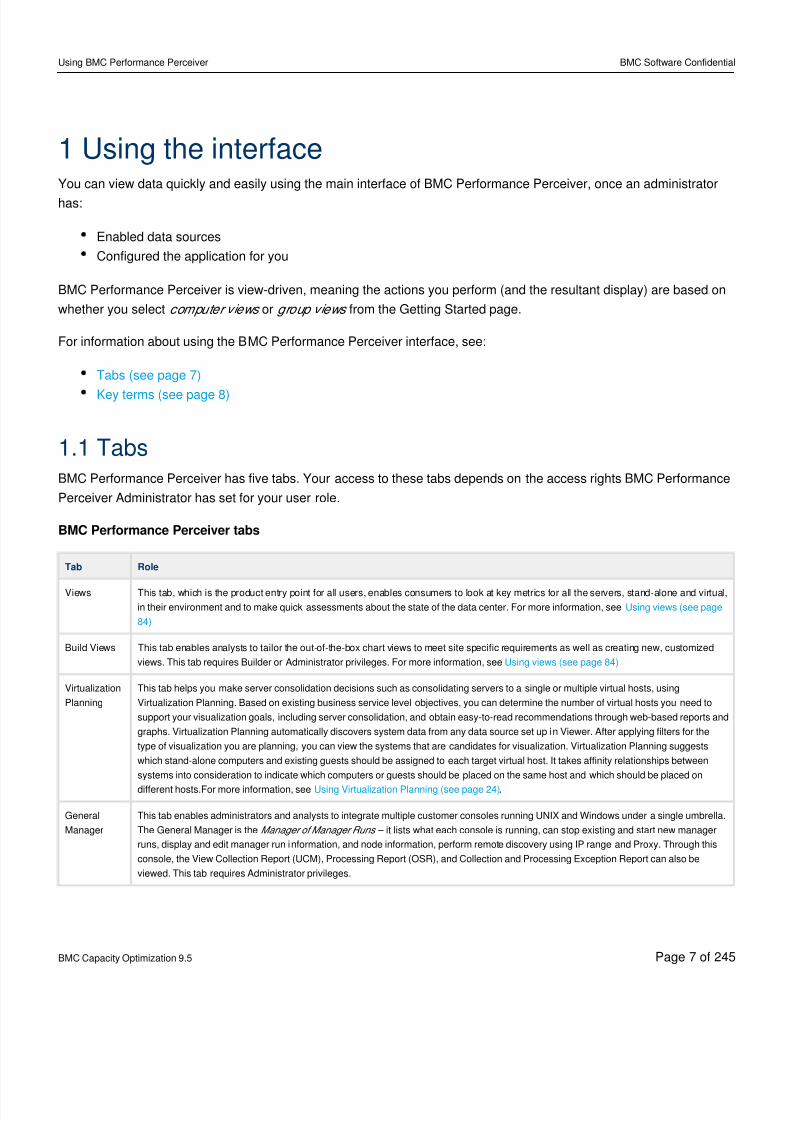
1.1 TabsBMC Performance Perceiver has five tabs. Your access to these tabs depends on the access rights BMC Performance
Perceiver Administrator has set for your user role.
BMC Performance Perceiver tabs
Tab Role
Views This tab, which is the product entry point for all users, enables consumers to look at key metrics for all the servers, stand-alone and virtual,
in their environment and to make quick assessments about the state of the data center. For more information, see Using views (see page
84)
Build Views This tab enables analysts to tailor the out-of-the-box chart views to meet site specific requirements as well as creating new, customized
views. This tab requires Builder or Administrator privileges. For more information, see Using views (see page 84)
Virtualization
Planning
This tab helps you make server consolidation decisions such as consolidating servers to a single or multiple virtual hosts, using
Virtualization Planning. Based on existing business service level objectives, you can determine the number of virtual hosts you need to
support your visualization goals, including server consolidation, and obtain easy-to-read recommendations through web-based reports and
graphs. Virtualization Planning automatically discovers system data from any data source set up in Viewer. After applying filters for the
type of visualization you are planning, you can view the systems that are candidates for visualization. Virtualization Planning suggests
which stand-alone computers and existing guests should be assigned to each target virtual host. It takes affinity relationships between
systems into consideration to indicate which computers or guests should be placed on the same host and which should be placed on
different hosts.For more information, see .Using Virtualization Planning (see page 24)
General
Manager
This tab enables administrators and analysts to integrate multiple customer consoles running UNIX and Windows under a single umbrella.
The General Manager is the – it lists what each console is running, can stop existing and start new managerManager of Manager Runs
runs, display and edit manager run information, and node information, perform remote discovery using IP range and Proxy. Through this
console, the View Collection Report (UCM), Processing Report (OSR), and Collection and Processing Exception Report can also be
viewed. This tab requires Administrator privileges.
8/21/2019 Using BMC Performance Perceiver-V5-20141128_0503
http://slidepdf.com/reader/full/using-bmc-performance-perceiver-v5-201411280503 8/245
Using BMC Performance Perceiver BMC Software Confidential
BMC Capacity Optimization 9.5 Page of8 245
Tab Role
Administration This tab enables administrators to manage packages (logical groupings of views and metrics by data source), create, edit, and activate
data sources and groups, assign users and computer groups to roles that limit product access, customize the look and feel of the product.
This tab requires Administrator privileges. For more information, see .Administering
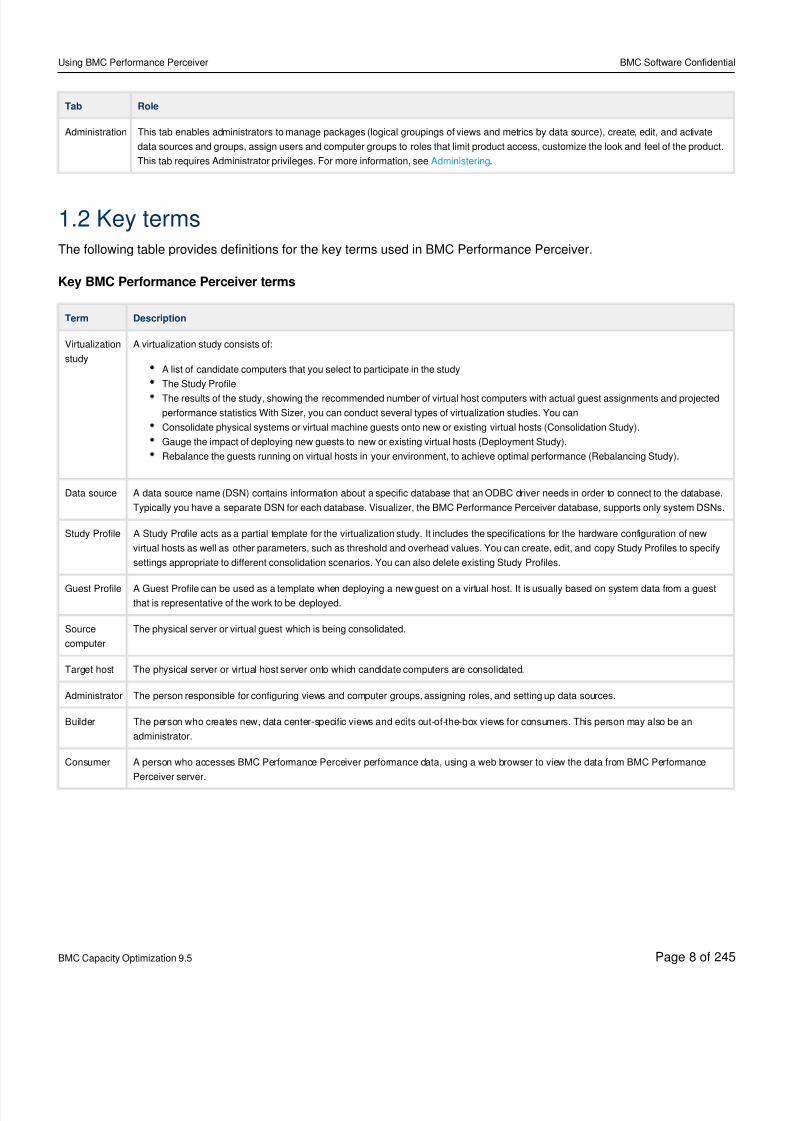
1.2 Key termsThe following table provides definitions for the key terms used in BMC Performance Perceiver.
Key BMC Performance Perceiver terms
Term Description
Virtualization
study
A virtualization study consists of:
A list of candidate computers that you select to participate in the study
The Study Profile
The results of the study, showing the recommended number of virtual host computers with actual guest assignments and projected
performance statistics With Sizer, you can conduct several types of virtualization studies. You can
Consolidate physical systems or virtual machine guests onto new or existing virtual hosts (Consolidation Study).
Gauge the impact of deploying new guests to new or existing virtual hosts (Deployment Study).
Rebalance the guests running on virtual hosts in your environment, to achieve optimal performance (Rebalancing Study).
Data source A data source name (DSN) contains information about a specific database that an ODBC driver needs in order to connect to the database.
Typically you have a separate DSN for each database. Visualizer, the BMC Performance Perceiver database, supports only system DSNs.
Study Profile A Study Profile acts as a partial template for the virtualization study. It includes the specifications for the hardware configuration of new
virtual hosts as well as other parameters, such as threshold and overhead values. You can create, edit, and copy Study Profiles to specify
settings appropriate to different consolidation scenarios. You can also delete existing Study Profiles.
Guest Profile A Guest Profile can be used as a template when deploying a new guest on a virtual host. It is usually based on system data from a guestthat is representative of the work to be deployed.
Source
computer
The physical server or virtual guest which is being consolidated.
Target host The physical server or virtual host server onto which candidate computers are consolidated.
Administrator The person responsible for configuring views and computer groups, assigning roles, and setting up data sources.
Builder The person who creates new, data center-specific views and edits out-of-the-box views for consumers. This person may also be an
administrator.
Consumer A person who accesses BMC Performance Perceiver performance data, using a web browser to view the data from BMC Performance
Perceiver server.
8/21/2019 Using BMC Performance Perceiver-V5-20141128_0503
http://slidepdf.com/reader/full/using-bmc-performance-perceiver-v5-201411280503 9/245
Using BMC Performance Perceiver BMC Software Confidential
BMC Capacity Optimization 9.5 Page of9 245
2 Reviewing data collectedCollected performance data is used by application owners or business managers to assess the status of a computer,
group of computers, or data center.
Consumers are the primary users of BMC Performance Perceiver, and are responsible for determining the state of a
computer, or even the entire data center, at a glance. The consumer's job is to provide fast, high-quality performance
information to operate a business more efficiently and reduce downtime.
The following sections help you learn how to use the BMC Performance Perceiver consumer interface quickly, so that
you can achieve these goals. They introduce you to the BMC Performance Perceiver interface and out-of-the-box
views and charts.
Using the environment (see page 9)
Starting BMC Performance Perceiver (see page 10)
Managing physical systems in the data center (see page 11)
For information about using BMC Performance Perceiver to view data from virtualized systems, see:
Evaluating the VMware environment in BMC Performance Assurance
Viewing Virtual Server data in Perceiver
Viewing Microsoft Hyper-V results in Perceiver
Displaying AIX hardware partition data in Perceiver
Displaying WPAR CPU Use in Perceiver
Displaying HP partition CPU use in Perceiver
Viewing HP IVM data in Perceiver
Displaying data in Perceiver for Solaris Container systems
Displaying Solaris LDom CPU Use in Perceiver
Viewing results for a Xen system in Perceiver
Viewing KVM data in Perceiver
2.1 Using the environmentBMC Performance Perceiver is a web server application that runs on the Apache Tomcat servlet container. Apache
Tomcat is third-party, open-source web server and servlet engine software that can also be run as a standalone webserver, which is how BMC Performance Perceiver uses it. It enables BMC Performance Perceiver server to interact
with end users in a web browser.
Consumers can only access BMC Performance Perceiver when the Tomcat servlet container and standalone web
server are running. Both run in a single Java Virtual Machine (JVM), which is a single Java executable process.
8/21/2019 Using BMC Performance Perceiver-V5-20141128_0503
http://slidepdf.com/reader/full/using-bmc-performance-perceiver-v5-201411280503 10/245
Using BMC Performance Perceiver BMC Software Confidential
BMC Capacity Optimization 9.5 Page of10 245
1.
When the administrator installs BMC Performance Perceiver, it installs as a service and starts automatically after
installation. This means that BMC Performance Perceiver server is instantly accessible to end users through the
specified URL.
2.2 Starting BMC Performance PerceiverIf you are logged on to BMC Performance Perceiver server, you can start BMC Performance Perceiver by selecting
.Start > Programs > BMC Software > BMC Performance Perceiver > Perceiver
If you are accessing BMC Performance Perceiver server using a web browser, complete the following steps:
Enter the following URL: , where:http:// : /qtvcomputerName portNumber
ComputerName is the computer on which the BMC Performance Perceiver server was installed.
PortNumber is the web server port number (default is 8080).
If BMC Performance Perceiver is not accessible after entering the above URL, you might have to type
the domain name and port number, using the following syntax: http:// . :computerName domainName , where:/qtv portNumber
ComputerName is the computer on which BMC Performance Perceiver server was installed.
DomainName is the name of the domain in which the computer is located.
PortNumber is the port number (default is 8080).
For example, .http://operations1.Retailer.com:8080/qtv
8/21/2019 Using BMC Performance Perceiver-V5-20141128_0503
http://slidepdf.com/reader/full/using-bmc-performance-perceiver-v5-201411280503 11/245
Using BMC Performance Perceiver BMC Software Confidential
BMC Capacity Optimization 9.5 Page of11 245
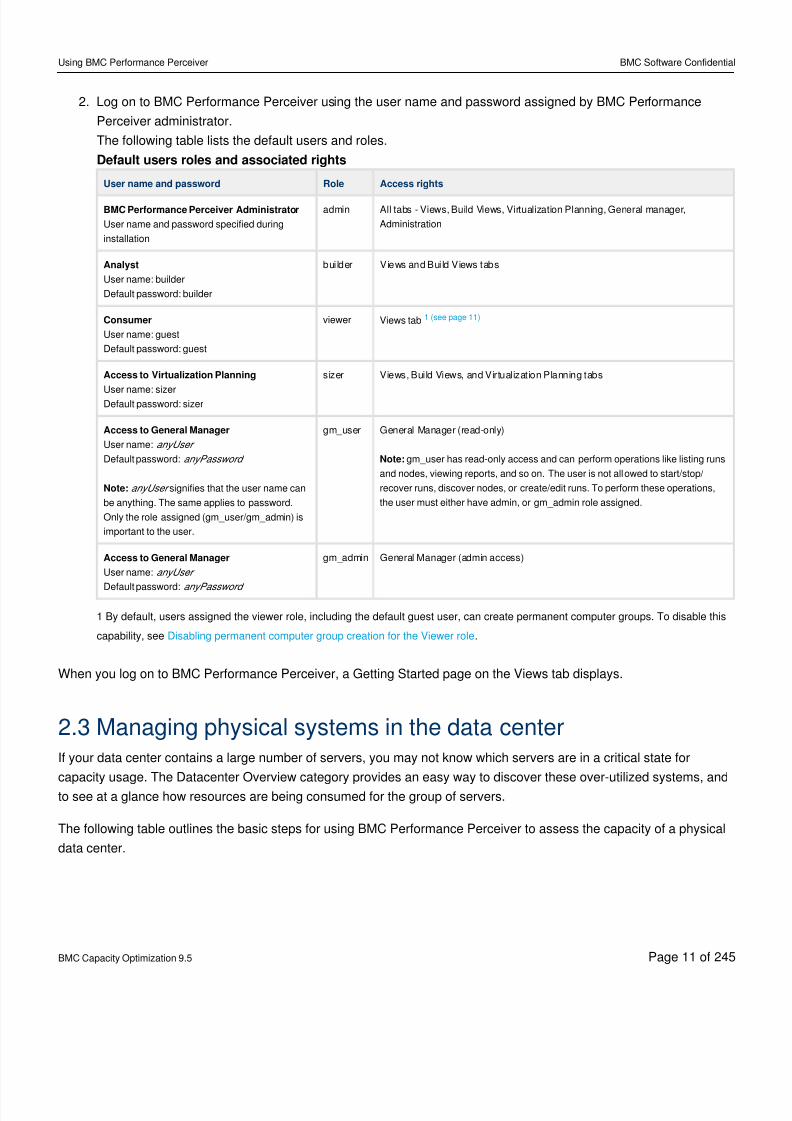
2. Log on to BMC Performance Perceiver using the user name and password assigned by BMC Performance
Perceiver administrator.
The following table lists the default users and roles.
Default users roles and associated rights
User name and password Role Access rights
BMC Performance Perceiver Administrator
User name and password specified during
installation
admin All tabs - Views, Build Views, Virtualization Planning, General manager,
Administration
Analyst
User name: builder
Default password: builder
builder Views and Build Views tabs
Consumer
User name: guest
Default password: guest
viewer Views tab 1 (see page 11)
Access to Virtualization Planning
User name: sizerDefault password: sizer
sizer Views, Build Views, and Virtualization Planning tabs
Access to General Manager
User name: anyUser
Default password: anyPassword
signifies that the user name canNote: anyUser
be anything. The same applies to password.
Only the role assigned (gm_user/gm_admin) is
important to the user.
gm_user General Manager (read-only)
gm_user has read-only access and can perform operations like listing runsNote:
and nodes, viewing reports, and so on. The user is not allowed to start/stop/
recover runs, discover nodes, or create/edit runs. To perform these operations,
the user must either have admin, or gm_admin role assigned.
Access to General Manager
User name: anyUser
Default password: anyPassword
gm_admin General Manager (admin access)
1 By default, users assigned the viewer role, including the default guest user, can create permanent computer groups. To disable this
capability, see .Disabling permanent computer group creation for the Viewer role
When you log on to BMC Performance Perceiver, a Getting Started page on the Views tab displays.
2.3 Managing physical systems in the data centerIf your data center contains a large number of servers, you may not know which servers are in a critical state for
capacity usage. The Datacenter Overview category provides an easy way to discover these over-utilized systems, and
to see at a glance how resources are being consumed for the group of servers.
The following table outlines the basic steps for using BMC Performance Perceiver to assess the capacity of a physical
data center.
8/21/2019 Using BMC Performance Perceiver-V5-20141128_0503
http://slidepdf.com/reader/full/using-bmc-performance-perceiver-v5-201411280503 12/245
Using BMC Performance Perceiver BMC Software Confidential
BMC Capacity Optimization 9.5 Page of12 245
Note
The workflow and scenarios presented in this section assume that BMC Performance Perceiver administrator
has created computer groups that include all of the computers in the active data sources.
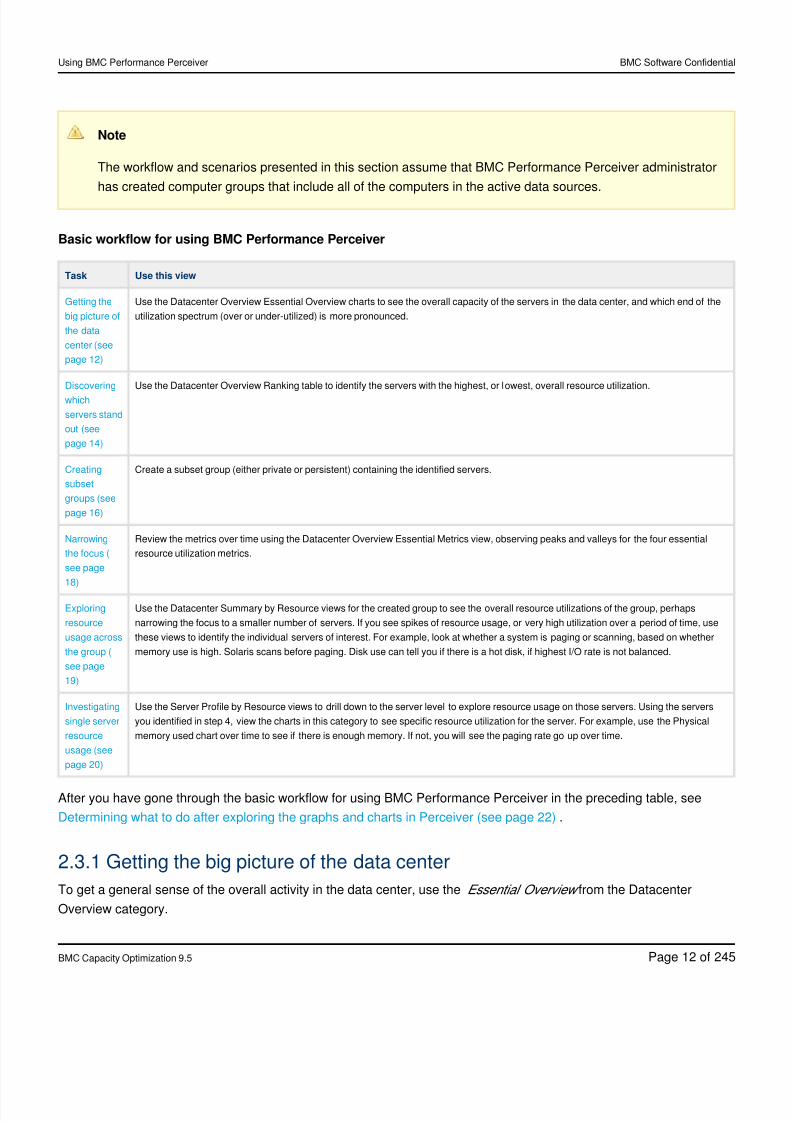
Basic workflow for using BMC Performance Perceiver
Task Use this view
Getting the
big picture of
the data
center (see
page 12)
Use the Datacenter Overview Essential Overview charts to see the overall capacity of the servers in the data center, and which end of the
utilization spectrum (over or under-utilized) is more pronounced.
Discovering
which
servers stand
out (see
page 14)
Use the Datacenter Overview Ranking table to identify the servers with the highest, or lowest, overall resource utilization.
Creating
subset
groups (see
page 16)
Create a subset group (either private or persistent) containing the identified servers.
Narrowing
the focus (
see page
18)
Review the metrics over time using the Datacenter Overview Essential Metrics view, observing peaks and valleys for the four essential
resource utilization metrics.
Exploring
resource
usage across
the group (
see page
19)
Use the Datacenter Summary by Resource views for the created group to see the overall resource utilizations of the group, perhaps
narrowing the focus to a smaller number of servers. If you see spikes of resource usage, or very high utilization over a period of time, use
these views to identify the individual servers of interest. For example, look at whether a system is paging or scanning, based on whether
memory use is high. Solaris scans before paging. Disk use can tell you if there is a hot disk, if highest I/O rate is not balanced.
Investigating
single server
resource
usage (see
page 20)
Use the Server Profile by Resource views to drill down to the server level to explore resource usage on those servers. Using the servers
you identified in step 4, view the charts in this category to see specific resource utilization for the server. For example, use the Physical
memory used chart over time to see if there is enough memory. If not, you will see the paging rate go up over time.
After you have gone through the basic workflow for using BMC Performance Perceiver in the preceding table, see
.Determining what to do after exploring the graphs and charts in Perceiver (see page 22)
2.3.1 Getting the big picture of the data center
To get a general sense of the overall activity in the data center, use the from the DatacenterEssential Overview
Overview category.
8/21/2019 Using BMC Performance Perceiver-V5-20141128_0503
http://slidepdf.com/reader/full/using-bmc-performance-perceiver-v5-201411280503 13/245
Using BMC Performance Perceiver BMC Software Confidential
BMC Capacity Optimization 9.5 Page of13 245
1.
2.
3.
4.
In the task pane, click the view category.Datacenter Overview
Select .Essential Overview
In the selector pane, select a group from the menu. The groups available from the Group list wereGroup
created previously by BMC Performance Perceiver Administrator.
In the selector pane, select a time interval from the menu. The Essential Overview displays the distributedTime
values for the computers in your data center, by metric.
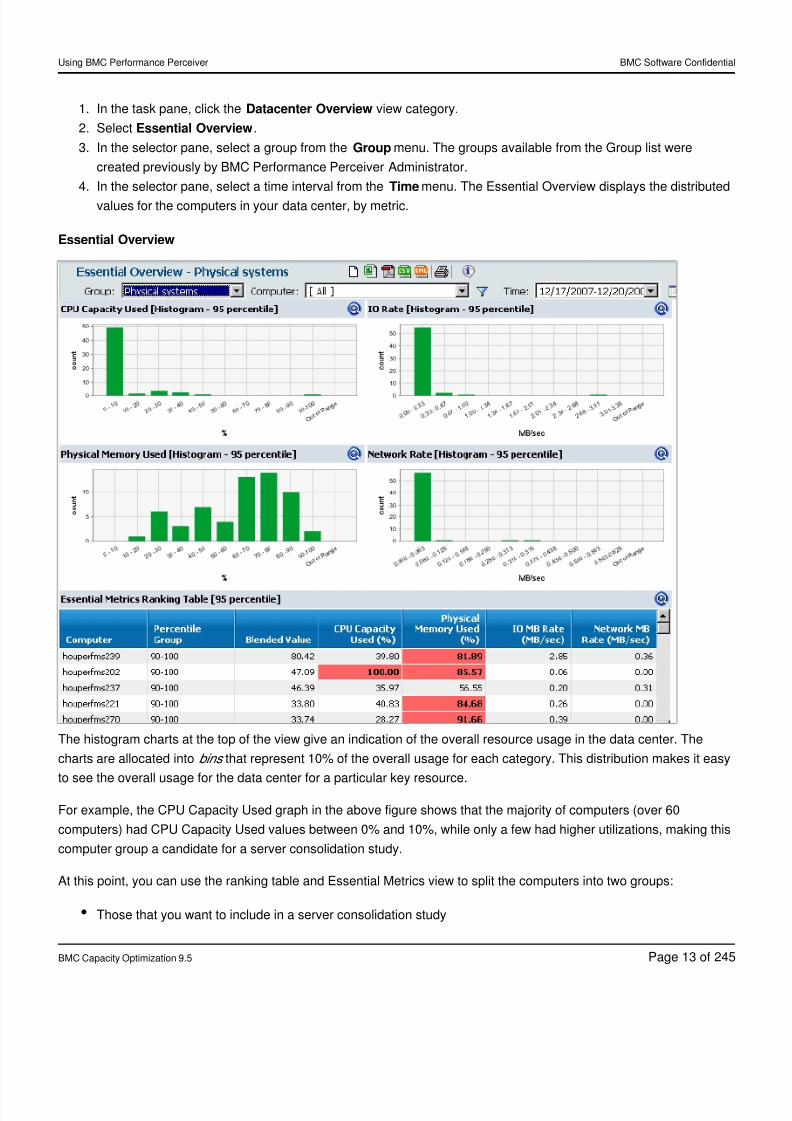
Essential Overview
The histogram charts at the top of the view give an indication of the overall resource usage in the data center. The
charts are allocated into that represent 10% of the overall usage for each category. This distribution makes it easybins
to see the overall usage for the data center for a particular key resource.
For example, the CPU Capacity Used graph in the above figure shows that the majority of computers (over 60
computers) had CPU Capacity Used values between 0% and 10%, while only a few had higher utilizations, making this
computer group a candidate for a server consolidation study.
At this point, you can use the ranking table and Essential Metrics view to split the computers into two groups:
Those that you want to include in a server consolidation study
8/21/2019 Using BMC Performance Perceiver-V5-20141128_0503
http://slidepdf.com/reader/full/using-bmc-performance-perceiver-v5-201411280503 14/245
Using BMC Performance Perceiver BMC Software Confidential
BMC Capacity Optimization 9.5 Page of14 245
Those with high resource utilization that you would like to investigate
To learn how to create subset groups of computers from a larger group to target your analysis, see Creating subset
.groups (see page 16)
To proceed to the next step in the workflow, see .Discover which servers stand out (see page 14)
2.3.2 Discovering which servers stand out
BMC Performance Perceiver provides a way to prioritize systems based on key thresholds – either too high or too low
– and determine which systems need proactive management or are candidates for consolidation or virtualization
projects.
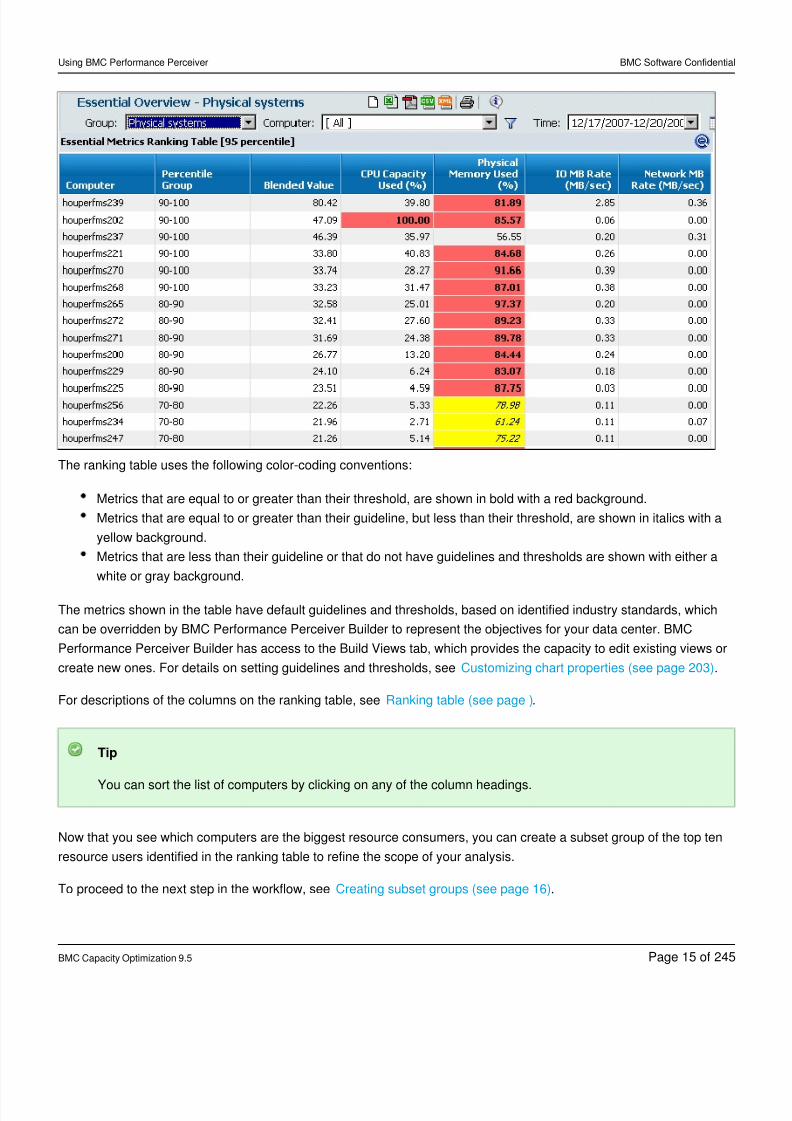
Essentials Overview includes a ranking table that shows where the computers being measured fall, in increments of 10
percentage points, based on a blended value of the essential metrics (CPU Capacity Used, IO Rate, Physical Memory
Used, Network Rate). By default, the table shows the servers with the highest overall utilization at the top of the table.
Under-utilized servers appear at the bottom of the table. These servers are likely to be good candidates for serverconsolidation.
With the color-coded ranking table, you can quickly see which computers are the biggest consumers of resources, and
which key resources they are consuming.
For example, it is obvious in the example shown in the following figure that the second server in the table is in critical
state, with other servers exceeding the threshold for physical memory used.
Ranking table for the Datacenter Overview
8/21/2019 Using BMC Performance Perceiver-V5-20141128_0503
http://slidepdf.com/reader/full/using-bmc-performance-perceiver-v5-201411280503 15/245
Using BMC Performance Perceiver BMC Software Confidential
BMC Capacity Optimization 9.5 Page of15 245
The ranking table uses the following color-coding conventions:
Metrics that are equal to or greater than their threshold, are shown in bold with a red background.
Metrics that are equal to or greater than their guideline, but less than their threshold, are shown in italics with a
yellow background.
Metrics that are less than their guideline or that do not have guidelines and thresholds are shown with either a
white or gray background.
The metrics shown in the table have default guidelines and thresholds, based on identified industry standards, which
can be overridden by BMC Performance Perceiver Builder to represent the objectives for your data center. BMC
Performance Perceiver Builder has access to the Build Views tab, which provides the capacity to edit existing views or
create new ones. For details on setting guidelines and thresholds, see .Customizing chart properties (see page 203)
For descriptions of the columns on the ranking table, see .Ranking table (see page )
Tip
You can sort the list of computers by clicking on any of the column headings.
Now that you see which computers are the biggest resource consumers, you can create a subset group of the top ten
resource users identified in the ranking table to refine the scope of your analysis.
To proceed to the next step in the workflow, see .Creating subset groups (see page 16)
8/21/2019 Using BMC Performance Perceiver-V5-20141128_0503
http://slidepdf.com/reader/full/using-bmc-performance-perceiver-v5-201411280503 16/245
Using BMC Performance Perceiver BMC Software Confidential
BMC Capacity Optimization 9.5 Page of16 245
1.
2.
3.
4.
5.
2.3.3 Creating subset groups
You have now identified two groups that require different approaches:
Computers with low resource utilization that you want to include in a server consolidation study
Computers with high resource utilization that you would like to investigate
To create a subset group
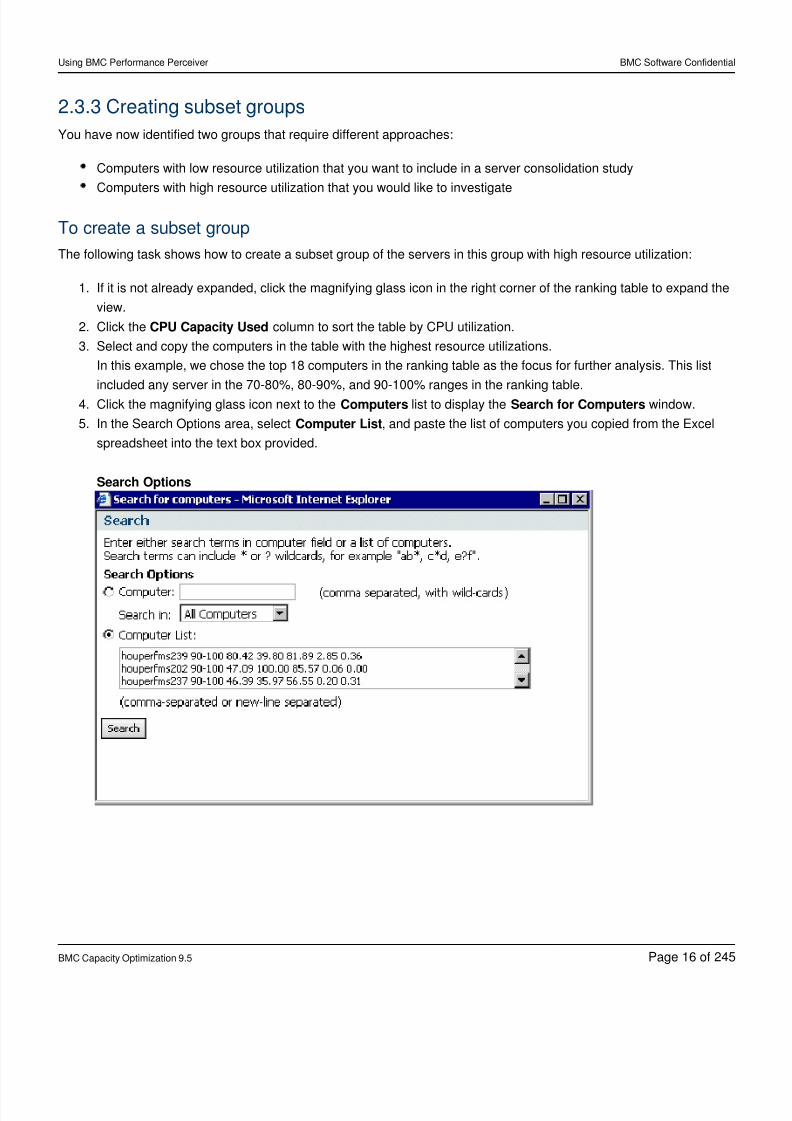
The following task shows how to create a subset group of the servers in this group with high resource utilization:
If it is not already expanded, click the magnifying glass icon in the right corner of the ranking table to expand the
view.
Click the column to sort the table by CPU utilization.CPU Capacity Used
Select and copy the computers in the table with the highest resource utilizations.
In this example, we chose the top 18 computers in the ranking table as the focus for further analysis. This list
included any server in the 70-80%, 80-90%, and 90-100% ranges in the ranking table.
Click the magnifying glass icon next to the list to display the window.Computers Search for Computers
In the Search Options area, select , and paste the list of computers you copied from the ExcelComputer List
spreadsheet into the text box provided.
Search Options
8/21/2019 Using BMC Performance Perceiver-V5-20141128_0503
http://slidepdf.com/reader/full/using-bmc-performance-perceiver-v5-201411280503 17/245
Using BMC Performance Perceiver BMC Software Confidential
BMC Capacity Optimization 9.5 Page of17 245
6.
7.
8.
9.
10.
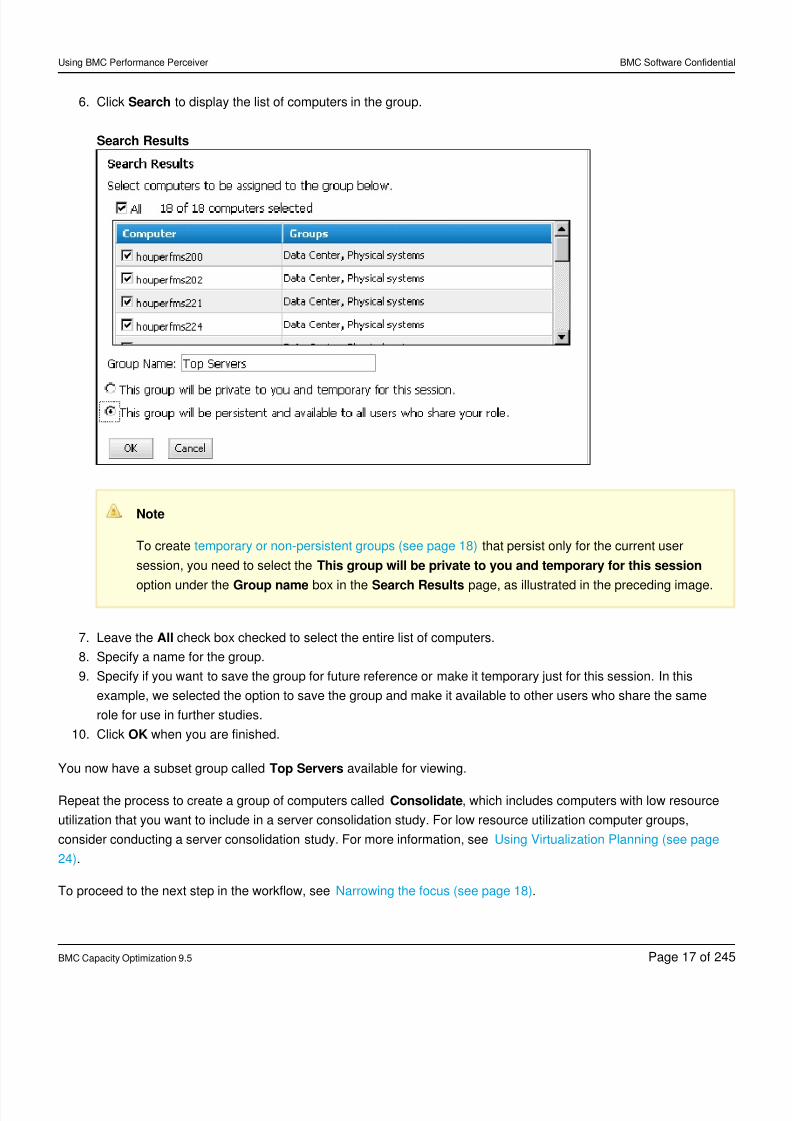
Click to display the list of computers in the group.Search
Search Results
Note
To create that persist only for the current usertemporary or non-persistent groups (see page 18)
session, you need to select the This group will be private to you and temporary for this session
option under the box in the page, as illustrated in the preceding image.Group name Search Results
Leave the check box checked to select the entire list of computers.All
Specify a name for the group.
Specify if you want to save the group for future reference or make it temporary just for this session. In this
example, we selected the option to save the group and make it available to other users who share the same
role for use in further studies.
Click when you are finished.OK
You now have a subset group called available for viewing.Top Servers
Repeat the process to create a group of computers called , which includes computers with low resourceConsolidate
utilization that you want to include in a server consolidation study. For low resource utilization computer groups,
consider conducting a server consolidation study. For more information, see Using Virtualization Planning (see page
.24)
To proceed to the next step in the workflow, see .Narrowing the focus (see page 18)
8/21/2019 Using BMC Performance Perceiver-V5-20141128_0503
http://slidepdf.com/reader/full/using-bmc-performance-perceiver-v5-201411280503 18/245
Using BMC Performance Perceiver BMC Software Confidential
BMC Capacity Optimization 9.5 Page of18 245
Non-persistent groups
Non-persistent groups are temporary for the user session. You can only have one active non-persistent group active at
a time.
The previously created non-persistent group will overwrite any non-persistent group in the user session, and will be
added to the end of the group dropdown list.
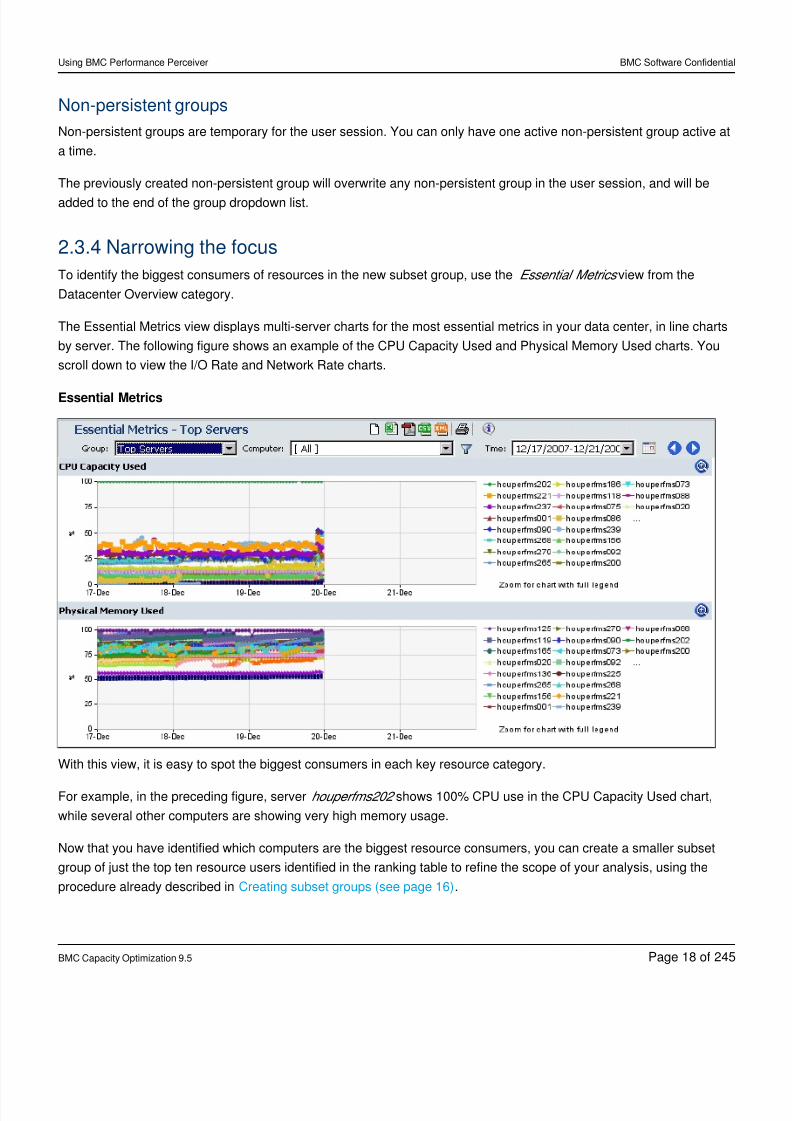
2.3.4 Narrowing the focus
To identify the biggest consumers of resources in the new subset group, use the view from theEssential Metrics
Datacenter Overview category.
The Essential Metrics view displays multi-server charts for the most essential metrics in your data center, in line charts
by server. The following figure shows an example of the CPU Capacity Used and Physical Memory Used charts. You
scroll down to view the I/O Rate and Network Rate charts.
Essential Metrics
With this view, it is easy to spot the biggest consumers in each key resource category.
For example, in the preceding figure, server shows 100% CPU use in the CPU Capacity Used chart,houperfms202
while several other computers are showing very high memory usage.
Now that you have identified which computers are the biggest resource consumers, you can create a smaller subset
group of just the top ten resource users identified in the ranking table to refine the scope of your analysis, using the
procedure already described in .Creating subset groups (see page 16)
8/21/2019 Using BMC Performance Perceiver-V5-20141128_0503
http://slidepdf.com/reader/full/using-bmc-performance-perceiver-v5-201411280503 19/245
Using BMC Performance Perceiver BMC Software Confidential
BMC Capacity Optimization 9.5 Page of19 245
1.
2.
3.
4.
To proceed to the next step in the workflow, see .Exploring resource usage across the group (see page 19)
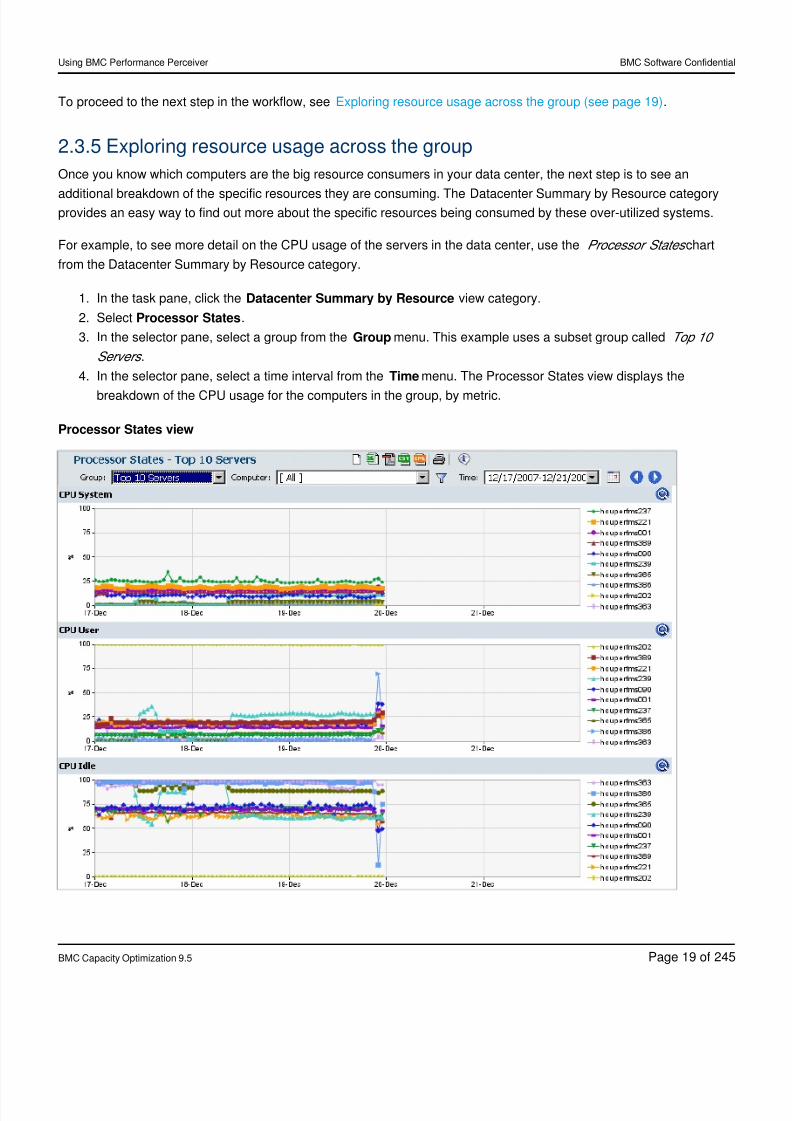
2.3.5 Exploring resource usage across the group
Once you know which computers are the big resource consumers in your data center, the next step is to see an
additional breakdown of the specific resources they are consuming. The Datacenter Summary by Resource categoryprovides an easy way to find out more about the specific resources being consumed by these over-utilized systems.
For example, to see more detail on the CPU usage of the servers in the data center, use the chartProcessor States
from the Datacenter Summary by Resource category.
In the task pane, click the view category.Datacenter Summary by Resource
Select .Processor States
In the selector pane, select a group from the menu. This example uses a subset group calledGroup Top 10
.Servers
In the selector pane, select a time interval from the menu. The Processor States view displays theTime
breakdown of the CPU usage for the computers in the group, by metric.
Processor States view
8/21/2019 Using BMC Performance Perceiver-V5-20141128_0503
http://slidepdf.com/reader/full/using-bmc-performance-perceiver-v5-201411280503 20/245
Using BMC Performance Perceiver BMC Software Confidential
BMC Capacity Optimization 9.5 Page of20 245
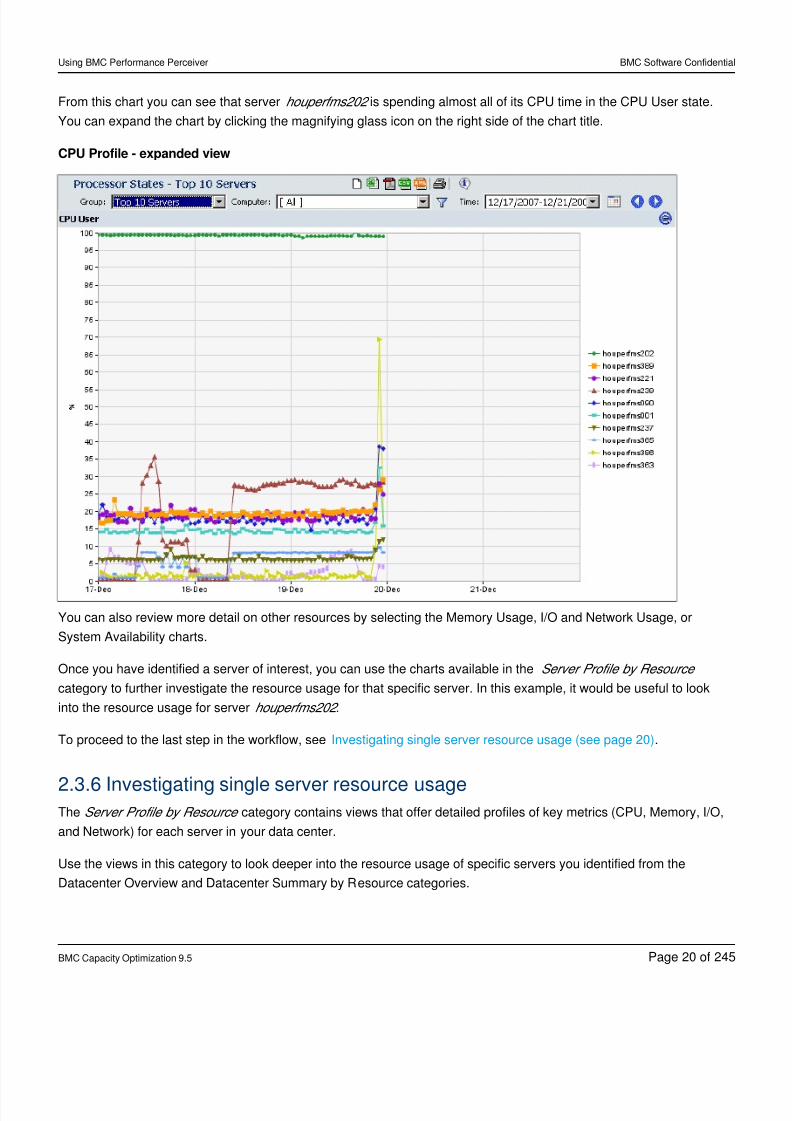
From this chart you can see that server is spending almost all of its CPU time in the CPU User state.houperfms202
You can expand the chart by clicking the magnifying glass icon on the right side of the chart title.
CPU Profile - expanded view
You can also review more detail on other resources by selecting the Memory Usage, I/O and Network Usage, or
System Availability charts.
Once you have identified a server of interest, you can use the charts available in the Server Profile by Resource
category to further investigate the resource usage for that specific server. In this example, it would be useful to look
into the resource usage for server .houperfms202
To proceed to the last step in the workflow, see .Investigating single server resource usage (see page 20)
2.3.6 Investigating single server resource usageThe category contains views that offer detailed profiles of key metrics (CPU, Memory, I/O,Server Profile by Resource
and Network) for each server in your data center.
Use the views in this category to look deeper into the resource usage of specific servers you identified from the
Datacenter Overview and Datacenter Summary by Resource categories.
8/21/2019 Using BMC Performance Perceiver-V5-20141128_0503
http://slidepdf.com/reader/full/using-bmc-performance-perceiver-v5-201411280503 21/245
Using BMC Performance Perceiver BMC Software Confidential
BMC Capacity Optimization 9.5 Page of21 245
1.
2.
3.
4.
5.
In the task pane, click the category.Server Profile by Resource
Select the view.CPU Profile
In the selector pane, select a group from the menu. This example is using a group calledGroup Top 10 Servers
.
Select a computer in that group from the menu.Computer
(In Step 5, we had already ).identified as a computer of interesthouperfms202 (see page 20)
In the selector pane, select a time interval from the menu.Time
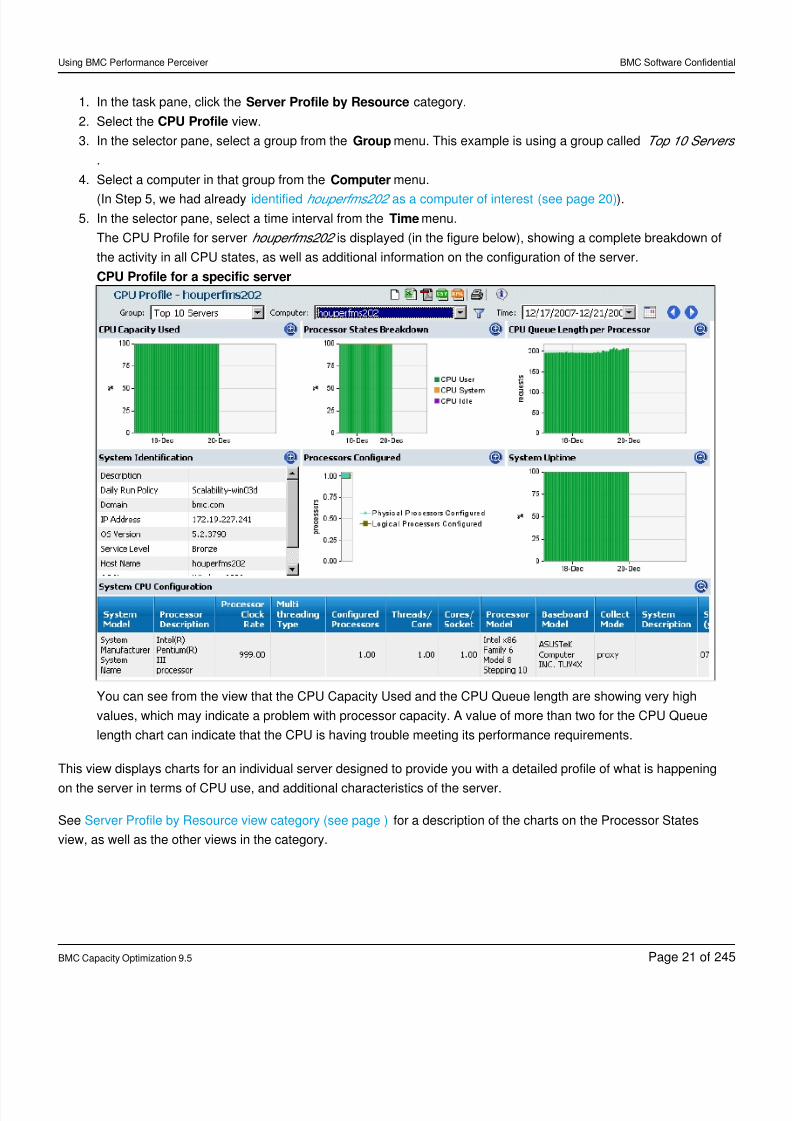
The CPU Profile for server is displayed (in the figure below), showing a complete breakdown ofhouperfms202
the activity in all CPU states, as well as additional information on the configuration of the server.
CPU Profile for a specific server
You can see from the view that the CPU Capacity Used and the CPU Queue length are showing very high
values, which may indicate a problem with processor capacity. A value of more than two for the CPU Queue
length chart can indicate that the CPU is having trouble meeting its performance requirements.
This view displays charts for an individual server designed to provide you with a detailed profile of what is happening
on the server in terms of CPU use, and additional characteristics of the server.
See for a description of the charts on the Processor StatesServer Profile by Resource view category (see page )
view, as well as the other views in the category.
8/21/2019 Using BMC Performance Perceiver-V5-20141128_0503
http://slidepdf.com/reader/full/using-bmc-performance-perceiver-v5-201411280503 22/245
Using BMC Performance Perceiver BMC Software Confidential
BMC Capacity Optimization 9.5 Page of22 245
3 Determining what to do after exploring the graphs
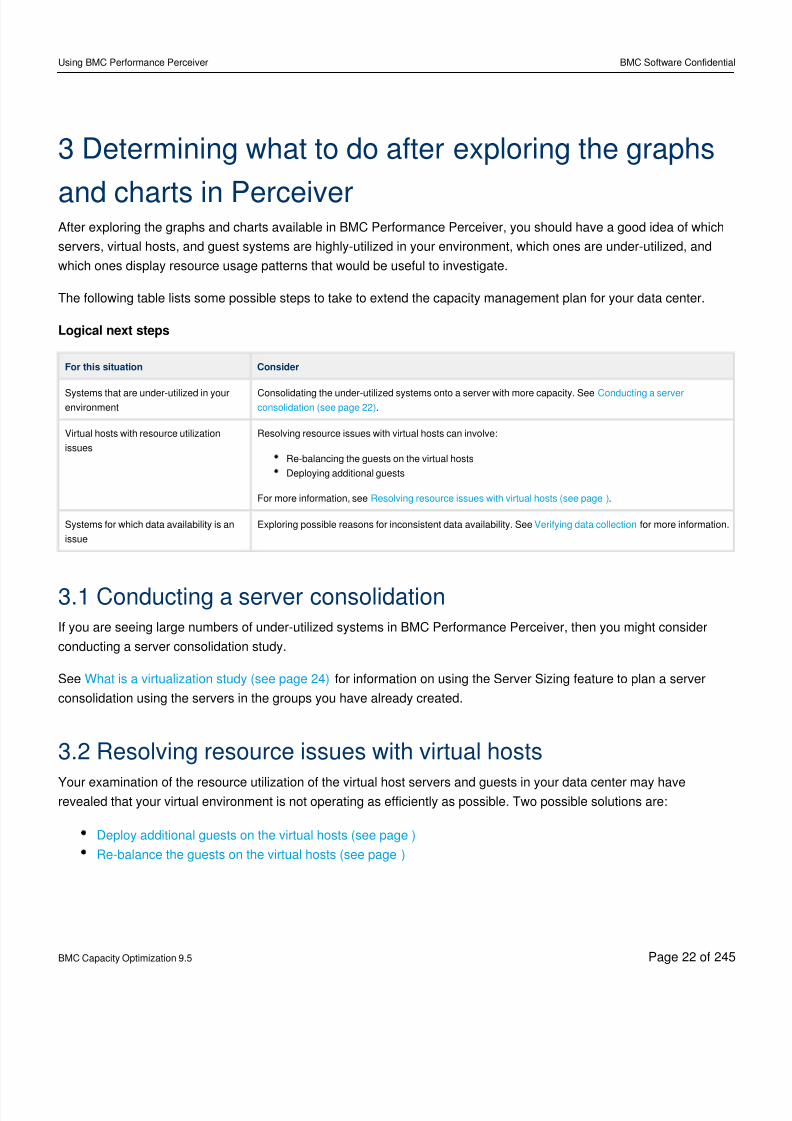
and charts in PerceiverAfter exploring the graphs and charts available in BMC Performance Perceiver, you should have a good idea of which
servers, virtual hosts, and guest systems are highly-utilized in your environment, which ones are under-utilized, and
which ones display resource usage patterns that would be useful to investigate.
The following table lists some possible steps to take to extend the capacity management plan for your data center.
Logical next steps
For this situation Consider
Systems that are under-utilized in yourenvironment
Consolidating the under-utilized systems onto a server with more capacity. See Conducting a server.consolidation (see page 22)
Virtual hosts with resource utilization
issues
Resolving resource issues with virtual hosts can involve:
Re-balancing the guests on the virtual hosts
Deploying additional guests
For more information, see .Resolving resource issues with virtual hosts (see page )
Systems for which data availability is an
issue
Exploring possible reasons for inconsistent data availability. See for more information.Verifying data collection
3.1 Conducting a server consolidationIf you are seeing large numbers of under-utilized systems in BMC Performance Perceiver, then you might consider
conducting a server consolidation study.
See for information on using the Server Sizing feature to plan a serverWhat is a virtualization study (see page 24)
consolidation using the servers in the groups you have already created.
3.2 Resolving resource issues with virtual hosts
Your examination of the resource utilization of the virtual host servers and guests in your data center may haverevealed that your virtual environment is not operating as efficiently as possible. Two possible solutions are:
Deploy additional guests on the virtual hosts (see page )
Re-balance the guests on the virtual hosts (see page )
8/21/2019 Using BMC Performance Perceiver-V5-20141128_0503
http://slidepdf.com/reader/full/using-bmc-performance-perceiver-v5-201411280503 23/245
Using BMC Performance Perceiver BMC Software Confidential
BMC Capacity Optimization 9.5 Page of23 245
3.2.1 Deploy additional guests
Your examination of the resource utilization of the virtual host servers and guests in your data center may have
revealed that you need to deploy new guests that are similar in performance to guests that already exist.
For example, your examination of the servers in your environment may have revealed that the web servers are very
busy. As a result, you might want to deploy additional web servers to handle the traffic. In this case, you might not
want to base your deployment on the performance of the existing guests (which is high), but rather on a saved guest
profile of more normal traffic.
Another example would be a research and development company that provides employees with a guest system on
which to do development work. In this case, there are already a number of guests for existing developers, and the
desire would be to:
Duplicate one (or more) of those guests.
Determine which virtual host would be the logical location on which to add the new guest.
3.2.2 Rebalance the guests on the virtual hosts
If you have determined that some of the virtual hosts in your data center are over-utilized, and some are under-utilized,
consider using the Virtualization Planning feature to .Creating the Rebalancing Study (see page 48)
8/21/2019 Using BMC Performance Perceiver-V5-20141128_0503
http://slidepdf.com/reader/full/using-bmc-performance-perceiver-v5-201411280503 24/245
Using BMC Performance Perceiver BMC Software Confidential
BMC Capacity Optimization 9.5 Page of24 245
4 Using Virtualization Planning
4.1 What is Virtualization Planning?Companies - large or small - are always looking for ways to streamline their organization, reduce costs, and continue
to provide optimal customer service. One industry trend that addresses these goals is virtualization.
Suppose you are a Performance Analyst for Company Y, and your company is looking for ways to cut costs in all
departments. You know of a number of under-utilized Windows machines and believe you can save money by
consolidating servers. Your manager has asked you to report on the performance and capacity of these machines and
provide a virtualization recommendation.
Virtualization Planning helps you assess and report on your virtualization efforts. Based on existing business serviceobjectives, you can conduct a to determine the number of virtual hosts you need to support yourvirtualization study
virtualization goals, including server consolidation, and obtain easy-to-read recommendations through web-based
reports and graphs.
For more information, see:
What is a virtualization study? (see page 24)
Before you begin a virtualization study in Perceiver (see page 25)
Selecting the type of virtualization study (see page 25)
Working with a New Study (see page 27)
Working with saved studies (see page 50)Working with Study Profiles (see page 51)
Working with guest profiles (see page 53)
Changing default Virtualization Planning settings (see page 54)
Customization settings of a virtualization study (see page 55)
Troubleshooting Virtualization Planning (see page 61)
4.2 What is a virtualization study?A study created using Virtualization Planning consists of the following:
A list of candidate computers (stand-alone servers or guests) selected to participate in the study.
The which specifies the virtualization platform to be utilized, the hardware for new hosts ontoStudy Profile
which the computers may be consolidated, and parameters such as thresholds and CPU overhead.
A list of targets (virtual hosts or, if supported by the virtualization platform, resource pools or clusters) on which
to assign the candidates.
8/21/2019 Using BMC Performance Perceiver-V5-20141128_0503
http://slidepdf.com/reader/full/using-bmc-performance-perceiver-v5-201411280503 25/245
Using BMC Performance Perceiver BMC Software Confidential
BMC Capacity Optimization 9.5 Page of25 245
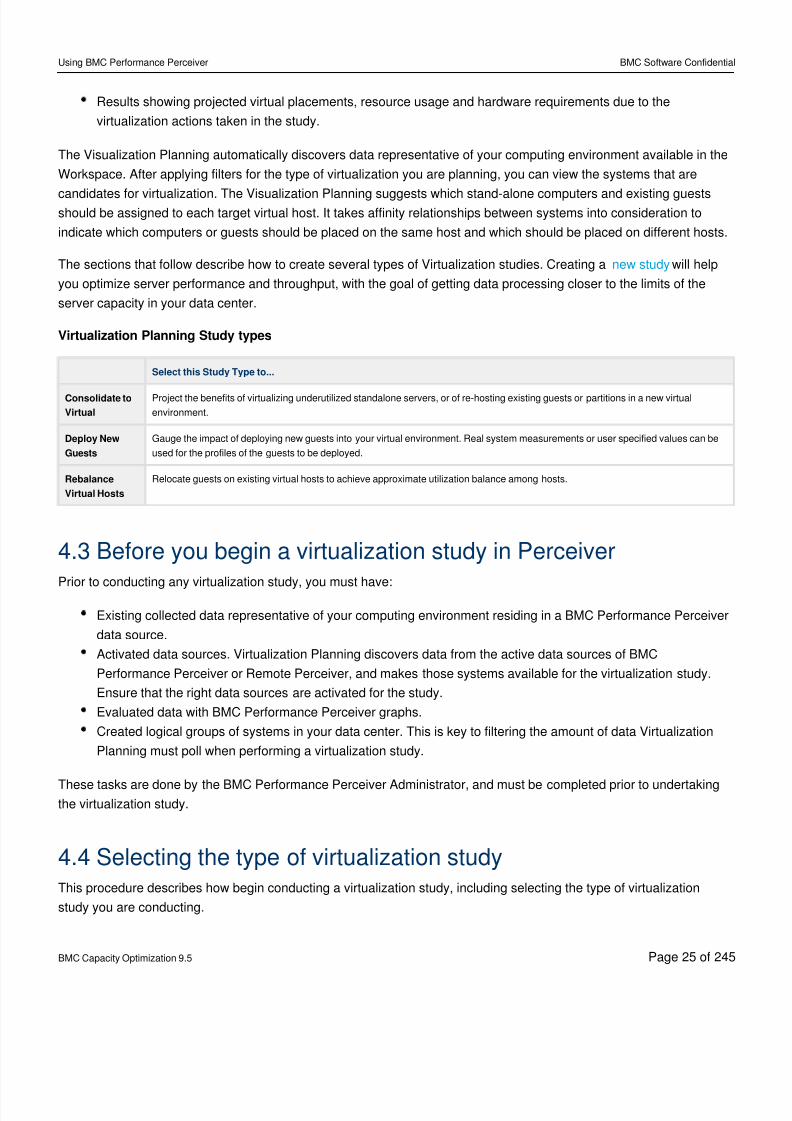
Results showing projected virtual placements, resource usage and hardware requirements due to the
virtualization actions taken in the study.
The Visualization Planning automatically discovers data representative of your computing environment available in the
Workspace. After applying filters for the type of virtualization you are planning, you can view the systems that are
candidates for virtualization. The Visualization Planning suggests which stand-alone computers and existing guestsshould be assigned to each target virtual host. It takes affinity relationships between systems into consideration to
indicate which computers or guests should be placed on the same host and which should be placed on different hosts.
The sections that follow describe how to create several types of Virtualization studies. Creating a will helpnew study
you optimize server performance and throughput, with the goal of getting data processing closer to the limits of the
server capacity in your data center.
Virtualization Planning Study types
Select this Study Type to...
Consolidate to
Virtual
Project the benefits of virtualizing underutilized standalone servers, or of re-hosting existing guests or partitions in a new virtual
environment.
Deploy New
Guests
Gauge the impact of deploying new guests into your virtual environment. Real system measurements or user specified values can be
used for the profiles of the guests to be deployed.
Rebalance
Virtual Hosts
Relocate guests on existing virtual hosts to achieve approximate utilization balance among hosts.
4.3 Before you begin a virtualization study in PerceiverPrior to conducting any virtualization study, you must have:
Existing collected data representative of your computing environment residing in a BMC Performance Perceiver
data source.
Activated data sources. Virtualization Planning discovers data from the active data sources of BMC
Performance Perceiver or Remote Perceiver, and makes those systems available for the virtualization study.
Ensure that the right data sources are activated for the study.
Evaluated data with BMC Performance Perceiver graphs.
Created logical groups of systems in your data center. This is key to filtering the amount of data Virtualization
Planning must poll when performing a virtualization study.
These tasks are done by the BMC Performance Perceiver Administrator, and must be completed prior to undertakingthe virtualization study.
4.4 Selecting the type of virtualization studyThis procedure describes how begin conducting a virtualization study, including selecting the type of virtualization
study you are conducting.
8/21/2019 Using BMC Performance Perceiver-V5-20141128_0503
http://slidepdf.com/reader/full/using-bmc-performance-perceiver-v5-201411280503 26/245
Using BMC Performance Perceiver BMC Software Confidential
BMC Capacity Optimization 9.5 Page of26 245
1.
2.
3.
4.
4.4.1 To select the type of virtualization study
Start BMC Performance Perceiver (see ).Starting BMC Performance Perceiver (see page 10)
Log on to BMC Performance Perceiver using the user name and password assigned by BMC Performance
Perceiver Administrator.The default credentials for access to the tab are:Virtualization Planning
User name: sizer
Password: sizer
By default, these credentials give you access rights to the Views, Build Views, and Virtualization Planning
tabs.
Tip
If you select a group and a time period in BMC Performance Perceiver and then click the
Virtualization Planning tab, those settings will be automatically populated to Virtualization
Planning.
When you log on to BMC Performance Perceiver, click the tab.Virtualization Planning
Verify that the date range shown at the top of the page reflects the desired time period for the study. If it does
not, click the calendar icon and choose a different date range.
Tip
To ensure that you capture the entire lifecycle for the applications in your data center, use a time
period between one and four weeks.
8/21/2019 Using BMC Performance Perceiver-V5-20141128_0503
http://slidepdf.com/reader/full/using-bmc-performance-perceiver-v5-201411280503 27/245
Using BMC Performance Perceiver BMC Software Confidential
BMC Capacity Optimization 9.5 Page of27 245
5.
6.
7.
Verify the computer count is roughly what you would expect, given the data sources that are currently active in
BMC Performance Perceiver.
Keep the following guidelines in mind when using groups to create new studies:
The groups and intervals you select on the Views and Build Views tabs are imported to the Virtualization
Planning tab anytime the New Virtualization Study page is displayed when selecting the Virtualization
Planning tab:
You go to the Virtualization Planning tab the first time in a session.
You go to the Virtualization Planning Welcome page or Begin page any time during the session.
The group and interval changes and deletions you make on the Views and Build.
Views tabs are imported to the Virtualization Planning tab.
Keep the following in mind when using groups with saved studies:
If you use the calendar to change the date range in a saved study, the Virtualization Planning module
uses the study group to filter the data.
If the group you used in the saved study is changed, this module does not update the group data in the
saved study.
If the group you used in the saved study is deleted, this module has no way to filter the data and reloadsall available data.
Tip
If the values for the Computer Types in the Computer Count table are blank, it means that there
is no data in the active data sources for the date range specified in the field. ClickTime Period
the calendar icon and choose a different date range.
Choose the type of virtualization study you want to conduct:To consolidate physical systems, existing guests, or both types of systems onto a new virtual hosts, click
.Consolidate to Virtual
To deploy new guests to new or existing virtual hosts, click .Deploy New Guests
To rebalance the guests running on virtual hosts in your environment for optimal performance, click
. This option is displayed only if there are virtual hosts in the active dataRebalance Virtual Hosts
sources.
Proceed to one of the following sections, based on the study you chose:
Consolidating to virtual hosts (see page 28)
Deploying new guests (see page 43)
Rebalancing existing virtual hosts (see page 48)
4.5 Working with a New StudyClick in the task pane displayed after selecting the Visualization Planning tab. The following study typesNew Study
are available as part of the Visualization Planning. You should select the study type based on your specific
requirement.
8/21/2019 Using BMC Performance Perceiver-V5-20141128_0503
http://slidepdf.com/reader/full/using-bmc-performance-perceiver-v5-201411280503 28/245
Using BMC Performance Perceiver BMC Software Confidential
BMC Capacity Optimization 9.5 Page of28 245
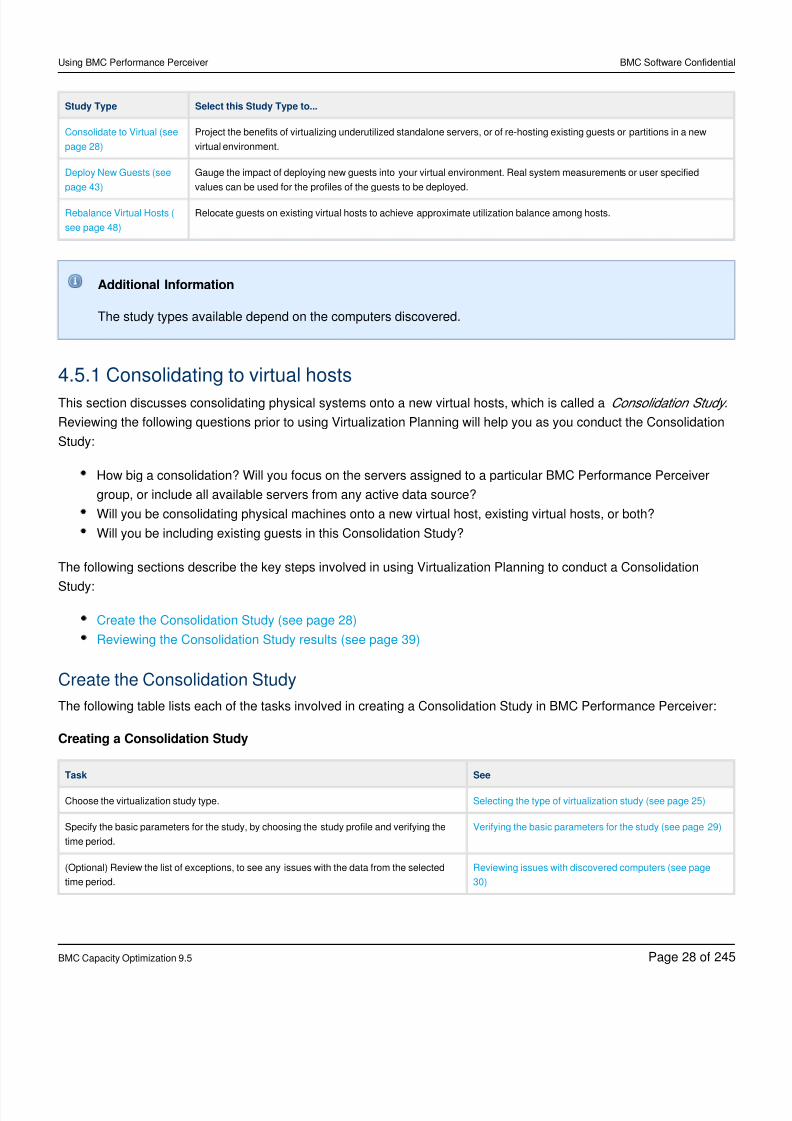
Study Type Select this Study Type to...
Consolidate to Virtual (see
page 28)
Project the benefits of virtualizing underutilized standalone servers, or of re-hosting existing guests or partitions in a new
virtual environment.
Deploy New Guests (see
page 43)
Gauge the impact of deploying new guests into your virtual environment. Real system measurements or user specified
values can be used for the profiles of the guests to be deployed.
Rebalance Virtual Hosts (
see page 48)
Relocate guests on existing virtual hosts to achieve approximate utilization balance among hosts.
Additional Information
The study types available depend on the computers discovered.
4.5.1 Consolidating to virtual hosts
This section discusses consolidating physical systems onto a new virtual hosts, which is called a .Consolidation Study
Reviewing the following questions prior to using Virtualization Planning will help you as you conduct the Consolidation
Study:
How big a consolidation? Will you focus on the servers assigned to a particular BMC Performance Perceiver
group, or include all available servers from any active data source?
Will you be consolidating physical machines onto a new virtual host, existing virtual hosts, or both?
Will you be including existing guests in this Consolidation Study?
The following sections describe the key steps involved in using Virtualization Planning to conduct a Consolidation
Study:
Create the Consolidation Study (see page 28)
Reviewing the Consolidation Study results (see page 39)
Create the Consolidation Study
The following table lists each of the tasks involved in creating a Consolidation Study in BMC Performance Perceiver:
Creating a Consolidation Study
Task See
Choose the virtualization study type. Selecting the type of virtualization study (see page 25)
Specify the basic parameters for the study, by choosing the study profile and verifying the
time period.
Verifying the basic parameters for the study (see page 29)
(Optional) Review the list of exceptions, to see any issues with the data from the selected
time period.
Reviewing issues with discovered computers (see page
30)
8/21/2019 Using BMC Performance Perceiver-V5-20141128_0503
http://slidepdf.com/reader/full/using-bmc-performance-perceiver-v5-201411280503 29/245
Using BMC Performance Perceiver BMC Software Confidential
BMC Capacity Optimization 9.5 Page of29 245
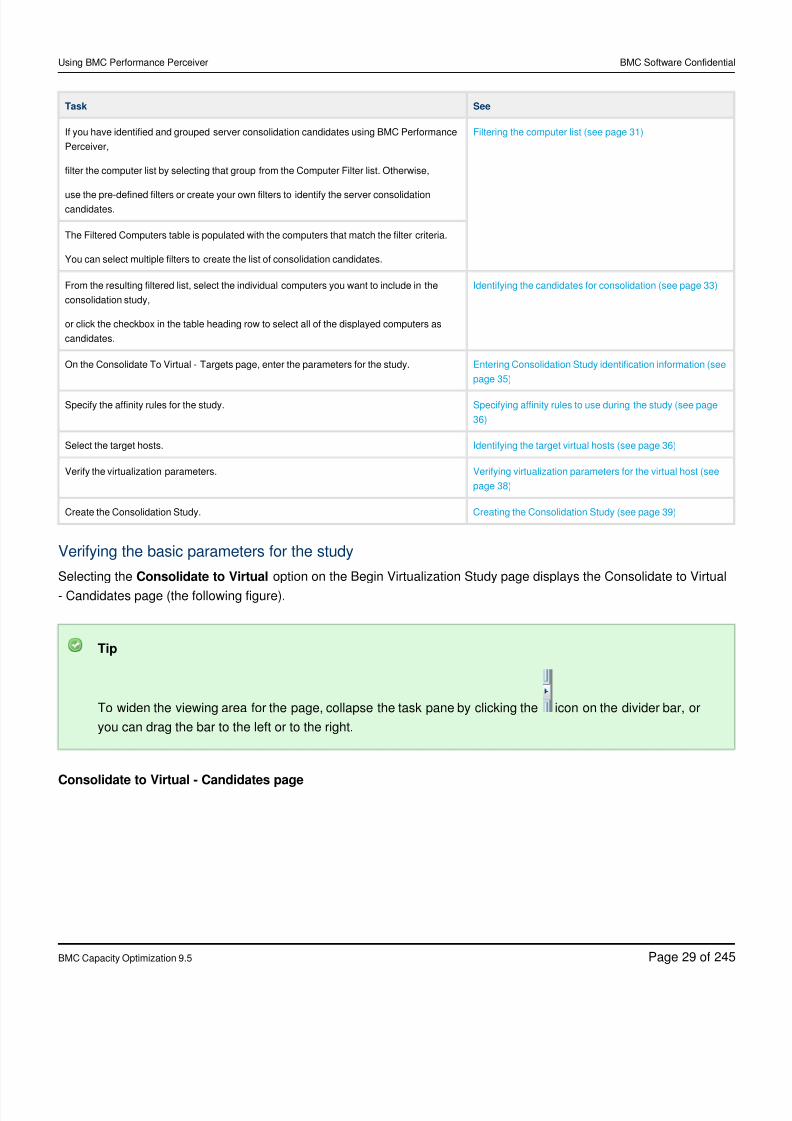
Task See
If you have identified and grouped server consolidation candidates using BMC Performance
Perceiver,
filter the computer list by selecting that group from the Computer Filter list. Otherwise,
use the pre-defined filters or create your own filters to identify the server consolidationcandidates.
Filtering the computer list (see page 31)
The Filtered Computers table is populated with the computers that match the filter criteria.
You can select multiple filters to create the list of consolidation candidates.
From the resulting filtered list, select the individual computers you want to include in the
consolidation study,
or click the checkbox in the table heading row to select all of the displayed computers as
candidates.
Identifying the candidates for consolidation (see page 33)
On the Consolidate To Virtual - Targets page, enter the parameters for the study. Entering Consolidation Study identification information (see
page 35)
Specify the affinity rules for the study. Specifying affinity rules to use during the study (see page
36)
Select the target hosts. Identifying the target virtual hosts (see page 36)
Verify the virtualization parameters. Verifying virtualization parameters for the virtual host (see
page 38)
Create the Consolidation Study. Creating the Consolidation Study (see page 39)
Verifying the basic parameters for the study
Selecting the option on the Begin Virtualization Study page displays the Consolidate to VirtualConsolidate to Virtual
- Candidates page (the following figure).
Tip
To widen the viewing area for the page, collapse the task pane by clicking the icon on the divider bar, or
you can drag the bar to the left or to the right.
Consolidate to Virtual - Candidates page
8/21/2019 Using BMC Performance Perceiver-V5-20141128_0503
http://slidepdf.com/reader/full/using-bmc-performance-perceiver-v5-201411280503 30/245
Using BMC Performance Perceiver BMC Software Confidential
BMC Capacity Optimization 9.5 Page of30 245
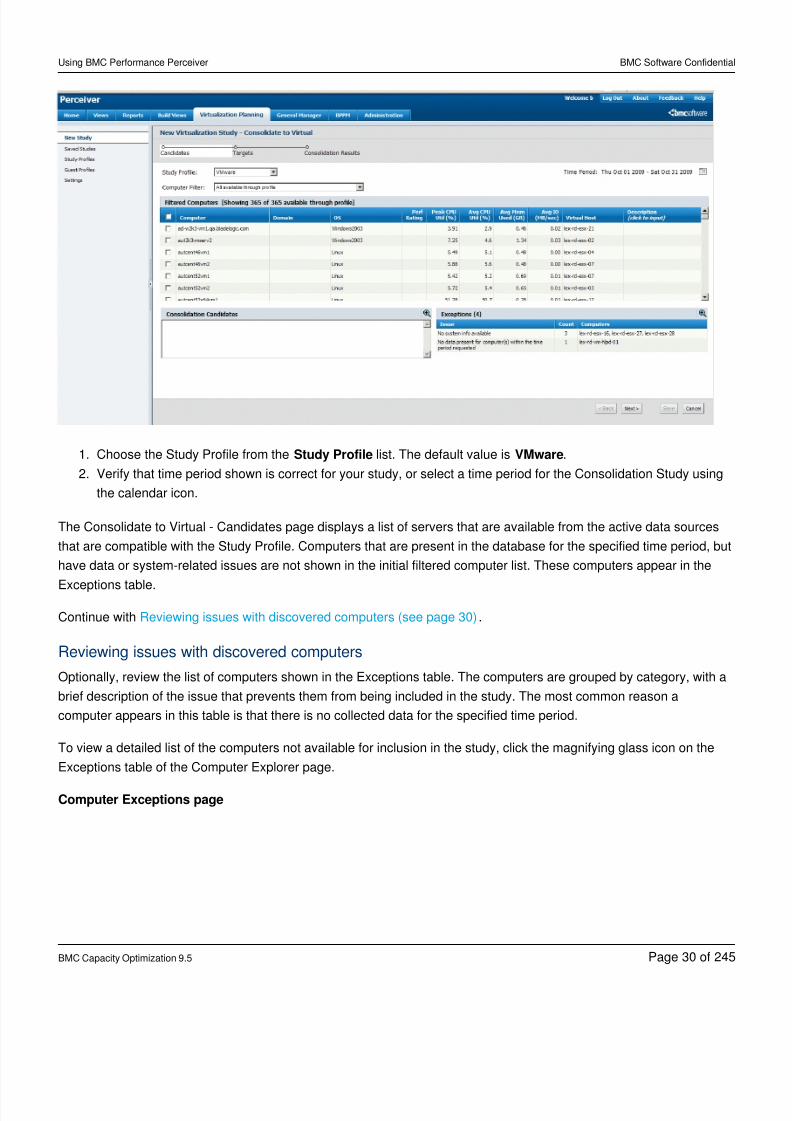
1.
2.
Choose the Study Profile from the list. The default value is .Study Profile VMware
Verify that time period shown is correct for your study, or select a time period for the Consolidation Study using
the calendar icon.
The Consolidate to Virtual - Candidates page displays a list of servers that are available from the active data sources
that are compatible with the Study Profile. Computers that are present in the database for the specified time period, but
have data or system-related issues are not shown in the initial filtered computer list. These computers appear in the
Exceptions table.
Continue with .Reviewing issues with discovered computers (see page 30)
Reviewing issues with discovered computers
Optionally, review the list of computers shown in the Exceptions table. The computers are grouped by category, with a
brief description of the issue that prevents them from being included in the study. The most common reason a
computer appears in this table is that there is no collected data for the specified time period.
To view a detailed list of the computers not available for inclusion in the study, click the magnifying glass icon on the
Exceptions table of the Computer Explorer page.
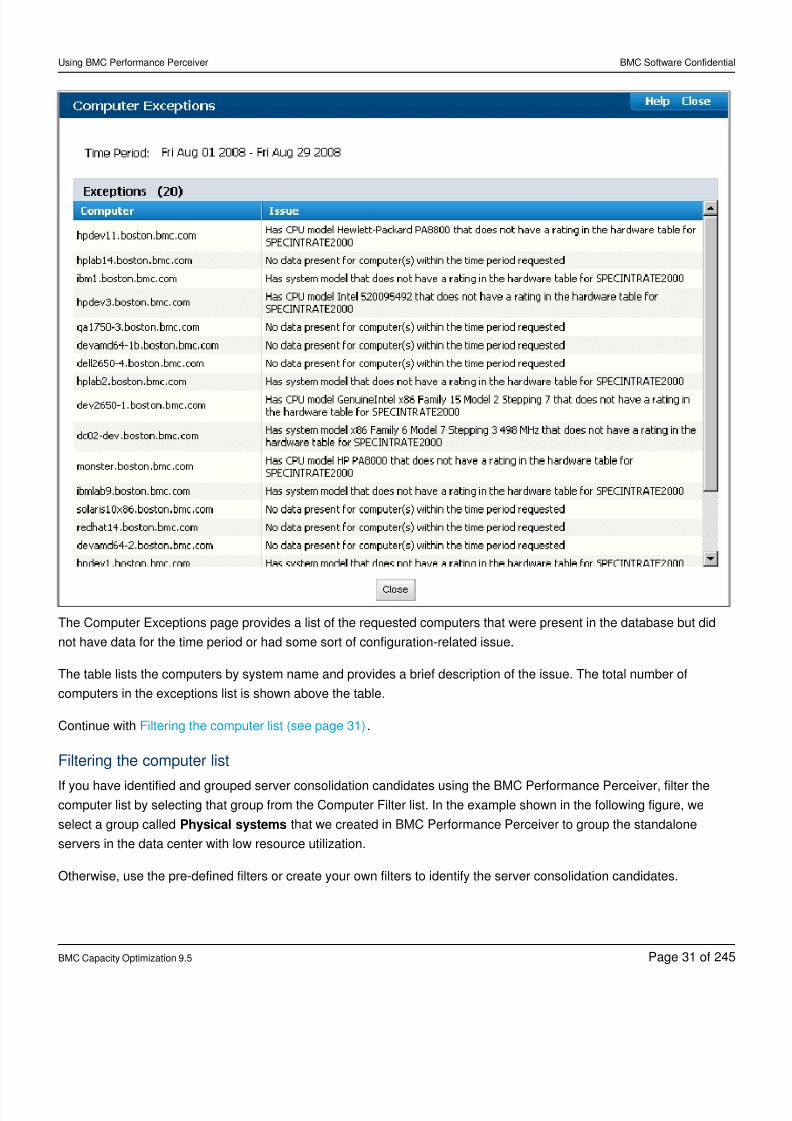
Computer Exceptions page
8/21/2019 Using BMC Performance Perceiver-V5-20141128_0503
http://slidepdf.com/reader/full/using-bmc-performance-perceiver-v5-201411280503 31/245
Using BMC Performance Perceiver BMC Software Confidential
BMC Capacity Optimization 9.5 Page of31 245
The Computer Exceptions page provides a list of the requested computers that were present in the database but did
not have data for the time period or had some sort of configuration-related issue.
The table lists the computers by system name and provides a brief description of the issue. The total number of
computers in the exceptions list is shown above the table.
Continue with .Filtering the computer list (see page 31)
Filtering the computer list
If you have identified and grouped server consolidation candidates using the BMC Performance Perceiver, filter thecomputer list by selecting that group from the Computer Filter list. In the example shown in the following figure, we
select a group called that we created in BMC Performance Perceiver to group the standalonePhysical systems
servers in the data center with low resource utilization.
Otherwise, use the pre-defined filters or create your own filters to identify the server consolidation candidates.
8/21/2019 Using BMC Performance Perceiver-V5-20141128_0503
http://slidepdf.com/reader/full/using-bmc-performance-perceiver-v5-201411280503 32/245
Using BMC Performance Perceiver BMC Software Confidential
BMC Capacity Optimization 9.5 Page of32 245
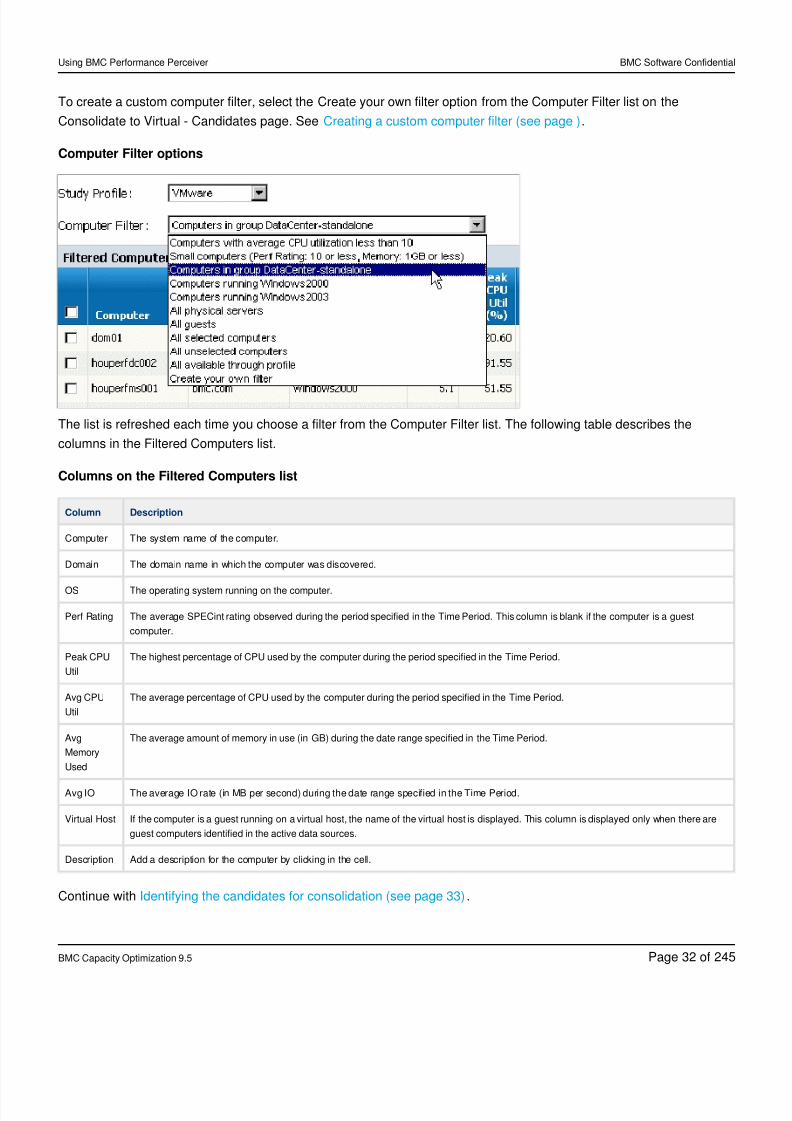
To create a custom computer filter, select the Create your own filter option from the Computer Filter list on the
Consolidate to Virtual - Candidates page. See .Creating a custom computer filter (see page )
Computer Filter options
The list is refreshed each time you choose a filter from the Computer Filter list. The following table describes the
columns in the Filtered Computers list.
Columns on the Filtered Computers list
Column Description
Computer The system name of the computer.
Domain The domain name in which the computer was discovered.
OS The operating system running on the computer.
Perf Rating The average SPECint rating observed during the period specified in the Time Period. This column is blank if the computer is a guest
computer.
Peak CPU
Util
The highest percentage of CPU used by the computer during the period specified in the Time Period.
Avg CPU
Util
The average percentage of CPU used by the computer during the period specified in the Time Period.
Avg
Memory
Used
The average amount of memory in use (in GB) during the date range specified in the Time Period.
Avg IO The average IO rate (in MB per second) during the date range specified in the Time Period.
Virtual Host If the computer is a guest running on a virtual host, the name of the virtual host is displayed. This column is displayed only when there are
guest computers identified in the active data sources.
Description Add a description for the computer by clicking in the cell.
Continue with .Identifying the candidates for consolidation (see page 33)
8/21/2019 Using BMC Performance Perceiver-V5-20141128_0503
http://slidepdf.com/reader/full/using-bmc-performance-perceiver-v5-201411280503 33/245
Using BMC Performance Perceiver BMC Software Confidential
BMC Capacity Optimization 9.5 Page of33 245
1.
2.
3.
Identifying the candidates for consolidation
The following procedure describes how to create a list of computers for a Consolidation Study.
To identify candidates for consolidation
From the Filtered Computers list, select the individual computers you want to include in the Consolidation Study,or click the check box in the table heading row to select all of the displayed computers as candidates.
( ) Click on any of the columns in the Filtered Computer list to sort the list.Optional
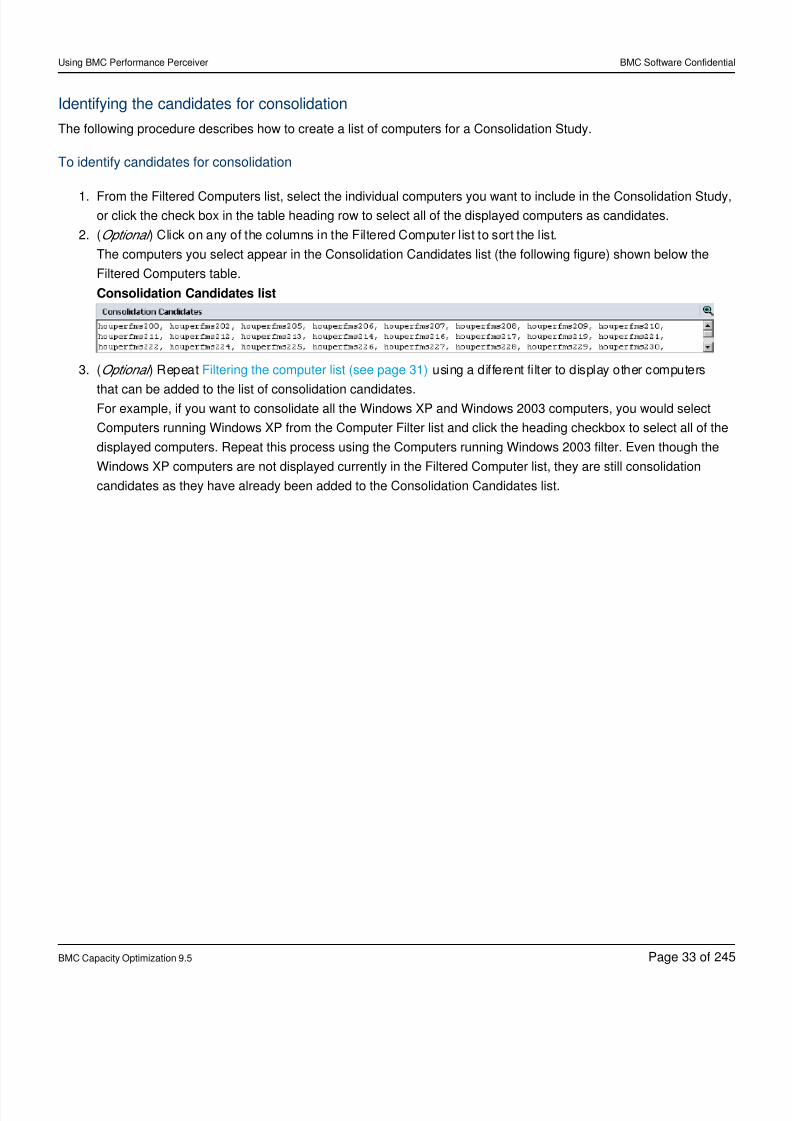
The computers you select appear in the Consolidation Candidates list (the following figure) shown below the
Filtered Computers table.
Consolidation Candidates list
( ) Repeat using a different filter to display other computersOptional Filtering the computer list (see page 31)
that can be added to the list of consolidation candidates.For example, if you want to consolidate all the Windows XP and Windows 2003 computers, you would select
Computers running Windows XP from the Computer Filter list and click the heading checkbox to select all of the
displayed computers. Repeat this process using the Computers running Windows 2003 filter. Even though the
Windows XP computers are not displayed currently in the Filtered Computer list, they are still consolidation
candidates as they have already been added to the Consolidation Candidates list.
8/21/2019 Using BMC Performance Perceiver-V5-20141128_0503
http://slidepdf.com/reader/full/using-bmc-performance-perceiver-v5-201411280503 34/245
Using BMC Performance Perceiver BMC Software Confidential
BMC Capacity Optimization 9.5 Page of34 245
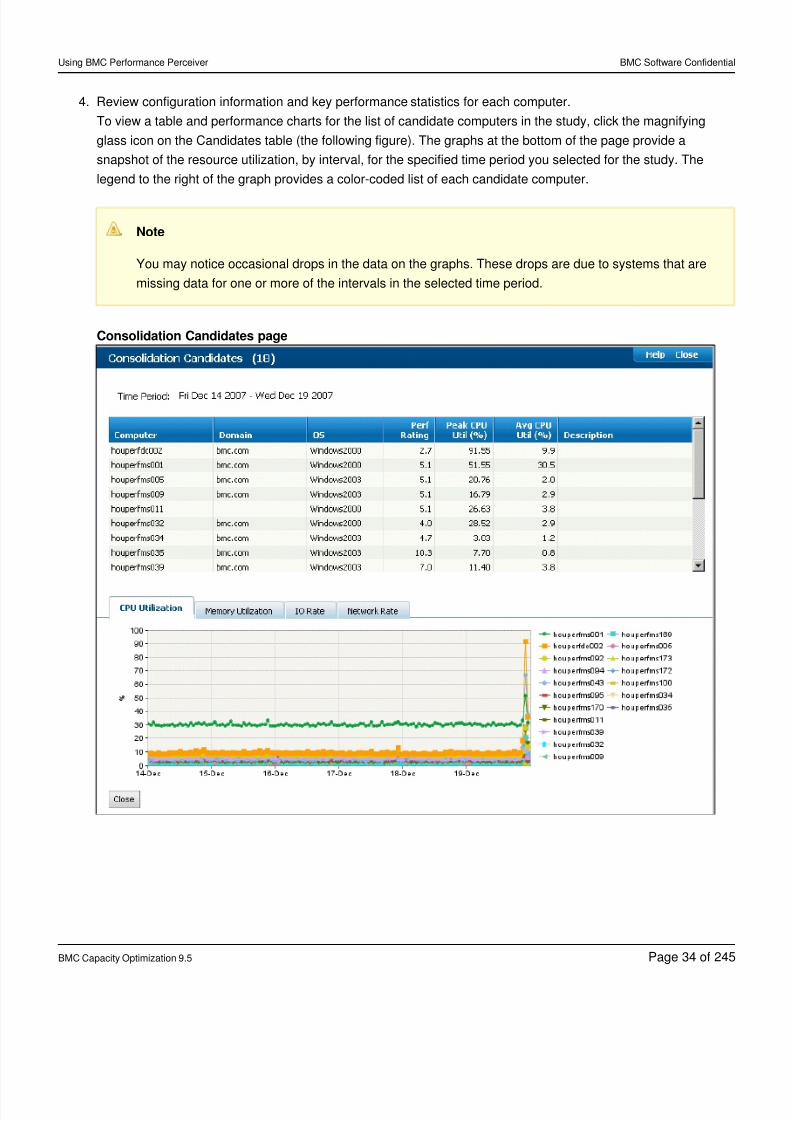
4. Review configuration information and key performance statistics for each computer.
To view a table and performance charts for the list of candidate computers in the study, click the magnifying
glass icon on the Candidates table (the following figure). The graphs at the bottom of the page provide a
snapshot of the resource utilization, by interval, for the specified time period you selected for the study. The
legend to the right of the graph provides a color-coded list of each candidate computer.
Note
You may notice occasional drops in the data on the graphs. These drops are due to systems that are
missing data for one or more of the intervals in the selected time period.
Consolidation Candidates page
8/21/2019 Using BMC Performance Perceiver-V5-20141128_0503
http://slidepdf.com/reader/full/using-bmc-performance-perceiver-v5-201411280503 35/245
Using BMC Performance Perceiver BMC Software Confidential
BMC Capacity Optimization 9.5 Page of35 245
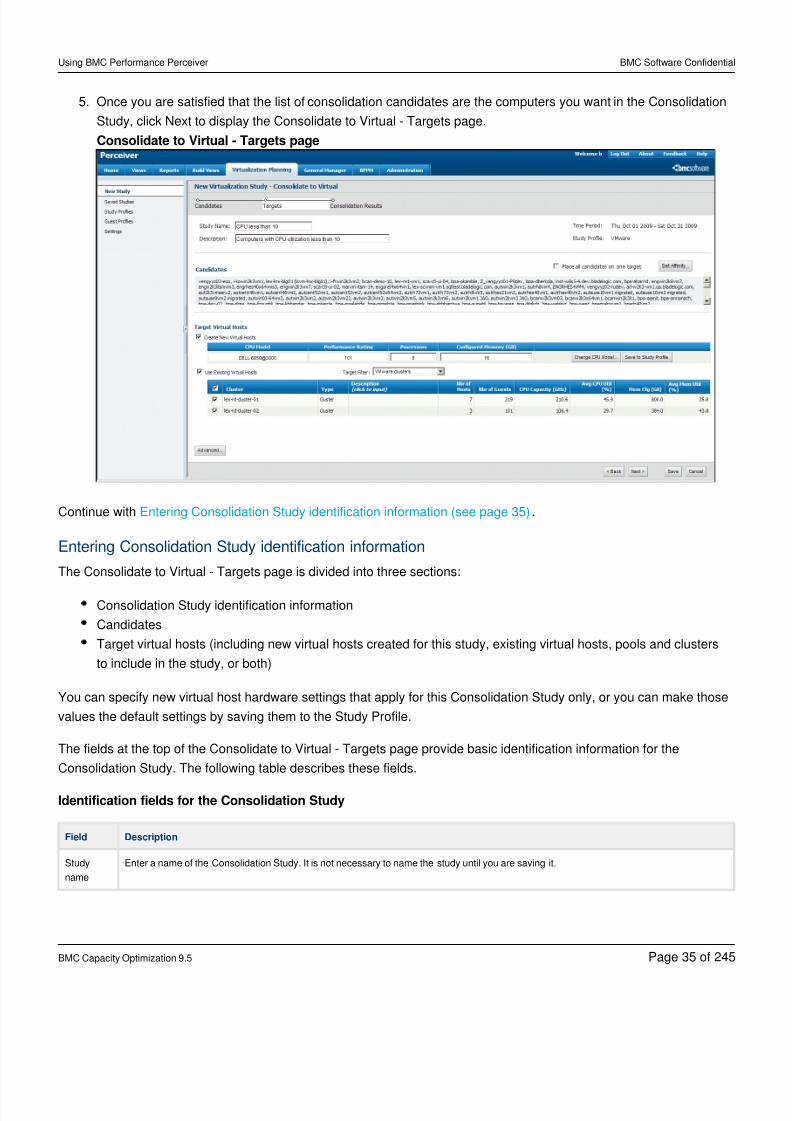
5. Once you are satisfied that the list of consolidation candidates are the computers you want in the Consolidation
Study, click Next to display the Consolidate to Virtual - Targets page.
Consolidate to Virtual - Targets page
Continue with .Entering Consolidation Study identification information (see page 35)
Entering Consolidation Study identification information
The Consolidate to Virtual - Targets page is divided into three sections:
Consolidation Study identification information
Candidates
Target virtual hosts (including new virtual hosts created for this study, existing virtual hosts, pools and clusters
to include in the study, or both)
You can specify new virtual host hardware settings that apply for this Consolidation Study only, or you can make those
values the default settings by saving them to the Study Profile.
The fields at the top of the Consolidate to Virtual - Targets page provide basic identification information for the
Consolidation Study. The following table describes these fields.
Identification fields for the Consolidation Study
Field Description
Study
name
Enter a name of the Consolidation Study. It is not necessary to name the study until you are saving it.
8/21/2019 Using BMC Performance Perceiver-V5-20141128_0503
http://slidepdf.com/reader/full/using-bmc-performance-perceiver-v5-201411280503 36/245
Using BMC Performance Perceiver BMC Software Confidential
BMC Capacity Optimization 9.5 Page of36 245
Field Description
Study
Profile
The name of the Consolidation Study profile selected on the Consolidate to Virtual - Candidates page.
Description Optionally, enter a brief description of the Consolidation Study.
Time
Period
The date range specified for the study on the Begin Virtualization Study or Consolidate to Virtual - Candidates. You can change the time
period by clicking the Calendar icon. If the new time period is missing data for any of the candidates, those computers are removed from the
candidate list.
Continue with .Specifying affinity rules to use during the study (see page 36)
Specifying affinity rules to use during the study
Click to specify affinity relationships which indicate which computer candidates cannot reside on the sameSet Affinity
virtual host, and which computer candidates must reside on the same virtual host. See Setting an affinity relationship
.for computers (see page 57)
Setting affinity relationships provides additional information about the servers in the study that Virtualization Planning
cannot determine from the collected data, such as whether one server acts as a backup server for another. This
information provides guidance for the module when determining target host placement for the candidates.
Continue with .Identifying the target virtual hosts (see page 36)
Identifying the target virtual hosts
You can choose to create new virtual hosts for this study, select one or more existing virtual targets to include in the
study, or both. The virtual hosts are the servers onto which the candidate computers will be consolidated.
In the example shown in , we have selected the two existingConsolidate to Virtual - Targets page (see page )
clusters for the study because they have plenty of capacity to handle additional guests. We have also selected the
Create New Virtual Hosts option, in the event that all of the candidates in the study do not fit on the two existing virtual
hosts.
Use the check box to indicate whether the candidates should be placed togetherPlace all candidates on one target
on a single virtual target or spread among any of the selected targets. If the option is checked, the component will
attempt to place all the candidates on the target with the most capacity.
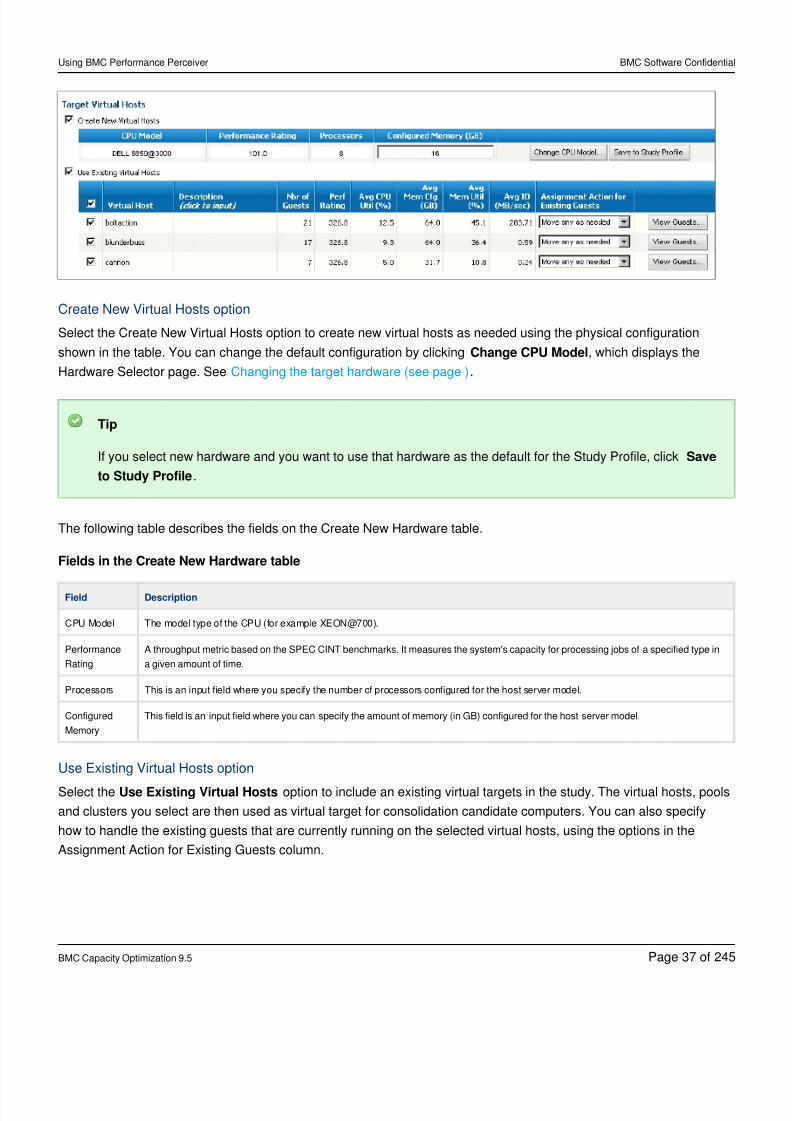
Target Virtual Hosts section
8/21/2019 Using BMC Performance Perceiver-V5-20141128_0503
http://slidepdf.com/reader/full/using-bmc-performance-perceiver-v5-201411280503 37/245
Using BMC Performance Perceiver BMC Software Confidential
BMC Capacity Optimization 9.5 Page of37 245
Create New Virtual Hosts option
Select the Create New Virtual Hosts option to create new virtual hosts as needed using the physical configuration
shown in the table. You can change the default configuration by clicking , which displays theChange CPU Model
Hardware Selector page. See .Changing the target hardware (see page )
Tip
If you select new hardware and you want to use that hardware as the default for the Study Profile, click Save
.to Study Profile
The following table describes the fields on the Create New Hardware table.
Fields in the Create New Hardware table
Field Description
CPU Model The model type of the CPU (for example XEON@700).
Performance
Rating
A throughput metric based on the SPEC CINT benchmarks. It measures the system's capacity for processing jobs of a specified type in
a given amount of time.
Processors This is an input field where you specify the number of processors configured for the host server model.
Configured
Memory
This field is an input field where you can specify the amount of memory (in GB) configured for the host server model.
Use Existing Virtual Hosts option
Select the option to include an existing virtual targets in the study. The virtual hosts, poolsUse Existing Virtual Hosts
and clusters you select are then used as virtual target for consolidation candidate computers. You can also specify
how to handle the existing guests that are currently running on the selected virtual hosts, using the options in the
Assignment Action for Existing Guests column.
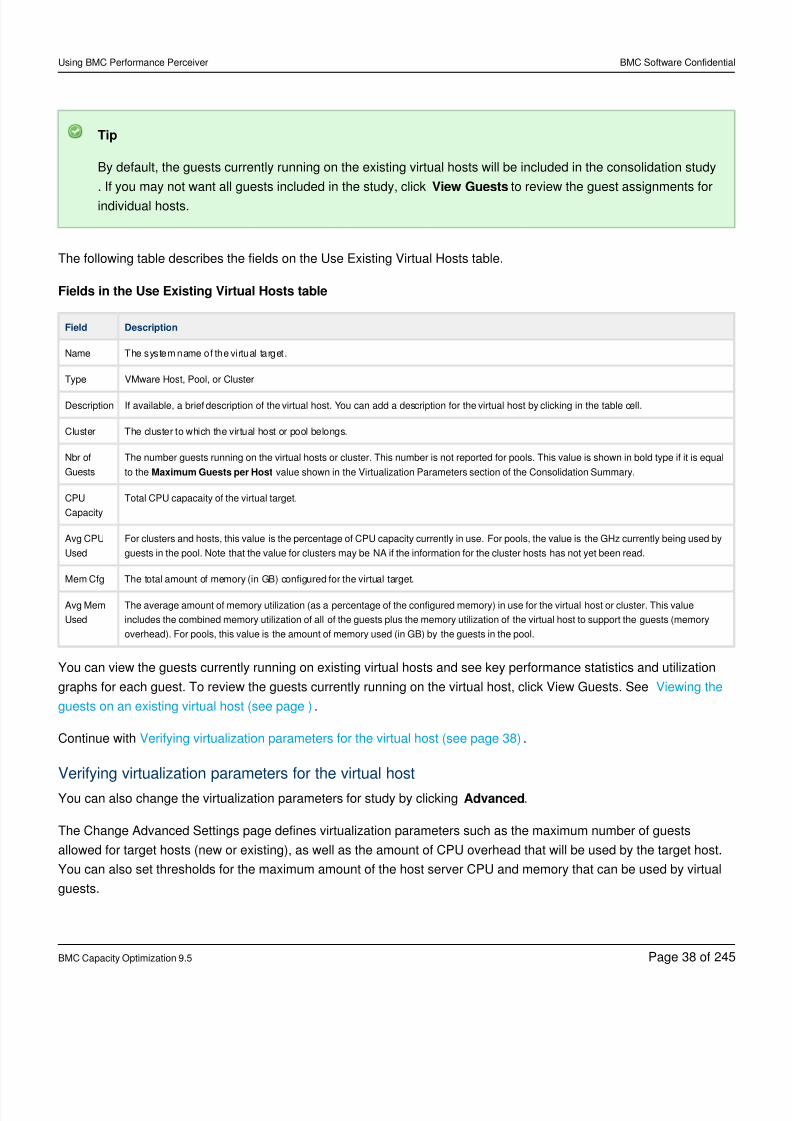
8/21/2019 Using BMC Performance Perceiver-V5-20141128_0503
http://slidepdf.com/reader/full/using-bmc-performance-perceiver-v5-201411280503 38/245
Using BMC Performance Perceiver BMC Software Confidential
BMC Capacity Optimization 9.5 Page of38 245
Tip
By default, the guests currently running on the existing virtual hosts will be included in the consolidation study
. If you may not want all guests included in the study, click to review the guest assignments forView Guests
individual hosts.
The following table describes the fields on the Use Existing Virtual Hosts table.
Fields in the Use Existing Virtual Hosts table
Field Description
Name The system name of the virtual target.
Type VMware Host, Pool, or Cluster
Description If available, a brief description of the virtual host. You can add a description for the virtual host by clicking in the table cell.
Cluster The cluster to which the virtual host or pool belongs.
Nbr of
Guests
The number guests running on the virtual hosts or cluster. This number is not reported for pools. This value is shown in bold type if it is equal
to the value shown in the Virtualization Parameters section of the Consolidation Summary.Maximum Guests per Host
CPU
Capacity
Total CPU capacaity of the virtual target.
Avg CPU
Used
For clusters and hosts, this value is the percentage of CPU capacity currently in use. For pools, the value is the GHz currently being used by
guests in the pool. Note that the value for clusters may be NA if the information for the cluster hosts has not yet been read.
Mem Cfg The total amount of memory (in GB) configured for the virtual target.
Avg Mem
Used
The average amount of memory utilization (as a percentage of the configured memory) in use for the virtual host or cluster. This value
includes the combined memory utilization of all of the guests plus the memory utilization of the virtual host to support the guests (memory
overhead). For pools, this value is the amount of memory used (in GB) by the guests in the pool.
You can view the guests currently running on existing virtual hosts and see key performance statistics and utilization
graphs for each guest. To review the guests currently running on the virtual host, click View Guests. See Viewing the
.guests on an existing virtual host (see page )
Continue with .Verifying virtualization parameters for the virtual host (see page 38)
Verifying virtualization parameters for the virtual host
You can also change the virtualization parameters for study by clicking .Advanced
The Change Advanced Settings page defines virtualization parameters such as the maximum number of guests
allowed for target hosts (new or existing), as well as the amount of CPU overhead that will be used by the target host.
You can also set thresholds for the maximum amount of the host server CPU and memory that can be used by virtual
guests.
8/21/2019 Using BMC Performance Perceiver-V5-20141128_0503
http://slidepdf.com/reader/full/using-bmc-performance-perceiver-v5-201411280503 39/245
Using BMC Performance Perceiver BMC Software Confidential
BMC Capacity Optimization 9.5 Page of39 245
Verify that the default settings from the Study Profile apply to your virtualization goals, or update the values. See
.Changing the virtualization parameters (see page 60)
Continue with .Creating the Consolidation Study (see page 39)
Creating the Consolidation StudyAfter you have entered all of the parameters on the Consolidate To Virtual - Targets page, click .Next
For information about reviewing the results of the consolidation study, see Reviewing the consolidation study results (
.see page )
Reviewing the Consolidation Study results
The results of the consolidation study are presented in the Consolidation Summary report. You can review the report to
see how many servers were recommended to host the consolidated work, and how the work from the consolidated
servers should be distributed to the host servers.
The report is divided into three main sections:
Summary (see )Reviewing the Consolidation Summary section (see page )
Candidate Assignments
Host, Pool and Cluster Results (see andReviewing the Virtual Host Summary table (see page ) Reviewing
)the Virtual Host Detail report (see page )
Reviewing the Consolidation Summary section
The Consolidation Summary section gives you a snapshot of the effectiveness of the consolidation. It has three basic
components:
Before and After consolidation comparison
Virtualization Parameters
New Virtual Server Configuration
Use the and columns to calculate the efficiency savings that could be achieved through the consolidationBefore After
. In the example shown in the following figure, we have consolidated a total of nine physical servers onto four virtual
hosts, one of which was already hosting eight guests.
Note
The value for the refers to the three existing virtual hosts that weBefore Average CPU Utilization of Hosts
included in the study. The average CPU utilization of the candidates is shown in parenthesis next to the
number of physical servers.
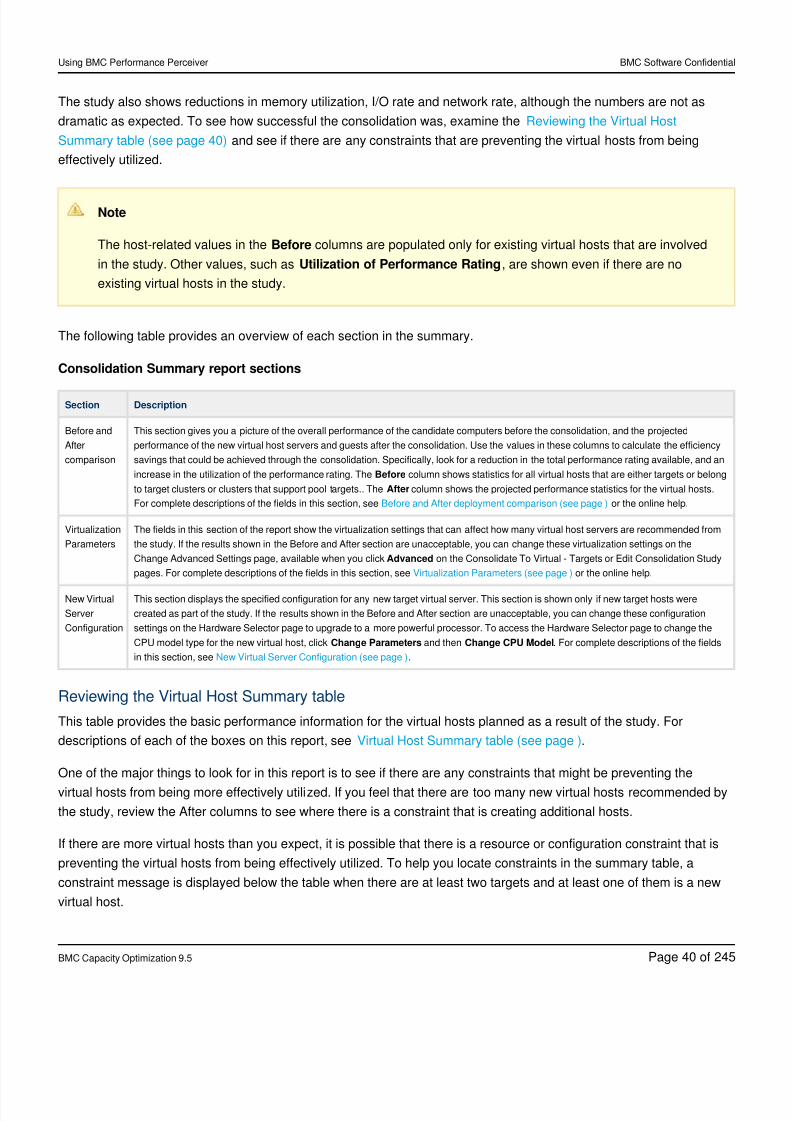
8/21/2019 Using BMC Performance Perceiver-V5-20141128_0503
http://slidepdf.com/reader/full/using-bmc-performance-perceiver-v5-201411280503 40/245
Using BMC Performance Perceiver BMC Software Confidential
BMC Capacity Optimization 9.5 Page of40 245
The study also shows reductions in memory utilization, I/O rate and network rate, although the numbers are not as
dramatic as expected. To see how successful the consolidation was, examine the Reviewing the Virtual Host
and see if there are any constraints that are preventing the virtual hosts from beingSummary table (see page 40)
effectively utilized.
Note
The host-related values in the columns are populated only for existing virtual hosts that are involvedBefore
in the study. Other values, such as , are shown even if there are noUtilization of Performance Rating
existing virtual hosts in the study.
The following table provides an overview of each section in the summary.
Consolidation Summary report sections
Section Description
Before and
After
comparison
This section gives you a picture of the overall performance of the candidate computers before the consolidation, and the projected
performance of the new virtual host servers and guests after the consolidation. Use the values in these columns to calculate the efficiency
savings that could be achieved through the consolidation. Specifically, look for a reduction in the total performance rating available, and an
increase in the utilization of the performance rating. The column shows statistics for all virtual hosts that are either targets or belongBefore
to target clusters or clusters that support pool targets.. The column shows the projected performance statistics for the virtual hosts.After
For complete descriptions of the fields in this section, see or the online help.Before and After deployment comparison (see page )
Virtualization
Parameters
The fields in this section of the report show the virtualization settings that can affect how many virtual host servers are recommended from
the study. If the results shown in the Before and After section are unacceptable, you can change these virtualization settings on the
Change Advanced Settings page, available when you click on the Consolidate To Virtual - Targets or Edit Consolidation StudyAdvanced
pages. For complete descriptions of the fields in this section, see or the online help.Virtualization Parameters (see page )
New Virtual
Server
Configuration
This section displays the specified configuration for any new target virtual server. This section is shown only if new target hosts were
created as part of the study. If the results shown in the Before and After section are unacceptable, you can change these configuration
settings on the Hardware Selector page to upgrade to a more powerful processor. To access the Hardware Selector page to change the
CPU model type for the new virtual host, click and then . For complete descriptions of the fieldsChange Parameters Change CPU Model
in this section, see .New Virtual Server Configuration (see page )
Reviewing the Virtual Host Summary table
This table provides the basic performance information for the virtual hosts planned as a result of the study. For
descriptions of each of the boxes on this report, see .Virtual Host Summary table (see page )
One of the major things to look for in this report is to see if there are any constraints that might be preventing the
virtual hosts from being more effectively utilized. If you feel that there are too many new virtual hosts recommended by
the study, review the After columns to see where there is a constraint that is creating additional hosts.
If there are more virtual hosts than you expect, it is possible that there is a resource or configuration constraint that is
preventing the virtual hosts from being effectively utilized. To help you locate constraints in the summary table, a
constraint message is displayed below the table when there are at least two targets and at least one of them is a new
virtual host.
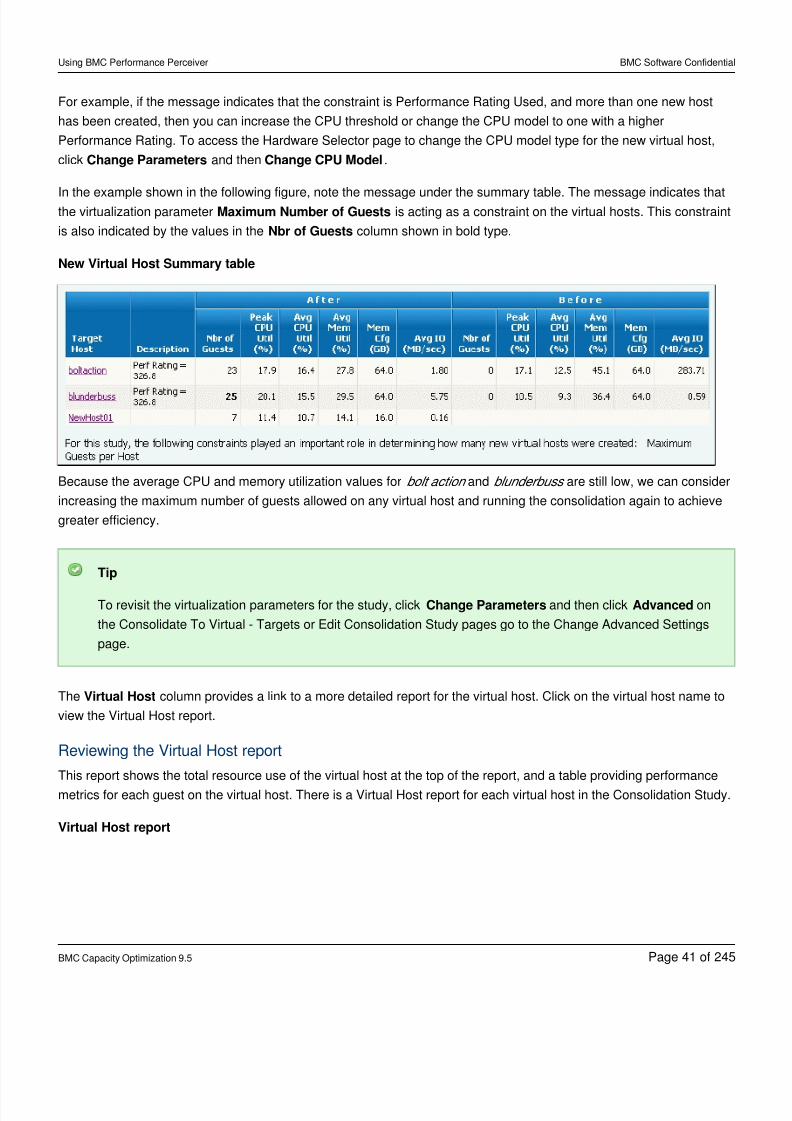
8/21/2019 Using BMC Performance Perceiver-V5-20141128_0503
http://slidepdf.com/reader/full/using-bmc-performance-perceiver-v5-201411280503 41/245
Using BMC Performance Perceiver BMC Software Confidential
BMC Capacity Optimization 9.5 Page of41 245
For example, if the message indicates that the constraint is Performance Rating Used, and more than one new host
has been created, then you can increase the CPU threshold or change the CPU model to one with a higher
Performance Rating. To access the Hardware Selector page to change the CPU model type for the new virtual host,
click and then .Change Parameters Change CPU Model
In the example shown in the following figure, note the message under the summary table. The message indicates thatthe virtualization parameter is acting as a constraint on the virtual hosts. This constraintMaximum Number of Guests
is also indicated by the values in the column shown in bold type.Nbr of Guests
New Virtual Host Summary table
Because the average CPU and memory utilization values for and are still low, we can considerbolt action blunderbuss
increasing the maximum number of guests allowed on any virtual host and running the consolidation again to achieve
greater efficiency.
Tip
To revisit the virtualization parameters for the study, click and then click onChange Parameters Advanced
the Consolidate To Virtual - Targets or Edit Consolidation Study pages go to the Change Advanced Settings
page.
The column provides a link to a more detailed report for the virtual host. Click on the virtual host name toVirtual Host
view the Virtual Host report.
Reviewing the Virtual Host report
This report shows the total resource use of the virtual host at the top of the report, and a table providing performance
metrics for each guest on the virtual host. There is a Virtual Host report for each virtual host in the Consolidation Study.
Virtual Host report
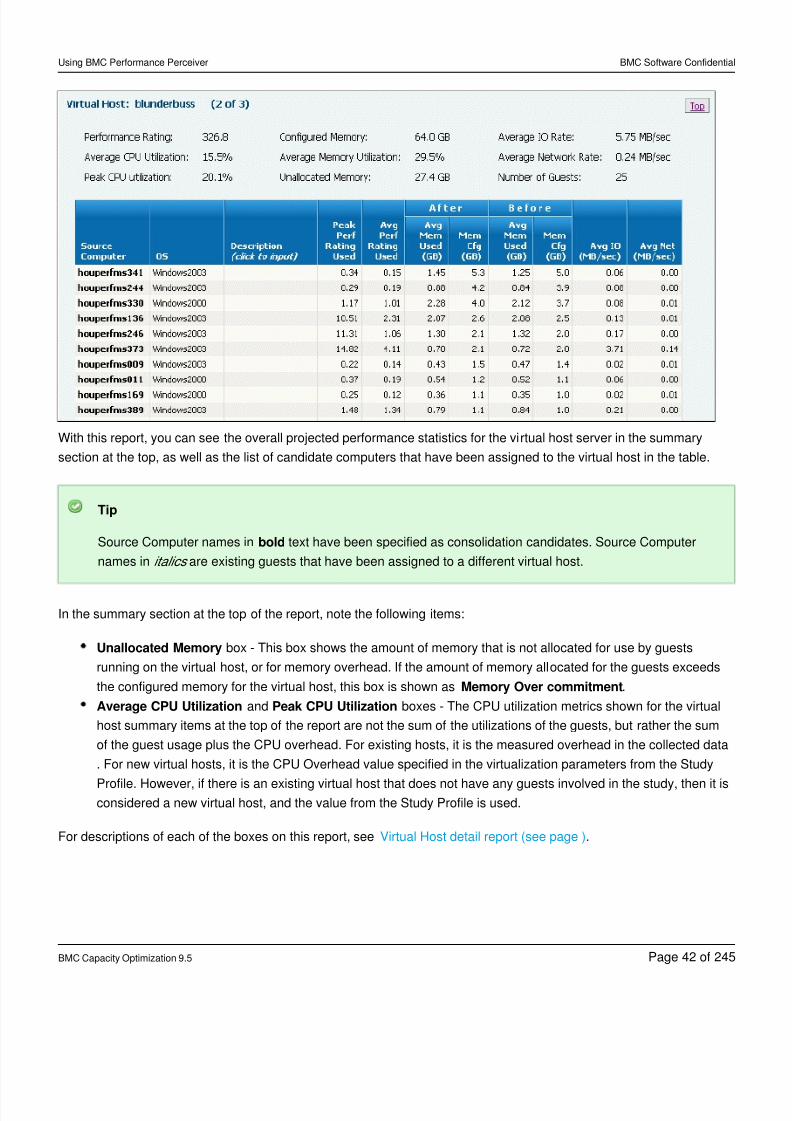
8/21/2019 Using BMC Performance Perceiver-V5-20141128_0503
http://slidepdf.com/reader/full/using-bmc-performance-perceiver-v5-201411280503 42/245
Using BMC Performance Perceiver BMC Software Confidential
BMC Capacity Optimization 9.5 Page of42 245
With this report, you can see the overall projected performance statistics for the virtual host server in the summary
section at the top, as well as the list of candidate computers that have been assigned to the virtual host in the table.
Tip
Source Computer names in text have been specified as consolidation candidates. Source Computerbold
names in are existing guests that have been assigned to a different virtual host.italics
In the summary section at the top of the report, note the following items:
Unallocated Memory box - This box shows the amount of memory that is not allocated for use by guests
running on the virtual host, or for memory overhead. If the amount of memory allocated for the guests exceeds
the configured memory for the virtual host, this box is shown as .Memory Over commitment
Average CPU Utilization and boxes - The CPU utilization metrics shown for the virtualPeak CPU Utilization
host summary items at the top of the report are not the sum of the utilizations of the guests, but rather the sum
of the guest usage plus the CPU overhead. For existing hosts, it is the measured overhead in the collected data
. For new virtual hosts, it is the CPU Overhead value specified in the virtualization parameters from the Study
Profile. However, if there is an existing virtual host that does not have any guests involved in the study, then it isconsidered a new virtual host, and the value from the Study Profile is used.
For descriptions of each of the boxes on this report, see .Virtual Host detail report (see page )
8/21/2019 Using BMC Performance Perceiver-V5-20141128_0503
http://slidepdf.com/reader/full/using-bmc-performance-perceiver-v5-201411280503 43/245
Using BMC Performance Perceiver BMC Software Confidential
BMC Capacity Optimization 9.5 Page of43 245
1.
2.
3.
1.
a.
b.
c.
2.
1.
2.
It may take several iterations of this process before you are satisfied with the consolidation results. For example, after
reviewing this report, you may decide that there are source computers assigned to this virtual host which you want to
move to a different host. In this case, click to display the Change Source-to-TargetChange Assignments
Assignments page. On this page you can move source computers from one virtual host to another. See Changing
.computer assignments (see page )
Once you are satisfied, you can save the study for future reference and print a copy in PDF format or Rich Text Format
(RTF).
Saving and Exporting the results into a report
You can export the results and recommendations from the study into different formats, to create a formal server
consolidation report that can be shared with other individuals across the organization.
To save a study result
Follow the steps given below to save the study and its results for viewing and modification at a later time:
Enter values for and, optionally, at the top of the page.Study Name Description
Click at the bottom of the page.Save
If a study with the specified name already exists, confirm if it should be overwritten.
After a study result is saved, the study may be viewed and edited at a later time from the Saved Studies page.
For more information, see .Working with Saved Studies (see page 50)
To export the results
Follow the steps given below to export the study results to a report:
On the Consolidation Results page, click:
View Results as PDF, or
View Results as RTF, or
View Results as XLS
From the File Download dialog, click to view the report.Open
4.5.2 Deploying new guests
Selecting the option on the New Study page displays the Deploy New Guests page.Deploy New Guests
The following sections describe how to conduct a virtualization study that deploys new guests to new or existing virtual
hosts:
Creating the Deployment Study (see page 44)
Reviewing the Deploy Guests report (see page 47)
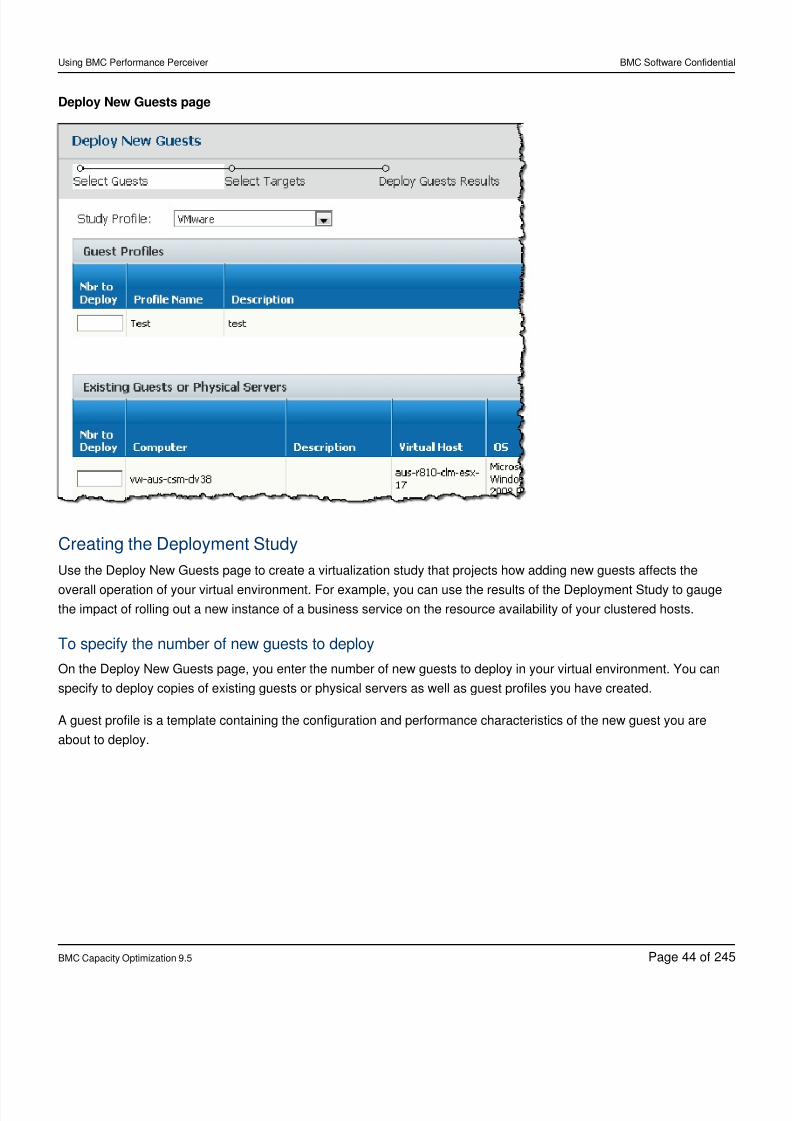
8/21/2019 Using BMC Performance Perceiver-V5-20141128_0503
http://slidepdf.com/reader/full/using-bmc-performance-perceiver-v5-201411280503 44/245
Using BMC Performance Perceiver BMC Software Confidential
BMC Capacity Optimization 9.5 Page of44 245
Deploy New Guests page
Creating the Deployment Study
Use the Deploy New Guests page to create a virtualization study that projects how adding new guests affects the
overall operation of your virtual environment. For example, you can use the results of the Deployment Study to gaugethe impact of rolling out a new instance of a business service on the resource availability of your clustered hosts.
To specify the number of new guests to deploy
On the Deploy New Guests page, you enter the number of new guests to deploy in your virtual environment. You can
specify to deploy copies of existing guests or physical servers as well as guest profiles you have created.
A guest profile is a template containing the configuration and performance characteristics of the new guest you are
about to deploy.
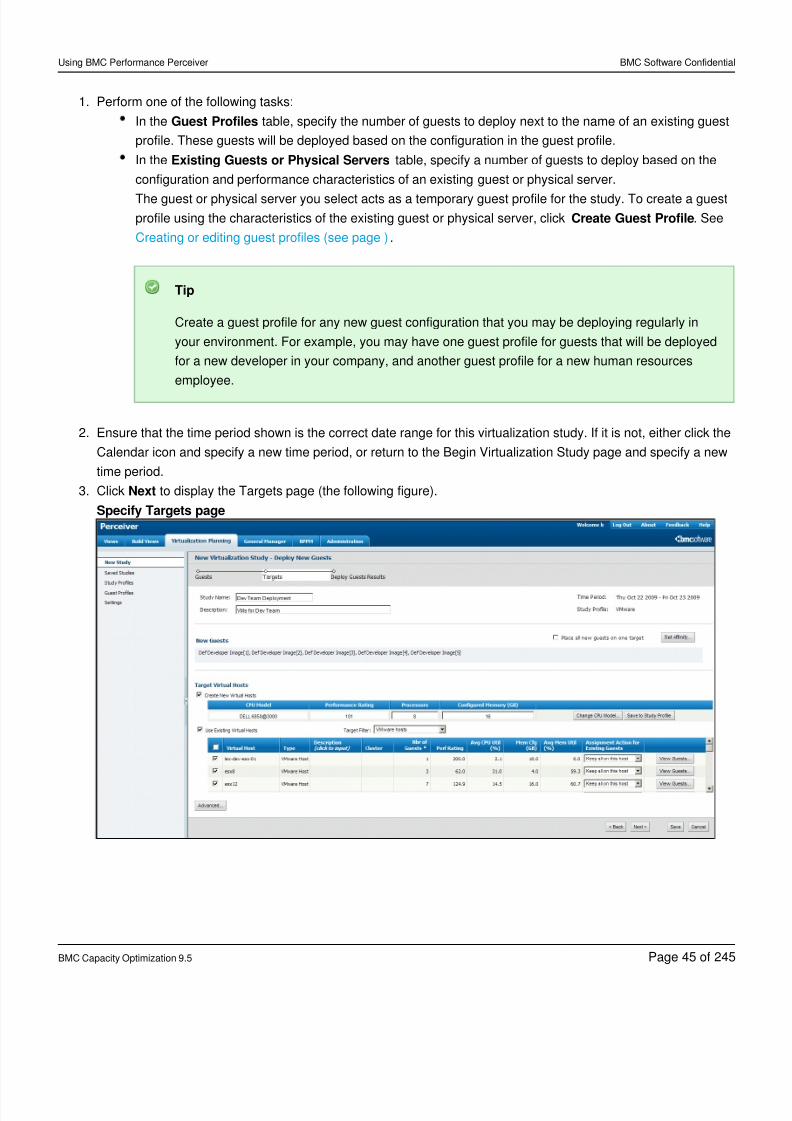
8/21/2019 Using BMC Performance Perceiver-V5-20141128_0503
http://slidepdf.com/reader/full/using-bmc-performance-perceiver-v5-201411280503 45/245
Using BMC Performance Perceiver BMC Software Confidential
BMC Capacity Optimization 9.5 Page of45 245
1.
2.
3.
Perform one of the following tasks:
In the table, specify the number of guests to deploy next to the name of an existing guestGuest Profiles
profile. These guests will be deployed based on the configuration in the guest profile.
In the table, specify a number of guests to deploy based on theExisting Guests or Physical Servers
configuration and performance characteristics of an existing guest or physical server.
The guest or physical server you select acts as a temporary guest profile for the study. To create a guest
profile using the characteristics of the existing guest or physical server, click . SeeCreate Guest Profile
.Creating or editing guest profiles (see page )
Tip
Create a guest profile for any new guest configuration that you may be deploying regularly in
your environment. For example, you may have one guest profile for guests that will be deployed
for a new developer in your company, and another guest profile for a new human resources
employee.
Ensure that the time period shown is the correct date range for this virtualization study. If it is not, either click the
Calendar icon and specify a new time period, or return to the Begin Virtualization Study page and specify a new
time period.
Click to display the Targets page (the following figure).Next
Specify Targets page
8/21/2019 Using BMC Performance Perceiver-V5-20141128_0503
http://slidepdf.com/reader/full/using-bmc-performance-perceiver-v5-201411280503 46/245
Using BMC Performance Perceiver BMC Software Confidential
BMC Capacity Optimization 9.5 Page of46 245
1.
2.
3.
4.
To select the virtual hosts on which to deploy the new guests
On the Specify Target Hosts page, complete the descriptive information for the study by entering a study name
and description.
Note
The Specify Target Hosts page is similar in appearance and function to the Consolidate To Virtual -
Targets page ( ).Consolidate to Virtual - Targets page (see page )
Review the new guests being deployed in the list.New Guests
Click to specify any affinity relationships for the new guests. For example, if one of the newSet Affinity
guests is planned as a backup system for another guest, you would not want both of those guests to
reside on the same virtual host. See .Setting an affinity relationship for computers (see page )
Tip
Setting affinity relationships provides additional information about the servers in the study that
Server Sizer cannot determine from the collected data, such as whether one server acts as a
backup server for another.
Select the target hosts for the study. You can create a new virtual host for the study if you are planning to
upgrade or buy new hardware, use existing virtual hosts, or both. The virtual hosts are the servers onto whichthe new guests will be deployed.
Select the option to specify the existing virtual hosts onto which the newUse Existing Virtual Hosts
guests will be deployed.
By default, the guests running on these hosts are also included in the study. You can also specify how to
handle the existing guests that are currently running on the virtual host, using the options in the
column. To review the existing guests currently running on theAssignment Action for Existing Guests
virtual host, click . See .View Guests Viewing the guests on an existing virtual host (see page )
Select the option if you want the study to create one or more new virtual hostsCreate New Virtual Host
(using the physical configuration shown in the table) if additional hosts are required to effectively handle
the deployment.
You can change the default configuration by clicking , which displays the HardwareChange CPU Model
Selector page. See .Changing the target hardware (see page )
Click to display the deployment results.Deploy
Continue with .Reviewing the Deploy Guests report (see page 47)
8/21/2019 Using BMC Performance Perceiver-V5-20141128_0503
http://slidepdf.com/reader/full/using-bmc-performance-perceiver-v5-201411280503 47/245
Using BMC Performance Perceiver BMC Software Confidential
BMC Capacity Optimization 9.5 Page of47 245
Reviewing the Deploy Guests report
The results of the Deployment Study are presented in the Deployment Summary report (the following figure). You can
review the report to see how guests should be distributed to the host servers.
The Deploy Guests Summary tab is divided into three areas:
Before and After comparison
Virtualization Parameters
New Virtual Server Configuration
Note
If a new virtual server was not required, that area is not in the summary and the summary tab will have two
areas instead of three.
The following table provides an overview of each area in the summary. For detailed descriptions, see Understanding a
.Server Sizing report (see page )
Areas in Deploy Guests Summary tab
Area Description
Before and
After
comparison
This area gives you a picture of the overall performance of the selected virtual hosts before and after deployment or rebalancing. Use the
values in these columns to see the benefits that could be achieved through the rebalancing effort. The column shows statistics forBefore
the virtual hosts you have selected for the study. The column shows the projected performance statistics for the virtual hosts. ForAfter
complete descriptions of the boxes in this area, see .Before and After deployment comparison (see page )
Virtualization
Parameters
The boxes in this area show the virtualization settings that can affect how many virtual host servers are recommended from the study. If the
results shown in the Before and After area are unacceptable, you can change these virtualization settings on the Change Advanced
Settings page, available when you click on the New Virtualization Study - Rebalance Targets or Edit Rebalance pages. ForAdvanced
complete descriptions of the boxes in this area, see .Virtualization Parameters (see page )
New Virtual
Server
Configuration
This area displays the specified configuration for any new target virtual server, and is shown only if you selected Create New Virtual Hosts
on the New Virtualization Study - Rebalance Targets, Edit Rebalance Study, Create Deployment Study, or Edit Deployment Study pages,
and the results of the study required the creation of additional hardware. If the results shown in the Before and After area are unacceptable,
you can change these configuration settings on the Hardware Selector page to upgrade to a more powerful processor. To access the
Hardware Selector page to change the CPU model type for the new virtual host, click and then .Change Parameters Change CPU Model
For complete descriptions of the boxes in this area, see .New Virtual Server Configuration (see page )
Where to go from here
If you are satisfied with the results, you can click to keep the results of the Rebalancing Study or clickSave Study
to print the study.Print
If you want to make changes to the study:
8/21/2019 Using BMC Performance Perceiver-V5-20141128_0503
http://slidepdf.com/reader/full/using-bmc-performance-perceiver-v5-201411280503 48/245
Using BMC Performance Perceiver BMC Software Confidential
BMC Capacity Optimization 9.5 Page of48 245
1.
2.
1.
2.3.
4.
1.
Click to move guests from one virtual host to another. SeeChange Assignments Changing computer
.assignments (see page )
Click to edit the target virtual hosts for the study. The boxes on this page are the same as those describedBack
in .To select the virtual hosts on which to deploy the new guests (see page )
4.5.3 Rebalancing existing virtual hosts
Use the New Virtualization Study - Rebalance Targets page to rebalance the guests running on virtual hosts in your
environment for optimal performance.
The following sections describe how to rebalance the guests running on virtual hosts in your environment:
Creating the Rebalancing Study (see page )
Reviewing the results of the Rebalancing Study (see page )
Creating the Rebalancing Study
The procedures on this page describe how to do the following:
Enter Rebalance Study identification information
Target Virtual Hosts
To enter the Rebalance Study identification information
The fields at the top of the page provide basic identification information for the Rebalance Study.
Enter a name of the Rebalance Study in the box. It is not necessary to name the study until youStudy Name
are saving it.
Enter a brief description of the Rebalance Study in the box.DescriptionReview the date range specified for the study on the Begin Virtualization Study page. You can change the time
period by clicking the calendar icon.
Optionally, click to see if the new time period is missing data for any of the rebalancingView Exceptions
candidates. Those computers are shown on the View Exceptions list.
To select the target virtual host hardware
You can choose to create new virtual hosts for this study, select one or more existing virtual hosts to rebalance, or
both. The virtual hosts are the host servers onto which the guests are placed.
Select the existing virtual hosts you want to rebalance from the Target Virtual hosts table.You can also specify how to handle the existing guests that are currently running on the virtual host, using the
options in the column. To review the guests currently running on theAssignment Action for Existing Guests
virtual host, click .View Guests
This option displays the same table used in the Deploy New Guests virtualization study. For descriptions of the
columns on this table, see .To select the virtual hosts on which to deploy the new guests (see page )
8/21/2019 Using BMC Performance Perceiver-V5-20141128_0503
http://slidepdf.com/reader/full/using-bmc-performance-perceiver-v5-201411280503 49/245
Using BMC Performance Perceiver BMC Software Confidential
BMC Capacity Optimization 9.5 Page of49 245
2.
3.
4.
1.
Select the option to create a new virtual hosts (if necessary) using the physicalCreate New Virtual Host
configuration shown in the table.
If some existing hosts are over-utilized, the Rebalancing Study may suggest the addition of new virtual hosts,
using the CPU model and configuration specified in this section. You can change the default configuration by
clicking , which displays the Hardware Selector page. SeeChange CPU Model Changing the target hardware (
.see page )
Tip
If you do select new hardware for this study and want to use that hardware as the default for future
rebalancing efforts, click .Save to Study Profile
For descriptions of the columns on this table, see To select the virtual hosts on which to deploy the new guests (
.see page )
Optionally, click to display the Change Advanced Settings page.AdvancedThis page shows the virtualization parameters for the target virtual hosts. For more information, see Changing
.the virtualization parameters (see page )
Click to display the rebalancing results.Next
On the Rebalancing Results page, review the Rebalancing Summary report and the Virtual Host table to see the
projected results of the study.
Continue with .Reviewing the results of the Rebalancing Study (see page 49)
Reviewing the results of the Rebalancing Study
The Rebalancing Study and Deployment Study produce recommendations shown on a Results page, similar to the
one produced by the Consolidation Summary, which is discussed in Reviewing the consolidation study results (see
.page 39)
Specifically, look for the Highest Host Peak CPU Utilization value to decrease, indicating a greater consistency of CPU
utilization across all the virtual hosts. Also, you may find that the performance of some virtual hosts that were
over-utilized has improved, due to guests moving to other, less-utilized virtual hosts.
For an overview of the Summary report, see .Sections in Deploy Guests Summary tab (see page 47)
Where to go from hereIf you are satisfied with the results of the Rebalancing Study, you can click to keep the results of theSave Study
deployment study or click to print the study.Print
If you want to make changes to the study:
Click Change Assignments to move guests from one virtual host to another. See Changing computer
.assignments (see page 57)
8/21/2019 Using BMC Performance Perceiver-V5-20141128_0503
http://slidepdf.com/reader/full/using-bmc-performance-perceiver-v5-201411280503 50/245
Using BMC Performance Perceiver BMC Software Confidential
BMC Capacity Optimization 9.5 Page of50 245
2.
1.
2.
3.
4.
1.
2.
Click Back to edit the target virtual hosts for the study. The boxes on this page are the same as those described
in .To select the virtual hosts on which to deploy the new guests (see page 44)
4.6 Working with saved studiesTo view, edit, or delete a saved study, click in the task pane. The Saved Studies page lists all of theSaved Studies
studies that have been saved.
After reviewing a saved study, you can edit the basic parameters for the study, and run the study again.
4.6.1 To view or edit saved studies
Follow the steps given below to view saved studies that were previously created:
Click in the navigation pane.Saved Studies
Click the button next to the study of interestView/Edit
If the the domain, entity filter and time range used when creating the study are different than what is
currently active, you will be prompted with the following "Attempt to load data used when study was
created?"
If you wish to only change parameters values like threshold, new hardware configurations, affinity
and assignments, click Cancel to work with the data of the saved study without reloading (this is
the faster option)
If you wish to add more candidates and targets to the study, click OK to attempt to reload the data
used when the study was created
Note that reloading the data may take a long time
If the data used to originally create the study is not available, an error message may be
displayed and you should follow steps 1 and 2 again, but click Cancel at the prompt
Note: if the data used to originally create the study is active, you can change more options of the
study (like adding candidates and other targets) when editing
After clicking View/Edit
the Targets page will be displayed for studies that have been saved but not consolidated
the Consolidation Results page will be displayed for completed studies saved on the Results page
After modifying or viewing the saved study, you may again Click to save changes you have made,Save Study
either to the same or different name
You can also export the study to a different format by clicking , , orView Results as PDF View Results as RTF
.View Results as XLS
4.6.2 To delete saved studies
Follow the steps given below to delete one or more studies:
Select the check box corresponding to one or more studies.
Click to delete the saved studies.Delete Selected
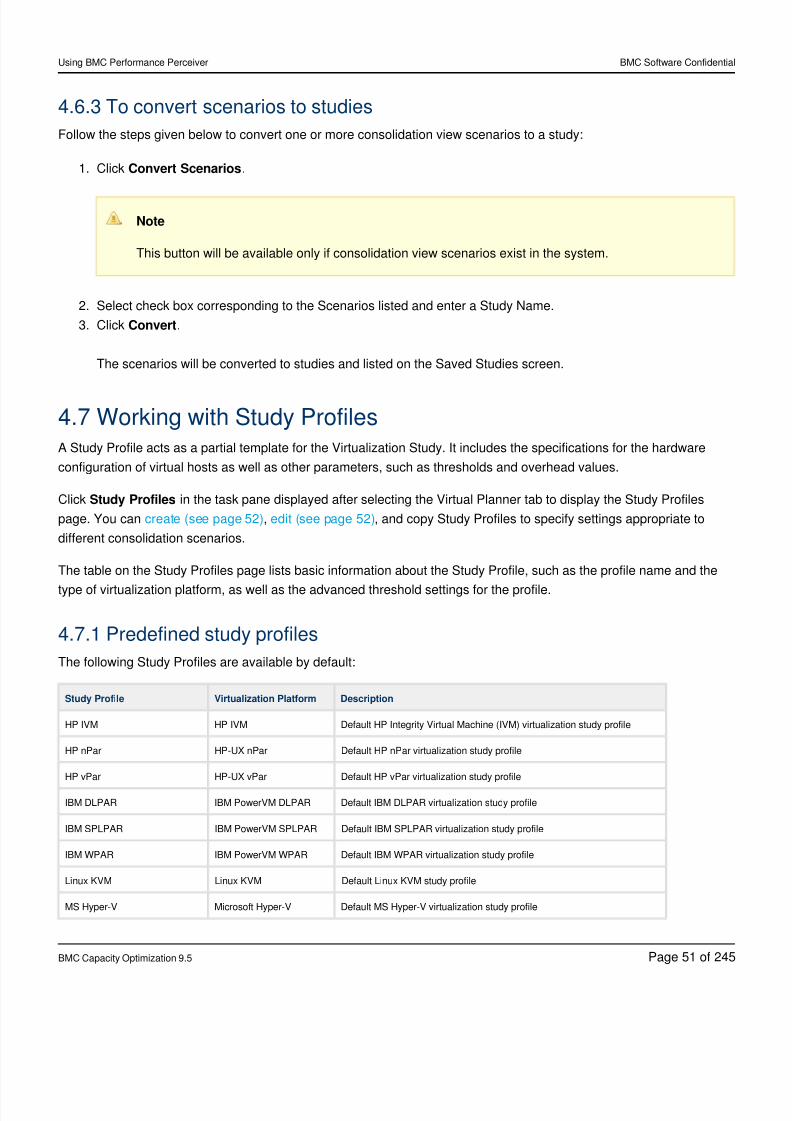
8/21/2019 Using BMC Performance Perceiver-V5-20141128_0503
http://slidepdf.com/reader/full/using-bmc-performance-perceiver-v5-201411280503 51/245
Using BMC Performance Perceiver BMC Software Confidential
BMC Capacity Optimization 9.5 Page of51 245
1.
2.
3.
4.6.3 To convert scenarios to studies
Follow the steps given below to convert one or more consolidation view scenarios to a study:
Click .Convert Scenarios
Note
This button will be available only if consolidation view scenarios exist in the system.
Select check box corresponding to the Scenarios listed and enter a Study Name.
Click .Convert
The scenarios will be converted to studies and listed on the Saved Studies screen.
4.7 Working with Study ProfilesA Study Profile acts as a partial template for the Virtualization Study. It includes the specifications for the hardware
configuration of virtual hosts as well as other parameters, such as thresholds and overhead values.
Click in the task pane displayed after selecting the Virtual Planner tab to display the Study ProfilesStudy Profiles
page. You can , , and copy Study Profiles to specify settings appropriate tocreate (see page 52) edit (see page 52)
different consolidation scenarios.
The table on the Study Profiles page lists basic information about the Study Profile, such as the profile name and the
type of virtualization platform, as well as the advanced threshold settings for the profile.
4.7.1 Predefined study profiles
The following Study Profiles are available by default:
Study Profile Virtualization Platform Description
HP IVM HP IVM Default HP Integrity Virtual Machine (IVM) virtualization study profile
HP nPar HP-UX nPar Default HP nPar virtualization study profile
HP vPar HP-UX vPar Default HP vPar virtualization study profile
IBM DLPAR IBM PowerVM DLPAR Default IBM DLPAR virtualization study profile
IBM SPLPAR IBM PowerVM SPLPAR Default IBM SPLPAR virtualization study profile
IBM WPAR IBM PowerVM WPAR Default IBM WPAR virtualization study profile
Linux KVM Linux KVM Default Linux KVM study profile
MS Hyper-V Microsoft Hyper-V Default MS Hyper-V virtualization study profile
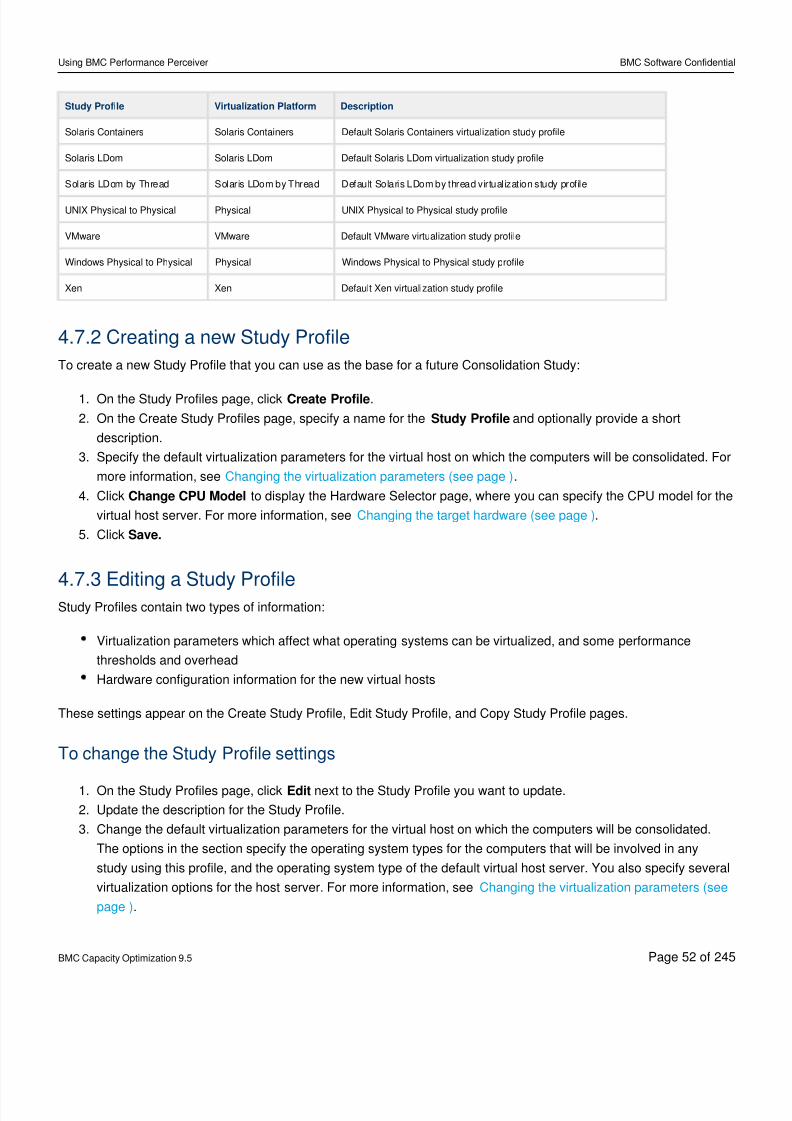
8/21/2019 Using BMC Performance Perceiver-V5-20141128_0503
http://slidepdf.com/reader/full/using-bmc-performance-perceiver-v5-201411280503 52/245
Using BMC Performance Perceiver BMC Software Confidential
BMC Capacity Optimization 9.5 Page of52 245
1.
2.
3.
4.
5.
1.
2.
3.
Study Profile Virtualization Platform Description
Solaris Containers Solaris Containers Default Solaris Containers virtualization study profile
Solaris LDom Solaris LDom Default Solaris LDom virtualization study profile
Solaris LDom by Thread Solaris LDom by Thread Default Solaris LDom by thread virtualization study profile
UNIX Physical to Physical Physical UNIX Physical to Physical study profile
VMware VMware Default VMware virtualization study profile
Windows Physical to Physical Physical Windows Physical to Physical study profile
Xen Xen Default Xen virtualization study profile
4.7.2 Creating a new Study Profile
To create a new Study Profile that you can use as the base for a future Consolidation Study:
On the Study Profiles page, click .Create Profile
On the Create Study Profiles page, specify a name for the and optionally provide a shortStudy Profile
description.
Specify the default virtualization parameters for the virtual host on which the computers will be consolidated. For
more information, see .Changing the virtualization parameters (see page )
Click to display the Hardware Selector page, where you can specify the CPU model for theChange CPU Model
virtual host server. For more information, see .Changing the target hardware (see page )
Click Save.
4.7.3 Editing a Study ProfileStudy Profiles contain two types of information:
Virtualization parameters which affect what operating systems can be virtualized, and some performance
thresholds and overhead
Hardware configuration information for the new virtual hosts
These settings appear on the Create Study Profile, Edit Study Profile, and Copy Study Profile pages.
To change the Study Profile settings
On the Study Profiles page, click next to the Study Profile you want to update.Edit
Update the description for the Study Profile.
Change the default virtualization parameters for the virtual host on which the computers will be consolidated.
The options in the section specify the operating system types for the computers that will be involved in any
study using this profile, and the operating system type of the default virtual host server. You also specify several
virtualization options for the host server. For more information, see Changing the virtualization parameters (see
.page )
8/21/2019 Using BMC Performance Perceiver-V5-20141128_0503
http://slidepdf.com/reader/full/using-bmc-performance-perceiver-v5-201411280503 53/245
Using BMC Performance Perceiver BMC Software Confidential
BMC Capacity Optimization 9.5 Page of53 245
4.
5.
1.
2.
Click to display the Hardware Selector page, where you can change the CPU model for theSelect Hardware
virtual host server.
The fields in this section display characteristics of the CPU hardware configuration for any new virtual host. The
fields are populated from the hardware CPU model you chose on the Hardware Selector page. To choose a
CPU model to be used by studies with this Study Profile, click . For more information, seeChange CPU Model
.Changing the target hardware (see page )
Click .Save
4.8 Working with guest profilesClick in the task pane displayed after selecting the Virtualization Planning tab to display the GuestGuest Profiles
Profiles page.
Follow the steps given below to create a guest profile based on the characteristics of an existing guest or create a new
one:
Click .Create Profile
Note
The fields on the Create Guest Profile and Edit Guest Profile pages are identical. The field canName
not be edited from the Edit Guest Profile page.
Specify a , and optionally a .Profile Name Description
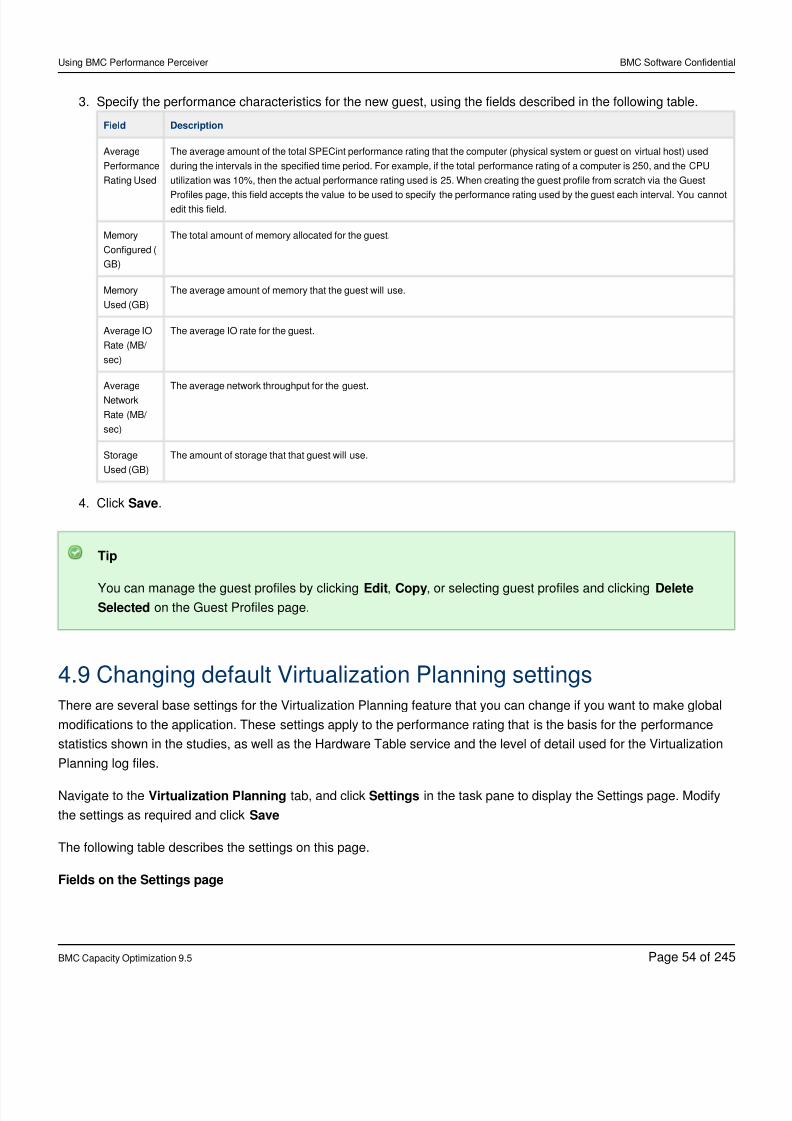
8/21/2019 Using BMC Performance Perceiver-V5-20141128_0503
http://slidepdf.com/reader/full/using-bmc-performance-perceiver-v5-201411280503 54/245
Using BMC Performance Perceiver BMC Software Confidential
BMC Capacity Optimization 9.5 Page of54 245
3.
4.
Specify the performance characteristics for the new guest, using the fields described in the following table.
Field Description
Average
Performance
Rating Used
The average amount of the total SPECint performance rating that the computer (physical system or guest on virtual host) used
during the intervals in the specified time period. For example, if the total performance rating of a computer is 250, and the CPU
utilization was 10%, then the actual performance rating used is 25. When creating the guest profile from scratch via the Guest
Profiles page, this field accepts the value to be used to specify the performance rating used by the guest each interval. You cannotedit this field.
Memory
Configured (
GB)
The total amount of memory allocated for the guest.
Memory
Used (GB)
The average amount of memory that the guest will use.
Average IO
Rate (MB/
sec)
The average IO rate for the guest.
Average
Network
Rate (MB/
sec)
The average network throughput for the guest.
Storage
Used (GB)
The amount of storage that that guest will use.
Click .Save
Tip
You can manage the guest profiles by clicking , , or selecting guest profiles and clickingEdit Copy Deleteon the Guest Profiles page.Selected
4.9 Changing default Virtualization Planning settingsThere are several base settings for the Virtualization Planning feature that you can change if you want to make global
modifications to the application. These settings apply to the performance rating that is the basis for the performance
statistics shown in the studies, as well as the Hardware Table service and the level of detail used for the Virtualization
Planning log files.
Navigate to the tab, and click in the task pane to display the Settings page. ModifyVirtualization Planning Settings
the settings as required and click Save
The following table describes the settings on this page.
Fields on the Settings page
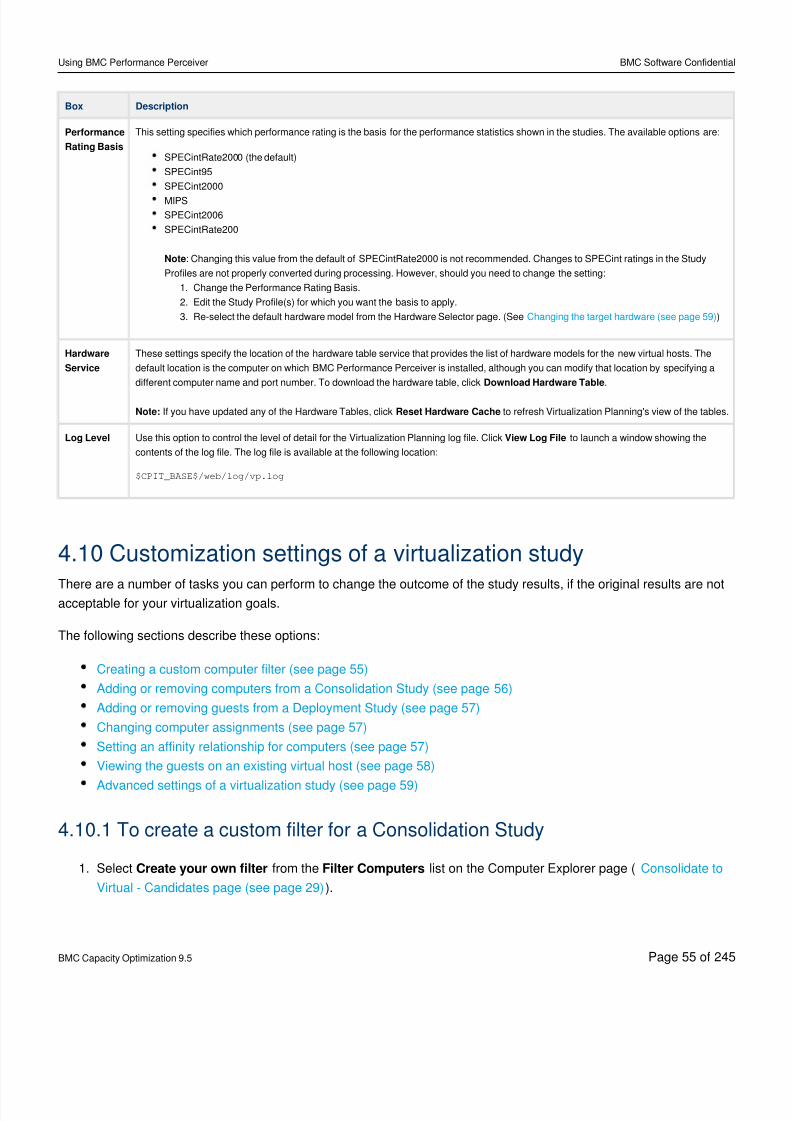
8/21/2019 Using BMC Performance Perceiver-V5-20141128_0503
http://slidepdf.com/reader/full/using-bmc-performance-perceiver-v5-201411280503 55/245
Using BMC Performance Perceiver BMC Software Confidential
BMC Capacity Optimization 9.5 Page of55 245
1.
2.
3.
1.
Box Description
Performance
Rating Basis
This setting specifies which performance rating is the basis for the performance statistics shown in the studies. The available options are:
SPECintRate2000 (the default)
SPECint95
SPECint2000
MIPS
SPECint2006
SPECintRate200
: Changing this value from the default of SPECintRate2000 is not recommended. Changes to SPECint ratings in the StudyNote
Profiles are not properly converted during processing. However, should you need to change the setting:
Change the Performance Rating Basis.
Edit the Study Profile(s) for which you want the basis to apply.
Re-select the default hardware model from the Hardware Selector page. (See )Changing the target hardware (see page 59)
Hardware
Service
These settings specify the location of the hardware table service that provides the list of hardware models for the new virtual hosts. The
default location is the computer on which BMC Performance Perceiver is installed, although you can modify that location by specifying a
different computer name and port number. To download the hardware table, click .Download Hardware Table
If you have updated any of the Hardware Tables, click to refresh Virtualization Planning's view of the tables.Note: Reset Hardware Cache
Log Level Use this option to control the level of detail for the Virtualization Planning log file. Click to launch a window showing theView Log File
contents of the log file. The log file is available at the following location:
$CPIT_BASE$/web/log/vp.log
4.10 Customization settings of a virtualization study
There are a number of tasks you can perform to change the outcome of the study results, if the original results are notacceptable for your virtualization goals.
The following sections describe these options:
Creating a custom computer filter (see page 55)
Adding or removing computers from a Consolidation Study (see page 56)
Adding or removing guests from a Deployment Study (see page 57)
Changing computer assignments (see page 57)
Setting an affinity relationship for computers (see page 57)
Viewing the guests on an existing virtual host (see page 58)
Advanced settings of a virtualization study (see page 59)
4.10.1 To create a custom filter for a Consolidation Study
Select from the list on the Computer Explorer page (Create your own filter Filter Computers Consolidate to
).Virtual - Candidates page (see page 29)
8/21/2019 Using BMC Performance Perceiver-V5-20141128_0503
http://slidepdf.com/reader/full/using-bmc-performance-perceiver-v5-201411280503 56/245
Using BMC Performance Perceiver BMC Software Confidential
BMC Capacity Optimization 9.5 Page of56 245
2.
3.
4.
5.
a.
b.
6.
1.
2.
3.
4.
5.
Specify the basic computer identification boxes you are interested in for the filter at the left of the Filter
Computers page by selecting the box, if it is listed, and then typing a value in the boxes (using full object name
for an exact match or by using any wildcard pattern), or by making a selection from the list.
You can filter by any of the identification fields shown, such as by operating system or by group name (if you
have created one or more computer groups in BMC Performance Perceiver), or by any combination of fields. If
business attribute information for the systems through an active CMDB datasource, those attributes can be
used for filtering by selecting them from the identification box selector lists.
You can also add other filter conditions by entering thresholds for any of the metrics listed in the middle of the
page. The thresholds are evaluated using a Less Than comparison.
Click to create the filter and add it to the Filter Criteria Table at the bottomAdd Above Filter Criteria to Table
of the page.
Optionally, you can repeat the process to create a series of filter conditions.
This option is useful if you want to create an OR condition for the filter. For example, if you wanted to
consolidate all of the Microsoft Windows XP computers and any under-utilized Windows 2003 computer:
Select from the list, and click .WindowsXP OS Add Above Filter Criteria to Table
Select from the list, specify an value of 10%, and clickWindows2003 OS Average CPU Utilization Add.Above Filter Criteria to Table
The resulting filter would find any Windows XP computer and any Windows 2003 computer with CPU
usage less than 10%.
Click to filter the list of computers on the Computer Explorer page, or clickApply Filter Save Filter and Apply
to both apply the filter and add the filter to the Computer Filter list, which makes the filter available for future use
.
Once you apply the filter you are returned to the Computer Explorer page, which is refreshed to show the computers
that meet the filter criteria.
4.10.2 Adding or removing computers from a Consolidation Study
When reviewing the list of candidate computers, you may decide that the list is incomplete, or that there are some
computers you do not want included in the study.
To add to remove computers from a Consolidation Study
From the Consolidate To Virtual - Targets page, click .Add/Remove
The Add/Remove Computers page shows all computers that are available through the Study Profile specified
on the Computer Explorer page.
Review your selections and ensure that it reflects the list of candidate computers you want to include in the
study.
Select any computers you want to add to the study.
Deselect computers that you want removed from the study.
Click .Save
8/21/2019 Using BMC Performance Perceiver-V5-20141128_0503
http://slidepdf.com/reader/full/using-bmc-performance-perceiver-v5-201411280503 57/245
Using BMC Performance Perceiver BMC Software Confidential
BMC Capacity Optimization 9.5 Page of57 245
1.
2.
3.
4.10.3 Adding or removing guests from a Deployment Study
When reviewing the list of deployment candidate computers, you may decide that you want to deploy additional guests
, reduce the number of guests being deployed, or want to choose a different guest profile.
From the Select Target Hosts page, click . You are returned to the Deploy New Guests page, where youAdd/Remove
can make the necessary changes.
4.10.4 Changing computer assignments
After reviewing Virtual Host report on the Results page, you may decide that there are source computers or guests
assigned to this virtual host which you want to move to a different host.
To change the list of computers assigned to a virtual host, click on the Consolidation ResultsChange Assignments
page or Deployment Results page to display the Change Source-to-Target Assignments page. Use this page to move
one or more computers from one virtual host in the study to another.
The page has a table that lists the computers involved in the study. The column shows theAssigned Virtual Host
virtual host to which the computer has been consolidated in the study.
To move the computer to another virtual target
Select the virtual target to which you want to move the computer from the list in the columnAssignment Action
, or leave the selection blank to have the target for the computer automatically determined.
Select the reconsolidation option for the computers with a blank value in the column.Assignment Action
To automatically place the computers on virtual hosts during reconsolidation, select the Moveoption.computers to new virtual hosts as needed to achieve optimal balancing
To keep these computers on the virtual host specified in the column, selectAssigned Host Computer
the option.Leave Computers on their currently assigned virtual host
Click .Reconsolidate
4.10.5 Setting an affinity relationship for computers
When reviewing the list of source computers or guests on the Target page or Consolidate to Virtual page, you may
decide that there are specific guest computers that you do not want assigned to the same virtual host.
Affinity relationships can be established between specific systems or defined by using system and business attributeinformation (systems belonging to the Order Entry department cannot coreside with systems assigned to the Database
Server application).
Use the Apply Affinity Rules page to set affinity relationships between source computers or guests, specifying which
ones must co-reside on the same virtual host and which ones must reside on different hosts. For example, one of the
source computers may be a backup server for another source computer, which you would not want to co-reside on the
same virtual host.
8/21/2019 Using BMC Performance Perceiver-V5-20141128_0503
http://slidepdf.com/reader/full/using-bmc-performance-perceiver-v5-201411280503 58/245
Using BMC Performance Perceiver BMC Software Confidential
BMC Capacity Optimization 9.5 Page of58 245
1.
2.
3.
4.
5.
1.
2.
3.
4.
Note
Be aware that setting affinity relationships may impact the number of target virtual hosts that are
recommended by the study. For example, if you specify that a number of guests cannot co-reside on the
same virtual host, Virtualization Planning may need to create additional virtual hosts for these guests.
To set an affinity relationship for candidate computers
Click Set Affinity on the Consolidate to Virtual - Targets page to display the Apply-Affinity Rules page. Each
affinity condition can be interpreted as "systems with all the attribute values specified on the left can/cannot
co-reside with systems matching all the attribute values specified on the right".
Choose the applicable affinity rule and click Save.
This affinity rule will be applied.
If there are no affinity rules available you must create one. You can create an affinity rule based on attributes orone based on name.
Select two or more computers for which this relationship type applies.
Click .Set
When you are done with setting affinity relationships, click .Save
To clear an affinity relationship
Select the type of affinity relationship at the top of the page.
Select the computers for which you want to remove the relationship. Clearing a relationship is reciprocal
between candidate computers. For example, if computer A and computer B have an affinity relationship and youselect computer A, then computer B's relationship with computer A is also cleared, even if you did not select
computer B.
Click .Clear
When you have finished clearing affinity relationships, click .Save
Note
Setting a relationship may cause additional virtual hosts to be created. For exampleCannot co-reside
, if you have three computers that cannot co-reside, you will need at least three hosts to accommodate
that relationship.
4.10.6 Viewing the guests on an existing virtual host
You can view the guests currently running on existing virtual hosts and see key performance statistics and utilization
graphs for each guest.
8/21/2019 Using BMC Performance Perceiver-V5-20141128_0503
http://slidepdf.com/reader/full/using-bmc-performance-perceiver-v5-201411280503 59/245
Using BMC Performance Perceiver BMC Software Confidential
BMC Capacity Optimization 9.5 Page of59 245
To view the guests on an existing virtual host, click View Guests on the Targets page. The View Guests button is
available when the Existing Virtual Hosts table is displaying only hosts.
The table on the Guests on Host page shows the guests currently running on the host server, along with some basic
metrics for each guest. The graphs at the bottom of the page provide a snapshot of the guest resource utilization, by
interval, for the specified time period you selected for the study. The legend to the right of the graph provides acolor-coded list of each guest system.
Tip
If you want to copy the graphs to include them in another document, right-click the graph and select Save
.picture
You can also specify how to handle the existing guests that are currently running on the virtual host, using the options
in the column. When you first display the Guests on Hosts page, the action listed in this column is the same asActionthe assignment action shown on the table. You can change the assignment action for theUse Existing Virtual Hosts
individual guest by selecting one of the following options:
Keep on current host: Select this option if you want the guest to remain on this host server in the virtualization
study.
Move as needed: Select this option if you want Virtualization Planning to decide the best location for the guest
in this study.
Ignore: Select this option to remove the guest from the study.
4.10.7 Advanced settings of a virtualization studyThis topic provides information about advanced settings described as follows:
Changing the target hardware (see page 59)
Changing the virtualization parameters (see page 60)
Advanced properties file for Virtualization Planning (see page 61)
Changing the target hardware
Click on the Targets page to select the hardware configuration for new virtual hosts.Change CPU Model
Tip
If you are selecting a hardware configuration for a specific study, the CPU model you choose applies only to
the study you are working on. Click to make the CPU model the default configurationSave to Study Profile
for the Study Profile associated with the study.
8/21/2019 Using BMC Performance Perceiver-V5-20141128_0503
http://slidepdf.com/reader/full/using-bmc-performance-perceiver-v5-201411280503 60/245
Using BMC Performance Perceiver BMC Software Confidential
BMC Capacity Optimization 9.5 Page of60 245
1.
2.
3.
4.
On the Hardware Selector page, browse the available list of CPU models and select a model.
The table lists the configuration for many CPU models. You can filter the list by selecting a vendor from the Filter by
list. Click any of the column headings to sort the table.Vendor
Changing the virtualization parametersYou can also change the virtualization parameters by clicking on any of the following pages:Advanced
Consolidate To Virtual - Targets
Edit Consolidation Study
Specify Target Hosts
Edit Target Host
The Change Advanced Settings page defines virtualization parameters such as the maximum number of guests
allowed for the target host, network and I/O rates, as well as the amount of CPU overhead that will be used by the
target host. You can also set thresholds for the maximum amount of the host server CPU and memory that can be
used by any guest.
There are two ways to specify I/O and network thresholds on the Study Profile or Advanced Settings page:
Enter specific I/O and network rate values.
Ask Virtualization Planning to calculate threshold values based upon measurements already available in your
data.
You can change any of the values shown in the the following table.
Boxes on the Change Advanced Settings page
Field Description
Host CPU
Utilization
Threshold
The maximum combined value of CPU utilization for all guests on a host server, plus the CPU overhead.
New Host
Additional
CPU
Overhead
The percentage of CPU utilization that will be used by the host server to support virtualization. This setting applies only to new virtual hosts,
or to existing virtual hosts that do not have any guests participating in the study.
Host
Memory
Utilization
Threshold
The overall memory utilization of the virtual host (which is the sum of the memory used by all i ts guests), divided by the configured memory
of the virtual host.
Reconfigure
Guest
Memory
This value is used to reduce configured memory for computers that are over-configured when assigning them to hosts. Select Never if you
do not want guest configured memory to be reduced. If you do want it to be reduced, select the other radio button and specify the threshold
such that when memory utilization is below this value, the configured memory for the guest will be reset. The second field is used to set the
new value for configured For example, suppose you have set this value to 20%, the average memory usage of a guest is 0.4 GB, and the
guest has 3 GB of configured memory. When the guest is placed on a host, it's configured memory is reduced to 2 GB, as the average
guest memory usage (0.4 GB) is 20% of 2GB. This value must be less than the value specified for the Host Memory Utilization Threshold.
8/21/2019 Using BMC Performance Perceiver-V5-20141128_0503
http://slidepdf.com/reader/full/using-bmc-performance-perceiver-v5-201411280503 61/245
Using BMC Performance Perceiver BMC Software Confidential
BMC Capacity Optimization 9.5 Page of61 245
Field Description
Maximum
Guests per
Host
The maximum number of guests that can be consolidated on any target host server.
Host IO
Rate
The maximum rate of IO that is acceptable on the target host server.
Host
Network
Rate
The maximum rate of network throughput that is acceptable on the target host server.
Advanced properties file for Virtualization Planning
Advanced property settings for the Virtual Planner are available in the file. The file isscon_user.properties
located at .$TOMCAT_HOME$/webapps/console/WEB-INF/classes
Some of the settings listed in the properties file can be changed using the from the task pane. If requiredSettings page, you should only modify the settings listed in the following table.
Settings available in the scon.properties file
Setting Notes
scon.perf.benchmark.basis=
SPECINTRATE2000
This option specifies the performance benchmark used by Sizer. Change this option using the pageSettings
.
scon.printing.show.graphs=true
scon.printing.target.page.breaks
=true
These options apply to the Save as PDF and Save as RTF export options. Set the first option to tofalse
suppress the appearance of graphs in the output file. Set the second option to to remove page breaksfalse
between the Virtual Host reports on the Consolidation Summary.
scon.log.level=INFO This option controls the level of detail for the log file. Change this option using the page.Settings
scon.profile.default=VMware This option is used to set the default Study Profile for all studies.
4.11 Troubleshooting Virtualization PlanningRefer to the following sections, depending on which screen you are missing data or seeing exceptions:
Analysis exceptions in Virtualization Planning (see page 61)
Data exceptions in Virtualization Planning (see page 63)
4.11.1 Analysis exceptions in Virtualization Planning
This topics describes some possible exceptions that are generated after selecting the study components.
The Virtual Planner will show analysis exceptions once the user has selected their study components (candidates,
targets) and settings (thresholds, new hardware options, etc.) and requested results
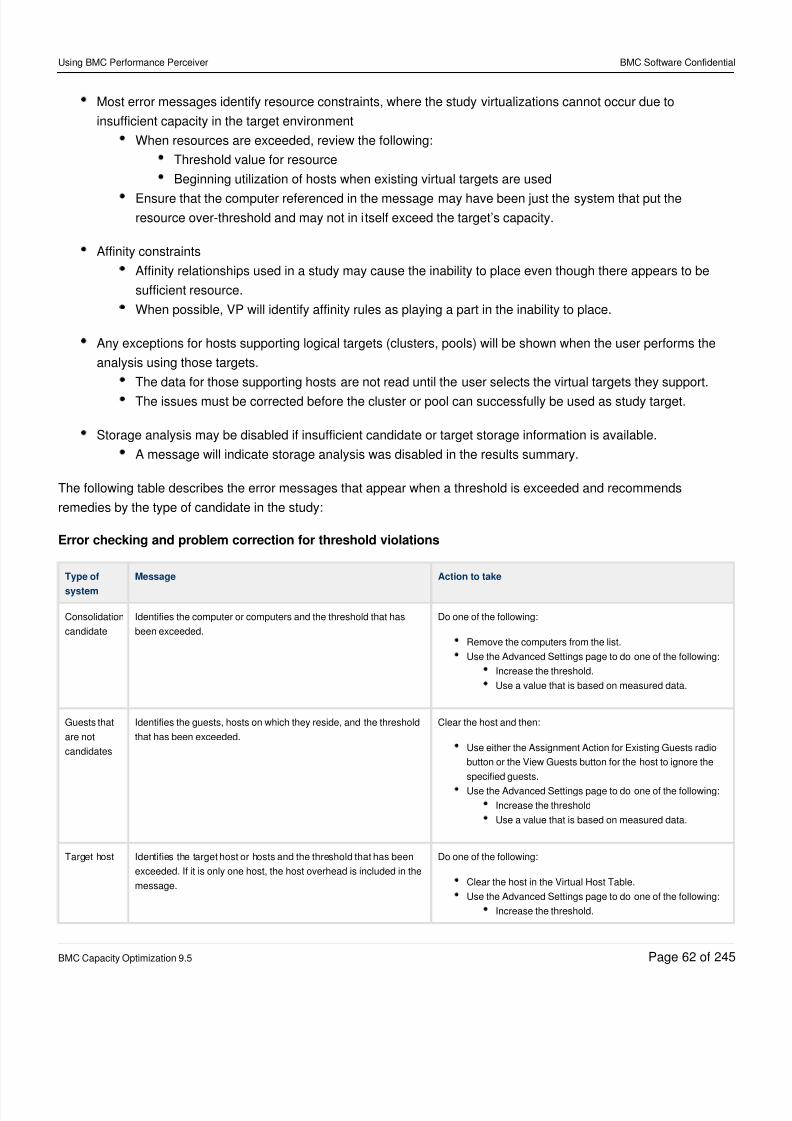
8/21/2019 Using BMC Performance Perceiver-V5-20141128_0503
http://slidepdf.com/reader/full/using-bmc-performance-perceiver-v5-201411280503 62/245
Using BMC Performance Perceiver BMC Software Confidential
BMC Capacity Optimization 9.5 Page of62 245
Most error messages identify resource constraints, where the study virtualizations cannot occur due to
insufficient capacity in the target environment
When resources are exceeded, review the following:
Threshold value for resource
Beginning utilization of hosts when existing virtual targets are used
Ensure that the computer referenced in the message may have been just the system that put the
resource over-threshold and may not in itself exceed the target’s capacity.
Affinity constraints
Affinity relationships used in a study may cause the inability to place even though there appears to be
sufficient resource.
When possible, VP will identify affinity rules as playing a part in the inability to place.
Any exceptions for hosts supporting logical targets (clusters, pools) will be shown when the user performs the
analysis using those targets.
The data for those supporting hosts are not read until the user selects the virtual targets they support.
The issues must be corrected before the cluster or pool can successfully be used as study target.
Storage analysis may be disabled if insufficient candidate or target storage information is available.
A message will indicate storage analysis was disabled in the results summary.
The following table describes the error messages that appear when a threshold is exceeded and recommends
remedies by the type of candidate in the study:
Error checking and problem correction for threshold violations
Type of
system
Message Action to take
Consolidation
candidate
Identifies the computer or computers and the threshold that has
been exceeded.
Do one of the following:
Remove the computers from the list.
Use the Advanced Settings page to do one of the following:
Increase the threshold.
Use a value that is based on measured data.
Guests that
are not
candidates
Identifies the guests, hosts on which they reside, and the threshold
that has been exceeded.
Clear the host and then:
Use either the Assignment Action for Existing Guests radio
button or the View Guests button for the host to ignore the
specified guests.
Use the Advanced Settings page to do one of the following:
Increase the threshold
Use a value that is based on measured data.
Target host Identifies the target host or hosts and the threshold that has been
exceeded. If it is only one host, the host overhead is included in the
message.
Do one of the following:
Clear the host in the Virtual Host Table.
Use the Advanced Settings page to do one of the following:
Increase the threshold.
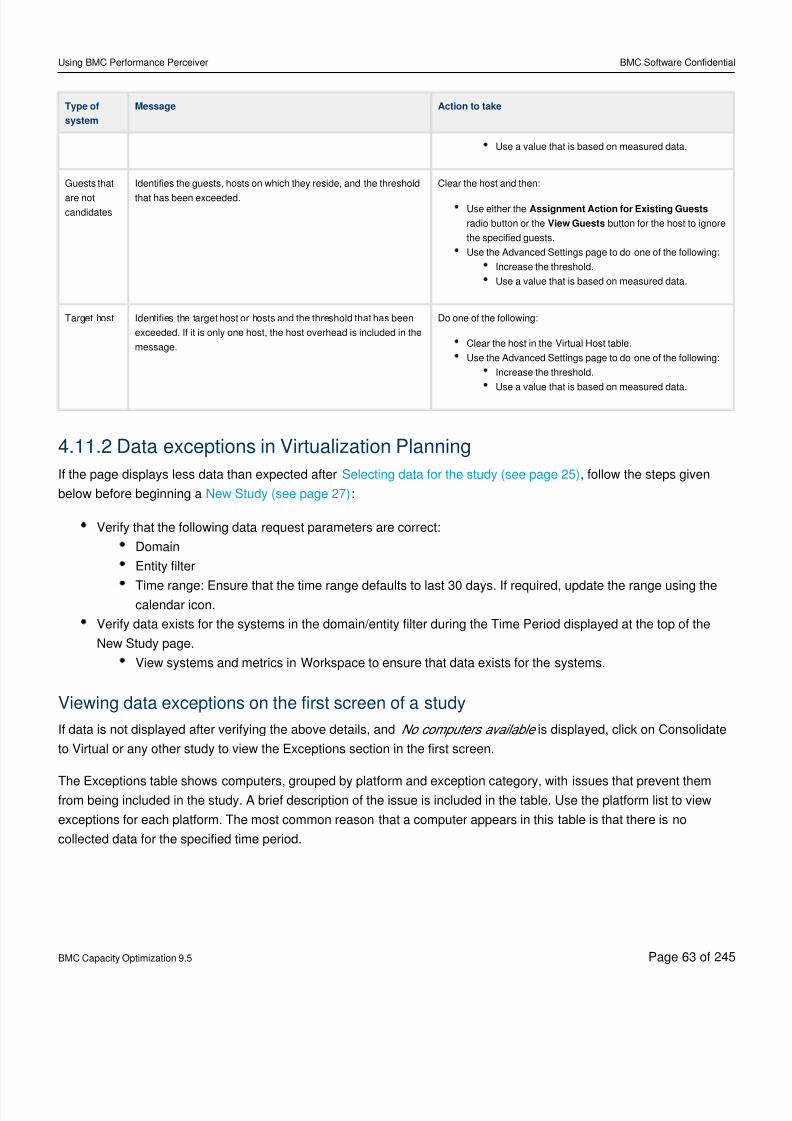
8/21/2019 Using BMC Performance Perceiver-V5-20141128_0503
http://slidepdf.com/reader/full/using-bmc-performance-perceiver-v5-201411280503 63/245
Using BMC Performance Perceiver BMC Software Confidential
BMC Capacity Optimization 9.5 Page of63 245
Type of
system
Message Action to take
Use a value that is based on measured data.
Guests that
are not
candidates
Identifies the guests, hosts on which they reside, and the threshold
that has been exceeded.
Clear the host and then:
Use either the Assignment Action for Existing Guests
radio button or the button for the host to ignoreView Guests
the specified guests.
Use the Advanced Settings page to do one of the following:
Increase the threshold.
Use a value that is based on measured data.
Target host Identifies the target host or hosts and the threshold that has been
exceeded. If it is only one host, the host overhead is included in the
message.
Do one of the following:
Clear the host in the Virtual Host table.
Use the Advanced Settings page to do one of the following:
Increase the threshold.
Use a value that is based on measured data.
4.11.2 Data exceptions in Virtualization Planning
If the page displays less data than expected after , follow the steps givenSelecting data for the study (see page 25)
below before beginning a :New Study (see page 27)
Verify that the following data request parameters are correct:
Domain
Entity filter
Time range: Ensure that the time range defaults to last 30 days. If required, update the range using thecalendar icon.
Verify data exists for the systems in the domain/entity filter during the Time Period displayed at the top of the
New Study page.
View systems and metrics in Workspace to ensure that data exists for the systems.
Viewing data exceptions on the first screen of a study
If data is not displayed after verifying the above details, and is displayed, click on ConsolidateNo computers available
to Virtual or any other study to view the Exceptions section in the first screen.
The Exceptions table shows computers, grouped by platform and exception category, with issues that prevent themfrom being included in the study. A brief description of the issue is included in the table. Use the platform list to view
exceptions for each platform. The most common reason that a computer appears in this table is that there is no
collected data for the specified time period.
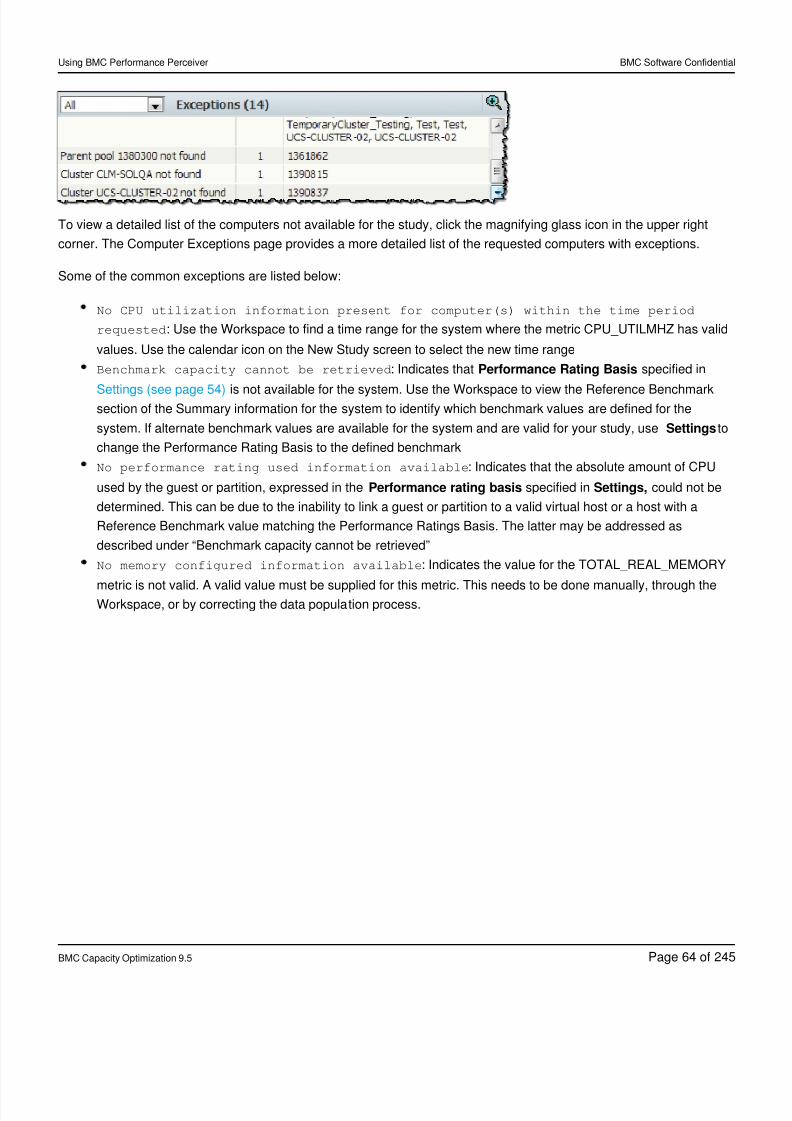
8/21/2019 Using BMC Performance Perceiver-V5-20141128_0503
http://slidepdf.com/reader/full/using-bmc-performance-perceiver-v5-201411280503 64/245
Using BMC Performance Perceiver BMC Software Confidential
BMC Capacity Optimization 9.5 Page of64 245
To view a detailed list of the computers not available for the study, click the magnifying glass icon in the upper right
corner. The Computer Exceptions page provides a more detailed list of the requested computers with exceptions.
Some of the common exceptions are listed below:
No CPU utilization information present for computer(s) within the time period
requested: Use the Workspace to find a time range for the system where the metric CPU_UTILMHZ has valid
values. Use the calendar icon on the New Study screen to select the new time range
Benchmark capacity cannot be retrieved: Indicates that specified inPerformance Rating Basis
is not available for the system. Use the Workspace to view the Reference BenchmarkSettings (see page 54)section of the Summary information for the system to identify which benchmark values are defined for the
system. If alternate benchmark values are available for the system and are valid for your study, use toSettings
change the Performance Rating Basis to the defined benchmark
No performance rating used information available: Indicates that the absolute amount of CPU
used by the guest or partition, expressed in the specified in could not bePerformance rating basis Settings,
determined. This can be due to the inability to link a guest or partition to a valid virtual host or a host with a
Reference Benchmark value matching the Performance Ratings Basis. The latter may be addressed as
described under “Benchmark capacity cannot be retrieved”
No memory configured information available: Indicates the value for the TOTAL_REAL_MEMORY
metric is not valid. A valid value must be supplied for this metric. This needs to be done manually, through theWorkspace, or by correcting the data population process.
8/21/2019 Using BMC Performance Perceiver-V5-20141128_0503
http://slidepdf.com/reader/full/using-bmc-performance-perceiver-v5-201411280503 65/245
Using BMC Performance Perceiver BMC Software Confidential
BMC Capacity Optimization 9.5 Page of65 245
5 Using General ManagerThe tab allows you to manage multiple BMC Performance Perceiver consoles through a webGeneral Manager
browser.
The General Manager Client is a web-based client that is set up on the local host, on a specific port. The General
Manager Server is a standalone executable, and it begins execution as soon as the General Manager Client is
launched. This server includes a web services server that runs as a standalone service or as part of the Perceiver
Common Gateway Interface (CGI) server.
For more information on using and administering the General Manager, refer to the following topics:
Overview of General Manager (see page 65)
Features of General Manager (see page 66)
Using Console Management (see page 67)
Using Console Operations (see page 69)
Viewing Console Reports (see page 80)
Viewing Console Logs (see page 82)
Setting General Manager Preferences (see page 83)
5.1 Overview of General ManagerGeneral Manager coordinates and controls Manager runs by integrating multiple BMC Performance Perceiver
consoles on UNIX and Windows hosts under a single umbrella. You can perform any of the following actions:
List what is running on each console (both Manager run information and node information)
Start, stop, view, and recover existing Manager runs
View reports and logs
Node History
Collection and Transfer Status Report (UCM Status Report)
Processing Report (OSR)
Data Collection and Processing Exception Report
Manager run logs
View console configuration (operating system and console version)
Create new Manager runs and corresponding computer lists
General Manager consists of the General Manager Client component and the General Manager Server component.
The server and client communicate via web services.
The General Manager Server resides on the same node as the Manager console. The General Manager Client user
interface is integrated with the BMC Performance Perceiver as a separate tab in the Perceiver interface.
8/21/2019 Using BMC Performance Perceiver-V5-20141128_0503
http://slidepdf.com/reader/full/using-bmc-performance-perceiver-v5-201411280503 66/245
Using BMC Performance Perceiver BMC Software Confidential
BMC Capacity Optimization 9.5 Page of66 245
5.1.1 Starting General Manager
For information about how to start the General Manager Server, see:
Installing the General Manager Server
5.1.2 Using General Manager
For detailed information about how to use General Manager see the following section.
Features of General Manager (see page 66)
Using Console Management (see page 67)
Using Console Operations (see page 69)
Viewing Console Reports (see page 80)
Viewing Console Logs (see page 82)
Setting General Manager Preferences (see page 83)
5.2 Features of General ManagerThis topic provides information of General Manager and its operations. Using General Manager, you can perform the
following operations for consoles:
Using Console Management- After the General Manager service is enabled, add the consoles that you want
to manage. The Console Management feature of General Manager enables you to keep a tab of the consoles
that you are managing. Using this feature, you can add consoles, remove them, and check their status. Using
General Manager, you can perform the following Console Management activities.
Viewing Consoles (see page 67)Adding Consoles (see page 68)
Removing Consoles (see page 68)
Using Console Operations- Several manager runs run on a console. These runs collect, transfer, process,
and populate data. General Manager enables you to schedule, monitor, recover, create, and abort the manager
runs for multiple consoles. This feature enables you to control the manager runs for a console irrespective of the
console operating system. Using General Manager, you can perform the following Console Operations activities
.
Listing Nodes (see page 69)
Viewing Scheduled Runs (see page 71)
Creating New Run (see page 72)Scheduling New Runs (see page 77)
Stopping Scheduled Runs (see page 78)
Recovering Runs (see page 79)
Configuring Console (see page 79)
Viewing Console Reports- General Manager generates reports that help you to track the performance of the
consoles and manager runs. Using General Manager, you can view the following console reports.
Viewing Node History (see page 80)
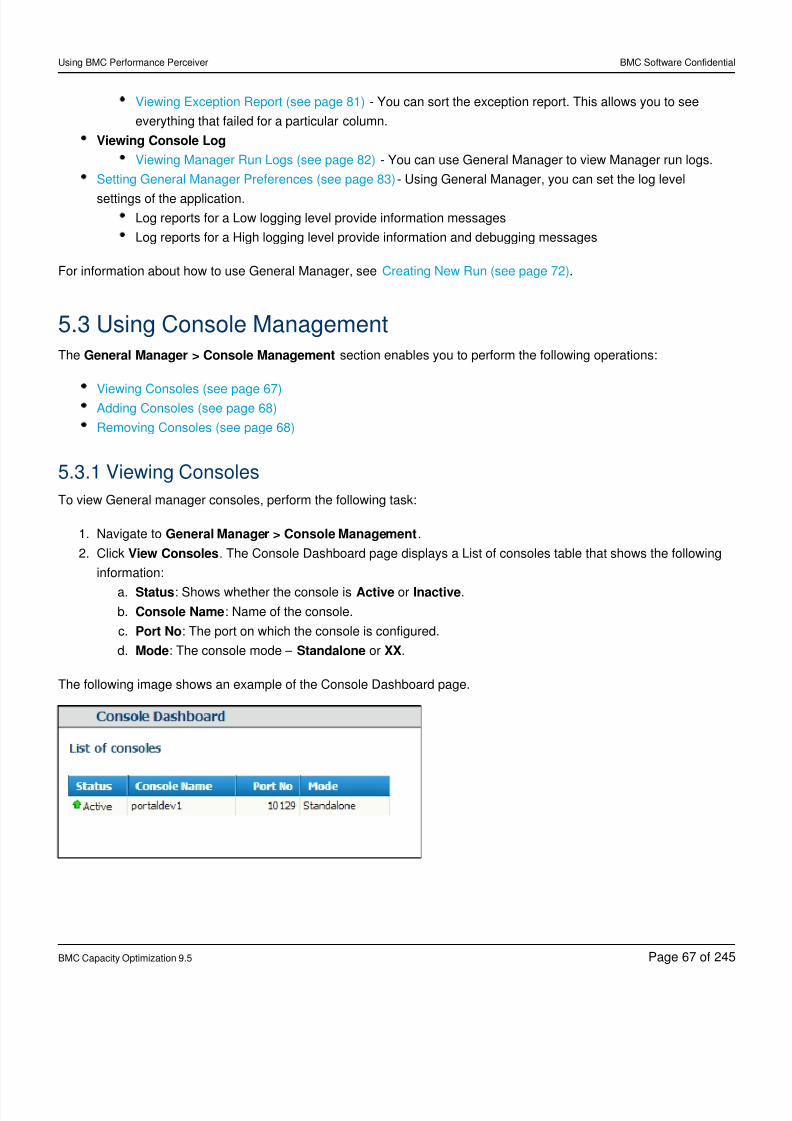
8/21/2019 Using BMC Performance Perceiver-V5-20141128_0503
http://slidepdf.com/reader/full/using-bmc-performance-perceiver-v5-201411280503 67/245
Using BMC Performance Perceiver BMC Software Confidential
BMC Capacity Optimization 9.5 Page of67 245
1.
2.
a.
b.
c.
d.
Viewing Exception Report (see page 81) - You can sort the exception report. This allows you to see
everything that failed for a particular column.
Viewing Console Log
Viewing Manager Run Logs (see page 82) - You can use General Manager to view Manager run logs.
Setting General Manager Preferences (see page 83)- Using General Manager, you can set the log level
settings of the application.
Log reports for a Low logging level provide information messages
Log reports for a High logging level provide information and debugging messages
For information about how to use General Manager, see .Creating New Run (see page 72)
5.3 Using Console ManagementThe section enables you to perform the following operations: > Console ManagementGeneral Manager
Viewing Consoles (see page 67)Adding Consoles (see page 68)
Removing Consoles (see page 68)
5.3.1 Viewing Consoles
To view General manager consoles, perform the following task:
Navigate to .General Manager > Console Management
Click . The Console Dashboard page displays a List of consoles table that shows the followingView Consoles
information:
Status: Shows whether the console is or .Active Inactive
Console Name: Name of the console.
Port No: The port on which the console is configured.
Mode: The console mode – or .Standalone XX
The following image shows an example of the Console Dashboard page.
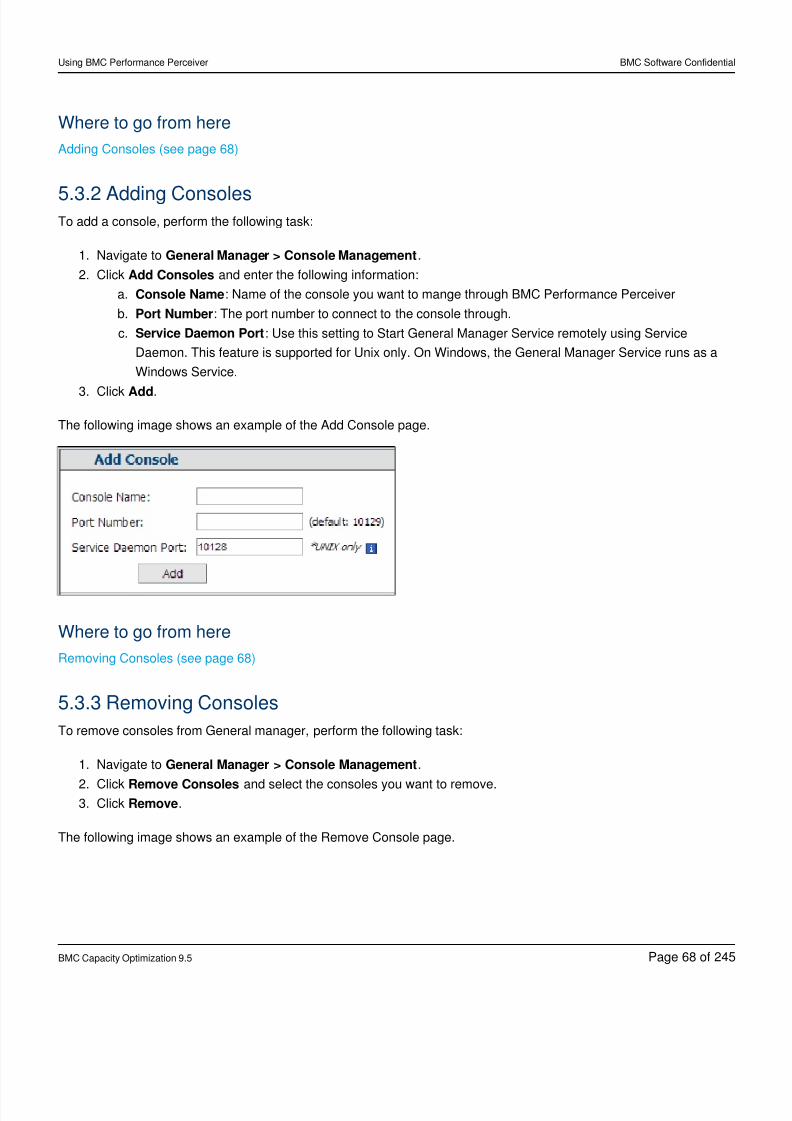
8/21/2019 Using BMC Performance Perceiver-V5-20141128_0503
http://slidepdf.com/reader/full/using-bmc-performance-perceiver-v5-201411280503 68/245
Using BMC Performance Perceiver BMC Software Confidential
BMC Capacity Optimization 9.5 Page of68 245
1.
2.
a.
b.
c.
3.
1.
2.3.
Where to go from here
Adding Consoles (see page 68)
5.3.2 Adding ConsolesTo add a console, perform the following task:
Navigate to .General Manager > Console Management
Click and enter the following information:Add Consoles
Console Name: Name of the console you want to mange through BMC Performance Perceiver
Port Number: The port number to connect to the console through.
Service Daemon Port: Use this setting to Start General Manager Service remotely using Service
Daemon. This feature is supported for Unix only. On Windows, the General Manager Service runs as a
Windows Service.
Click .Add
The following image shows an example of the Add Console page.
Where to go from here
Removing Consoles (see page 68)
5.3.3 Removing Consoles
To remove consoles from General manager, perform the following task:
Navigate to .> Console ManagementGeneral Manager
Click and select the consoles you want to remove.Remove ConsolesClick .Remove
The following image shows an example of the Remove Console page.
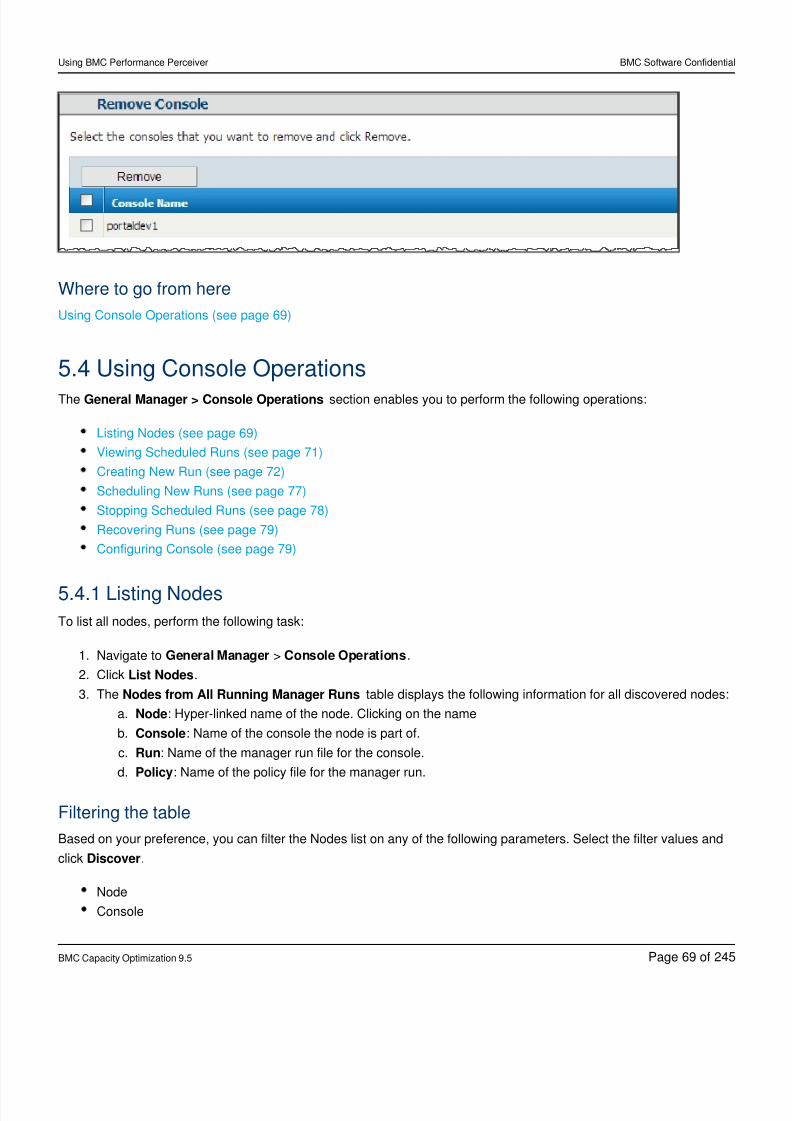
8/21/2019 Using BMC Performance Perceiver-V5-20141128_0503
http://slidepdf.com/reader/full/using-bmc-performance-perceiver-v5-201411280503 69/245
Using BMC Performance Perceiver BMC Software Confidential
BMC Capacity Optimization 9.5 Page of69 245
1.
2.
3.
a.
b.
c.
d.
Where to go from here
Using Console Operations (see page 69)
5.4 Using Console OperationsThe section enables you to perform the following operations:General Manager > Console Operations
Listing Nodes (see page 69)
Viewing Scheduled Runs (see page 71)
Creating New Run (see page 72)
Scheduling New Runs (see page 77)
Stopping Scheduled Runs (see page 78)
Recovering Runs (see page 79)
Configuring Console (see page 79)
5.4.1 Listing NodesTo list all nodes, perform the following task:
Navigate to > .General Manager Console Operations
Click .List Nodes
The table displays the following information for all discovered nodes:Nodes from All Running Manager Runs
Node: Hyper-linked name of the node. Clicking on the name
Console: Name of the console the node is part of.
Run: Name of the manager run file for the console.
Policy: Name of the policy file for the manager run.
Filtering the table
Based on your preference, you can filter the Nodes list on any of the following parameters. Select the filter values and
click .Discover
Node
Console
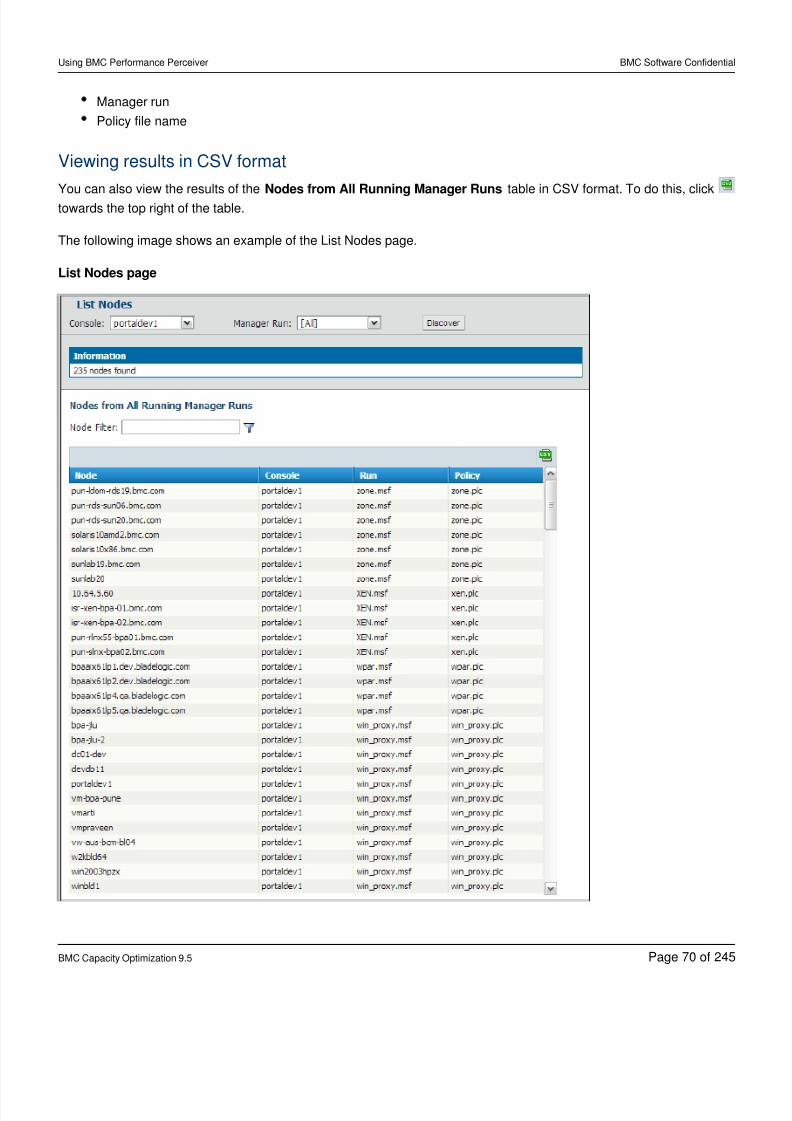
8/21/2019 Using BMC Performance Perceiver-V5-20141128_0503
http://slidepdf.com/reader/full/using-bmc-performance-perceiver-v5-201411280503 70/245
Using BMC Performance Perceiver BMC Software Confidential
BMC Capacity Optimization 9.5 Page of70 245
Manager run
Policy file name
Viewing results in CSV format
You can also view the results of the table in CSV format. To do this, clickNodes from All Running Manager Runs
towards the top right of the table.
The following image shows an example of the List Nodes page.
List Nodes page
8/21/2019 Using BMC Performance Perceiver-V5-20141128_0503
http://slidepdf.com/reader/full/using-bmc-performance-perceiver-v5-201411280503 71/245
Using BMC Performance Perceiver BMC Software Confidential
BMC Capacity Optimization 9.5 Page of71 245
1.
2.
3.
a.
b.
c.
4.
a.
b.
c.
5.
Where to go from here
Viewing Scheduled Runs (see page 71)
5.4.2 Viewing Scheduled Runs
To view scheduled runs, perform the following task:
Navigate to > .General Manager Console Operations
Click .View Scheduled Runs
The Scheduled Runs table displays the following information:
Run Name: Name of the node.
Start time: Name of the console the node is part of.
Console: Name of the manager run file for the console.
Select the following additional filters as required:
Console: Select the Console from the drop down list or select [All] to view the Manager Run logs for all
the consoles.Manager Run: Select the Manager Run to view specific logs.
Manager Run Filter: Type a Manager Run name or wildcard expression such as .*win
Click any run to view the properties. For details, see .Creating New Run (see page 72)
View Scheduled Runs page
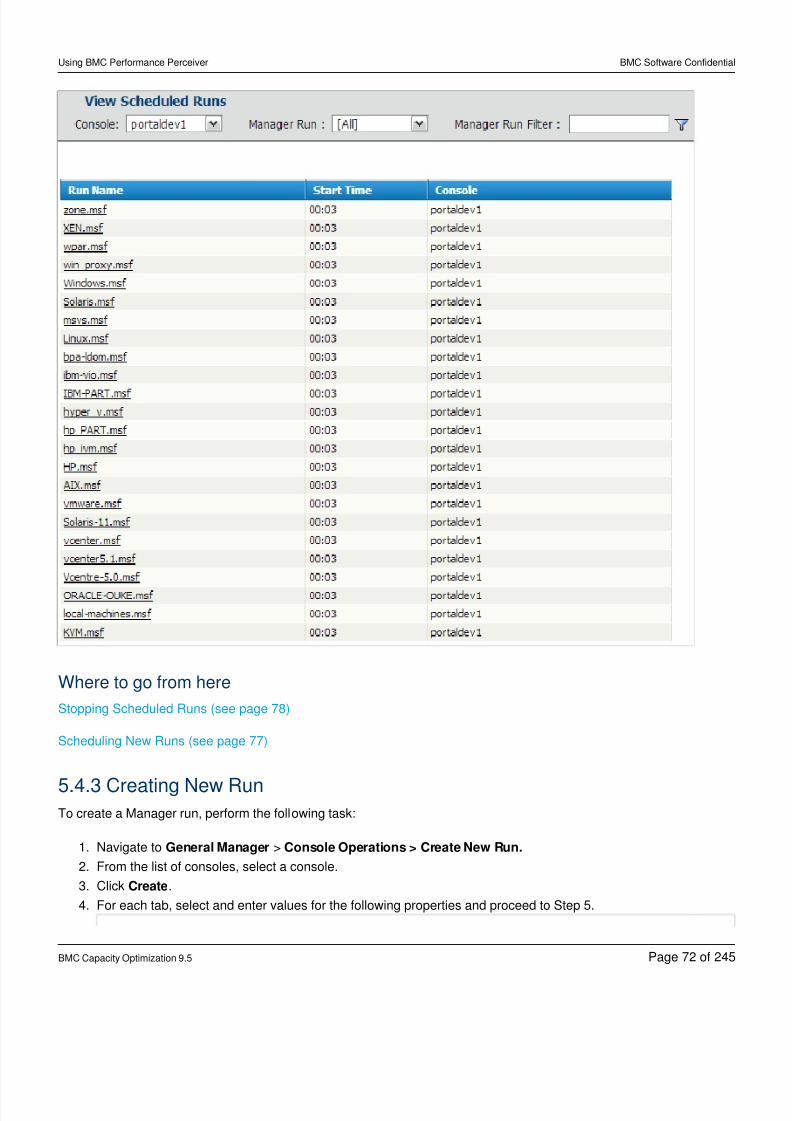
8/21/2019 Using BMC Performance Perceiver-V5-20141128_0503
http://slidepdf.com/reader/full/using-bmc-performance-perceiver-v5-201411280503 72/245
Using BMC Performance Perceiver BMC Software Confidential
BMC Capacity Optimization 9.5 Page of72 245
1.
2.
3.
4.
Where to go from here
Stopping Scheduled Runs (see page 78)
Scheduling New Runs (see page 77)
5.4.3 Creating New RunTo create a Manager run, perform the following task:
Navigate to >General Manager Console Operations > Create New Run.
From the list of consoles, select a console.
Click .Create
For each tab, select and enter values for the following properties and proceed to Step 5.
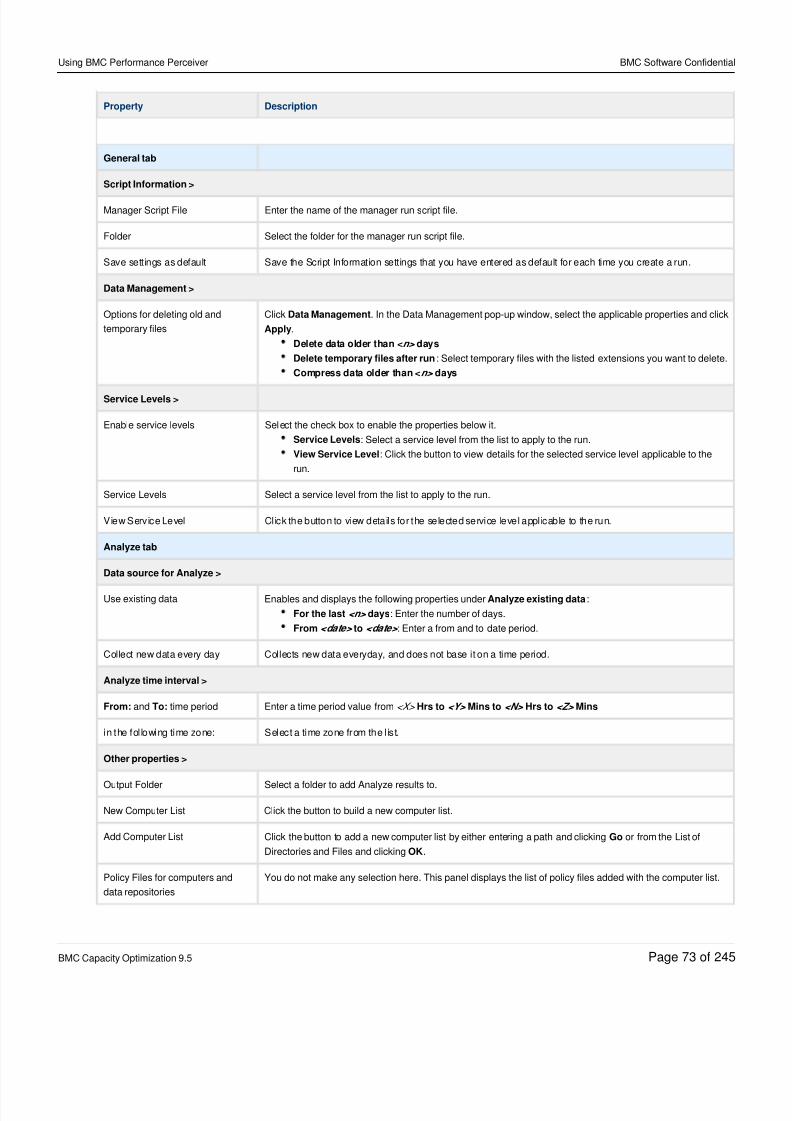
8/21/2019 Using BMC Performance Perceiver-V5-20141128_0503
http://slidepdf.com/reader/full/using-bmc-performance-perceiver-v5-201411280503 73/245
Using BMC Performance Perceiver BMC Software Confidential
BMC Capacity Optimization 9.5 Page of73 245
Property Description
General tab
Script Information >
Manager Script File Enter the name of the manager run script file.
Folder Select the folder for the manager run script file.
Save settings as default Save the Script Information settings that you have entered as default for each time you create a run.
Data Management >
Options for deleting old and
temporary files
Click . In the Data Management pop-up window, select the applicable properties and clickData Management
.Apply
Delete data older than < daysn>
Delete temporary files after run: Select temporary files with the listed extensions you want to delete.
Compress data older than < daysn>
Service Levels >
Enable service levels Select the check box to enable the properties below it.
Service Levels: Select a service level from the list to apply to the run.
View Service Level: Click the button to view details for the selected service level applicable to the
run.
Service Levels Select a service level from the list to apply to the run.
View Service Level Click the button to view details for the selected service level applicable to the run.
Analyze tab
Data source for Analyze >
Use existing data Enables and displays the following properties under :Analyze existing data
For the last days<n> : Enter the number of days.
From to<date> <date> : Enter a from and to date period.
Collect new data every day Collects new data everyday, and does not base it on a time period.
Analyze time interval >
From: and time periodTo: Enter a time period value from <X> Hrs to Mins to<Y> <N> Hrs to Mins<Z>
in the following time zone: Select a time zone from the l ist.
Other properties >
Output Folder Select a folder to add Analyze results to.
New Computer List Click the button to build a new computer list.
Add Computer List Click the button to add a new computer list by either entering a path and clicking or from the List ofGo
Directories and Files and clicking .OK
Policy Files for computers and
data repositories
You do not make any selection here. This panel displays the list of policy files added with the computer list.
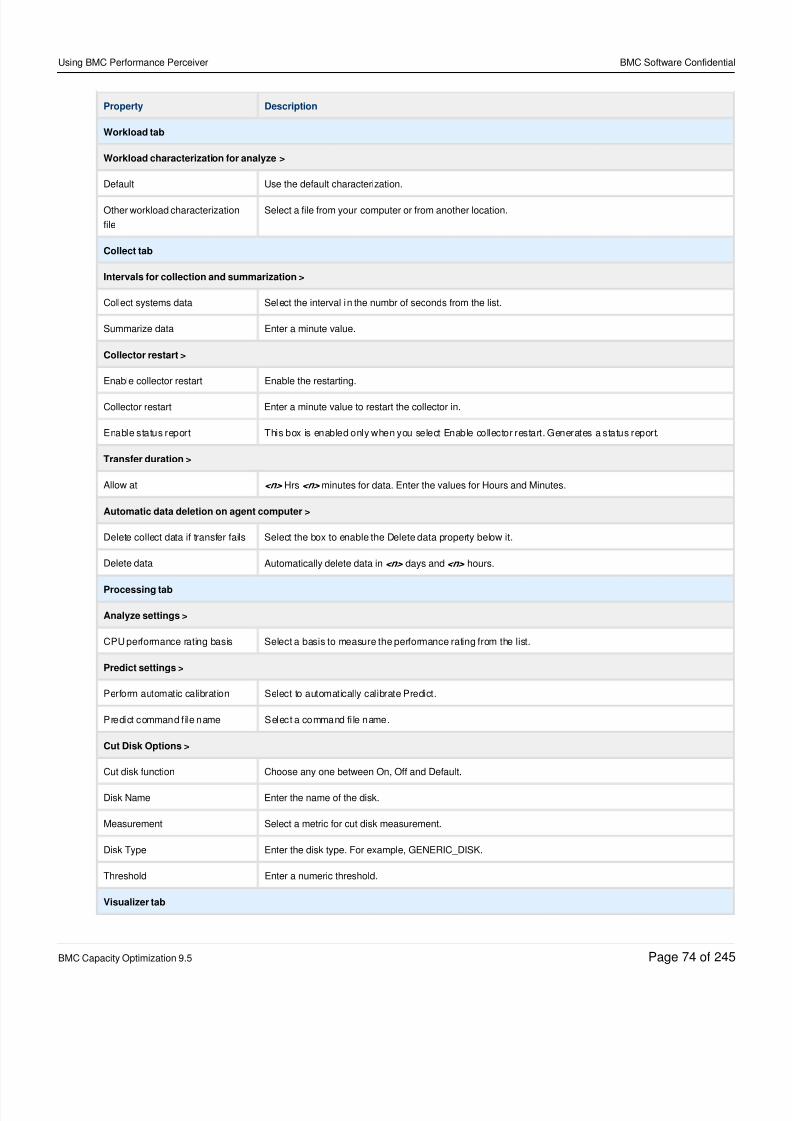
8/21/2019 Using BMC Performance Perceiver-V5-20141128_0503
http://slidepdf.com/reader/full/using-bmc-performance-perceiver-v5-201411280503 74/245
Using BMC Performance Perceiver BMC Software Confidential
BMC Capacity Optimization 9.5 Page of74 245
Property Description
Workload tab
Workload characterization for analyze >
Default Use the default characterization.
Other workload characterization
file
Select a file from your computer or from another location.
Collect tab
Intervals for collection and summarization >
Collect systems data Select the interval in the numbr of seconds from the list.
Summarize data Enter a minute value.
Collector restart >
Enable collector restart Enable the restarting.
Collector restart Enter a minute value to restart the collector in.
Enable status report This box is enabled only when you select Enable collector restart. Generates a status report.
Transfer duration >
Allow at <n> Hrs minutes for data. Enter the values for Hours and Minutes.<n>
Automatic data deletion on agent computer >
Delete collect data if transfer fails Select the box to enable the Delete data property below it.
Delete data Automatically delete data in days and hours.<n> <n>
Processing tab
Analyze settings >
CPU performance rating basis Select a basis to measure the performance rating from the list.
Predict settings >
Perform automatic calibration Select to automatically calibrate Predict.
Predict command f ile name Select a command fi le name.
Cut Disk Options >
Cut disk function Choose any one between On, Off and Default.
Disk Name Enter the name of the disk.
Measurement Select a metric for cut disk measurement.
Disk Type Enter the disk type. For example, GENERIC_DISK.
Threshold Enter a numeric threshold.
Visualizer tab
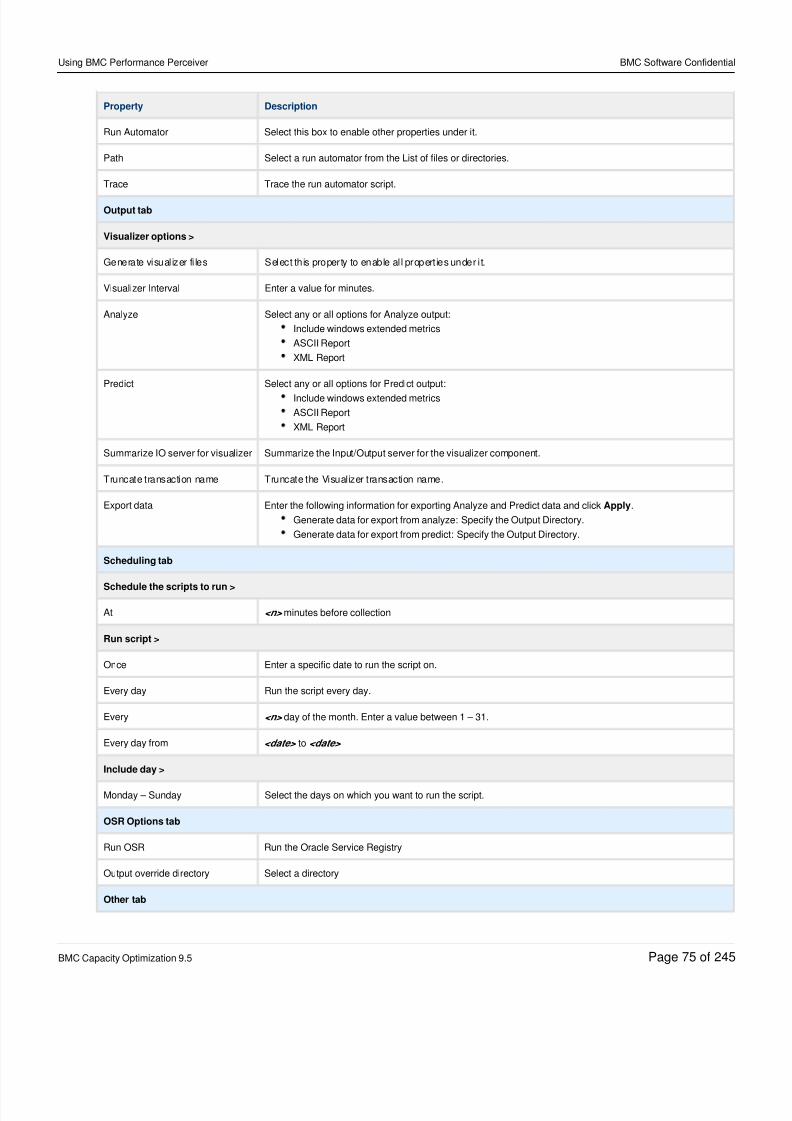
8/21/2019 Using BMC Performance Perceiver-V5-20141128_0503
http://slidepdf.com/reader/full/using-bmc-performance-perceiver-v5-201411280503 75/245
Using BMC Performance Perceiver BMC Software Confidential
BMC Capacity Optimization 9.5 Page of75 245
Property Description
Run Automator Select this box to enable other properties under it.
Path Select a run automator from the List of files or directories.
Trace Trace the run automator script.
Output tab
Visualizer options >
Generate visualizer fi les Select this property to enable all propert ies under it.
Visualizer Interval Enter a value for minutes.
Analyze Select any or all options for Analyze output:
Include windows extended metrics
ASCII Report
XML Report
Predict Select any or all options for Predict output:
Include windows extended metrics
ASCII Report
XML Report
Summarize IO server for visualizer Summarize the Input/Output server for the visualizer component.
Truncate transaction name Truncate the Visualizer transaction name.
Export data Enter the following information for exporting Analyze and Predict data and click .Apply
Generate data for export from analyze: Specify the Output Directory.
Generate data for export from predict: Specify the Output Directory.
Scheduling tab
Schedule the scripts to run >
At <n> minutes before collection
Run script >
Once Enter a specific date to run the script on.
Every day Run the script every day.
Every <n> day of the month. Enter a value between 1 – 31.
Every day from <date> to <date>
Include day >
Monday – Sunday Select the days on which you want to run the script.
OSR Options tab
Run OSR Run the Oracle Service Registry
Output override directory Select a directory
Other tab
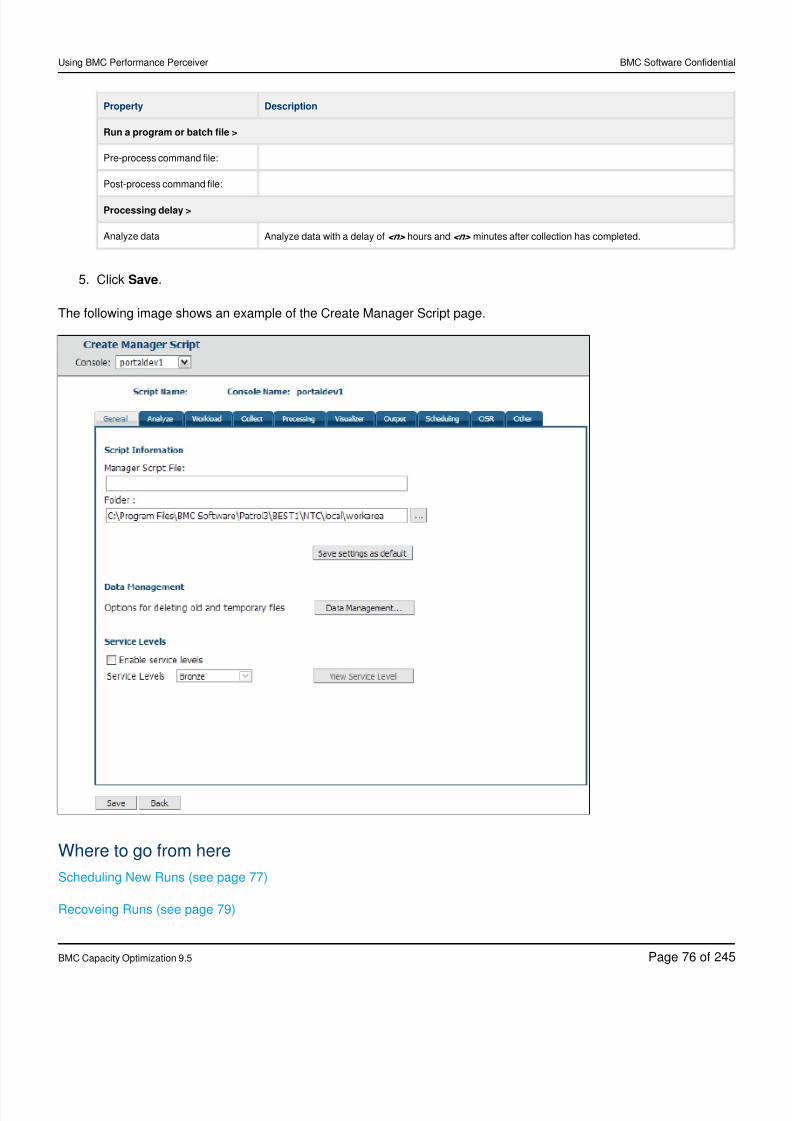
8/21/2019 Using BMC Performance Perceiver-V5-20141128_0503
http://slidepdf.com/reader/full/using-bmc-performance-perceiver-v5-201411280503 76/245
Using BMC Performance Perceiver BMC Software Confidential
BMC Capacity Optimization 9.5 Page of76 245
5.
Property Description
Run a program or batch file >
Pre-process command file:
Post-process command file:
Processing delay >
Analyze data Analyze data with a delay of hours and minutes after collection has completed.<n> <n>
Click .Save
The following image shows an example of the Create Manager Script page.
Where to go from here
Scheduling New Runs (see page 77)
Recoveing Runs (see page 79)
8/21/2019 Using BMC Performance Perceiver-V5-20141128_0503
http://slidepdf.com/reader/full/using-bmc-performance-perceiver-v5-201411280503 77/245
Using BMC Performance Perceiver BMC Software Confidential
BMC Capacity Optimization 9.5 Page of77 245
1.
2.
a.
b.
c.
d.
3.
a.
b.
c.
4.
5.
1.
2.
3.
4.
5.4.4 Scheduling New Runs
To schedule new runs, perform the following task:
Navigate to > .General Manager Console Operations
Click . The Manager Runs table displays all manager runs available to be scheduled andSchedule New Runs
the following information:
Selection box: Check box for selecting the run and to schedule it.
Run Name: Name of the manager run.
Start time: The scheduled start time for the run.
Console: Name of the console the run resides on.
Select the following additional filters as required:
Console: Select the Console from the drop down list or select [All] to view the Manager Run logs for all
the consoles.
Manager Run: Select the Manager Run to view specific logs.
Manager Run Filter: Type a Manager Run name or wildcard expression such as .*win
From the table, select the Run Names you want to schedule.
Click . An information box below the filter controls displays that the runs have been startedSchedule
successfully.
Finding other manager runs
Warning
You are not allowed to schedule multiple runs at the same time (same HH:MM value) if you use the standardtime stamp setting.
To find runs located in non-default or unknown locations, perform the following task:
Click . The Browse pop-up window is displayed.Find
Enter a path in the field where more runs are available, or browse through thePath List of Directories and
to select a path and click .Files OK
The Manager Runs table is updated to display runs from the path you selected.
Select the runs you want to schedule.
Click .Schedule
Find Runs popup
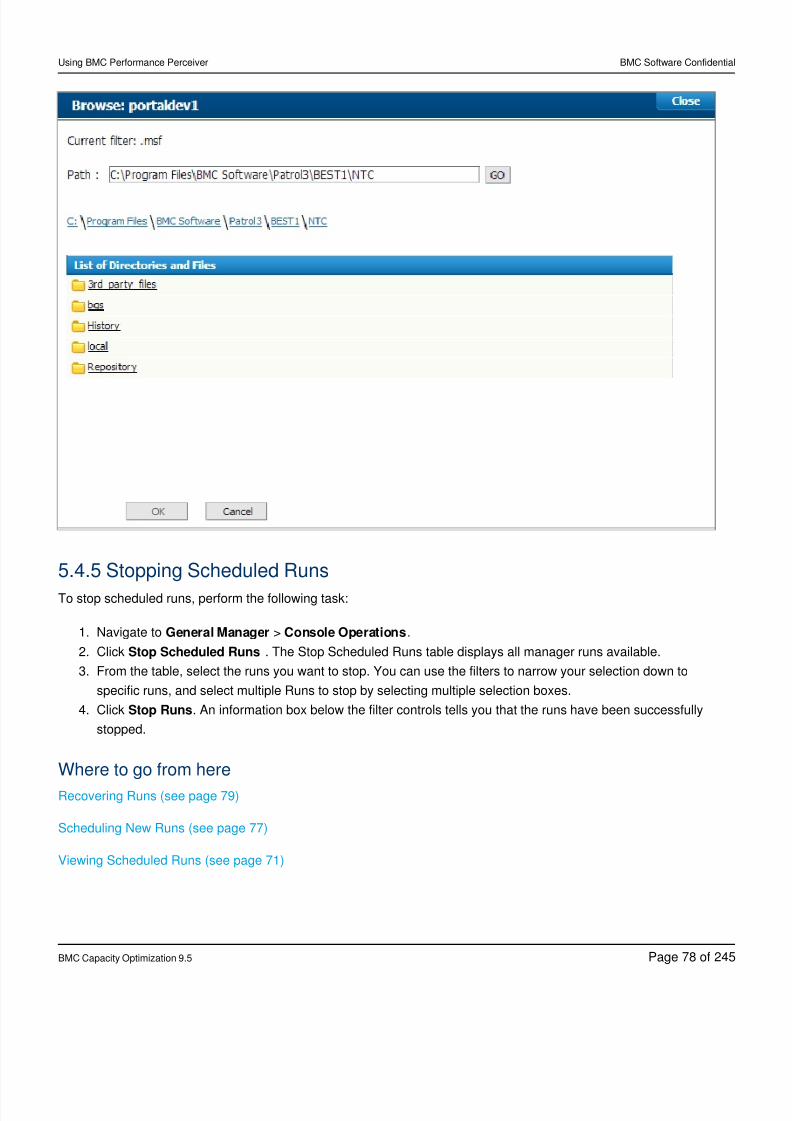
8/21/2019 Using BMC Performance Perceiver-V5-20141128_0503
http://slidepdf.com/reader/full/using-bmc-performance-perceiver-v5-201411280503 78/245
Using BMC Performance Perceiver BMC Software Confidential
BMC Capacity Optimization 9.5 Page of78 245
1.
2.
3.
4.
5.4.5 Stopping Scheduled Runs
To stop scheduled runs, perform the following task:
Navigate to > .General Manager Console Operations
Click . The Stop Scheduled Runs table displays all manager runs available.Stop Scheduled Runs
From the table, select the runs you want to stop. You can use the filters to narrow your selection down to
specific runs, and select multiple Runs to stop by selecting multiple selection boxes.
Click . An information box below the filter controls tells you that the runs have been successfullyStop Runs
stopped.
Where to go from here
Recovering Runs (see page 79)
Scheduling New Runs (see page 77)
Viewing Scheduled Runs (see page 71)
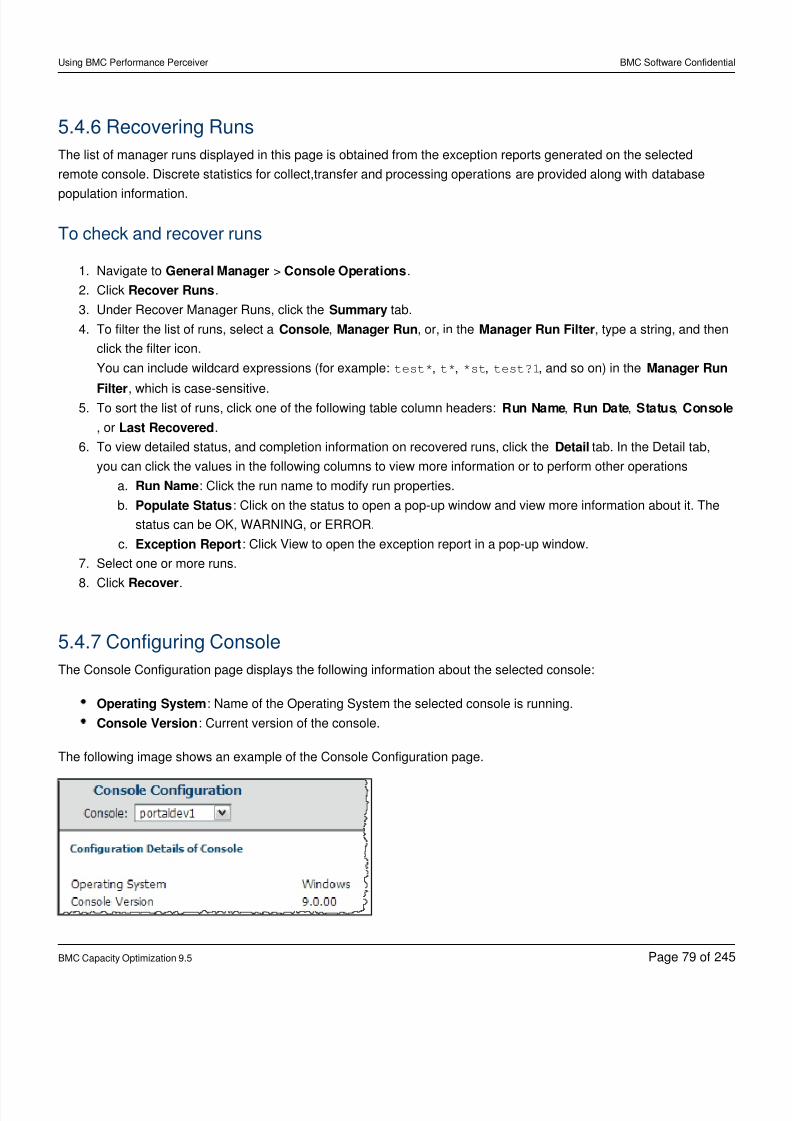
8/21/2019 Using BMC Performance Perceiver-V5-20141128_0503
http://slidepdf.com/reader/full/using-bmc-performance-perceiver-v5-201411280503 79/245
Using BMC Performance Perceiver BMC Software Confidential
BMC Capacity Optimization 9.5 Page of79 245
1.
2.
3.
4.
5.
6.
a.
b.
c.
7.
8.
5.4.6 Recovering Runs
The list of manager runs displayed in this page is obtained from the exception reports generated on the selected
remote console. Discrete statistics for collect,transfer and processing operations are provided along with database
population information.
To check and recover runs
Navigate to > .General Manager Console Operations
Click .Recover Runs
Under Recover Manager Runs, click the tab.Summary
To filter the list of runs, select a , , or, in the , type a string, and thenConsole Manager Run Manager Run Filter
click the filter icon.
You can include wildcard expressions (for example: , , , , and so on) in thetest* t* *st test?1 Manager Run
, which is case-sensitive.FilterTo sort the list of runs, click one of the following table column headers: , , ,Run Name Run Date Status Console
, or .Last Recovered
To view detailed status, and completion information on recovered runs, click the tab. In the Detail tab,Detail
you can click the values in the following columns to view more information or to perform other operations
Run Name: Click the run name to modify run properties.
Populate Status: Click on the status to open a pop-up window and view more information about it. The
status can be OK, WARNING, or ERROR.
Exception Report: Click View to open the exception report in a pop-up window.
Select one or more runs.
Click .Recover
5.4.7 Configuring Console
The Console Configuration page displays the following information about the selected console:
Operating System: Name of the Operating System the selected console is running.
Console Version: Current version of the console.
The following image shows an example of the Console Configuration page.
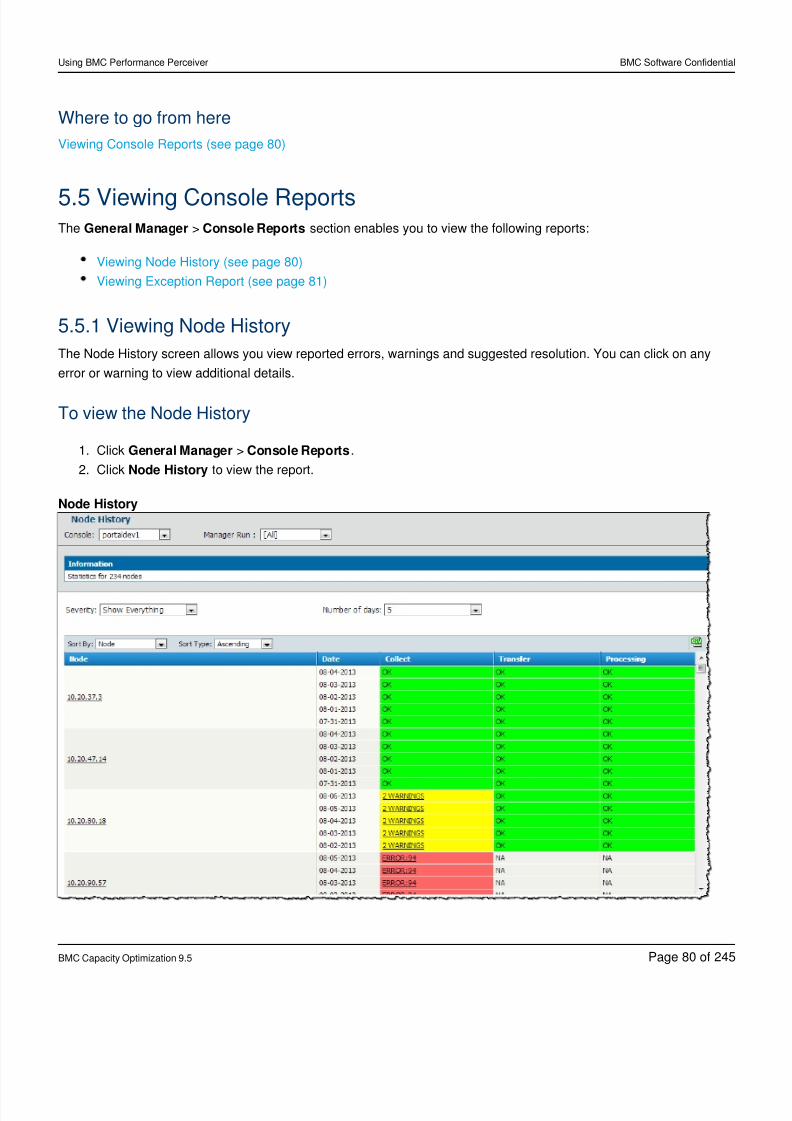
8/21/2019 Using BMC Performance Perceiver-V5-20141128_0503
http://slidepdf.com/reader/full/using-bmc-performance-perceiver-v5-201411280503 80/245
Using BMC Performance Perceiver BMC Software Confidential
BMC Capacity Optimization 9.5 Page of80 245
1.
2.
Where to go from here
Viewing Console Reports (see page 80)
5.5 Viewing Console ReportsThe > section enables you to view the following reports:General Manager Console Reports
Viewing Node History (see page 80)
Viewing Exception Report (see page 81)
5.5.1 Viewing Node History
The Node History screen allows you view reported errors, warnings and suggested resolution. You can click on any
error or warning to view additional details.
To view the Node History
Click > .General Manager Console Reports
Click to view the report.Node History
Node History
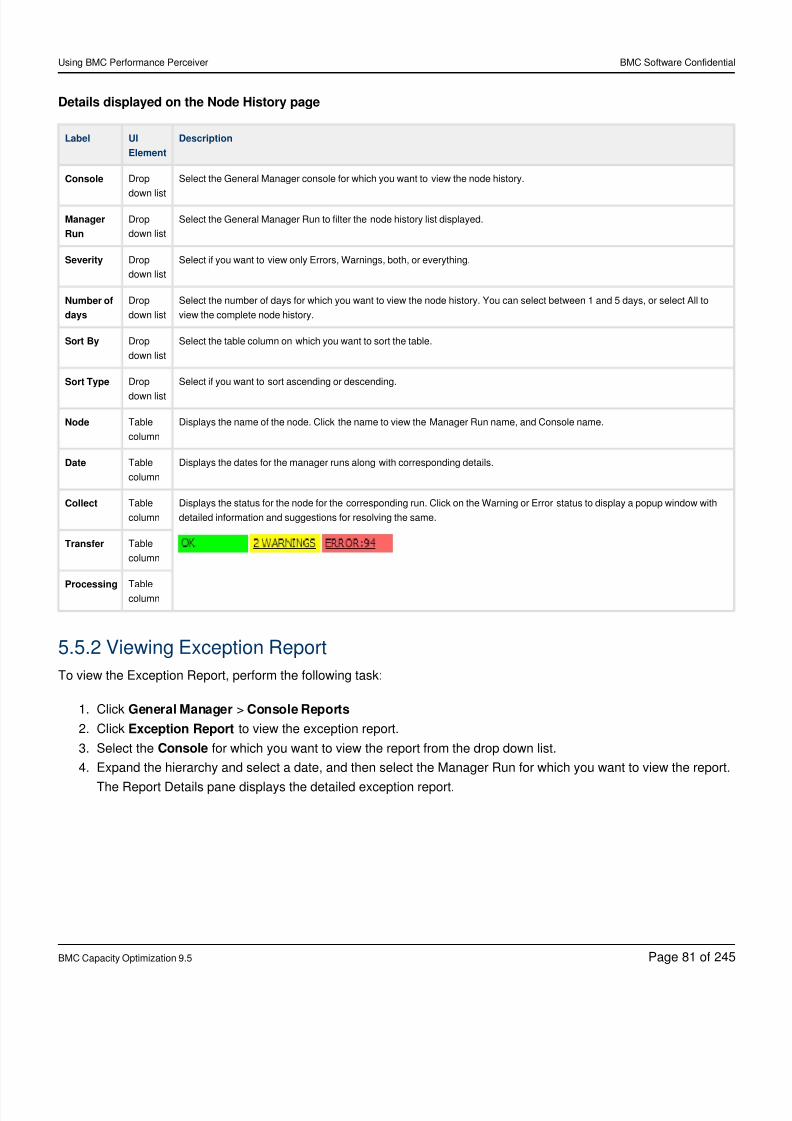
8/21/2019 Using BMC Performance Perceiver-V5-20141128_0503
http://slidepdf.com/reader/full/using-bmc-performance-perceiver-v5-201411280503 81/245
Using BMC Performance Perceiver BMC Software Confidential
BMC Capacity Optimization 9.5 Page of81 245
1.
2.
3.
4.
Details displayed on the Node History page
Label UI
Element
Description
Console Drop
down list
Select the General Manager console for which you want to view the node history.
Manager
Run
Drop
down list
Select the General Manager Run to filter the node history list displayed.
Severity Drop
down list
Select if you want to view only Errors, Warnings, both, or everything.
Number of
days
Drop
down list
Select the number of days for which you want to view the node history. You can select between 1 and 5 days, or select All to
view the complete node history.
Sort By Drop
down list
Select the table column on which you want to sort the table.
Sort Type Drop
down list
Select if you want to sort ascending or descending.
Node Table
column
Displays the name of the node. Click the name to view the Manager Run name, and Console name.
Date Table
column
Displays the dates for the manager runs along with corresponding details.
Collect Table
column
Displays the status for the node for the corresponding run. Click on the Warning or Error status to display a popup window with
detailed information and suggestions for resolving the same.
Transfer Table
column
Processing Tablecolumn
5.5.2 Viewing Exception Report
To view the Exception Report, perform the following task:
Click >General Manager Console Reports
Click to view the exception report.Exception Report
Select the for which you want to view the report from the drop down list.Console
Expand the hierarchy and select a date, and then select the Manager Run for which you want to view the report.
The Report Details pane displays the detailed exception report.
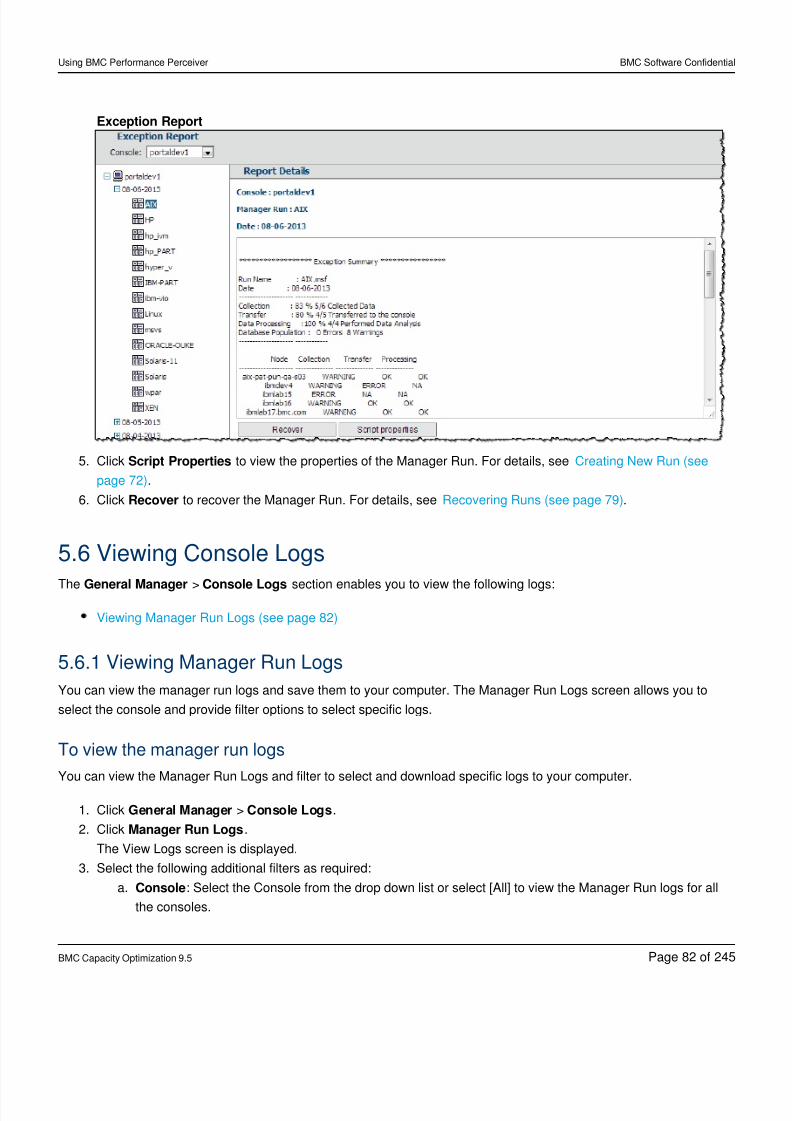
8/21/2019 Using BMC Performance Perceiver-V5-20141128_0503
http://slidepdf.com/reader/full/using-bmc-performance-perceiver-v5-201411280503 82/245
Using BMC Performance Perceiver BMC Software Confidential
BMC Capacity Optimization 9.5 Page of82 245
5.
6.
1.
2.
3.
a.
Exception Report
Click to view the properties of the Manager Run. For details, seeScript Properties Creating New Run (see
.page 72)
Click to recover the Manager Run. For details, see .Recover Recovering Runs (see page 79)
5.6 Viewing Console Logs
The > section enables you to view the following logs:General Manager Console Logs
Viewing Manager Run Logs (see page 82)
5.6.1 Viewing Manager Run Logs
You can view the manager run logs and save them to your computer. The Manager Run Logs screen allows you to
select the console and provide filter options to select specific logs.
To view the manager run logs
You can view the Manager Run Logs and filter to select and download specific logs to your computer.
Click > .General Manager Console Logs
Click .Manager Run Logs
The View Logs screen is displayed.
Select the following additional filters as required:
Console: Select the Console from the drop down list or select [All] to view the Manager Run logs for all
the consoles.
8/21/2019 Using BMC Performance Perceiver-V5-20141128_0503
http://slidepdf.com/reader/full/using-bmc-performance-perceiver-v5-201411280503 83/245
Using BMC Performance Perceiver BMC Software Confidential
BMC Capacity Optimization 9.5 Page of83 245
b.
c.
d.
4.
5.
1.
2.
3.
4.
5.
Manager Run: Select the Manager Run to view specific logs.
Manager Run Filter: Type a Manager Run name or wildcard expression such as .*win
Date Filter: Select a date from the drop down list to view logs for Manager Runs for a specific date.
Click the name of the Manager Run to view the properties of the Manager Run. For details, see Creating New
.Run (see page 72)
Click to view the run log for the corresponding Manager Run in a popup window.view
Click to download the log to your computer.Save
5.7 Setting General Manager PreferencesThe section enables you to set the following preferences.There are two types ofGeneral Manager > Preferences
logs available:
General Manager Server
General Manager Client
5.7.1 To view the server logs
General Manager Server logs are located on the computer where the BMC Performance Perceiver console is installed.
The logs are available at $BCO_HOME/local/manager/consoleName-GeneralManager.log
5.7.2 To view the client logs
You can view the General Manager Client logs and specify the amount of information to be collected by specifying the
logging level.
Click > .General Manager Preferences
Click .Settings
Click to view the log file.View Log File
Click or to change the application logging level.Low High
Click .Save
8/21/2019 Using BMC Performance Perceiver-V5-20141128_0503
http://slidepdf.com/reader/full/using-bmc-performance-perceiver-v5-201411280503 84/245
Using BMC Performance Perceiver BMC Software Confidential
BMC Capacity Optimization 9.5 Page of84 245
1.
2.
3.
4.
5.
6 Using views and reportsFor information about views and reports in BMC Performance Perceiver, see:
Using Perceiver views (see page 84)
Predefined Perceiver views (see page 86)
Predefined Perceiver views by category (see page 104)
Custom Perceiver views (see page 193)
Common Perceiver metrics (see page 208)
Common Perceiver views (see page 216)
Understanding a Server Sizing report (see page 233)
6.1 Using Perceiver viewsBMC Performance Perceiver views enable you to view key metric and resource usage data in a wide variety of formats
, including charts, histograms, and ranking tables. Though the data is varied, much of the functionality used to view
and drill down on the data is the same.
6.1.1 Navigating views categories
The Views tab in the task pane displays view categories in bold. They are high-level logical groupings of the views you
see in the results pane. You can select a view category by clicking it.
The following steps are the basic procedure for accessing views:
Select a group from the list to view data for a predefined group of computers or VMs.Group
Select a computer or VM from the list to view data for a single computer.Computer
Note
By default, the width of the menu is fixed at approximately 20 characters. If your group namesGroup
are longer than 20 characters, and you need to see them at full length, see What if the Group menu is
.not wide enough?
Click at the top of the view to create a group of computers or VMs.
Select a date or time range from the list, or click the button, to define a time frame for theTime Calendar
displayed data.
For a user scenario that details this process, see .Managing physical systems in the data center (see page 11)
Click to toggle between zoom view (zooms in on the chart, histogram, or ranking table) and main view.
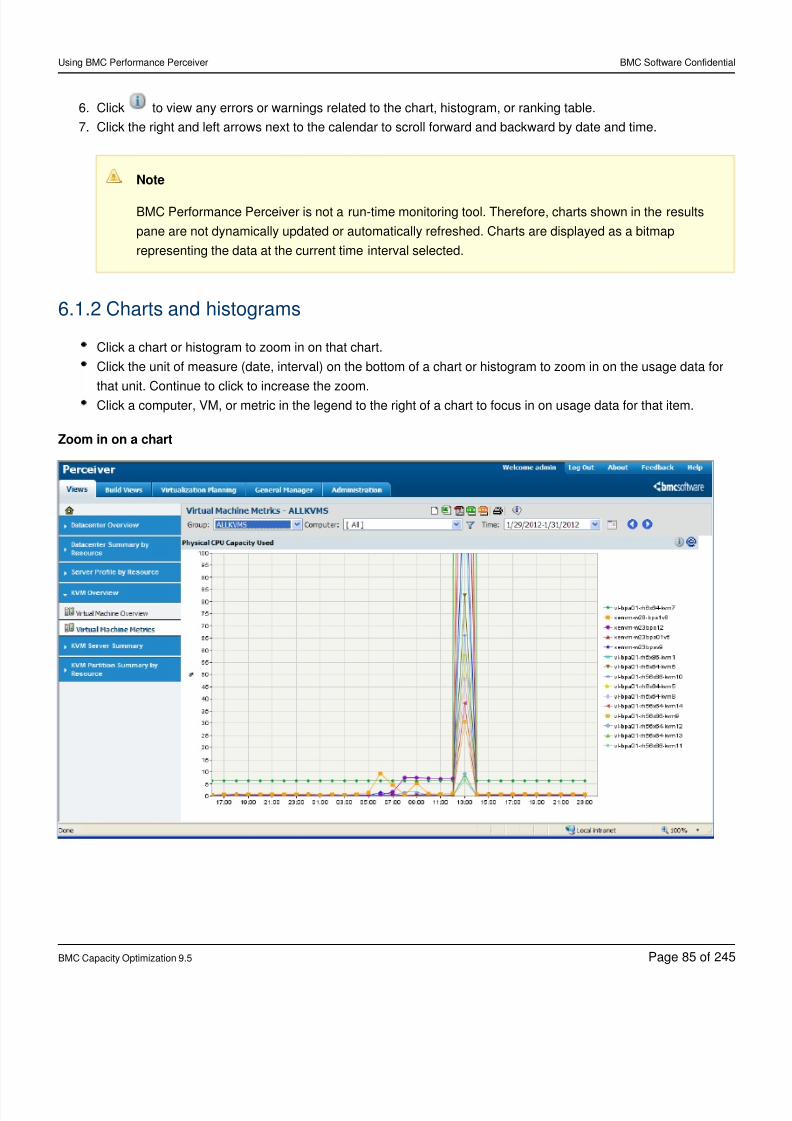
8/21/2019 Using BMC Performance Perceiver-V5-20141128_0503
http://slidepdf.com/reader/full/using-bmc-performance-perceiver-v5-201411280503 85/245
Using BMC Performance Perceiver BMC Software Confidential
BMC Capacity Optimization 9.5 Page of85 245
6.
7.
Click to view any errors or warnings related to the chart, histogram, or ranking table.
Click the right and left arrows next to the calendar to scroll forward and backward by date and time.
Note
BMC Performance Perceiver is not a run-time monitoring tool. Therefore, charts shown in the results
pane are not dynamically updated or automatically refreshed. Charts are displayed as a bitmap
representing the data at the current time interval selected.
6.1.2 Charts and histograms
Click a chart or histogram to zoom in on that chart.
Click the unit of measure (date, interval) on the bottom of a chart or histogram to zoom in on the usage data for
that unit. Continue to click to increase the zoom.Click a computer, VM, or metric in the legend to the right of a chart to focus in on usage data for that item.
Zoom in on a chart
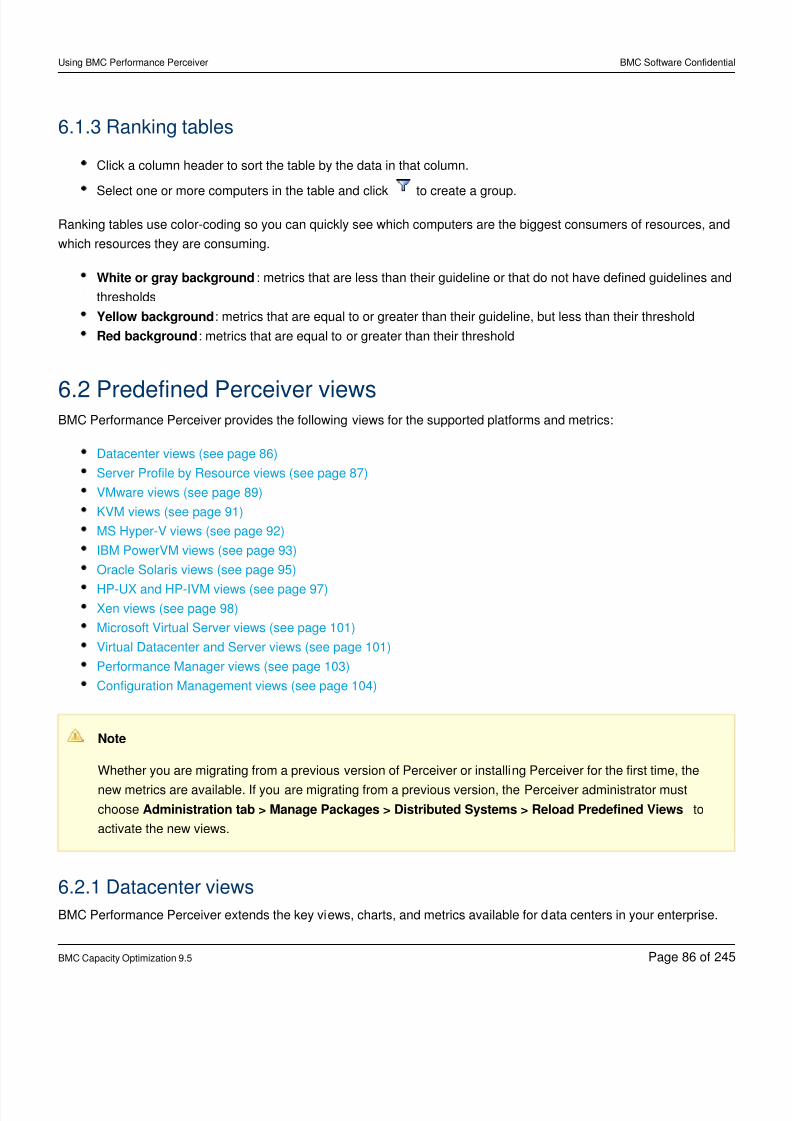
8/21/2019 Using BMC Performance Perceiver-V5-20141128_0503
http://slidepdf.com/reader/full/using-bmc-performance-perceiver-v5-201411280503 86/245
Using BMC Performance Perceiver BMC Software Confidential
BMC Capacity Optimization 9.5 Page of86 245
6.1.3 Ranking tables
Click a column header to sort the table by the data in that column.
Select one or more computers in the table and click to create a group.
Ranking tables use color-coding so you can quickly see which computers are the biggest consumers of resources, and
which resources they are consuming.
White or gray background: metrics that are less than their guideline or that do not have defined guidelines and
thresholds
Yellow background: metrics that are equal to or greater than their guideline, but less than their threshold
Red background: metrics that are equal to or greater than their threshold
6.2 Predefined Perceiver viewsBMC Performance Perceiver provides the following views for the supported platforms and metrics:
Datacenter views (see page 86)
Server Profile by Resource views (see page 87)
VMware views (see page 89)
KVM views (see page 91)
MS Hyper-V views (see page 92)
IBM PowerVM views (see page 93)
Oracle Solaris views (see page 95)
HP-UX and HP-IVM views (see page 97)Xen views (see page 98)
Microsoft Virtual Server views (see page 101)
Virtual Datacenter and Server views (see page 101)
Performance Manager views (see page 103)
Configuration Management views (see page 104)
Note
Whether you are migrating from a previous version of Perceiver or installing Perceiver for the first time, the
new metrics are available. If you are migrating from a previous version, the Perceiver administrator must
choose toAdministration tab > Manage Packages > Distributed Systems > Reload Predefined Views
activate the new views.
6.2.1 Datacenter views
BMC Performance Perceiver extends the key views, charts, and metrics available for data centers in your enterprise.
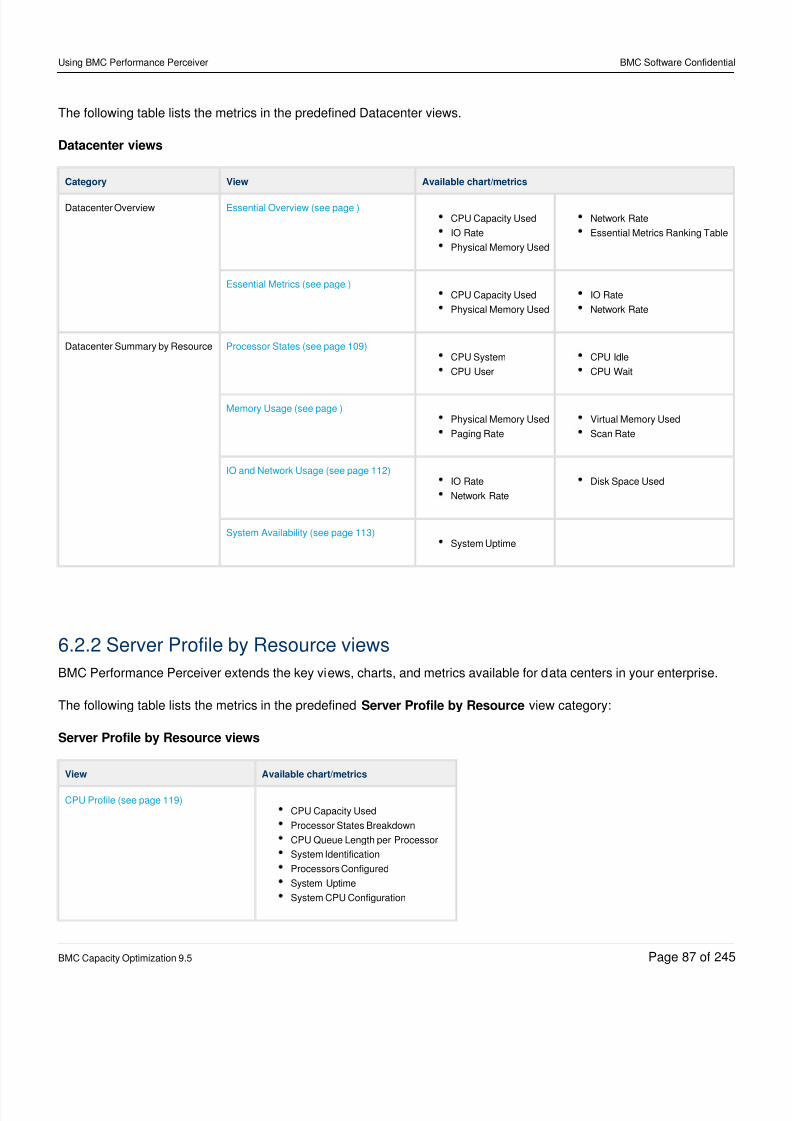
8/21/2019 Using BMC Performance Perceiver-V5-20141128_0503
http://slidepdf.com/reader/full/using-bmc-performance-perceiver-v5-201411280503 87/245
Using BMC Performance Perceiver BMC Software Confidential
BMC Capacity Optimization 9.5 Page of87 245
The following table lists the metrics in the predefined Datacenter views.
Datacenter views
Category View Available chart/metrics
Datacenter Overview Essential Overview (see page )CPU Capacity Used
IO Rate
Physical Memory Used
Network Rate
Essential Metrics Ranking Table
Essential Metrics (see page )CPU Capacity Used
Physical Memory Used
IO Rate
Network Rate
Datacenter Summary by Resource Processor States (see page 109)CPU System
CPU User
CPU Idle
CPU Wait
Memory Usage (see page )Physical Memory Used
Paging Rate
Virtual Memory Used
Scan Rate
IO and Network Usage (see page 112)IO Rate
Network Rate
Disk Space Used
System Availability (see page 113)System Uptime
6.2.2 Server Profile by Resource views
BMC Performance Perceiver extends the key views, charts, and metrics available for data centers in your enterprise.
The following table lists the metrics in the predefined view category:Server Profile by Resource
Server Profile by Resource views
View Available chart/metrics
CPU Profile (see page 119)CPU Capacity Used
Processor States Breakdown
CPU Queue Length per Processor
System Identification
Processors Configured
System Uptime
System CPU Configuration
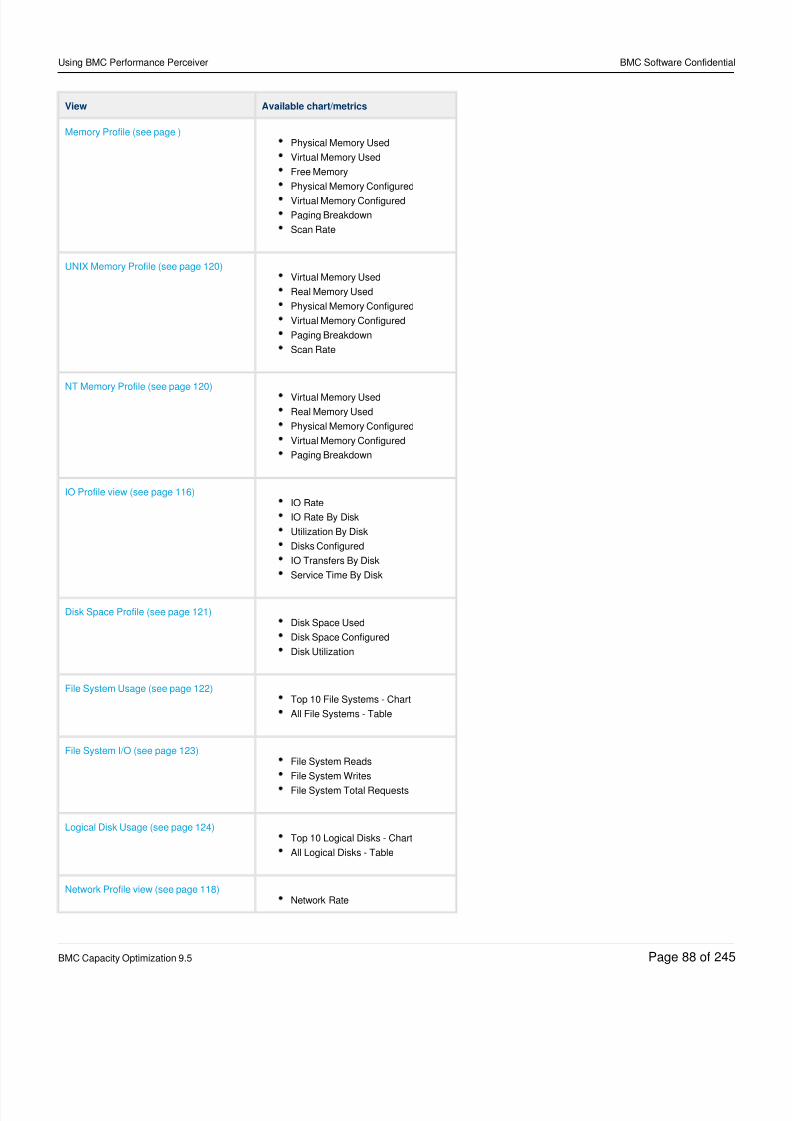
8/21/2019 Using BMC Performance Perceiver-V5-20141128_0503
http://slidepdf.com/reader/full/using-bmc-performance-perceiver-v5-201411280503 88/245
Using BMC Performance Perceiver BMC Software Confidential
BMC Capacity Optimization 9.5 Page of88 245
View Available chart/metrics
Memory Profile (see page )Physical Memory Used
Virtual Memory Used
Free Memory
Physical Memory Configured
Virtual Memory Configured
Paging Breakdown
Scan Rate
UNIX Memory Profile (see page 120)Virtual Memory Used
Real Memory Used
Physical Memory Configured
Virtual Memory Configured
Paging Breakdown
Scan Rate
NT Memory Profile (see page 120)Virtual Memory Used
Real Memory Used
Physical Memory Configured
Virtual Memory Configured
Paging Breakdown
IO Profile view (see page 116)IO Rate
IO Rate By Disk
Utilization By Disk
Disks Configured
IO Transfers By Disk
Service Time By Disk
Disk Space Profile (see page 121)Disk Space Used
Disk Space Configured
Disk Utilization
File System Usage (see page 122)Top 10 File Systems - Chart
All File Systems - Table
File System I/O (see page 123)File System Reads
File System Writes
File System Total Requests
Logical Disk Usage (see page 124)Top 10 Logical Disks - Chart
All Logical Disks - Table
Network Profile view (see page 118)Network Rate
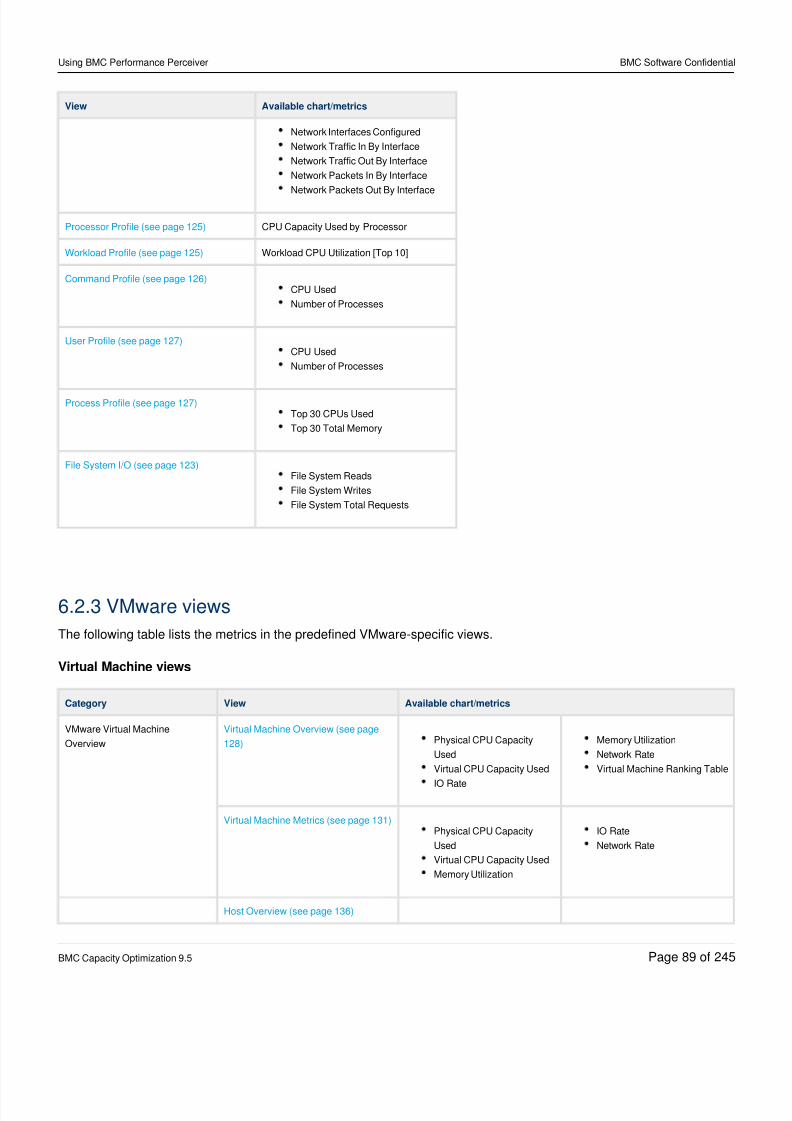
8/21/2019 Using BMC Performance Perceiver-V5-20141128_0503
http://slidepdf.com/reader/full/using-bmc-performance-perceiver-v5-201411280503 89/245
Using BMC Performance Perceiver BMC Software Confidential
BMC Capacity Optimization 9.5 Page of89 245
View Available chart/metrics
Network Interfaces Configured
Network Traffic In By Interface
Network Traffic Out By Interface
Network Packets In By Interface
Network Packets Out By Interface
Processor Profile (see page 125) CPU Capacity Used by Processor
Workload Profile (see page 125) Workload CPU Utilization [Top 10]
Command Profile (see page 126)CPU Used
Number of Processes
User Profile (see page 127)CPU Used
Number of Processes
Process Profile (see page 127)Top 30 CPUs Used
Top 30 Total Memory
File System I/O (see page 123)File System Reads
File System Writes
File System Total Requests
6.2.3 VMware views
The following table lists the metrics in the predefined VMware-specific views.
Virtual Machine views
Category View Available chart/metrics
VMware Virtual Machine
Overview
Virtual Machine Overview (see page
128) Physical CPU Capacity
Used
Virtual CPU Capacity Used
IO Rate
Memory Utilization
Network Rate
Virtual Machine Ranking Table
Virtual Machine Metrics (see page 131)Physical CPU Capacity
Used
Virtual CPU Capacity Used
Memory Utilization
IO Rate
Network Rate
Host Overview (see page 136)
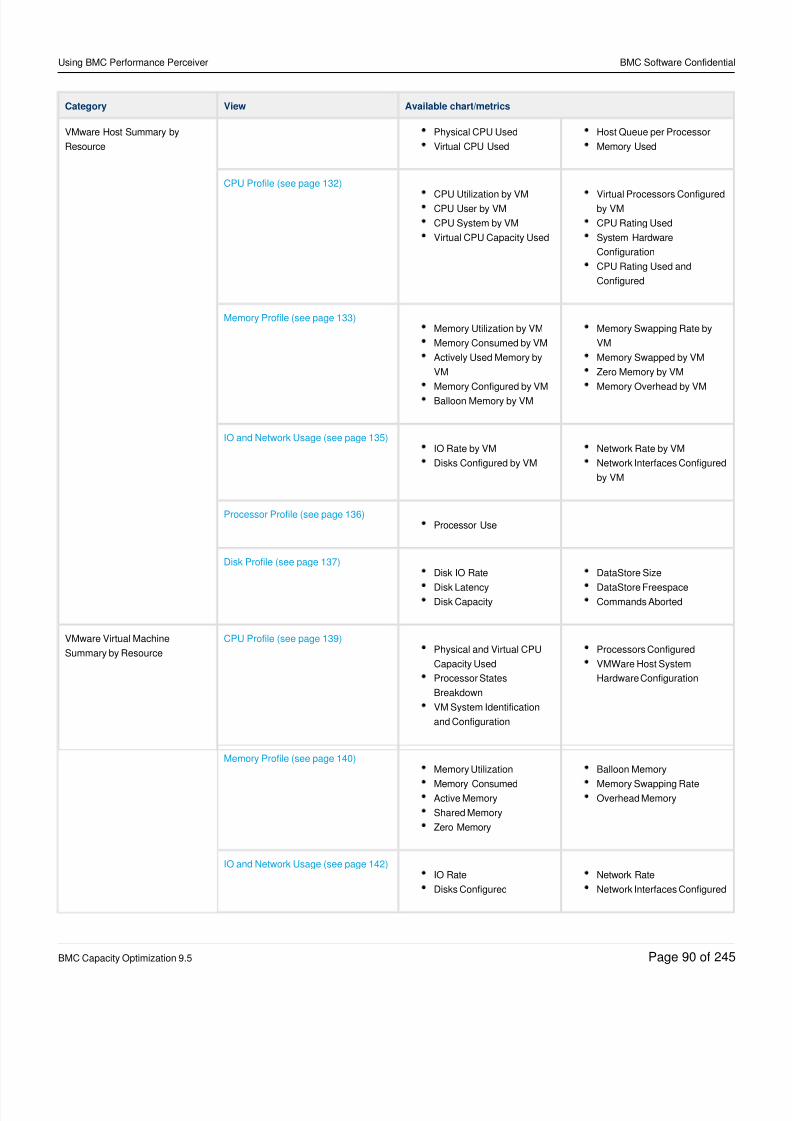
8/21/2019 Using BMC Performance Perceiver-V5-20141128_0503
http://slidepdf.com/reader/full/using-bmc-performance-perceiver-v5-201411280503 90/245
Using BMC Performance Perceiver BMC Software Confidential
BMC Capacity Optimization 9.5 Page of90 245
Category View Available chart/metrics
VMware Host Summary by
Resource
Physical CPU Used
Virtual CPU Used
Host Queue per Processor
Memory Used
CPU Profile (see page 132)
CPU Utilization by VMCPU User by VM
CPU System by VM
Virtual CPU Capacity Used
Virtual Processors Configuredby VM
CPU Rating Used
System Hardware
Configuration
CPU Rating Used and
Configured
Memory Profile (see page 133)Memory Utilization by VM
Memory Consumed by VM
Actively Used Memory by
VM
Memory Configured by VM
Balloon Memory by VM
Memory Swapping Rate by
VM
Memory Swapped by VM
Zero Memory by VM
Memory Overhead by VM
IO and Network Usage (see page 135)IO Rate by VM
Disks Configured by VM
Network Rate by VM
Network Interfaces Configured
by VM
Processor Profile (see page 136)Processor Use
Disk Profile (see page 137)Disk IO Rate
Disk LatencyDisk Capacity
DataStore Size
DataStore FreespaceCommands Aborted
VMware Virtual Machine
Summary by Resource
CPU Profile (see page 139)Physical and Virtual CPU
Capacity Used
Processor States
Breakdown
VM System Identification
and Configuration
Processors Configured
VMWare Host System
Hardware Configuration
Memory Profile (see page 140)Memory Utilization
Memory ConsumedActive Memory
Shared Memory
Zero Memory
Balloon Memory
Memory Swapping RateOverhead Memory
IO and Network Usage (see page 142)IO Rate
Disks Configured
Network Rate
Network Interfaces Configured
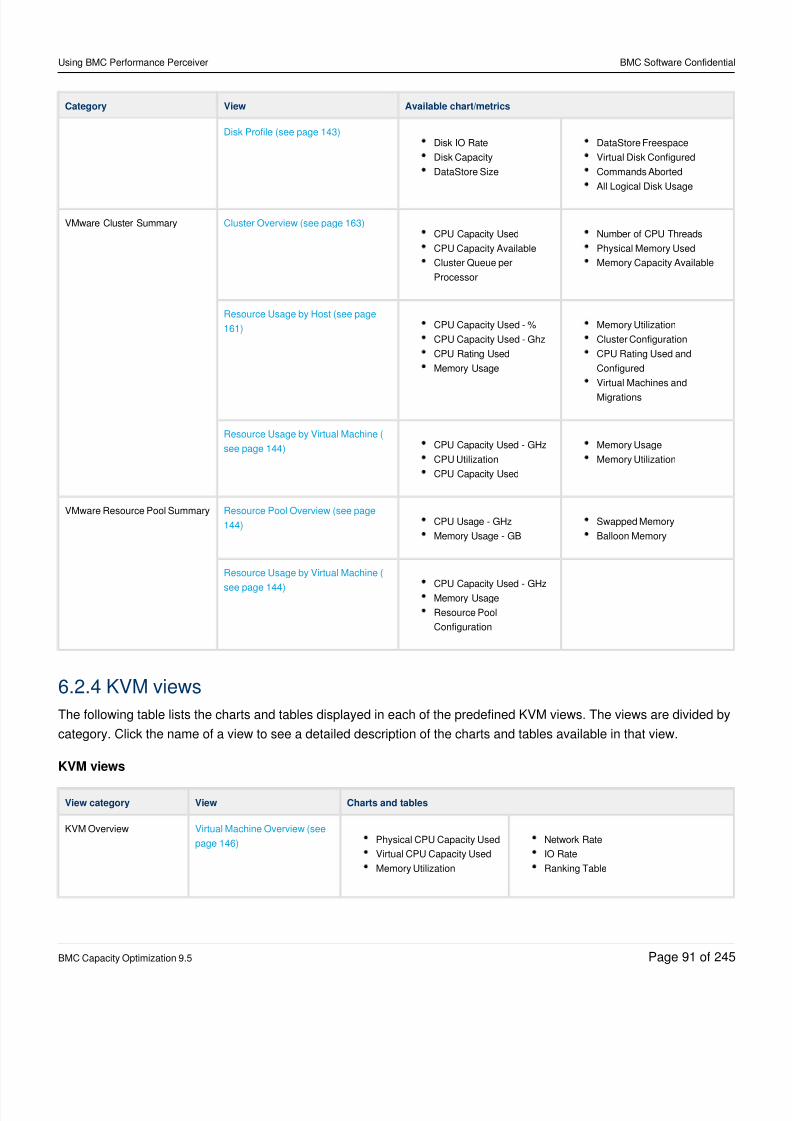
8/21/2019 Using BMC Performance Perceiver-V5-20141128_0503
http://slidepdf.com/reader/full/using-bmc-performance-perceiver-v5-201411280503 91/245
Using BMC Performance Perceiver BMC Software Confidential
BMC Capacity Optimization 9.5 Page of91 245
Category View Available chart/metrics
Disk Profile (see page 143)Disk IO Rate
Disk Capacity
DataStore Size
DataStore Freespace
Virtual Disk Configured
Commands Aborted
All Logical Disk Usage
VMware Cluster Summary Cluster Overview (see page 163)CPU Capacity Used
CPU Capacity Available
Cluster Queue per
Processor
Number of CPU Threads
Physical Memory Used
Memory Capacity Available
Resource Usage by Host (see page
161) CPU Capacity Used - %
CPU Capacity Used - Ghz
CPU Rating Used
Memory Usage
Memory Utilization
Cluster Configuration
CPU Rating Used and
Configured
Virtual Machines and
Migrations
Resource Usage by Virtual Machine (
see page 144) CPU Capacity Used - GHz
CPU Utilization
CPU Capacity Used
Memory Usage
Memory Utilization
VMware Resource Pool Summary Resource Pool Overview (see page
144) CPU Usage - GHz
Memory Usage - GB
Swapped Memory
Balloon Memory
Resource Usage by Virtual Machine (
see page 144)CPU Capacity Used - GHz
Memory Usage
Resource Pool
Configuration
6.2.4 KVM views
The following table lists the charts and tables displayed in each of the predefined KVM views. The views are divided by
category. Click the name of a view to see a detailed description of the charts and tables available in that view.
KVM views
View category View Charts and tables
KVM Overview Virtual Machine Overview (see
page 146) Physical CPU Capacity Used
Virtual CPU Capacity Used
Memory Utilization
Network Rate
IO Rate
Ranking Table
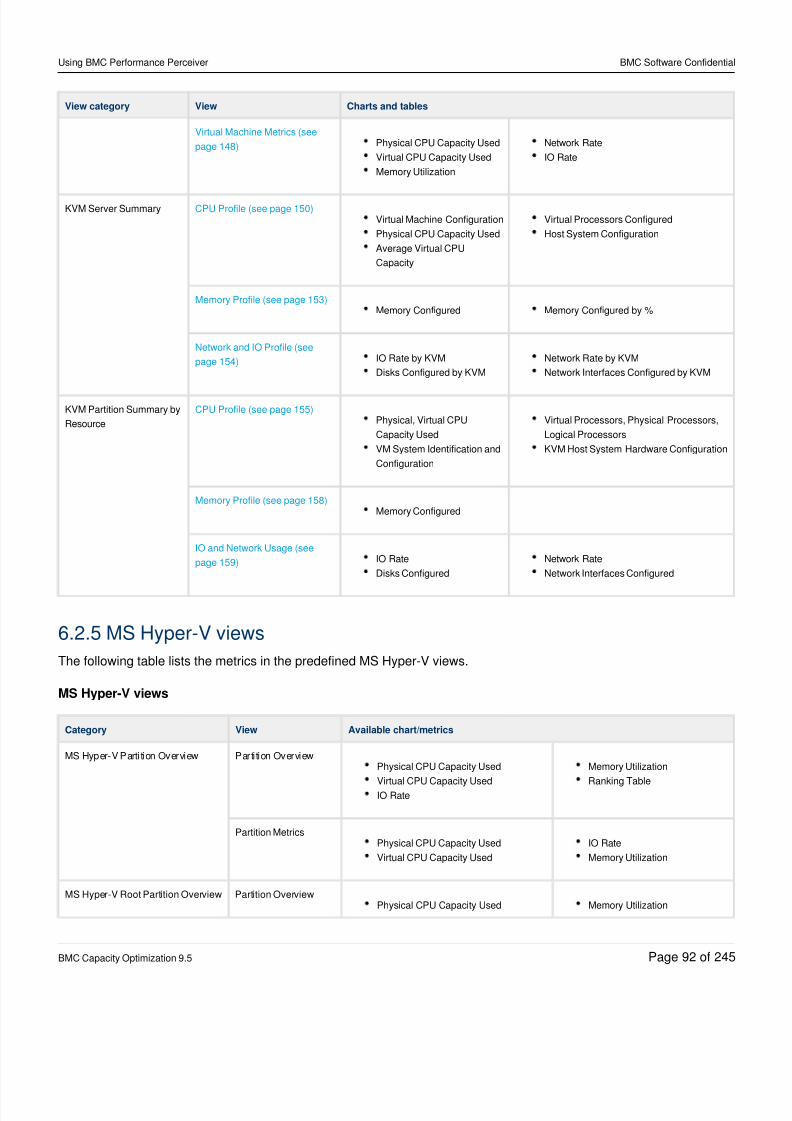
8/21/2019 Using BMC Performance Perceiver-V5-20141128_0503
http://slidepdf.com/reader/full/using-bmc-performance-perceiver-v5-201411280503 92/245
Using BMC Performance Perceiver BMC Software Confidential
BMC Capacity Optimization 9.5 Page of92 245
View category View Charts and tables
Virtual Machine Metrics (see
page 148) Physical CPU Capacity Used
Virtual CPU Capacity Used
Memory Utilization
Network Rate
IO Rate
KVM Server Summary CPU Profile (see page 150)Virtual Machine Configuration
Physical CPU Capacity Used
Average Virtual CPU
Capacity
Virtual Processors Configured
Host System Configuration
Memory Profile (see page 153)Memory Configured Memory Configured by %
Network and IO Profile (see
page 154) IO Rate by KVM
Disks Configured by KVM
Network Rate by KVM
Network Interfaces Configured by KVM
KVM Partition Summary by
Resource
CPU Profile (see page 155)Physical, Virtual CPU
Capacity Used
VM System Identification and
Configuration
Virtual Processors, Physical Processors,
Logical Processors
KVM Host System Hardware Configuration
Memory Profile (see page 158)Memory Configured
IO and Network Usage (see
page 159) IO Rate
Disks Configured
Network Rate
Network Interfaces Configured
6.2.5 MS Hyper-V views
The following table lists the metrics in the predefined MS Hyper-V views.
MS Hyper-V views
Category View Available chart/metrics
MS Hyper-V Partition Overview Partition OverviewPhysical CPU Capacity Used
Virtual CPU Capacity UsedIO Rate
Memory Utilization
Ranking Table
Partition MetricsPhysical CPU Capacity Used
Virtual CPU Capacity Used
IO Rate
Memory Utilization
MS Hyper-V Root Partition Overview Partition OverviewPhysical CPU Capacity Used Memory Utilization
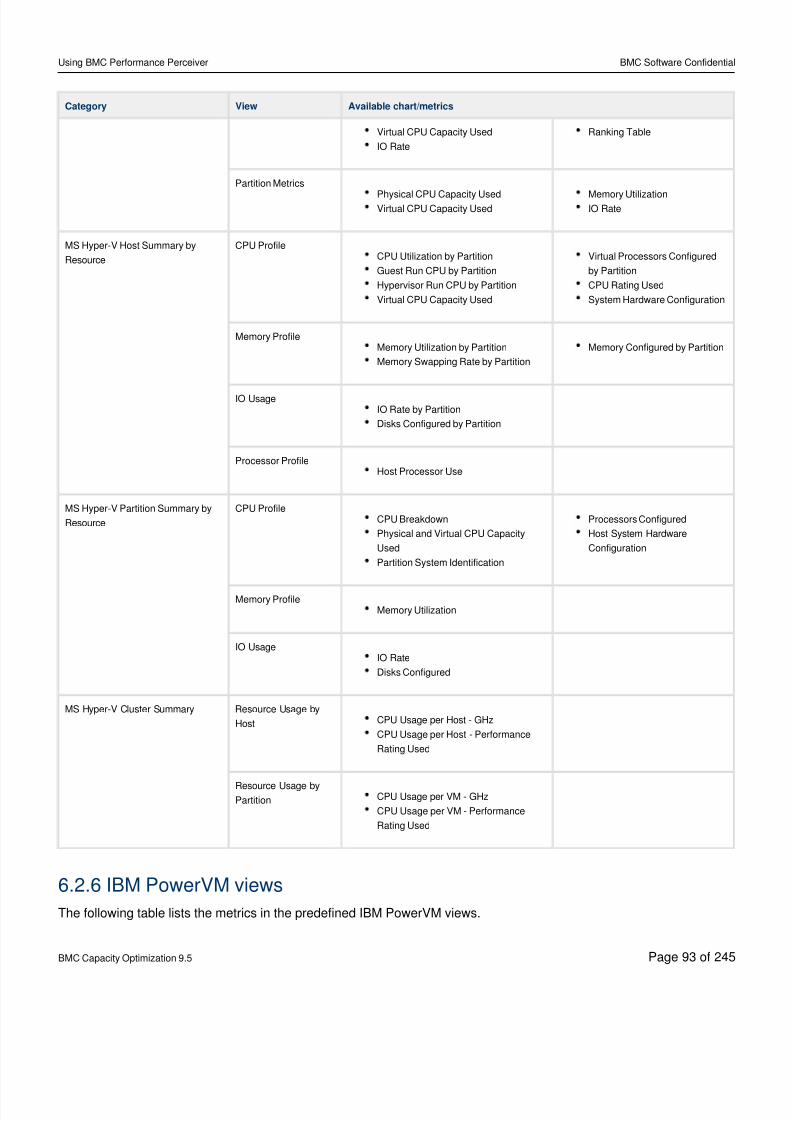
8/21/2019 Using BMC Performance Perceiver-V5-20141128_0503
http://slidepdf.com/reader/full/using-bmc-performance-perceiver-v5-201411280503 93/245
Using BMC Performance Perceiver BMC Software Confidential
BMC Capacity Optimization 9.5 Page of93 245
Category View Available chart/metrics
Virtual CPU Capacity Used
IO Rate
Ranking Table
Partition Metrics
Physical CPU Capacity UsedVirtual CPU Capacity Used
Memory UtilizationIO Rate
MS Hyper-V Host Summary by
Resource
CPU ProfileCPU Utilization by Partition
Guest Run CPU by Partition
Hypervisor Run CPU by Partition
Virtual CPU Capacity Used
Virtual Processors Configured
by Partition
CPU Rating Used
System Hardware Configuration
Memory ProfileMemory Utilization by Partition
Memory Swapping Rate by Partition
Memory Configured by Partition
IO UsageIO Rate by Partition
Disks Configured by Partition
Processor ProfileHost Processor Use
MS Hyper-V Partition Summary by
Resource
CPU ProfileCPU Breakdown
Physical and Virtual CPU Capacity
Used
Partition System Identification
Processors Configured
Host System Hardware
Configuration
Memory ProfileMemory Utilization
IO UsageIO Rate
Disks Configured
MS Hyper-V Cluster Summary Resource Usage by
Host CPU Usage per Host - GHz
CPU Usage per Host - Performance
Rating Used
Resource Usage byPartition CPU Usage per VM - GHz
CPU Usage per VM - Performance
Rating Used
6.2.6 IBM PowerVM views
The following table lists the metrics in the predefined IBM PowerVM views.
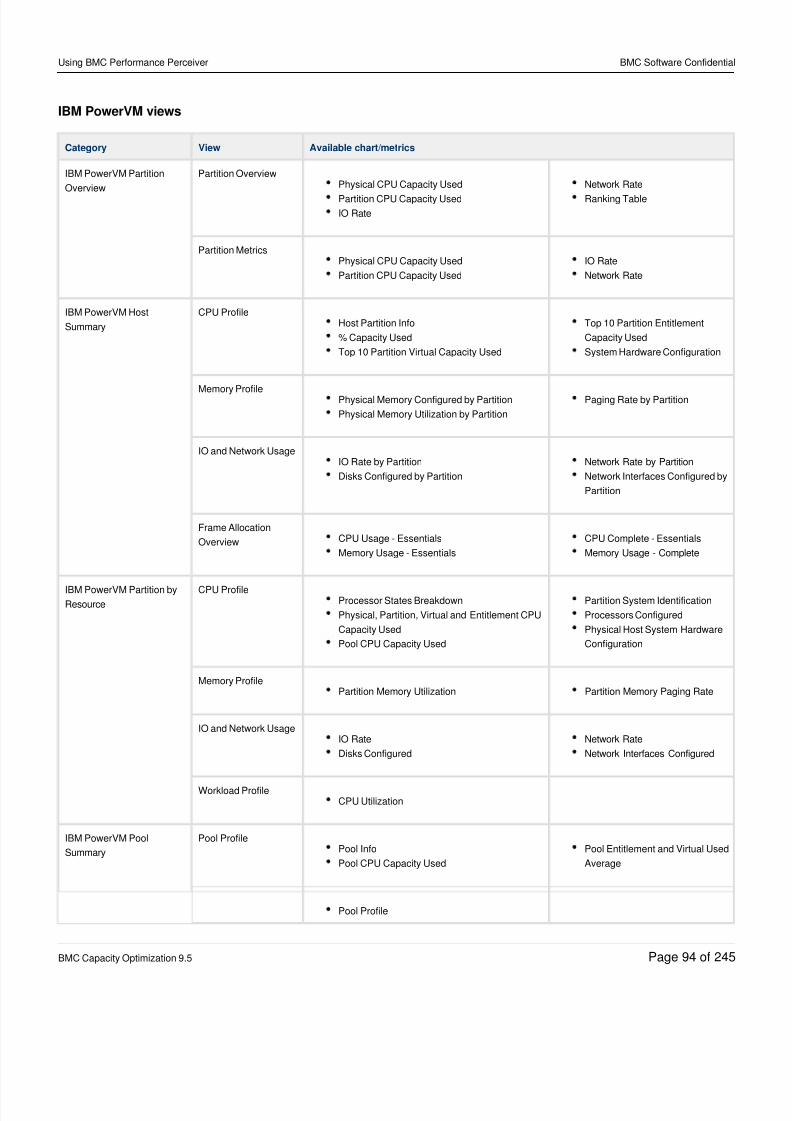
8/21/2019 Using BMC Performance Perceiver-V5-20141128_0503
http://slidepdf.com/reader/full/using-bmc-performance-perceiver-v5-201411280503 94/245
Using BMC Performance Perceiver BMC Software Confidential
BMC Capacity Optimization 9.5 Page of94 245
IBM PowerVM views
Category View Available chart/metrics
IBM PowerVM Partition
Overview
Partition OverviewPhysical CPU Capacity Used
Partition CPU Capacity Used
IO Rate
Network Rate
Ranking Table
Partition MetricsPhysical CPU Capacity Used
Partition CPU Capacity Used
IO Rate
Network Rate
IBM PowerVM Host
Summary
CPU ProfileHost Partition Info
% Capacity Used
Top 10 Partition Virtual Capacity Used
Top 10 Partition Entitlement
Capacity Used
System Hardware Configuration
Memory Profile Physical Memory Configured by Partition
Physical Memory Utilization by Partition
Paging Rate by Partition
IO and Network UsageIO Rate by Partition
Disks Configured by Partition
Network Rate by Partition
Network Interfaces Configured by
Partition
Frame Allocation
Overview CPU Usage - Essentials
Memory Usage - Essentials
CPU Complete - Essentials
Memory Usage - Complete
IBM PowerVM Partition byResource
CPU ProfileProcessor States Breakdown
Physical, Partition, Virtual and Entitlement CPU
Capacity Used
Pool CPU Capacity Used
Partition System Identification
Processors Configured
Physical Host System Hardware
Configuration
Memory ProfilePartition Memory Utilization Partition Memory Paging Rate
IO and Network UsageIO Rate
Disks Configured
Network Rate
Network Interfaces Configured
Workload ProfileCPU Utilization
IBM PowerVM Pool
Summary
Pool ProfilePool Info
Pool CPU Capacity Used
Pool Entitlement and Virtual Used
Average
Pool Profile
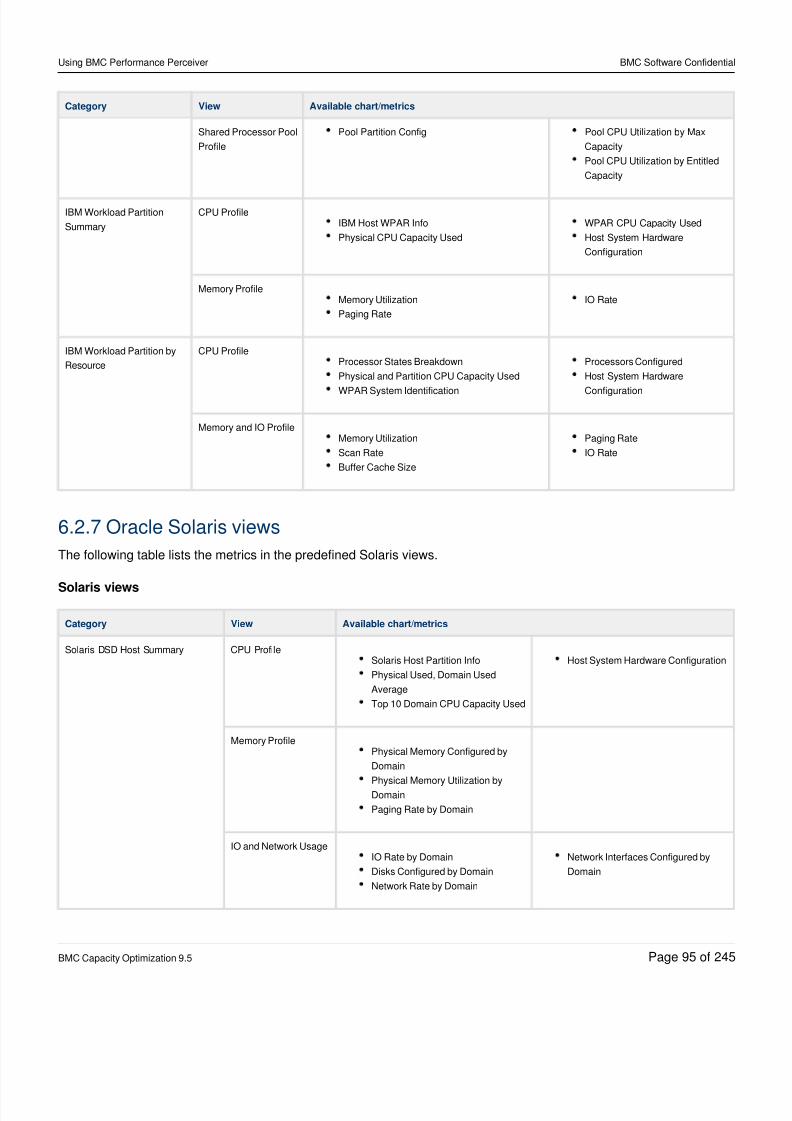
8/21/2019 Using BMC Performance Perceiver-V5-20141128_0503
http://slidepdf.com/reader/full/using-bmc-performance-perceiver-v5-201411280503 95/245
Using BMC Performance Perceiver BMC Software Confidential
BMC Capacity Optimization 9.5 Page of95 245
Category View Available chart/metrics
Shared Processor Pool
Profile
Pool Partition Config Pool CPU Utilization by Max
Capacity
Pool CPU Utilization by Entitled
Capacity
IBM Workload Partition
Summary
CPU ProfileIBM Host WPAR Info
Physical CPU Capacity Used
WPAR CPU Capacity Used
Host System Hardware
Configuration
Memory ProfileMemory Utilization
Paging Rate
IO Rate
IBM Workload Partition by
Resource
CPU ProfileProcessor States Breakdown
Physical and Partition CPU Capacity Used
WPAR System Identification
Processors Configured
Host System Hardware
Configuration
Memory and IO ProfileMemory Utilization
Scan Rate
Buffer Cache Size
Paging Rate
IO Rate
6.2.7 Oracle Solaris views
The following table lists the metrics in the predefined Solaris views.
Solaris views
Category View Available chart/metrics
Solaris DSD Host Summary CPU ProfileSolaris Host Partition Info
Physical Used, Domain Used
Average
Top 10 Domain CPU Capacity Used
Host System Hardware Configuration
Memory ProfilePhysical Memory Configured by
Domain
Physical Memory Utilization byDomain
Paging Rate by Domain
IO and Network UsageIO Rate by Domain
Disks Configured by Domain
Network Rate by Domain
Network Interfaces Configured by
Domain
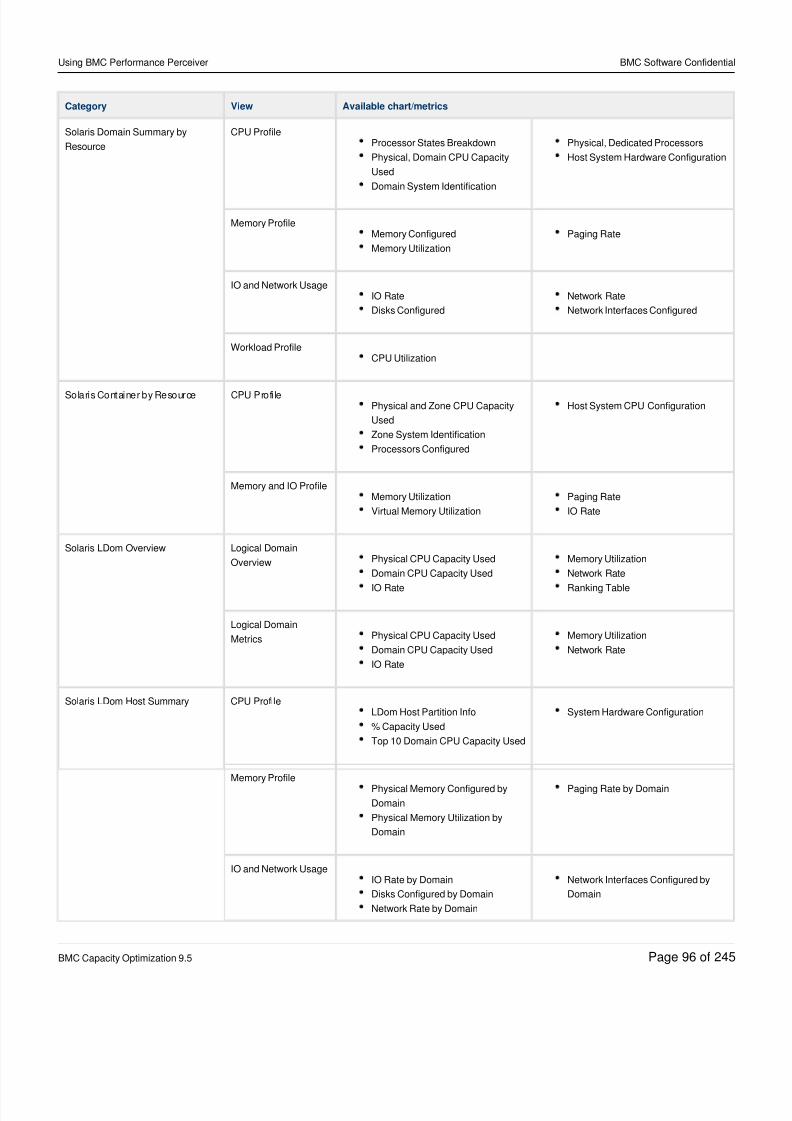
8/21/2019 Using BMC Performance Perceiver-V5-20141128_0503
http://slidepdf.com/reader/full/using-bmc-performance-perceiver-v5-201411280503 96/245
Using BMC Performance Perceiver BMC Software Confidential
BMC Capacity Optimization 9.5 Page of96 245
Category View Available chart/metrics
Solaris Domain Summary by
Resource
CPU ProfileProcessor States Breakdown
Physical, Domain CPU Capacity
Used
Domain System Identification
Physical, Dedicated Processors
Host System Hardware Configuration
Memory ProfileMemory Configured
Memory Utilization
Paging Rate
IO and Network UsageIO Rate
Disks Configured
Network Rate
Network Interfaces Configured
Workload ProfileCPU Utilization
Solaris Container by Resource CPU Profi lePhysical and Zone CPU Capacity
Used
Zone System Identification
Processors Configured
Host System CPU Configuration
Memory and IO ProfileMemory Utilization
Virtual Memory Utilization
Paging Rate
IO Rate
Solaris LDom Overview Logical Domain
Overview Physical CPU Capacity Used
Domain CPU Capacity Used
IO Rate
Memory Utilization
Network Rate
Ranking Table
Logical Domain
Metrics Physical CPU Capacity Used
Domain CPU Capacity Used
IO Rate
Memory Utilization
Network Rate
Solaris LDom Host Summary CPU ProfileLDom Host Partition Info
% Capacity Used
Top 10 Domain CPU Capacity Used
System Hardware Configuration
Memory Profile
Physical Memory Configured by
Domain
Physical Memory Utilization by
Domain
Paging Rate by Domain
IO and Network UsageIO Rate by Domain
Disks Configured by Domain
Network Rate by Domain
Network Interfaces Configured by
Domain

8/21/2019 Using BMC Performance Perceiver-V5-20141128_0503
http://slidepdf.com/reader/full/using-bmc-performance-perceiver-v5-201411280503 97/245
Using BMC Performance Perceiver BMC Software Confidential
BMC Capacity Optimization 9.5 Page of97 245
Solaris LDom Summary by
Resource
CPU ProfileProcessor States Breakdown
Physical, Domain CPU Capacity
Used
Domain System Identification
Processors Configured
Host System Hardware Configuration
Memory ProfileMemory Utilization
Memory Paging Rate
IO and Network UsageIO Rate
Disks Configured
Network Rate
Network Interfaces Configured
Workload ProfileCPU Utilization
Solaris Container Summary CPU ProfileHost Solaris Zones Info
Physical CPU Capacity Used
Zone CPU Capacity Used
Host System Hardware Configuration
Memory ProfileMemory Utilization
Paging Rate
IO Rate
6.2.8 HP-UX and HP-IVM views
The following table lists the metrics in the predefined HP-UX and HP-IVM views.
HP-UX and HP-IVM views
Category View Available chart/metrics
HP UX Parti tion Overview Partition OverviewPhysical CPU Capacity Used
Partition CPU Capacity Used
IO Rate
Memory Utilization
Network Rate
Ranking Table
Partition Metrics
Physical CPU Capacity UsedPartition CPU Capacity Used
IO Rate
Memory UtilizationNetwork Rate
HP UX Host Summary CPU ProfileHP-UX Partition Info
% Physical Used Total and % Dedicated
Used Average
Top 10 Partition CPU Capacity
Used
System Hardware Configuration
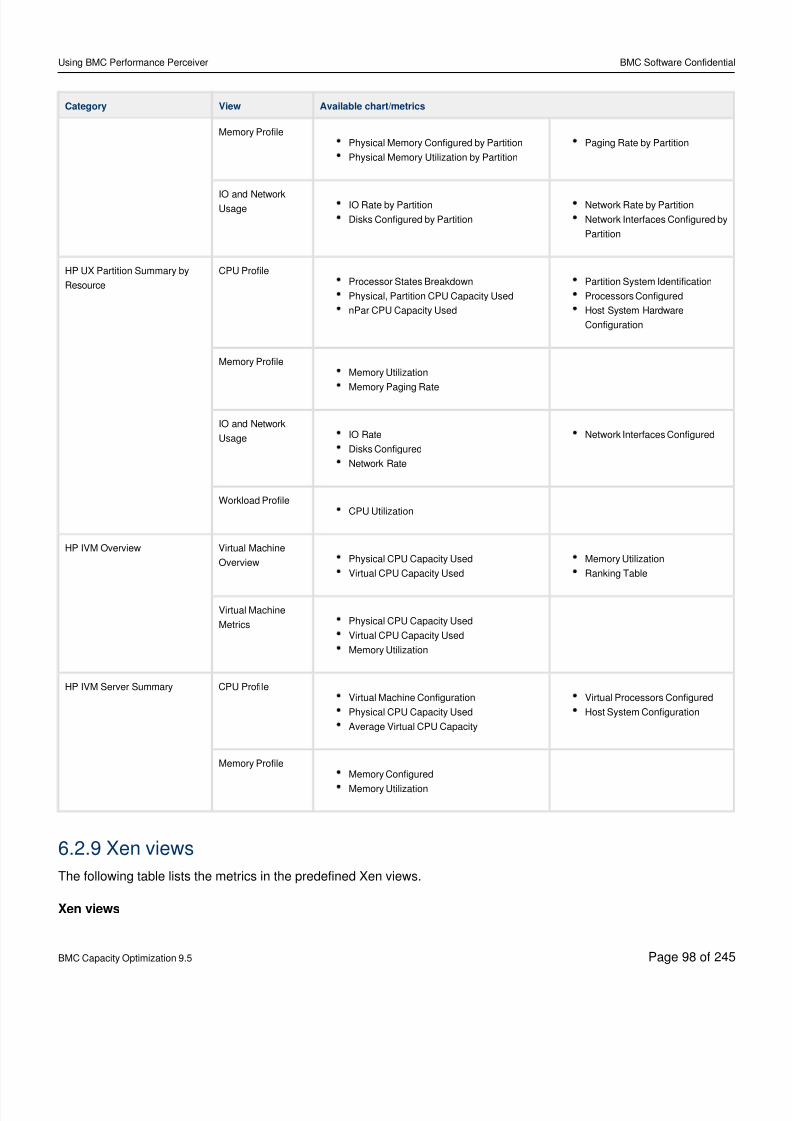
8/21/2019 Using BMC Performance Perceiver-V5-20141128_0503
http://slidepdf.com/reader/full/using-bmc-performance-perceiver-v5-201411280503 98/245
Using BMC Performance Perceiver BMC Software Confidential
BMC Capacity Optimization 9.5 Page of98 245
Category View Available chart/metrics
Memory ProfilePhysical Memory Configured by Partition
Physical Memory Utilization by Partition
Paging Rate by Partition
IO and NetworkUsage IO Rate by Partition
Disks Configured by Partition
Network Rate by Partition
Network Interfaces Configured by
Partition
HP UX Partition Summary by
Resource
CPU ProfileProcessor States Breakdown
Physical, Partition CPU Capacity Used
nPar CPU Capacity Used
Partition System Identification
Processors Configured
Host System Hardware
Configuration
Memory ProfileMemory Utilization
Memory Paging Rate
IO and Network
Usage IO Rate
Disks Configured
Network Rate
Network Interfaces Configured
Workload ProfileCPU Utilization
HP IVM Overview Virtual Machine
Overview Physical CPU Capacity Used
Virtual CPU Capacity Used
Memory Utilization
Ranking Table
Virtual Machine
Metrics Physical CPU Capacity Used
Virtual CPU Capacity Used
Memory Utilization
HP IVM Server Summary CPU ProfileVirtual Machine Configuration
Physical CPU Capacity Used
Average Virtual CPU Capacity
Virtual Processors Configured
Host System Configuration
Memory ProfileMemory Configured
Memory Utilization
6.2.9 Xen views
The following table lists the metrics in the predefined Xen views.
Xen views
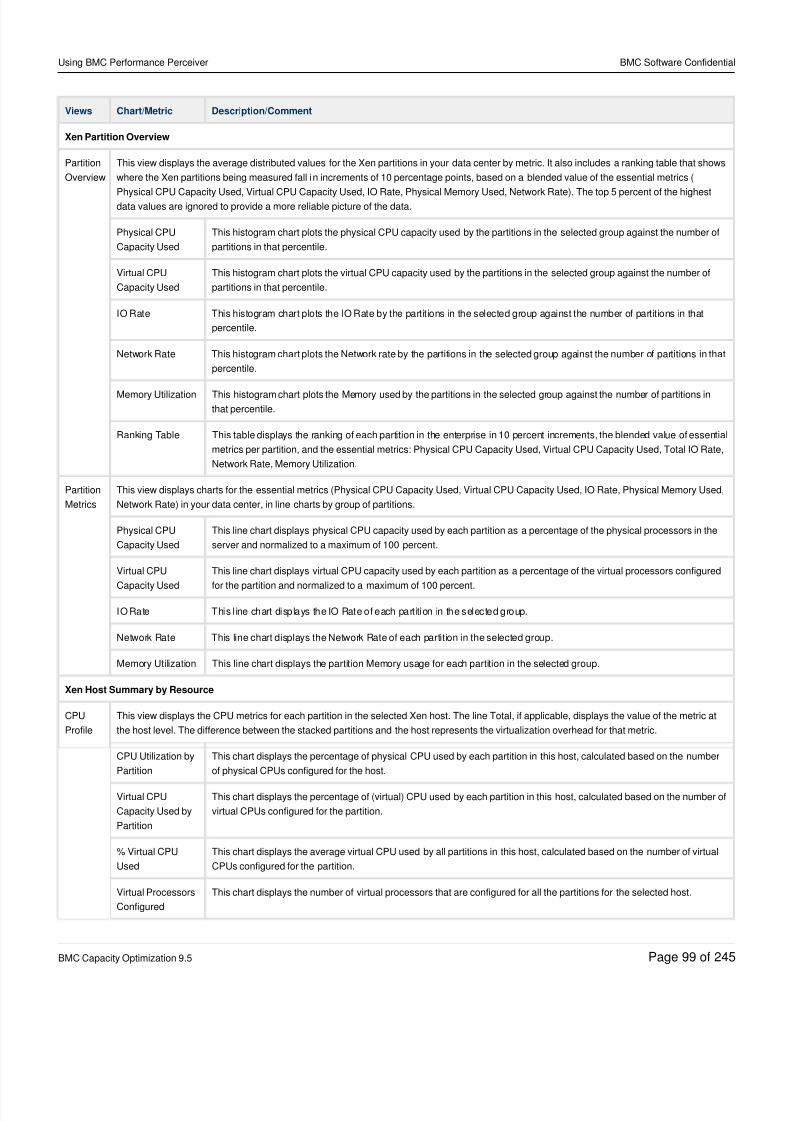
8/21/2019 Using BMC Performance Perceiver-V5-20141128_0503
http://slidepdf.com/reader/full/using-bmc-performance-perceiver-v5-201411280503 99/245
Using BMC Performance Perceiver BMC Software Confidential
BMC Capacity Optimization 9.5 Page of99 245
Views Chart/Metric Description/Comment
Xen Partition Overview
Partition
Overview
This view displays the average distributed values for the Xen partitions in your data center by metric. It also includes a ranking table that shows
where the Xen partitions being measured fall in increments of 10 percentage points, based on a blended value of the essential metrics (
Physical CPU Capacity Used, Virtual CPU Capacity Used, IO Rate, Physical Memory Used, Network Rate). The top 5 percent of the highestdata values are ignored to provide a more reliable picture of the data.
Physical CPU
Capacity Used
This histogram chart plots the physical CPU capacity used by the partitions in the selected group against the number of
partitions in that percentile.
Virtual CPU
Capacity Used
This histogram chart plots the virtual CPU capacity used by the partitions in the selected group against the number of
partitions in that percentile.
IO Rate This histogram chart plots the IO Rate by the partitions in the selected group against the number of partitions in that
percentile.
Network Rate This histogram chart plots the Network rate by the partitions in the selected group against the number of partitions in that
percentile.
Memory Utilization This histogram chart plots the Memory used by the partitions in the selected group against the number of partitions in
that percentile.
Ranking Table This table displays the ranking of each partition in the enterprise in 10 percent increments, the blended value of essential
metrics per partition, and the essential metrics: Physical CPU Capacity Used, Virtual CPU Capacity Used, Total IO Rate,
Network Rate, Memory Utilization.
Partition
Metrics
This view displays charts for the essential metrics (Physical CPU Capacity Used, Virtual CPU Capacity Used, IO Rate, Physical Memory Used,
Network Rate) in your data center, in line charts by group of partitions.
Physical CPU
Capacity Used
This line chart displays physical CPU capacity used by each partition as a percentage of the physical processors in the
server and normalized to a maximum of 100 percent.
Virtual CPU
Capacity Used
This line chart displays virtual CPU capacity used by each partition as a percentage of the virtual processors configured
for the partition and normalized to a maximum of 100 percent.
IO Rate This l ine chart displays the IO Rate of each part ition in the selected group.
Network Rate This line chart displays the Network Rate of each partition in the selected group.
Memory Utilization This line chart displays the partition Memory usage for each partition in the selected group.
Xen Host Summary by Resource
CPU
Profile
This view displays the CPU metrics for each partition in the selected Xen host. The line Total, if applicable, displays the value of the metric at
the host level. The difference between the stacked partitions and the host represents the virtualization overhead for that metric.
CPU Utilization by
Partition
This chart displays the percentage of physical CPU used by each partition in this host, calculated based on the number
of physical CPUs configured for the host.
Virtual CPU
Capacity Used by
Partition
This chart displays the percentage of (virtual) CPU used by each partition in this host, calculated based on the number of
virtual CPUs configured for the partition.
% Virtual CPU
Used
This chart displays the average virtual CPU used by all partitions in this host, calculated based on the number of virtual
CPUs configured for the partition.
Virtual Processors
Configured
This chart displays the number of virtual processors that are configured for all the partitions for the selected host.
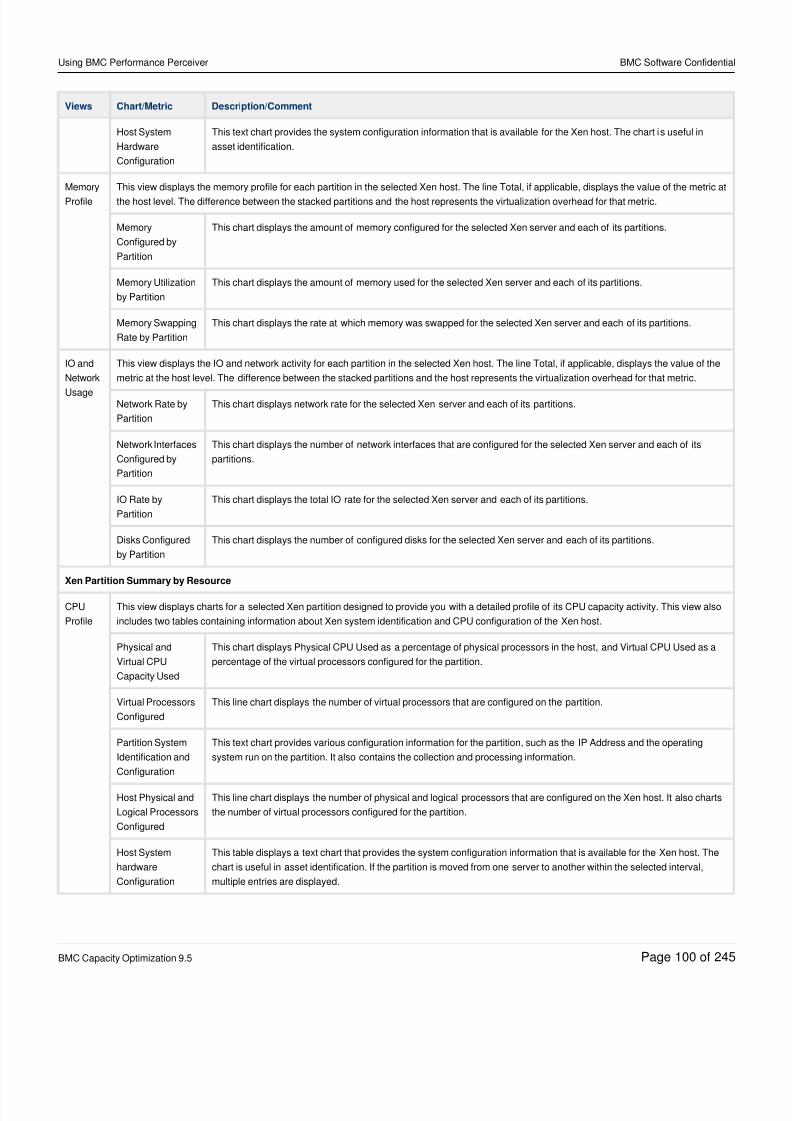
8/21/2019 Using BMC Performance Perceiver-V5-20141128_0503
http://slidepdf.com/reader/full/using-bmc-performance-perceiver-v5-201411280503 100/245
Using BMC Performance Perceiver BMC Software Confidential
BMC Capacity Optimization 9.5 Page of100 245
Views Chart/Metric Description/Comment
Host System
Hardware
Configuration
This text chart provides the system configuration information that is available for the Xen host. The chart is useful in
asset identification.
Memory
Profile
This view displays the memory profile for each partition in the selected Xen host. The line Total, if applicable, displays the value of the metric at
the host level. The difference between the stacked partitions and the host represents the virtualization overhead for that metric.
Memory
Configured by
Partition
This chart displays the amount of memory configured for the selected Xen server and each of its partitions.
Memory Utilization
by Partition
This chart displays the amount of memory used for the selected Xen server and each of its partitions.
Memory Swapping
Rate by Partition
This chart displays the rate at which memory was swapped for the selected Xen server and each of its partitions.
IO and
Network
Usage
This view displays the IO and network activity for each partition in the selected Xen host. The line Total, if applicable, displays the value of the
metric at the host level. The difference between the stacked partitions and the host represents the virtualization overhead for that metric.
Network Rate by
Partition
This chart displays network rate for the selected Xen server and each of its partitions.
Network Interfaces
Configured by
Partition
This chart displays the number of network interfaces that are configured for the selected Xen server and each of its
partitions.
IO Rate by
Partition
This chart displays the total IO rate for the selected Xen server and each of its partitions.
Disks Configured
by Partition
This chart displays the number of configured disks for the selected Xen server and each of its partitions.
Xen Partition Summary by Resource
CPU
Profile
This view displays charts for a selected Xen partition designed to provide you with a detailed profile of its CPU capacity activity. This view also
includes two tables containing information about Xen system identification and CPU configuration of the Xen host.
Physical and
Virtual CPU
Capacity Used
This chart displays Physical CPU Used as a percentage of physical processors in the host, and Virtual CPU Used as a
percentage of the virtual processors configured for the partition.
Virtual Processors
Configured
This line chart displays the number of virtual processors that are configured on the partition.
Partition System
Identification and
Configuration
This text chart provides various configuration information for the partition, such as the IP Address and the operating
system run on the partition. It also contains the collection and processing information.
Host Physical and
Logical Processors
Configured
This line chart displays the number of physical and logical processors that are configured on the Xen host. It also charts
the number of virtual processors configured for the partition.
Host System
hardware
Configuration
This table displays a text chart that provides the system configuration information that is available for the Xen host. The
chart is useful in asset identification. If the partition is moved from one server to another within the selected interval,
multiple entries are displayed.
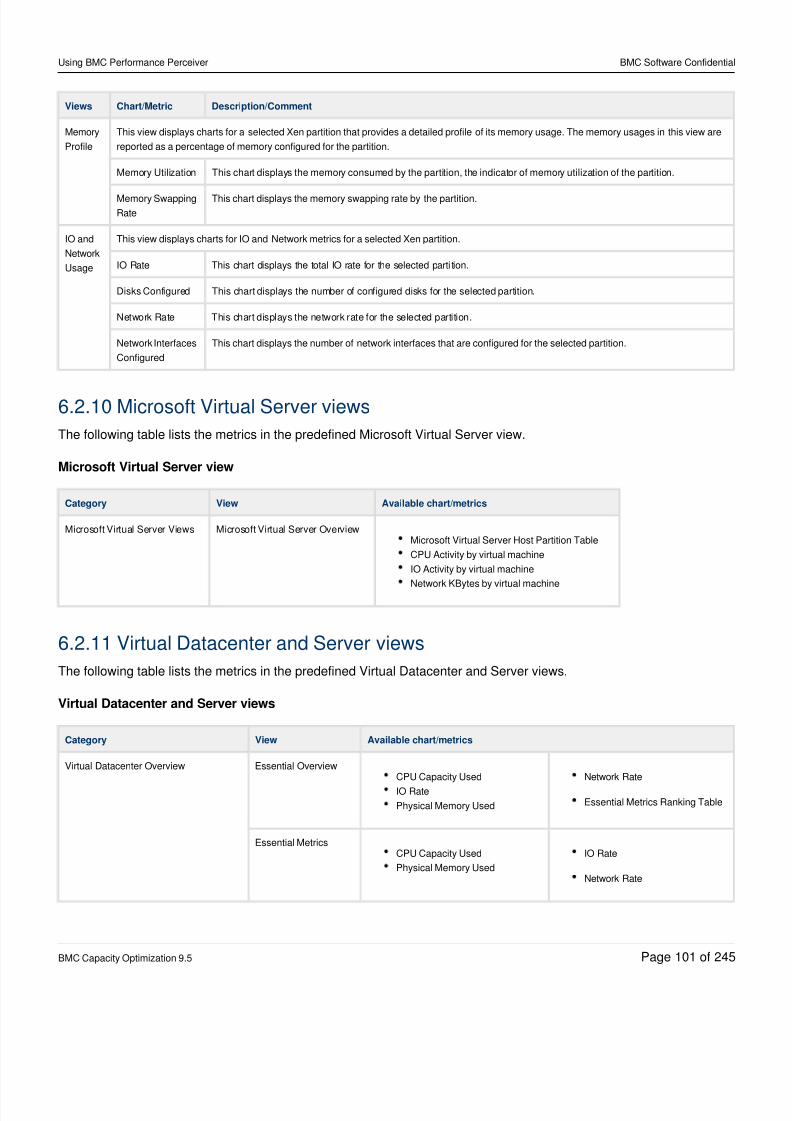
8/21/2019 Using BMC Performance Perceiver-V5-20141128_0503
http://slidepdf.com/reader/full/using-bmc-performance-perceiver-v5-201411280503 101/245
Using BMC Performance Perceiver BMC Software Confidential
BMC Capacity Optimization 9.5 Page of101 245
Views Chart/Metric Description/Comment
Memory
Profile
This view displays charts for a selected Xen partition that provides a detailed profile of its memory usage. The memory usages in this view are
reported as a percentage of memory configured for the partition.
Memory Utilization This chart displays the memory consumed by the partition, the indicator of memory utilization of the partition.
Memory Swapping
Rate
This chart displays the memory swapping rate by the partition.
IO and
Network
Usage
This view displays charts for IO and Network metrics for a selected Xen partition.
IO Rate This chart displays the total IO rate for the selected parti tion.
Disks Configured This chart displays the number of configured disks for the selected partition.
Network Rate This chart displays the network rate for the selected partition.
Network Interfaces
Configured
This chart displays the number of network interfaces that are configured for the selected partition.
6.2.10 Microsoft Virtual Server views
The following table lists the metrics in the predefined Microsoft Virtual Server view.
Microsoft Virtual Server view
Category View Available chart/metrics
Microsoft Virtual Server Views Microsoft Virtual Server OverviewMicrosoft Virtual Server Host Partition Table
CPU Activity by virtual machine
IO Activity by virtual machine
Network KBytes by virtual machine
6.2.11 Virtual Datacenter and Server views
The following table lists the metrics in the predefined Virtual Datacenter and Server views.
Virtual Datacenter and Server views
Category View Available chart/metrics
Virtual Datacenter Overview Essential OverviewCPU Capacity Used
IO Rate
Physical Memory Used
Network Rate
Essential Metrics Ranking Table
Essential MetricsCPU Capacity Used
Physical Memory Used
IO Rate
Network Rate
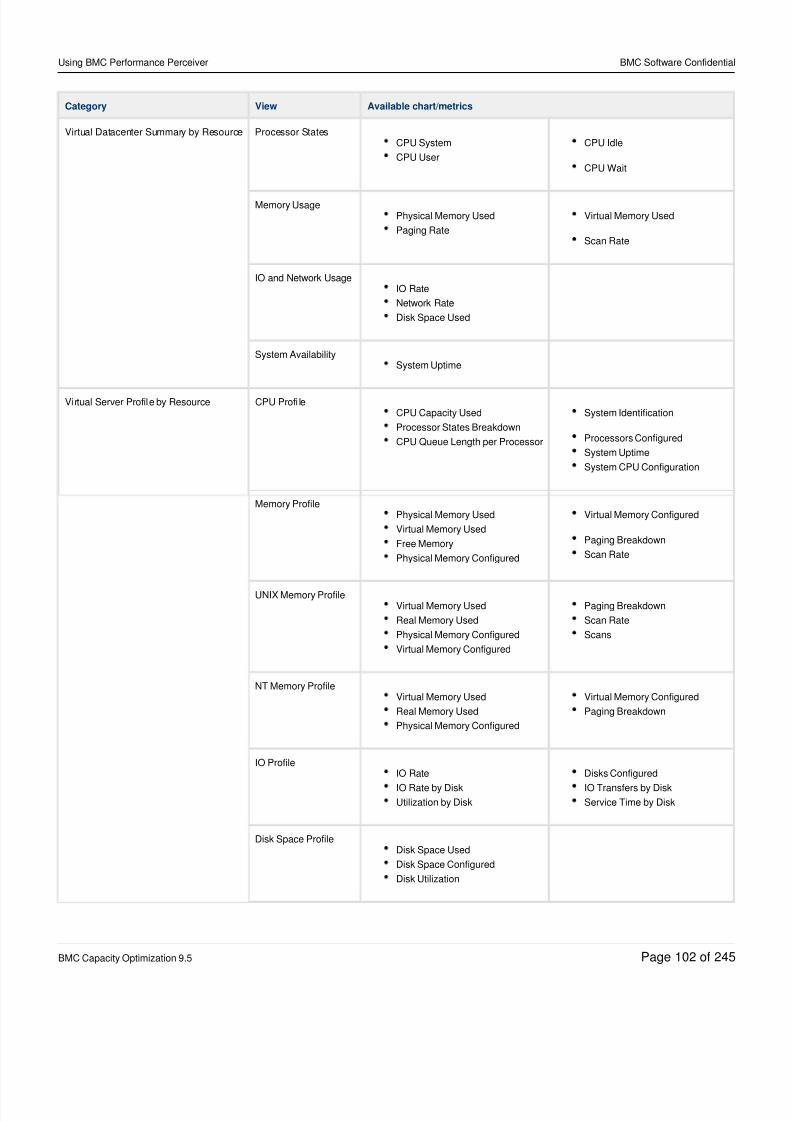
8/21/2019 Using BMC Performance Perceiver-V5-20141128_0503
http://slidepdf.com/reader/full/using-bmc-performance-perceiver-v5-201411280503 102/245
Using BMC Performance Perceiver BMC Software Confidential
BMC Capacity Optimization 9.5 Page of102 245
Category View Available chart/metrics
Virtual Datacenter Summary by Resource Processor StatesCPU System
CPU User
CPU Idle
CPU Wait
Memory UsagePhysical Memory Used
Paging Rate
Virtual Memory Used
Scan Rate
IO and Network UsageIO Rate
Network Rate
Disk Space Used
System AvailabilitySystem Uptime
Virtual Server Profile by Resource CPU Profi leCPU Capacity Used
Processor States Breakdown
CPU Queue Length per Processor
System Identification
Processors Configured
System Uptime
System CPU Configuration
Memory ProfilePhysical Memory Used
Virtual Memory Used
Free Memory
Physical Memory Configured
Virtual Memory Configured
Paging Breakdown
Scan Rate
UNIX Memory ProfileVirtual Memory Used
Real Memory Used
Physical Memory Configured
Virtual Memory Configured
Paging Breakdown
Scan Rate
Scans
NT Memory ProfileVirtual Memory Used
Real Memory Used
Physical Memory Configured
Virtual Memory Configured
Paging Breakdown
IO ProfileIO Rate
IO Rate by Disk
Utilization by Disk
Disks Configured
IO Transfers by Disk
Service Time by Disk
Disk Space ProfileDisk Space Used
Disk Space Configured
Disk Utilization
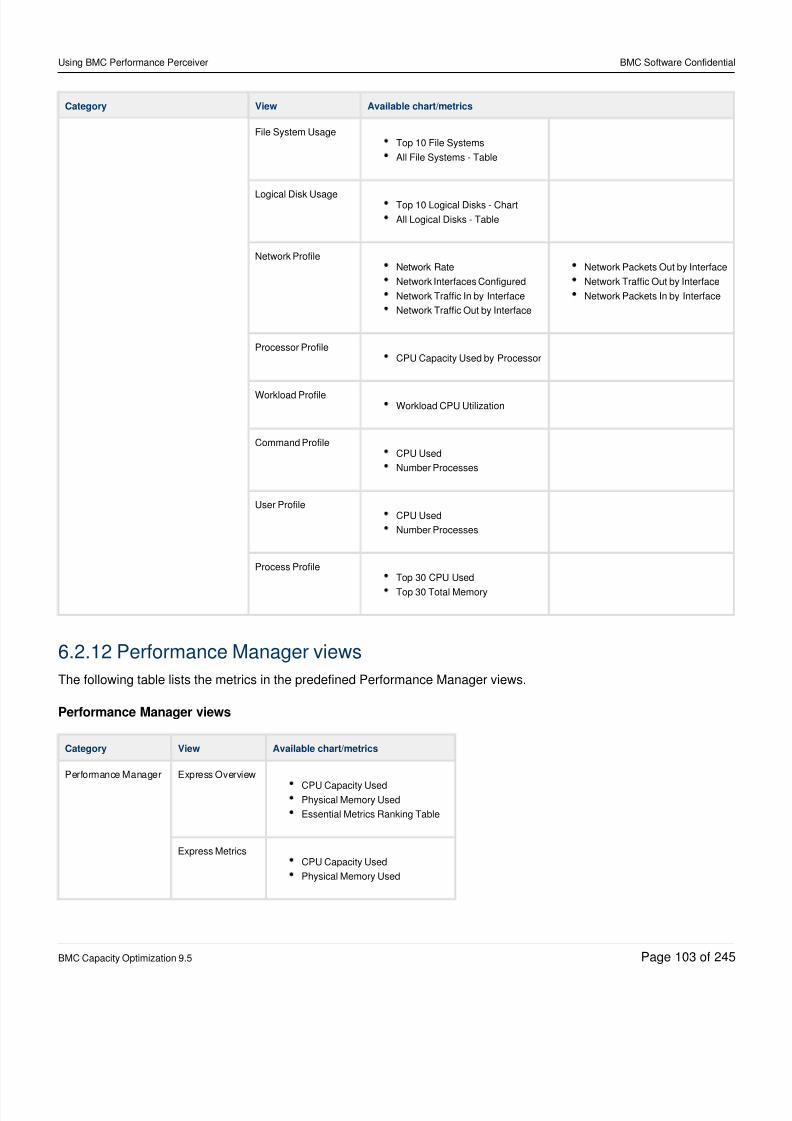
8/21/2019 Using BMC Performance Perceiver-V5-20141128_0503
http://slidepdf.com/reader/full/using-bmc-performance-perceiver-v5-201411280503 103/245
Using BMC Performance Perceiver BMC Software Confidential
BMC Capacity Optimization 9.5 Page of103 245
Category View Available chart/metrics
File System UsageTop 10 File Systems
All File Systems - Table
Logical Disk UsageTop 10 Logical Disks - Chart
All Logical Disks - Table
Network ProfileNetwork Rate
Network Interfaces Configured
Network Traffic In by Interface
Network Traffic Out by Interface
Network Packets Out by Interface
Network Traffic Out by Interface
Network Packets In by Interface
Processor ProfileCPU Capacity Used by Processor
Workload ProfileWorkload CPU Utilization
Command ProfileCPU Used
Number Processes
User ProfileCPU Used
Number Processes
Process ProfileTop 30 CPU Used
Top 30 Total Memory
6.2.12 Performance Manager views
The following table lists the metrics in the predefined Performance Manager views.
Performance Manager views
Category View Available chart/metrics
Performance Manager Express Overview
CPU Capacity UsedPhysical Memory Used
Essential Metrics Ranking Table
Express MetricsCPU Capacity Used
Physical Memory Used
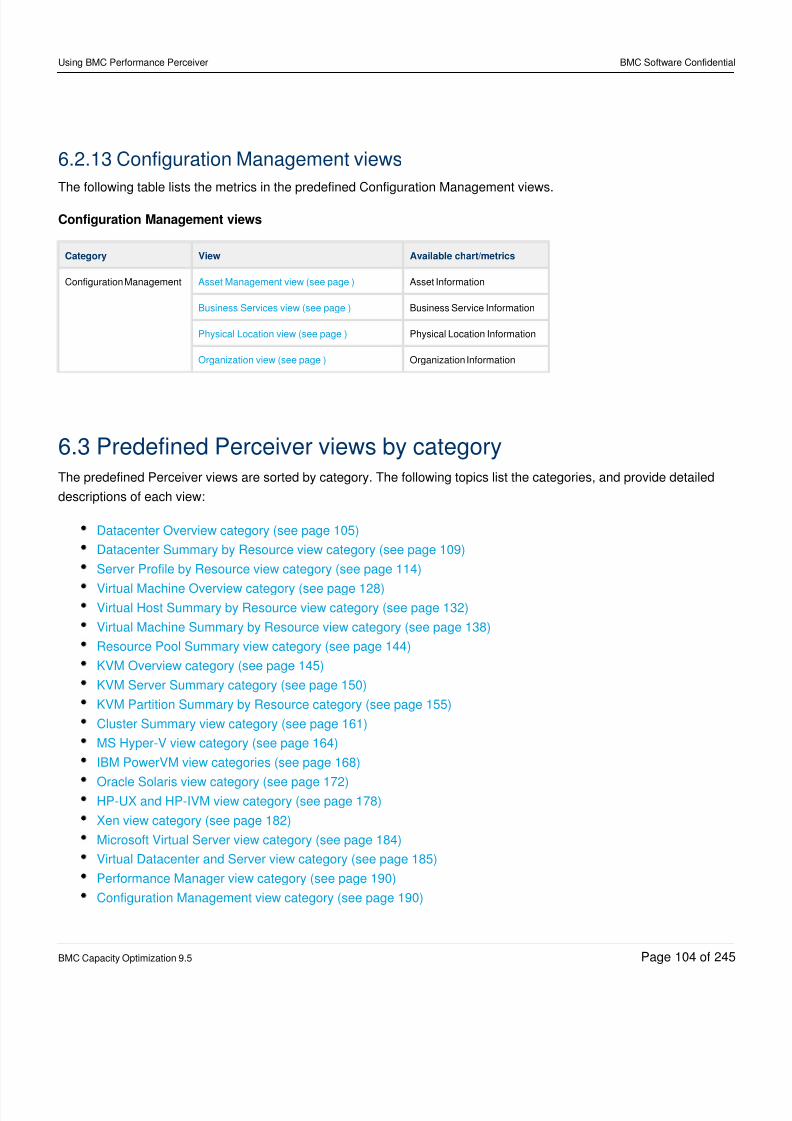
8/21/2019 Using BMC Performance Perceiver-V5-20141128_0503
http://slidepdf.com/reader/full/using-bmc-performance-perceiver-v5-201411280503 104/245
Using BMC Performance Perceiver BMC Software Confidential
BMC Capacity Optimization 9.5 Page of104 245
6.2.13 Configuration Management views
The following table lists the metrics in the predefined Configuration Management views.
Configuration Management views
Category View Available chart/metrics
Configuration Management Asset Management view (see page ) Asset Information
Business Services view (see page ) Business Service Information
Physical Location view (see page ) Physical Location Information
Organization view (see page ) Organization Information
6.3 Predefined Perceiver views by categoryThe predefined Perceiver views are sorted by category. The following topics list the categories, and provide detailed
descriptions of each view:
Datacenter Overview category (see page 105)
Datacenter Summary by Resource view category (see page 109)
Server Profile by Resource view category (see page 114)
Virtual Machine Overview category (see page 128)Virtual Host Summary by Resource view category (see page 132)
Virtual Machine Summary by Resource view category (see page 138)
Resource Pool Summary view category (see page 144)
KVM Overview category (see page 145)
KVM Server Summary category (see page 150)
KVM Partition Summary by Resource category (see page 155)
Cluster Summary view category (see page 161)
MS Hyper-V view category (see page 164)
IBM PowerVM view categories (see page 168)
Oracle Solaris view category (see page 172)HP-UX and HP-IVM view category (see page 178)
Xen view category (see page 182)
Microsoft Virtual Server view category (see page 184)
Virtual Datacenter and Server view category (see page 185)
Performance Manager view category (see page 190)
Configuration Management view category (see page 190)
8/21/2019 Using BMC Performance Perceiver-V5-20141128_0503
http://slidepdf.com/reader/full/using-bmc-performance-perceiver-v5-201411280503 105/245
Using BMC Performance Perceiver BMC Software Confidential
BMC Capacity Optimization 9.5 Page of105 245
6.3.1 Datacenter Overview category
This category provides you with distributed charts displaying the essential metrics for the computers in your data
center from a variety of perspectives. The set of charts (CPU, IO, Memory, Network) is displayed for the selected
group of computers.
The following views are available:
Essential Overview (see page 105)
Essential Metrics view (see page 108)
Essential Overview
This view displays average distributed values for the computers in your data center by metric. It also includes a ranking
table that shows where the computers being measured fall in increments of 10 percentage points, based on a blended
value of the essential metrics (CPU Capacity Used, IO Rate, Physical Memory Used, Network Rate).
Essential Overview
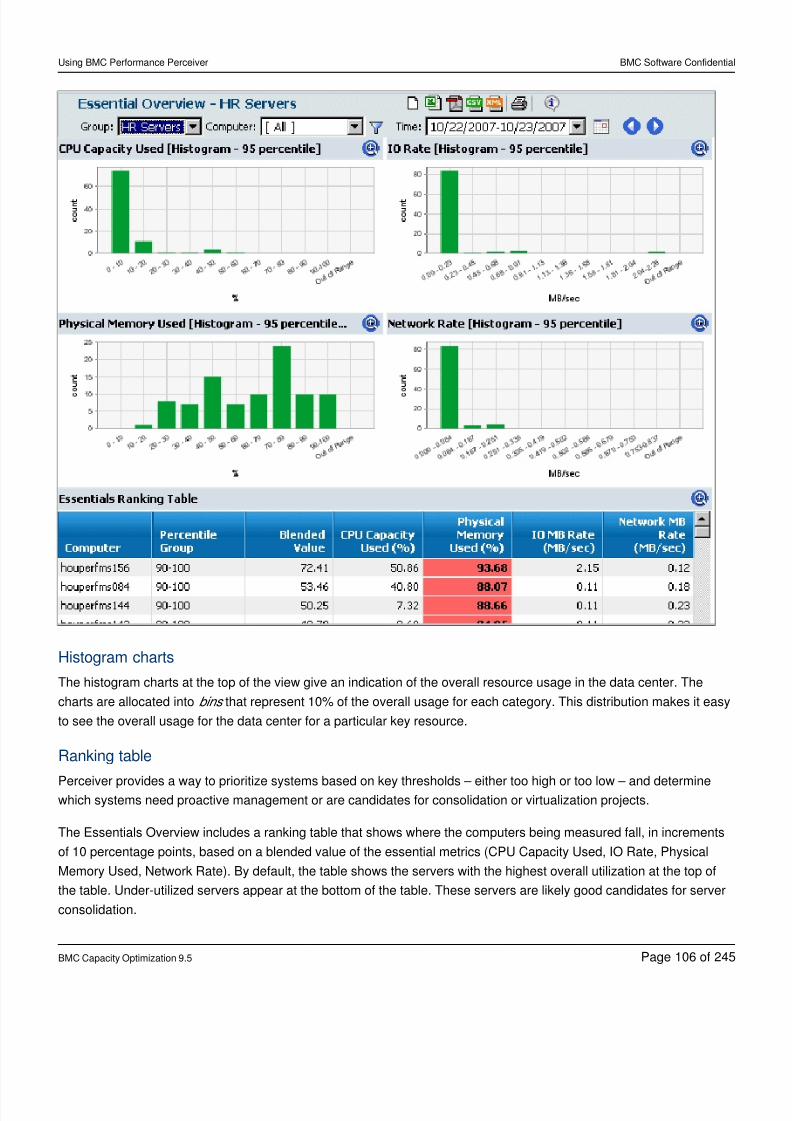
8/21/2019 Using BMC Performance Perceiver-V5-20141128_0503
http://slidepdf.com/reader/full/using-bmc-performance-perceiver-v5-201411280503 106/245
Using BMC Performance Perceiver BMC Software Confidential
BMC Capacity Optimization 9.5 Page of106 245
Histogram charts
The histogram charts at the top of the view give an indication of the overall resource usage in the data center. The
charts are allocated into that represent 10% of the overall usage for each category. This distribution makes it easybins
to see the overall usage for the data center for a particular key resource.
Ranking table
Perceiver provides a way to prioritize systems based on key thresholds – either too high or too low – and determinewhich systems need proactive management or are candidates for consolidation or virtualization projects.
The Essentials Overview includes a ranking table that shows where the computers being measured fall, in increments
of 10 percentage points, based on a blended value of the essential metrics (CPU Capacity Used, IO Rate, Physical
Memory Used, Network Rate). By default, the table shows the servers with the highest overall utilization at the top of
the table. Under-utilized servers appear at the bottom of the table. These servers are likely good candidates for server
consolidation.
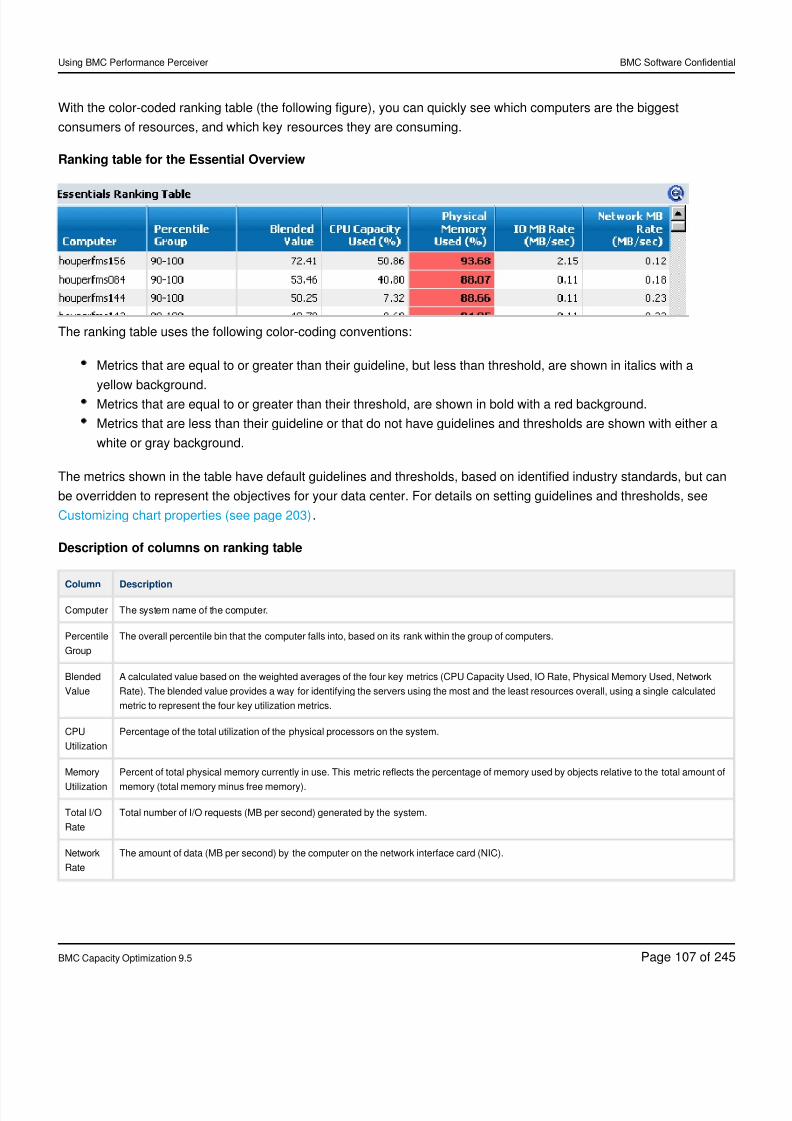
8/21/2019 Using BMC Performance Perceiver-V5-20141128_0503
http://slidepdf.com/reader/full/using-bmc-performance-perceiver-v5-201411280503 107/245
Using BMC Performance Perceiver BMC Software Confidential
BMC Capacity Optimization 9.5 Page of107 245
With the color-coded ranking table (the following figure), you can quickly see which computers are the biggest
consumers of resources, and which key resources they are consuming.
Ranking table for the Essential Overview
The ranking table uses the following color-coding conventions:
Metrics that are equal to or greater than their guideline, but less than threshold, are shown in italics with a
yellow background.
Metrics that are equal to or greater than their threshold, are shown in bold with a red background.
Metrics that are less than their guideline or that do not have guidelines and thresholds are shown with either a
white or gray background.
The metrics shown in the table have default guidelines and thresholds, based on identified industry standards, but can
be overridden to represent the objectives for your data center. For details on setting guidelines and thresholds, see
.Customizing chart properties (see page 203)
Description of columns on ranking table
Column Description
Computer The system name of the computer.
Percentile
Group
The overall percentile bin that the computer falls into, based on its rank within the group of computers.
Blended
Value
A calculated value based on the weighted averages of the four key metrics (CPU Capacity Used, IO Rate, Physical Memory Used, Network
Rate). The blended value provides a way for identifying the servers using the most and the least resources overall, using a single calculated
metric to represent the four key utilization metrics.
CPU
Utilization
Percentage of the total utilization of the physical processors on the system.
Memory
Utilization
Percent of total physical memory currently in use. This metric reflects the percentage of memory used by objects relative to the total amount of
memory (total memory minus free memory).
Total I/O
Rate
Total number of I/O requests (MB per second) generated by the system.
Network
Rate
The amount of data (MB per second) by the computer on the network interface card (NIC).
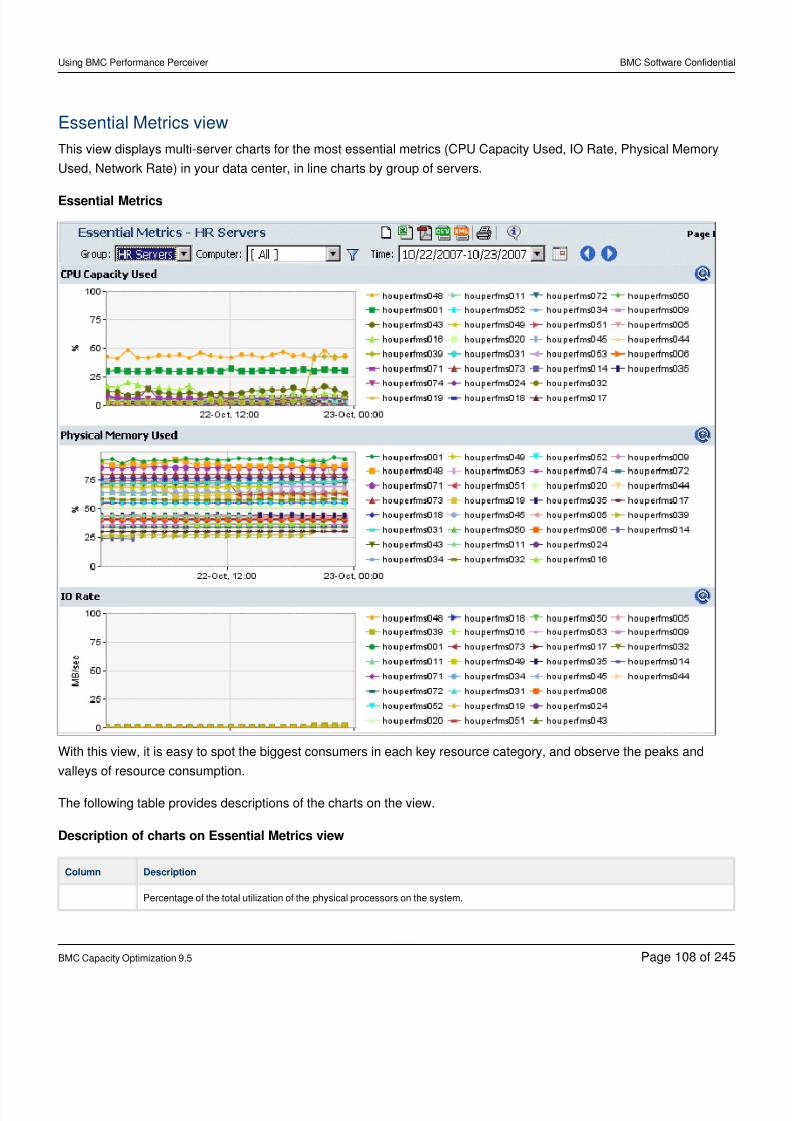
8/21/2019 Using BMC Performance Perceiver-V5-20141128_0503
http://slidepdf.com/reader/full/using-bmc-performance-perceiver-v5-201411280503 108/245
Using BMC Performance Perceiver BMC Software Confidential
BMC Capacity Optimization 9.5 Page of108 245
Essential Metrics view
This view displays multi-server charts for the most essential metrics (CPU Capacity Used, IO Rate, Physical Memory
Used, Network Rate) in your data center, in line charts by group of servers.
Essential Metrics
With this view, it is easy to spot the biggest consumers in each key resource category, and observe the peaks and
valleys of resource consumption.
The following table provides descriptions of the charts on the view.
Description of charts on Essential Metrics view
Column Description
Percentage of the total utilization of the physical processors on the system.
8/21/2019 Using BMC Performance Perceiver-V5-20141128_0503
http://slidepdf.com/reader/full/using-bmc-performance-perceiver-v5-201411280503 109/245
Using BMC Performance Perceiver BMC Software Confidential
BMC Capacity Optimization 9.5 Page of109 245
Column Description
CPU Capacity
Used
Physical
Memory Used
Percent of total physical memory currently in use. This metric reflects the percentage of memory used by objects relative to the total
amount of memory (total memory minus free memory).
I/O Rate Average number of I/O requests generated by the system.
Network Rate The number of packets transmitted (per second) by the computer on the network interface card (NIC).
6.3.2 Datacenter Summary by Resource view category
This category contains multi-server charts displaying the essential metrics for the computers in your data center from a
variety of perspectives. It provides an easy way to find out more about the specific resources being consumed by
these over-utilized systems.
The following views are available:
Processor States (see page 109)
Memory Usage view (see page 111)
IO and Network Usage (see page 112)
System Availability (see page 113)
Processor States
This view displays multi-server graphs for the percent of time the CPU spends in different processor states (CPU
System, CPU User, CPU Idle, CPU Wait).
Processor States
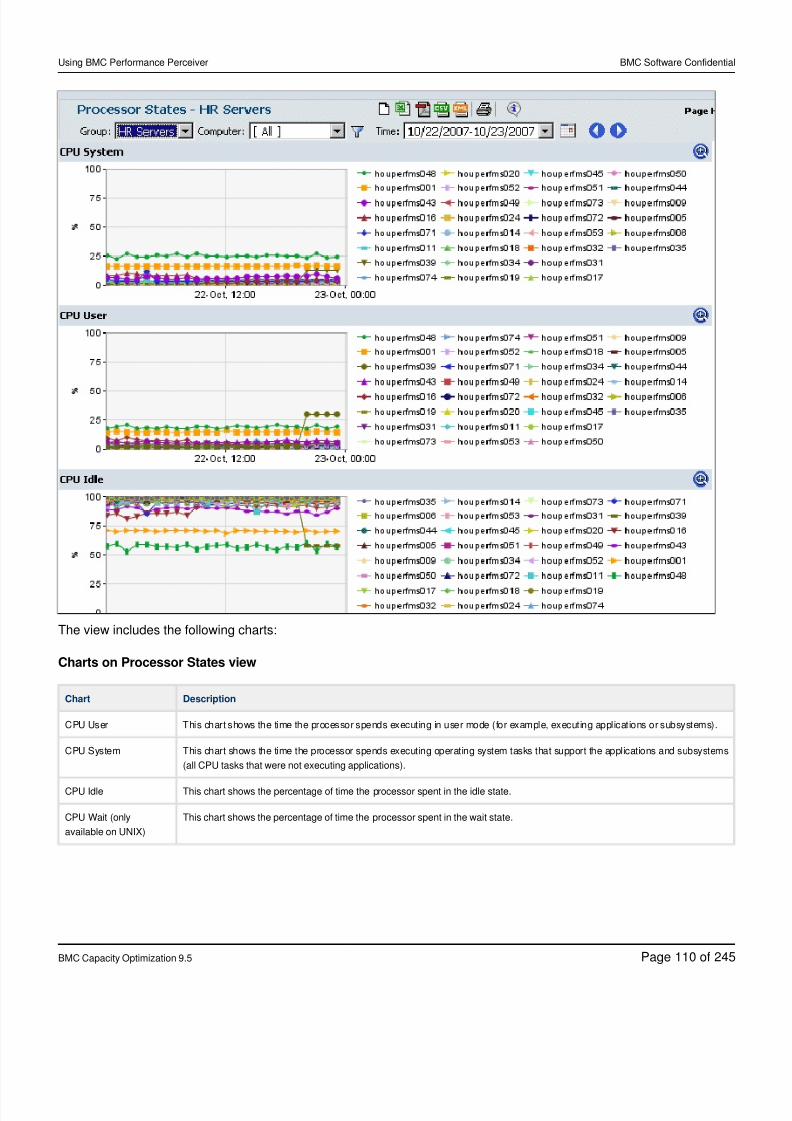
8/21/2019 Using BMC Performance Perceiver-V5-20141128_0503
http://slidepdf.com/reader/full/using-bmc-performance-perceiver-v5-201411280503 110/245
Using BMC Performance Perceiver BMC Software Confidential
BMC Capacity Optimization 9.5 Page of110 245
The view includes the following charts:
Charts on Processor States view
Chart Description
CPU User This chart shows the time the processor spends executing in user mode (for example, executing applications or subsystems).
CPU System This chart shows the time the processor spends executing operating system tasks that support the applications and subsystems
(all CPU tasks that were not executing applications).
CPU Idle This chart shows the percentage of time the processor spent in the idle state.
CPU Wait (only
available on UNIX)
This chart shows the percentage of time the processor spent in the wait state.
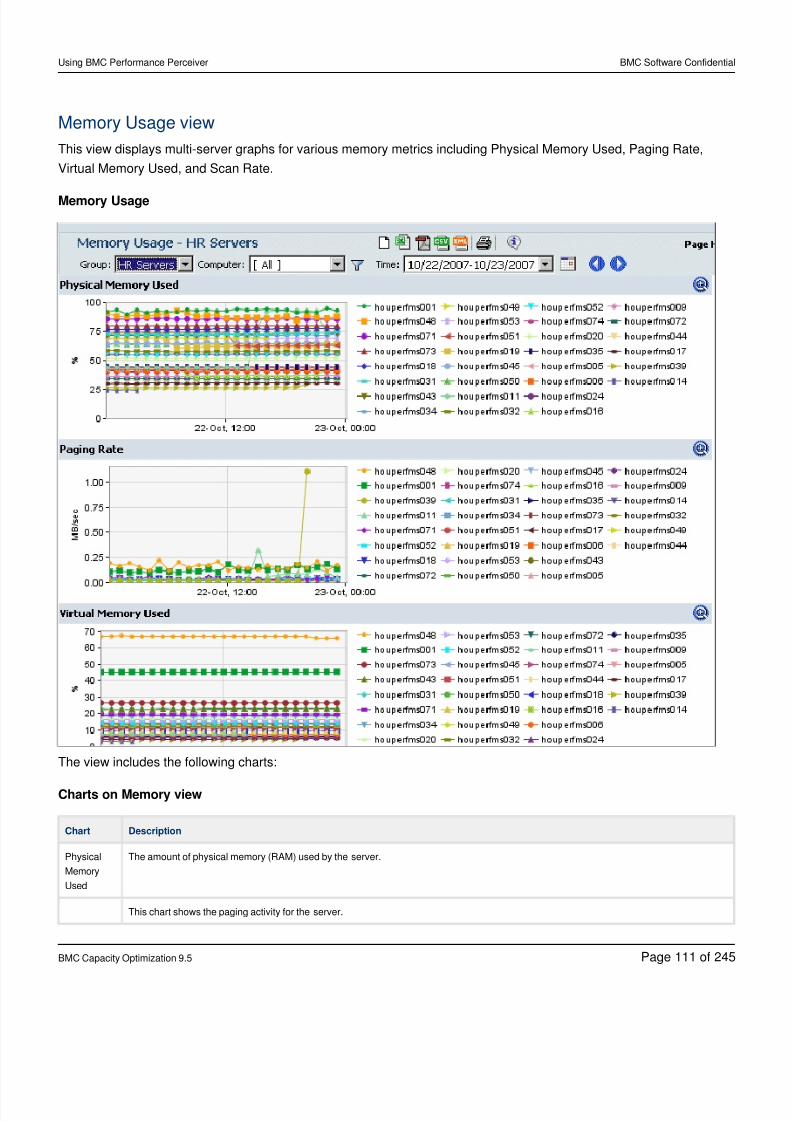
8/21/2019 Using BMC Performance Perceiver-V5-20141128_0503
http://slidepdf.com/reader/full/using-bmc-performance-perceiver-v5-201411280503 111/245
Using BMC Performance Perceiver BMC Software Confidential
BMC Capacity Optimization 9.5 Page of111 245
Memory Usage view
This view displays multi-server graphs for various memory metrics including Physical Memory Used, Paging Rate,
Virtual Memory Used, and Scan Rate.
Memory Usage
The view includes the following charts:
Charts on Memory view
Chart Description
Physical
Memory
Used
The amount of physical memory (RAM) used by the server.
This chart shows the paging activity for the server.
8/21/2019 Using BMC Performance Perceiver-V5-20141128_0503
http://slidepdf.com/reader/full/using-bmc-performance-perceiver-v5-201411280503 112/245
Using BMC Performance Perceiver BMC Software Confidential
BMC Capacity Optimization 9.5 Page of112 245
Chart Description
Paging
Rate
Virtual
Memory
Used
The amount of virtual memory used by the server. The RAM and the disk space (swap partition and file system) dedicated to it are
considered the virtual memory of the system. Every program that executes occupies a certain amount of virtual memory. Once all the virtual
memory has been allocated to specific applications, new programs cannot start and currently running programs may fail if they need more
memory.
Scan Rate (
only
available
for UNIX
computers)
Average number of memory pages (in pages per second) examined in the free list to find inactive pages that can be used for either process
or file system memory. This metric can provide an indicator for how much demand for memory is occurring on a system. If this value is zero,
or close to zero, then the system likely has sufficient memory. If it is usually a high number (hundreds to thousands of pages per second)
then it is likely the system needs additional memory.
IO and Network Usage
This view displays multi-server graphs for various IO and network metrics including Disk IO rate, Network rate, and
Disk Volume Space Used).
I/O and Network Usage
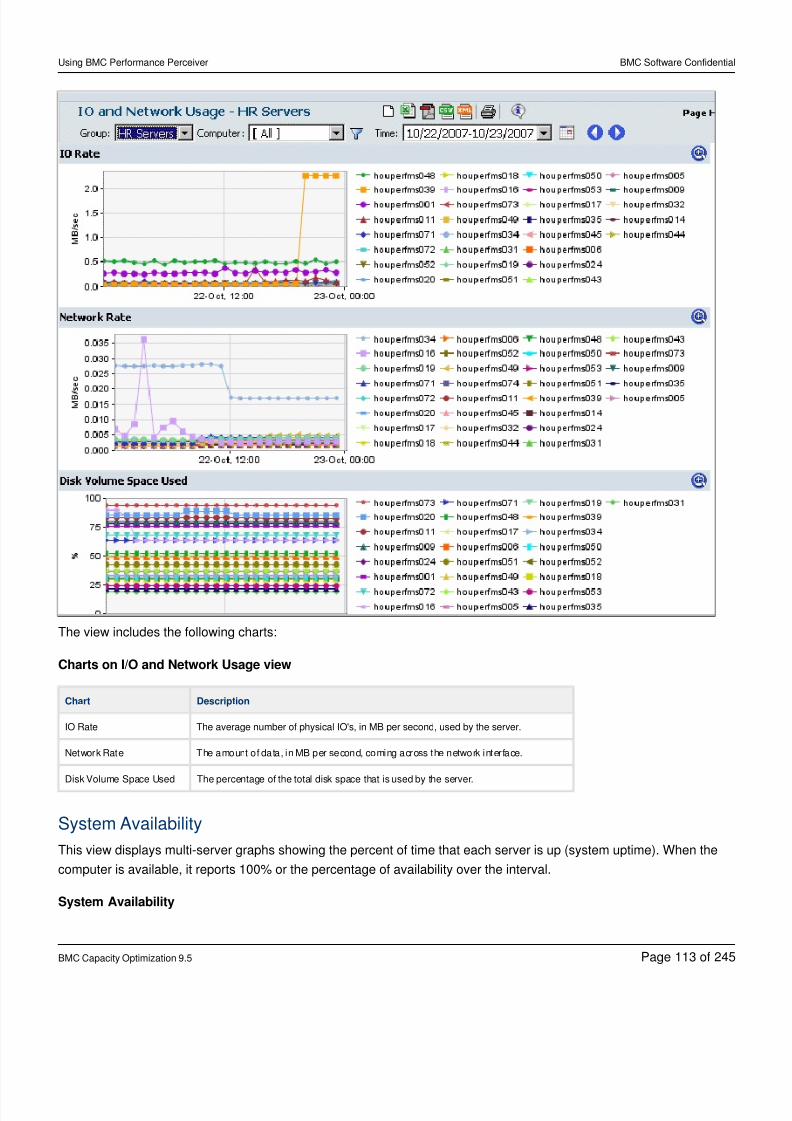
8/21/2019 Using BMC Performance Perceiver-V5-20141128_0503
http://slidepdf.com/reader/full/using-bmc-performance-perceiver-v5-201411280503 113/245
Using BMC Performance Perceiver BMC Software Confidential
BMC Capacity Optimization 9.5 Page of113 245
The view includes the following charts:
Charts on I/O and Network Usage view
Chart Description
IO Rate The average number of physical IO's, in MB per second, used by the server.
Network Rate The amount of data, in MB per second, coming across the network interface.
Disk Volume Space Used The percentage of the total disk space that is used by the server.
System Availability
This view displays multi-server graphs showing the percent of time that each server is up (system uptime). When the
computer is available, it reports 100% or the percentage of availability over the interval.
System Availability
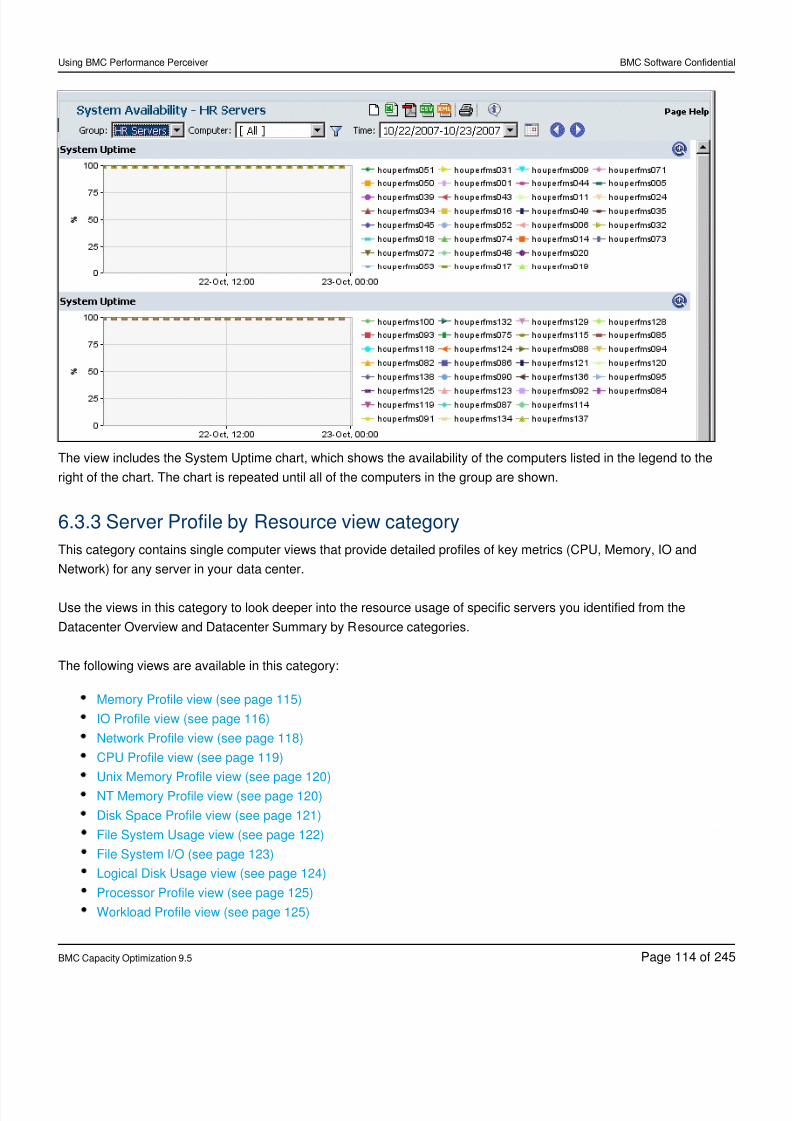
8/21/2019 Using BMC Performance Perceiver-V5-20141128_0503
http://slidepdf.com/reader/full/using-bmc-performance-perceiver-v5-201411280503 114/245
Using BMC Performance Perceiver BMC Software Confidential
BMC Capacity Optimization 9.5 Page of114 245
The view includes the System Uptime chart, which shows the availability of the computers listed in the legend to the
right of the chart. The chart is repeated until all of the computers in the group are shown.
6.3.3 Server Profile by Resource view category
This category contains single computer views that provide detailed profiles of key metrics (CPU, Memory, IO and
Network) for any server in your data center.
Use the views in this category to look deeper into the resource usage of specific servers you identified from the
Datacenter Overview and Datacenter Summary by Resource categories.
The following views are available in this category:
Memory Profile view (see page 115)
IO Profile view (see page 116)
Network Profile view (see page 118)
CPU Profile view (see page 119)
Unix Memory Profile view (see page 120)
NT Memory Profile view (see page 120)
Disk Space Profile view (see page 121)
File System Usage view (see page 122)
File System I/O (see page 123)
Logical Disk Usage view (see page 124)
Processor Profile view (see page 125)
Workload Profile view (see page 125)
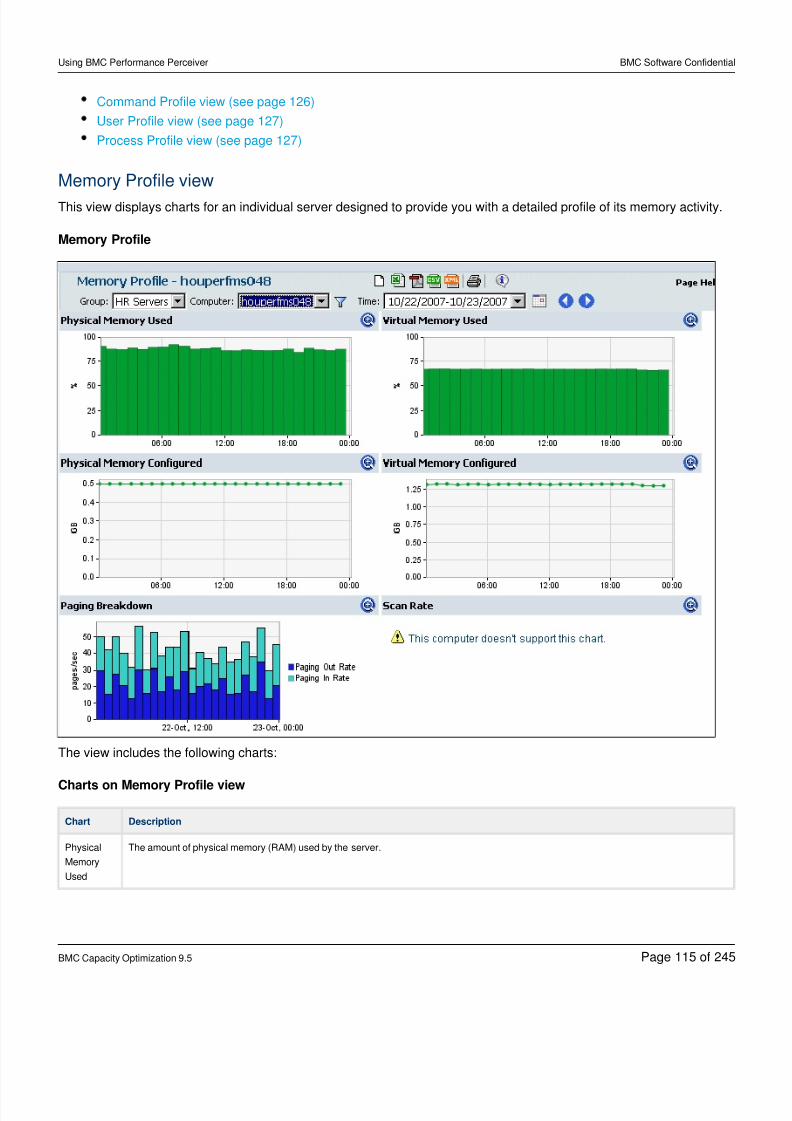
8/21/2019 Using BMC Performance Perceiver-V5-20141128_0503
http://slidepdf.com/reader/full/using-bmc-performance-perceiver-v5-201411280503 115/245
Using BMC Performance Perceiver BMC Software Confidential
BMC Capacity Optimization 9.5 Page of115 245
Command Profile view (see page 126)
User Profile view (see page 127)
Process Profile view (see page 127)
Memory Profile view
This view displays charts for an individual server designed to provide you with a detailed profile of its memory activity.
Memory Profile
The view includes the following charts:
Charts on Memory Profile view
Chart Description
Physical
Memory
Used
The amount of physical memory (RAM) used by the server.
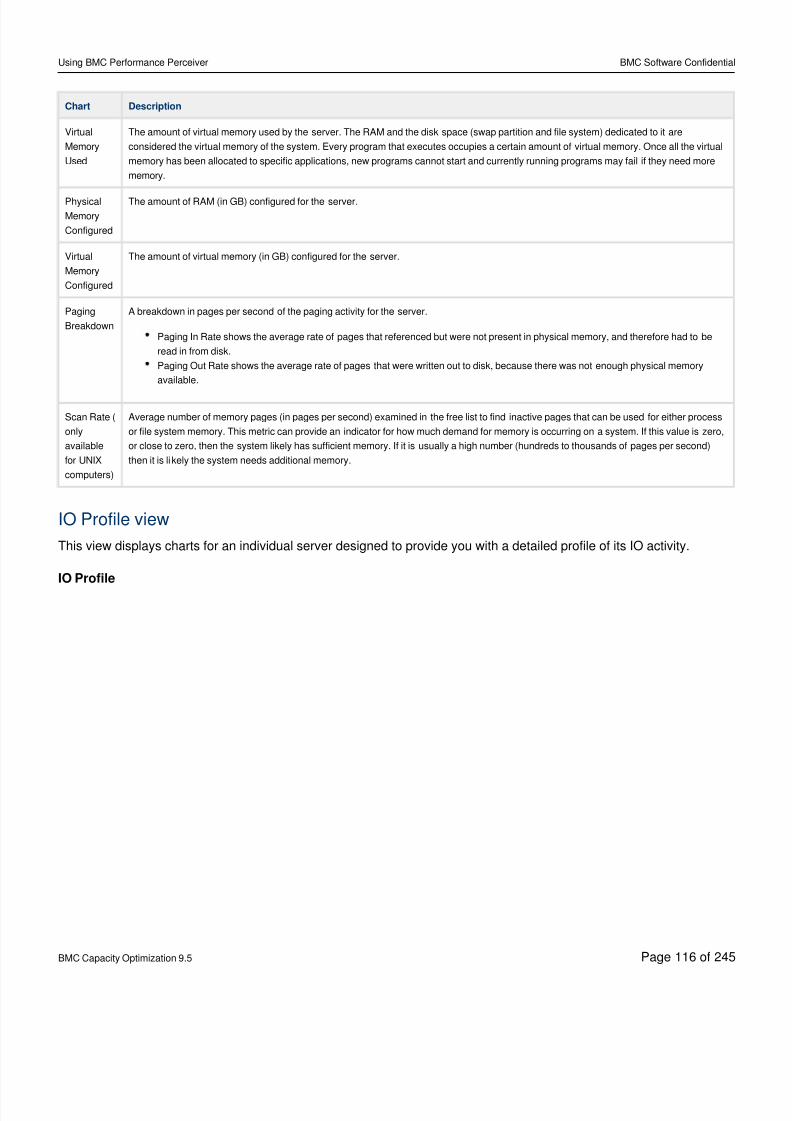
8/21/2019 Using BMC Performance Perceiver-V5-20141128_0503
http://slidepdf.com/reader/full/using-bmc-performance-perceiver-v5-201411280503 116/245
Using BMC Performance Perceiver BMC Software Confidential
BMC Capacity Optimization 9.5 Page of116 245
Chart Description
Virtual
Memory
Used
The amount of virtual memory used by the server. The RAM and the disk space (swap partition and file system) dedicated to it are
considered the virtual memory of the system. Every program that executes occupies a certain amount of virtual memory. Once all the virtual
memory has been allocated to specific applications, new programs cannot start and currently running programs may fail if they need more
memory.
Physical
Memory
Configured
The amount of RAM (in GB) configured for the server.
Virtual
Memory
Configured
The amount of virtual memory (in GB) configured for the server.
Paging
Breakdown
A breakdown in pages per second of the paging activity for the server.
Paging In Rate shows the average rate of pages that referenced but were not present in physical memory, and therefore had to be
read in from disk.
Paging Out Rate shows the average rate of pages that were written out to disk, because there was not enough physical memory
available.
Scan Rate (
only
available
for UNIX
computers)
Average number of memory pages (in pages per second) examined in the free list to find inactive pages that can be used for either process
or file system memory. This metric can provide an indicator for how much demand for memory is occurring on a system. If this value is zero,
or close to zero, then the system likely has sufficient memory. If it is usually a high number (hundreds to thousands of pages per second)
then it is likely the system needs additional memory.
IO Profile view
This view displays charts for an individual server designed to provide you with a detailed profile of its IO activity.
IO Profile
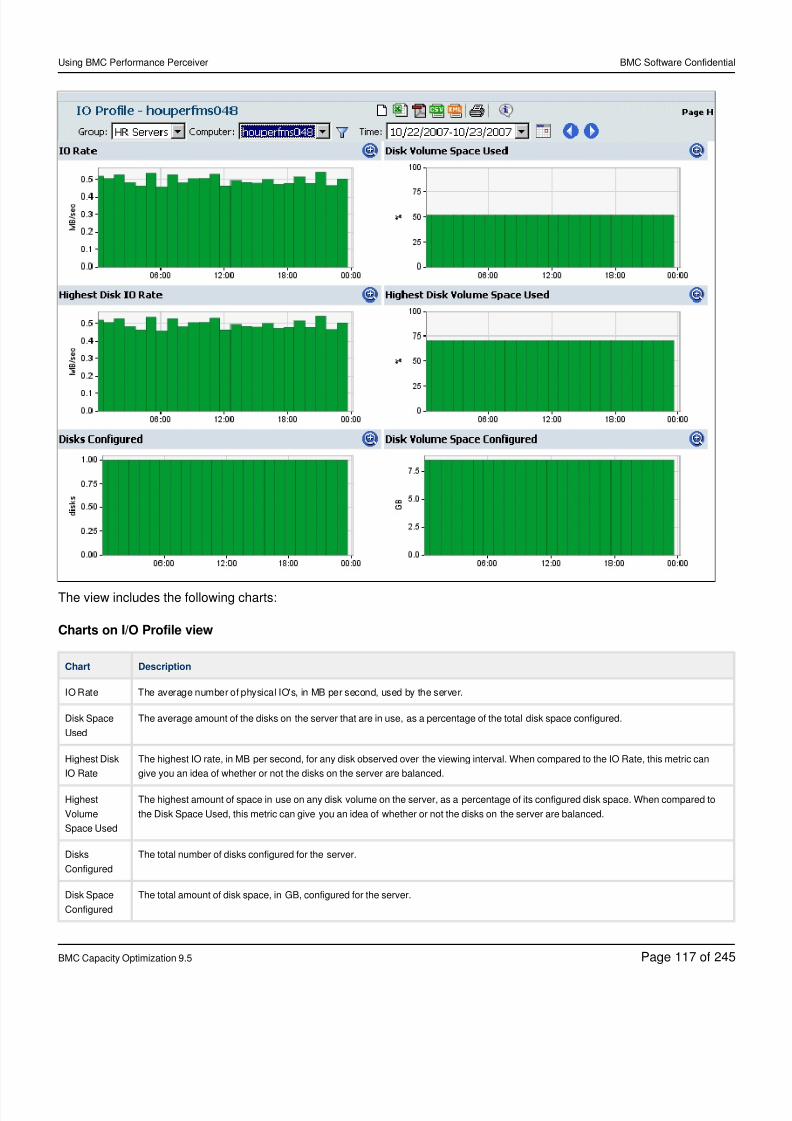
8/21/2019 Using BMC Performance Perceiver-V5-20141128_0503
http://slidepdf.com/reader/full/using-bmc-performance-perceiver-v5-201411280503 117/245
Using BMC Performance Perceiver BMC Software Confidential
BMC Capacity Optimization 9.5 Page of117 245
The view includes the following charts:
Charts on I/O Profile view
Chart Description
IO Rate The average number of physical IO's, in MB per second, used by the server.
Disk Space
Used
The average amount of the disks on the server that are in use, as a percentage of the total disk space configured.
Highest Disk
IO Rate
The highest IO rate, in MB per second, for any disk observed over the viewing interval. When compared to the IO Rate, this metric can
give you an idea of whether or not the disks on the server are balanced.
Highest
Volume
Space Used
The highest amount of space in use on any disk volume on the server, as a percentage of its configured disk space. When compared to
the Disk Space Used, this metric can give you an idea of whether or not the disks on the server are balanced.
Disks
Configured
The total number of disks configured for the server.
Disk Space
Configured
The total amount of disk space, in GB, configured for the server.
8/21/2019 Using BMC Performance Perceiver-V5-20141128_0503
http://slidepdf.com/reader/full/using-bmc-performance-perceiver-v5-201411280503 118/245
Using BMC Performance Perceiver BMC Software Confidential
BMC Capacity Optimization 9.5 Page of118 245
Network Profile view
This view displays charts for an individual server designed to provide you with a detailed profile of the network on the
individual server. This information can be very useful when conducting a server consolidation.
Network Profile
The view includes the following charts:
Charts on Network Profile view
Chart Description
Network Rate - MB/sec The amount of data coming across the network interface.
Network Interfaces Configured - interfaces The number of network interface devices connected to the server.
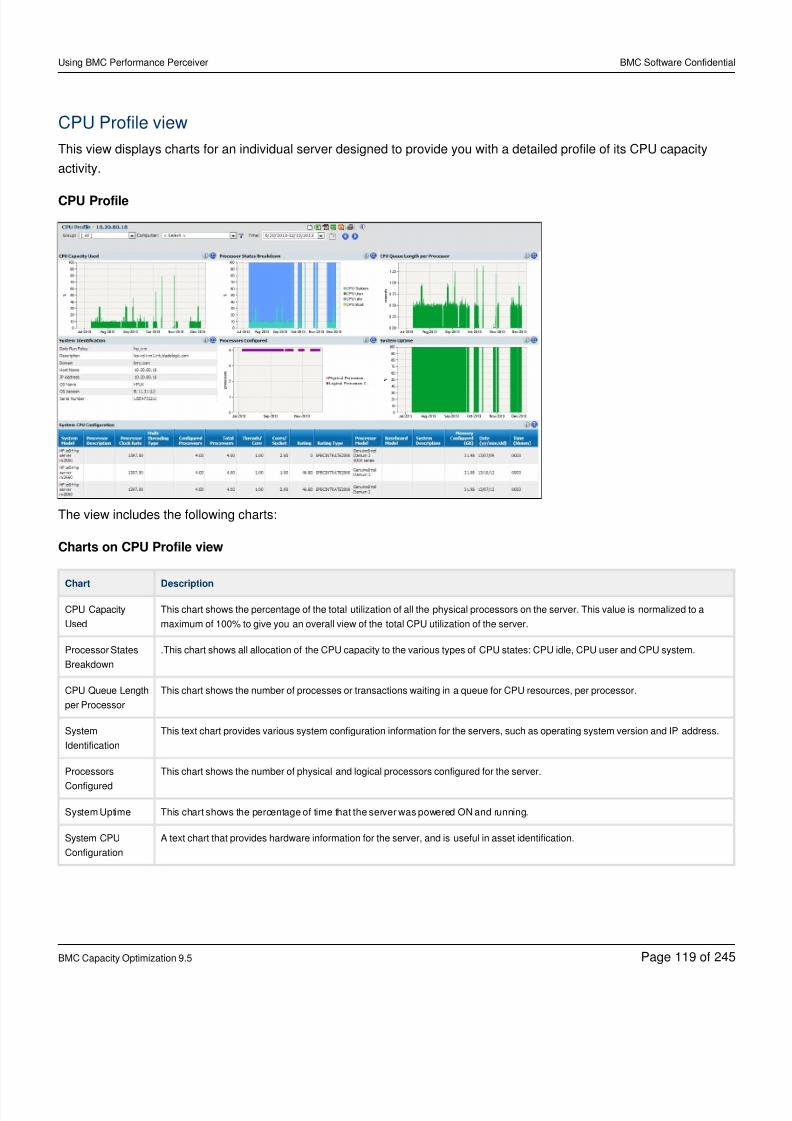
8/21/2019 Using BMC Performance Perceiver-V5-20141128_0503
http://slidepdf.com/reader/full/using-bmc-performance-perceiver-v5-201411280503 119/245
Using BMC Performance Perceiver BMC Software Confidential
BMC Capacity Optimization 9.5 Page of119 245
CPU Profile view
This view displays charts for an individual server designed to provide you with a detailed profile of its CPU capacity
activity.
CPU Profile
The view includes the following charts:
Charts on CPU Profile view
Chart Description
CPU Capacity
Used
This chart shows the percentage of the total utilization of all the physical processors on the server. This value is normalized to a
maximum of 100% to give you an overall view of the total CPU utilization of the server.
Processor States
Breakdown
.This chart shows all allocation of the CPU capacity to the various types of CPU states: CPU idle, CPU user and CPU system.
CPU Queue Length
per Processor
This chart shows the number of processes or transactions waiting in a queue for CPU resources, per processor.
System
Identification
This text chart provides various system configuration information for the servers, such as operating system version and IP address.
Processors
Configured
This chart shows the number of physical and logical processors configured for the server.
System Uptime This chart shows the percentage of time that the server was powered ON and running.
System CPU
Configuration
A text chart that provides hardware information for the server, and is useful in asset identification.
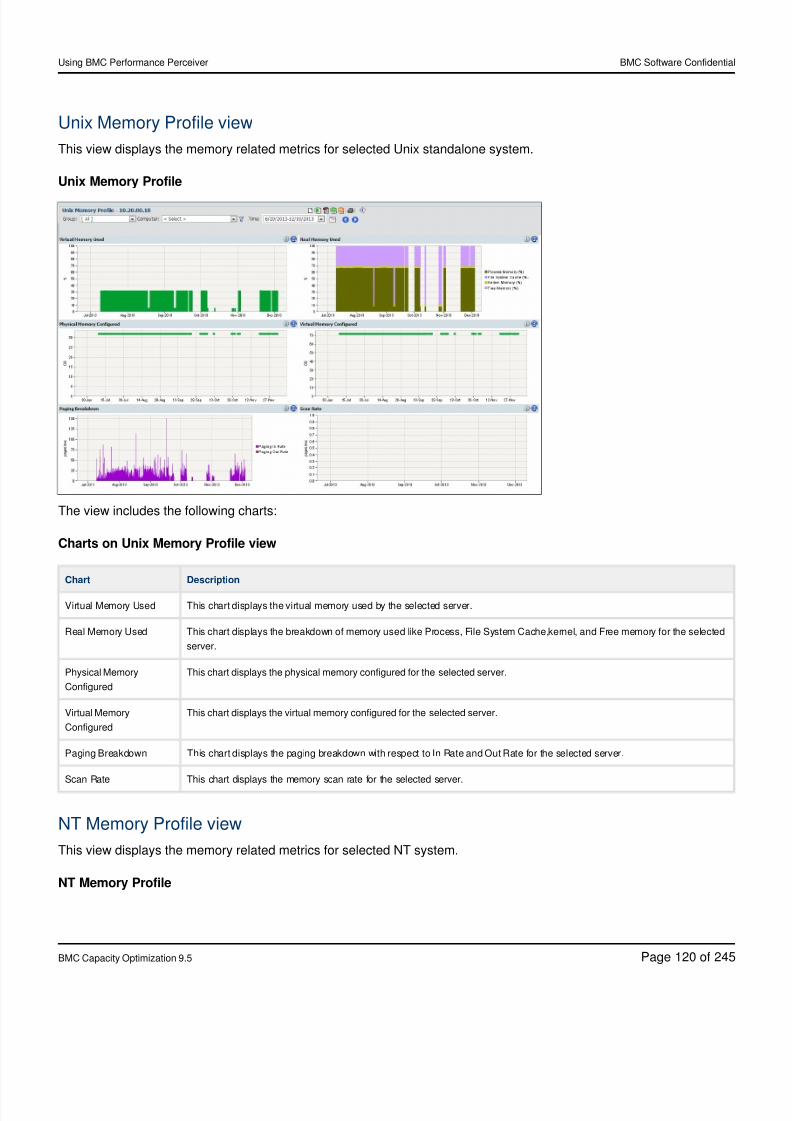
8/21/2019 Using BMC Performance Perceiver-V5-20141128_0503
http://slidepdf.com/reader/full/using-bmc-performance-perceiver-v5-201411280503 120/245
Using BMC Performance Perceiver BMC Software Confidential
BMC Capacity Optimization 9.5 Page of120 245
Unix Memory Profile view
This view displays the memory related metrics for selected Unix standalone system.
Unix Memory Profile
The view includes the following charts:
Charts on Unix Memory Profile view
Chart Description
Virtual Memory Used This chart displays the virtual memory used by the selected server.
Real Memory Used This chart displays the breakdown of memory used like Process, File System Cache,kernel, and Free memory for the selected
server.
Physical Memory
Configured
This chart displays the physical memory configured for the selected server.
Virtual Memory
Configured
This chart displays the virtual memory configured for the selected server.
Paging Breakdown This chart displays the paging breakdown with respect to In Rate and Out Rate for the selected server.
Scan Rate This chart displays the memory scan rate for the selected server.
NT Memory Profile view
This view displays the memory related metrics for selected NT system.
ProfileNT Memory
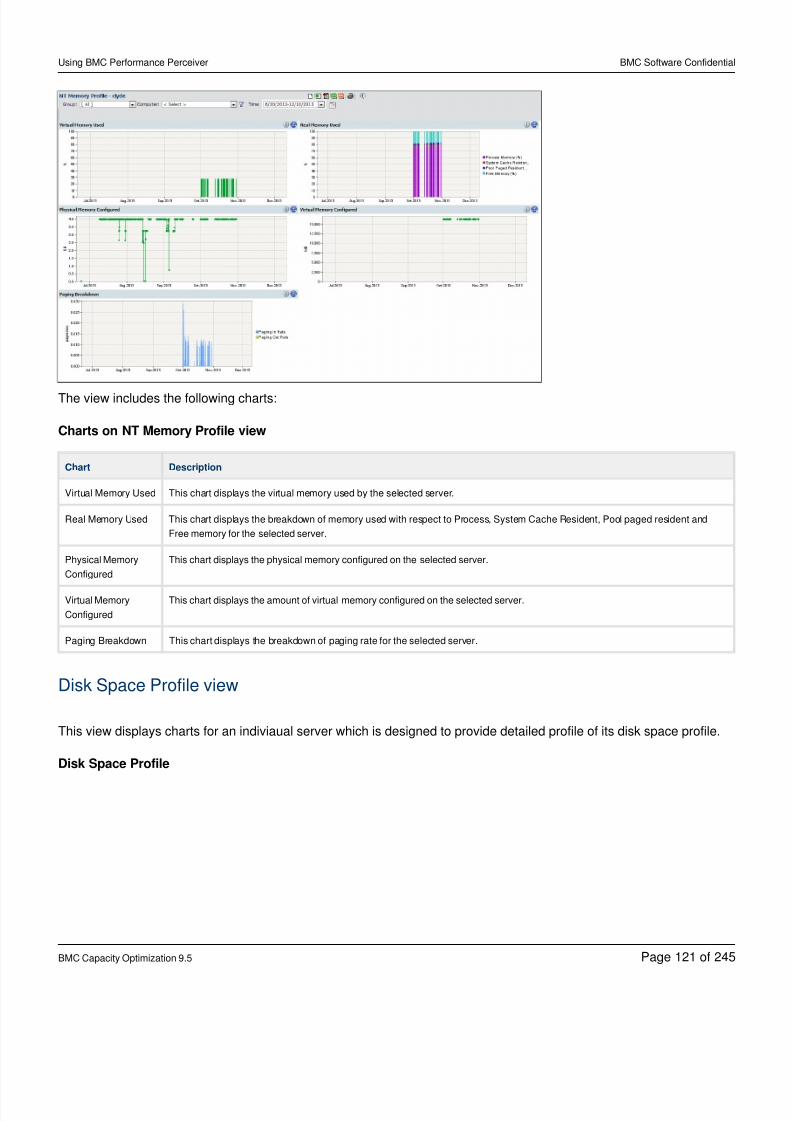
8/21/2019 Using BMC Performance Perceiver-V5-20141128_0503
http://slidepdf.com/reader/full/using-bmc-performance-perceiver-v5-201411280503 121/245
Using BMC Performance Perceiver BMC Software Confidential
BMC Capacity Optimization 9.5 Page of121 245
The view includes the following charts:
Charts on Profile viewNT Memory
Chart Description
Virtual Memory Used This chart displays the virtual memory used by the selected server.
Real Memory Used This chart displays the breakdown of memory used with respect to Process, System Cache Resident, Pool paged resident and
Free memory for the selected server.
Physical Memory
Configured
This chart displays the physical memory configured on the selected server.
Virtual Memory
Configured
This chart displays the amount of virtual memory configured on the selected server.
Paging Breakdown This chart displays the breakdown of paging rate for the selected server.
Disk Space Profile view
This view displays charts for an indiviaual server which is designed to provide detailed profile of its disk space profile.
Disk Space Profile
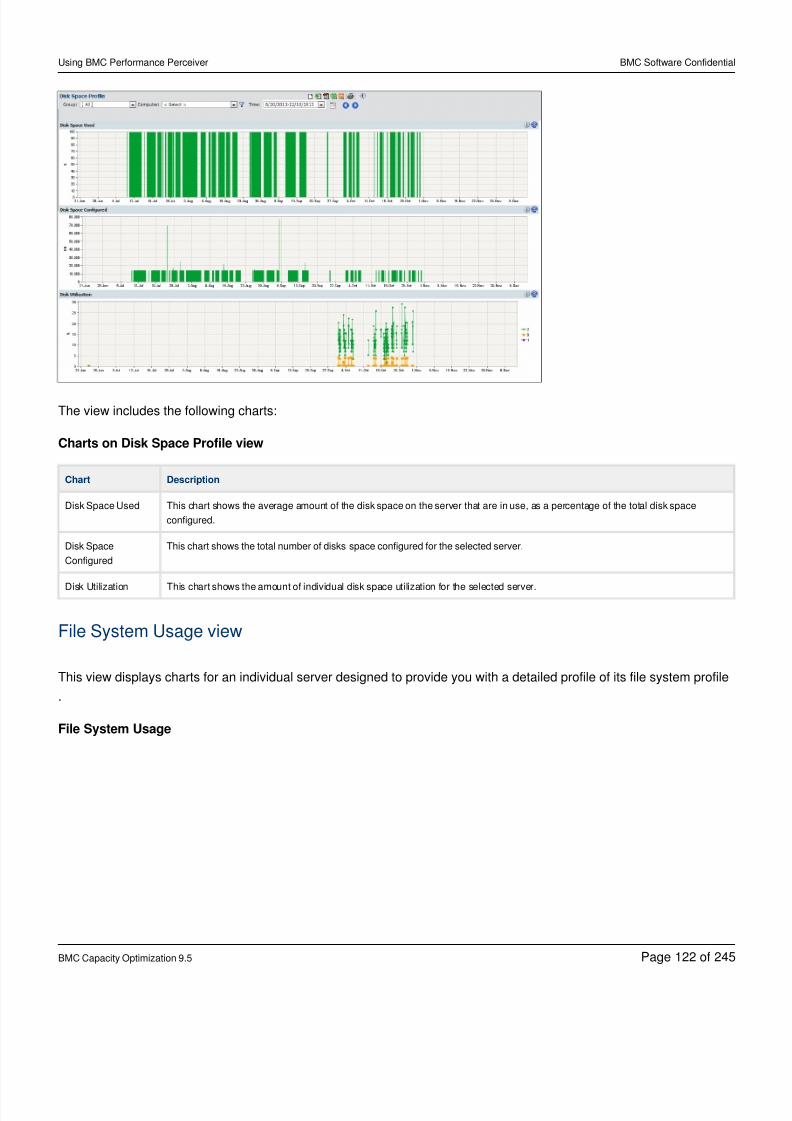
8/21/2019 Using BMC Performance Perceiver-V5-20141128_0503
http://slidepdf.com/reader/full/using-bmc-performance-perceiver-v5-201411280503 122/245
Using BMC Performance Perceiver BMC Software Confidential
BMC Capacity Optimization 9.5 Page of122 245
The view includes the following charts:
Charts on Disk Space Profile view
Chart Description
Disk Space Used This chart shows the average amount of the disk space on the server that are in use, as a percentage of the total disk space
configured.
Disk Space
Configured
This chart shows the total number of disks space configured for the selected server.
Disk Utilization This chart shows the amount of individual disk space utilization for the selected server.
File System Usage view
This view displays charts for an individual server designed to provide you with a detailed profile of its file system profile
.
File System Usage
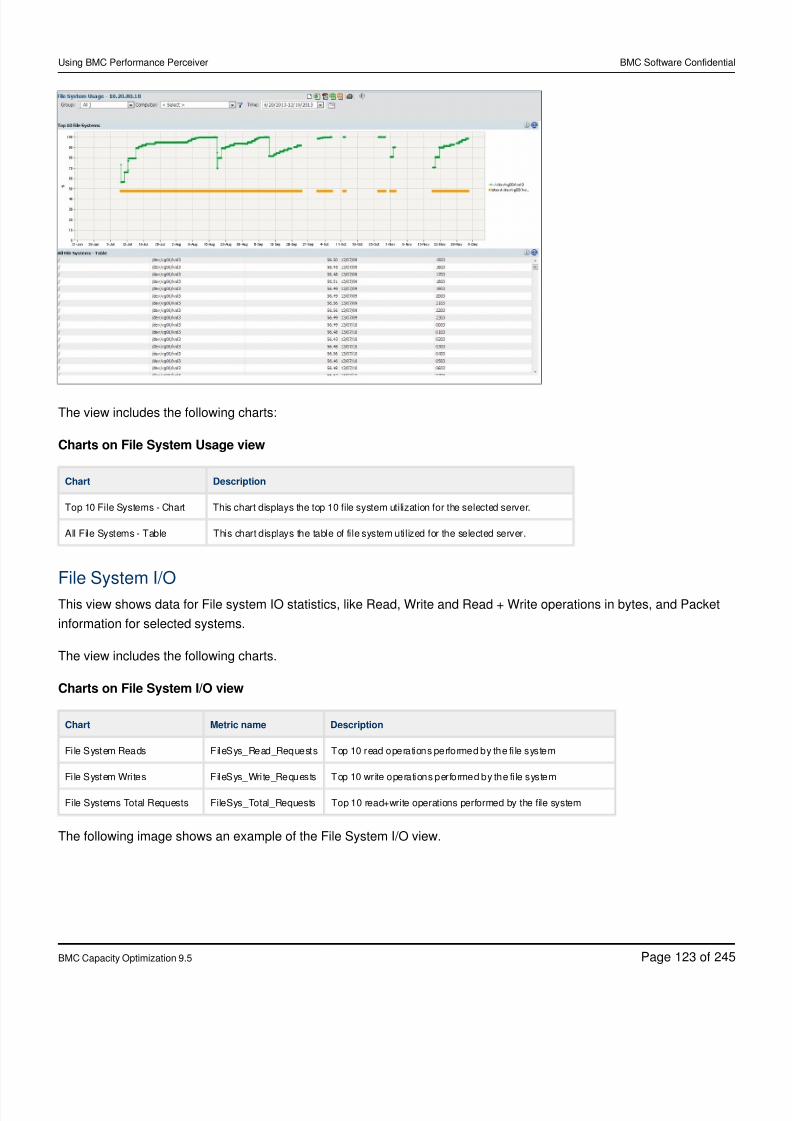
8/21/2019 Using BMC Performance Perceiver-V5-20141128_0503
http://slidepdf.com/reader/full/using-bmc-performance-perceiver-v5-201411280503 123/245
Using BMC Performance Perceiver BMC Software Confidential
BMC Capacity Optimization 9.5 Page of123 245
The view includes the following charts:
Charts on File System Usage view
Chart Description
Top 10 File Systems - Chart This chart displays the top 10 file system utilization for the selected server.
All File Systems - Table This chart displays the table of file system utilized for the selected server.
File System I/O
This view shows data for File system IO statistics, like Read, Write and Read + Write operations in bytes, and Packet
information for selected systems.
The view includes the following charts.
Charts on File System I/O view
Chart Metric name Description
File System Reads FileSys_Read_Requests Top 10 read operations performed by the fi le system
File System Writes FileSys_Write_Requests Top 10 write operations performed by the fi le system
File Systems Total Requests FileSys_Total_Requests Top 10 read+write operations performed by the file system
The following image shows an example of the File System I/O view.
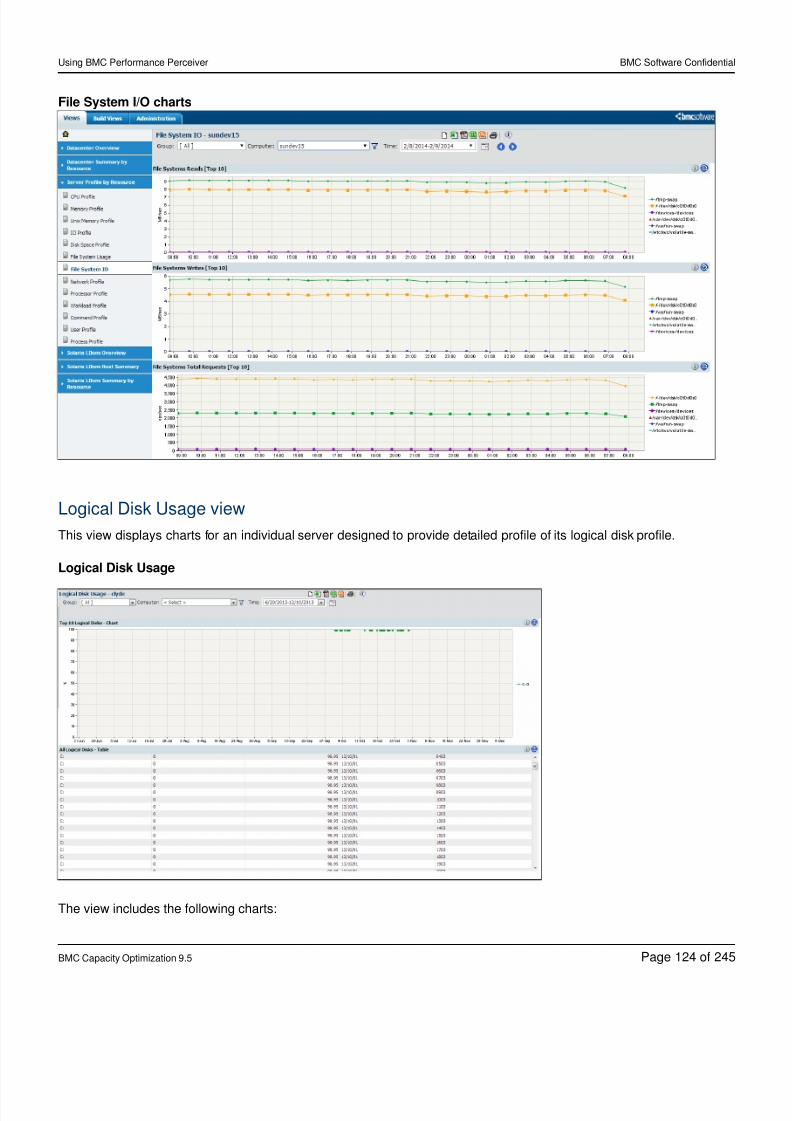
8/21/2019 Using BMC Performance Perceiver-V5-20141128_0503
http://slidepdf.com/reader/full/using-bmc-performance-perceiver-v5-201411280503 124/245
Using BMC Performance Perceiver BMC Software Confidential
BMC Capacity Optimization 9.5 Page of124 245
File System I/O charts
Logical Disk Usage view
This view displays charts for an individual server designed to provide detailed profile of its logical disk profile.
Logical Disk Usage
The view includes the following charts:
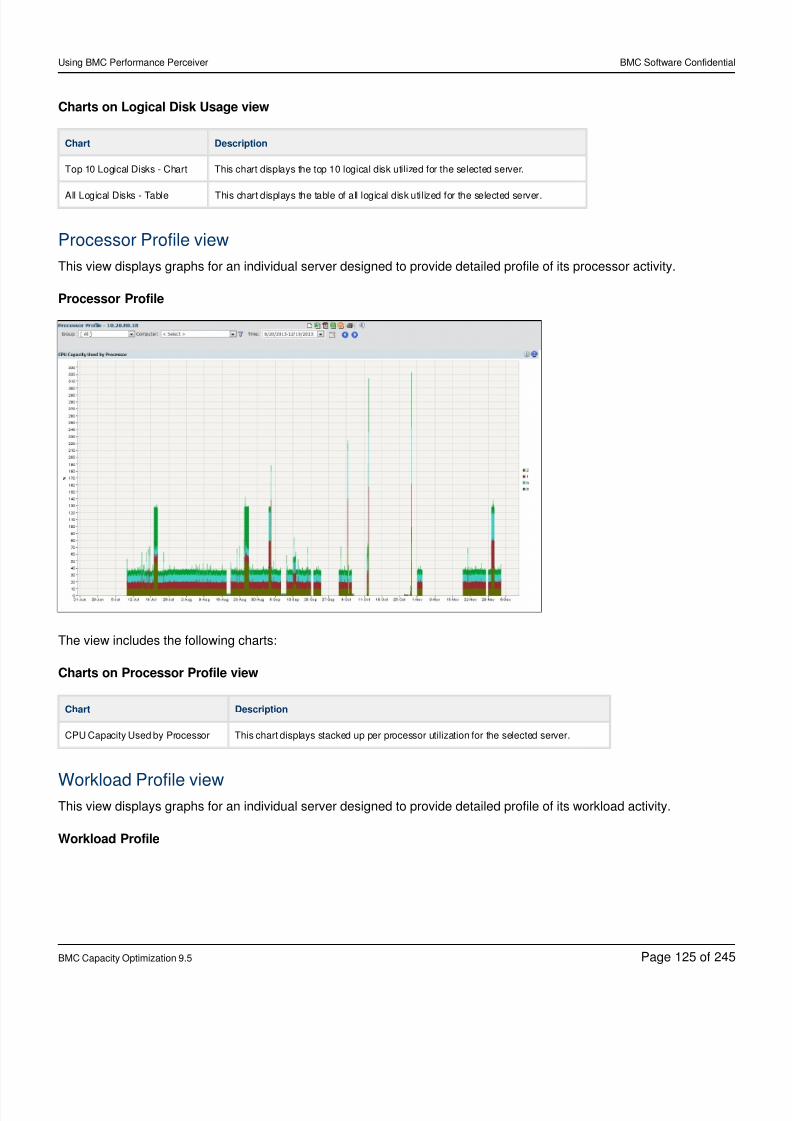
8/21/2019 Using BMC Performance Perceiver-V5-20141128_0503
http://slidepdf.com/reader/full/using-bmc-performance-perceiver-v5-201411280503 125/245
Using BMC Performance Perceiver BMC Software Confidential
BMC Capacity Optimization 9.5 Page of125 245
Charts on Logical Disk Usage view
Chart Description
Top 10 Logical Disks - Chart This chart displays the top 10 logical disk utilized for the selected server.
All Logical Disks - Table This chart displays the table of all logical disk utilized for the selected server.
Processor Profile view
This view displays graphs for an individual server designed to provide detailed profile of its processor activity.
Processor Profile
The view includes the following charts:
Charts on Processor Profile view
Chart Description
CPU Capacity Used by Processor This chart displays stacked up per processor utilization for the selected server.
Workload Profile viewThis view displays graphs for an individual server designed to provide detailed profile of its workload activity.
Workload Profile
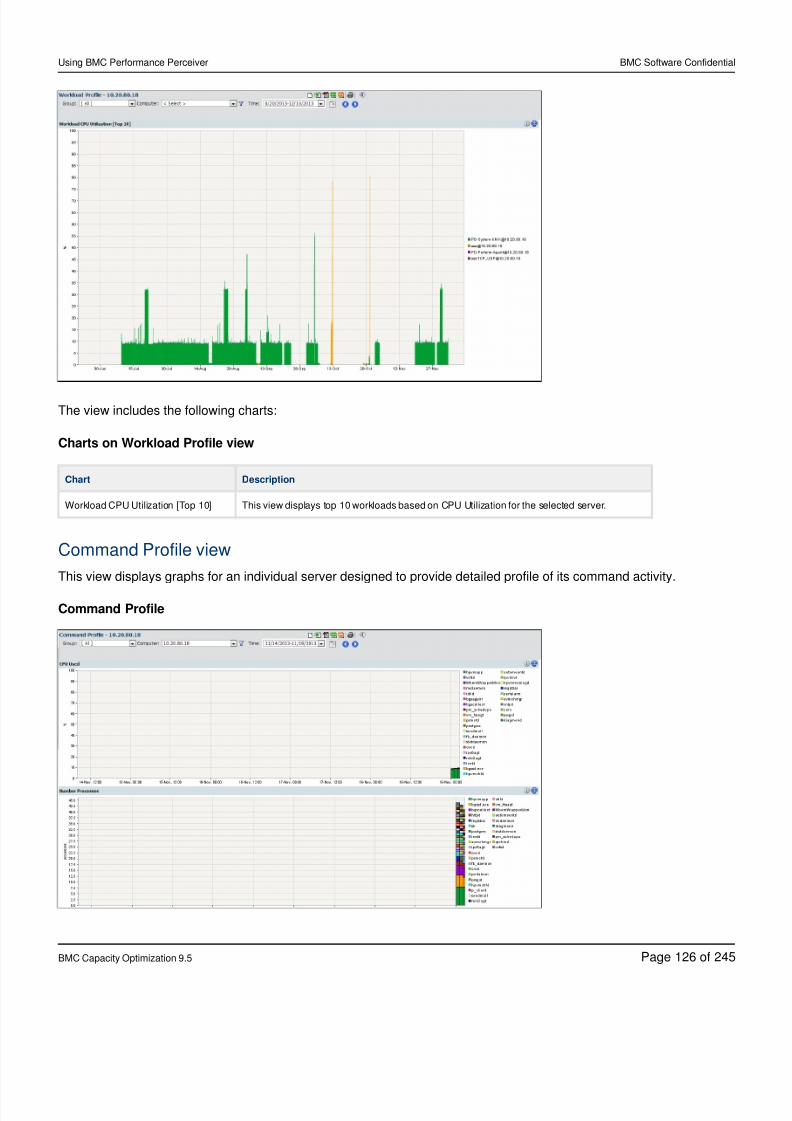
8/21/2019 Using BMC Performance Perceiver-V5-20141128_0503
http://slidepdf.com/reader/full/using-bmc-performance-perceiver-v5-201411280503 126/245
Using BMC Performance Perceiver BMC Software Confidential
BMC Capacity Optimization 9.5 Page of126 245
The view includes the following charts:
Charts on Workload Profile view
Chart Description
Workload CPU Utilization [Top 10] This view displays top 10 workloads based on CPU Utilization for the selected server.
Command Profile view
This view displays graphs for an individual server designed to provide detailed profile of its command activity.
Command Profile
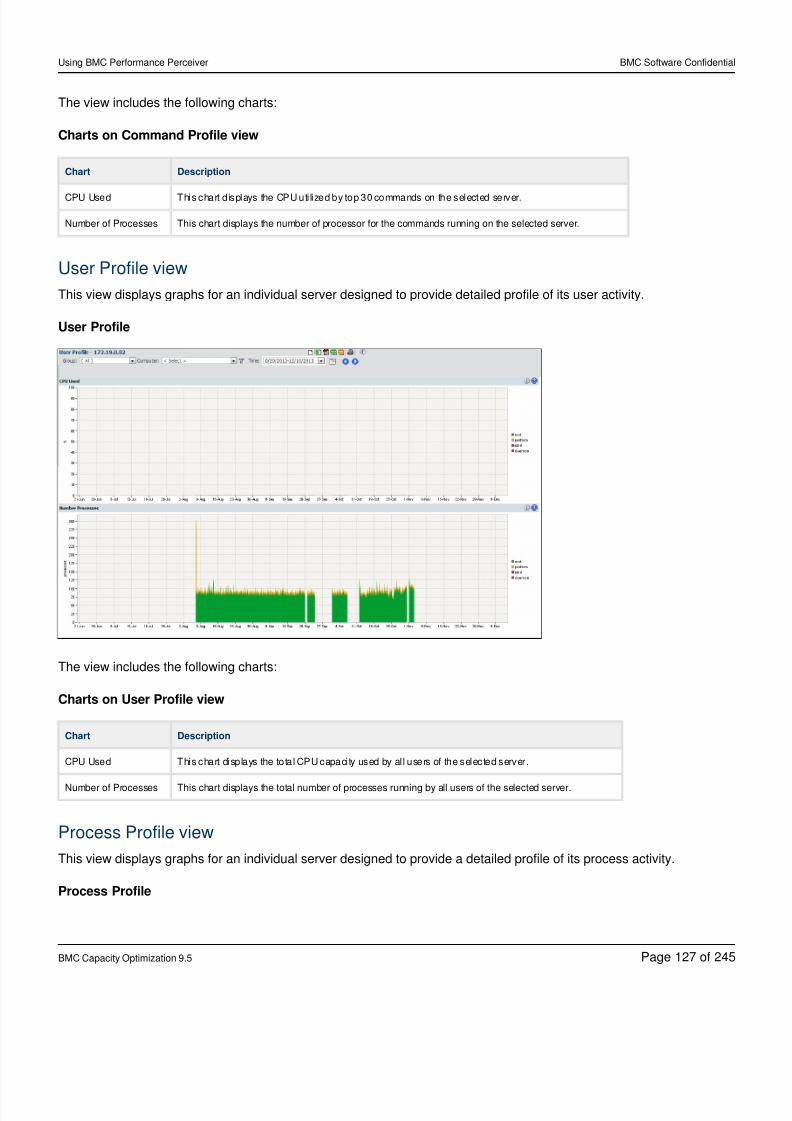
8/21/2019 Using BMC Performance Perceiver-V5-20141128_0503
http://slidepdf.com/reader/full/using-bmc-performance-perceiver-v5-201411280503 127/245
Using BMC Performance Perceiver BMC Software Confidential
BMC Capacity Optimization 9.5 Page of127 245
The view includes the following charts:
Charts on Command Profile view
Chart Description
CPU Used This chart displays the CPU uti lized by top 30 commands on the selected server.
Number of Processes This chart displays the number of processor for the commands running on the selected server.
User Profile view
This view displays graphs for an individual server designed to provide detailed profile of its user activity.
User Profile
The view includes the following charts:
Charts on User Profile view
Chart Description
CPU Used This chart displays the total CPU capacity used by all users of the selected server.
Number of Processes This chart displays the total number of processes running by all users of the selected server.
Process Profile view
This view displays graphs for an individual server designed to provide a detailed profile of its process activity.
Process Profile
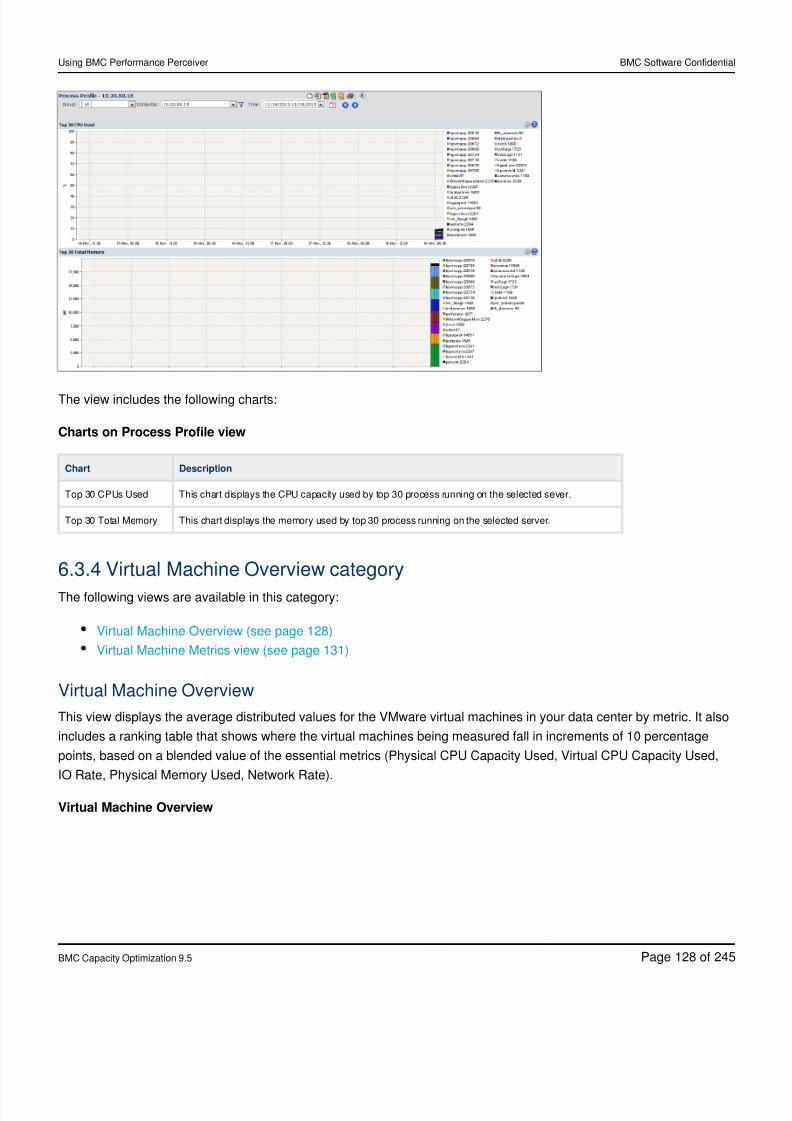
8/21/2019 Using BMC Performance Perceiver-V5-20141128_0503
http://slidepdf.com/reader/full/using-bmc-performance-perceiver-v5-201411280503 128/245
Using BMC Performance Perceiver BMC Software Confidential
BMC Capacity Optimization 9.5 Page of128 245
The view includes the following charts:
Charts on Process Profile view
Chart Description
Top 30 CPUs Used This chart displays the CPU capacity used by top 30 process running on the selected sever.
Top 30 Total Memory This chart displays the memory used by top 30 process running on the selected server.
6.3.4 Virtual Machine Overview category
The following views are available in this category:
Virtual Machine Overview (see page 128)
Virtual Machine Metrics view (see page 131)
Virtual Machine Overview
This view displays the average distributed values for the VMware virtual machines in your data center by metric. It also
includes a ranking table that shows where the virtual machines being measured fall in increments of 10 percentage
points, based on a blended value of the essential metrics (Physical CPU Capacity Used, Virtual CPU Capacity Used,
IO Rate, Physical Memory Used, Network Rate).
Virtual Machine Overview
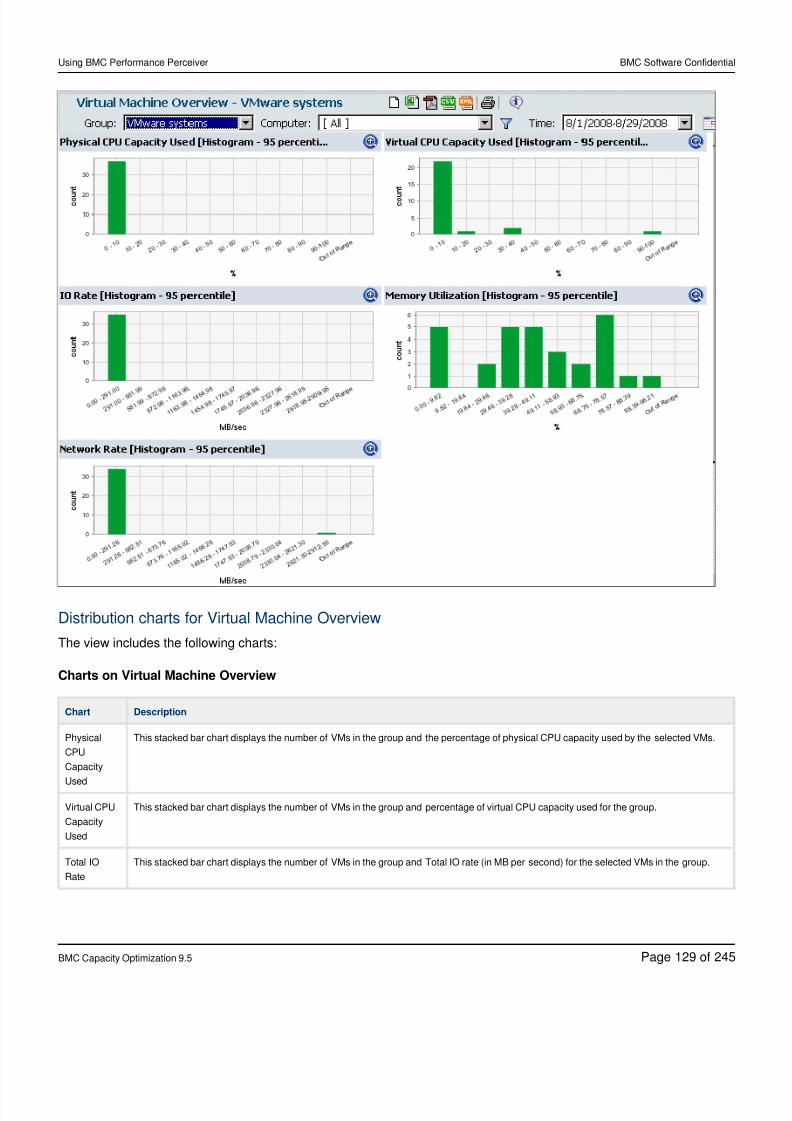
8/21/2019 Using BMC Performance Perceiver-V5-20141128_0503
http://slidepdf.com/reader/full/using-bmc-performance-perceiver-v5-201411280503 129/245
Using BMC Performance Perceiver BMC Software Confidential
BMC Capacity Optimization 9.5 Page of129 245
Distribution charts for Virtual Machine Overview
The view includes the following charts:
Charts on Virtual Machine Overview
Chart Description
Physical
CPU
Capacity
Used
This stacked bar chart displays the number of VMs in the group and the percentage of physical CPU capacity used by the selected VMs.
Virtual CPU
Capacity
Used
This stacked bar chart displays the number of VMs in the group and percentage of virtual CPU capacity used for the group.
Total IO
Rate
This stacked bar chart displays the number of VMs in the group and Total IO rate (in MB per second) for the selected VMs in the group.
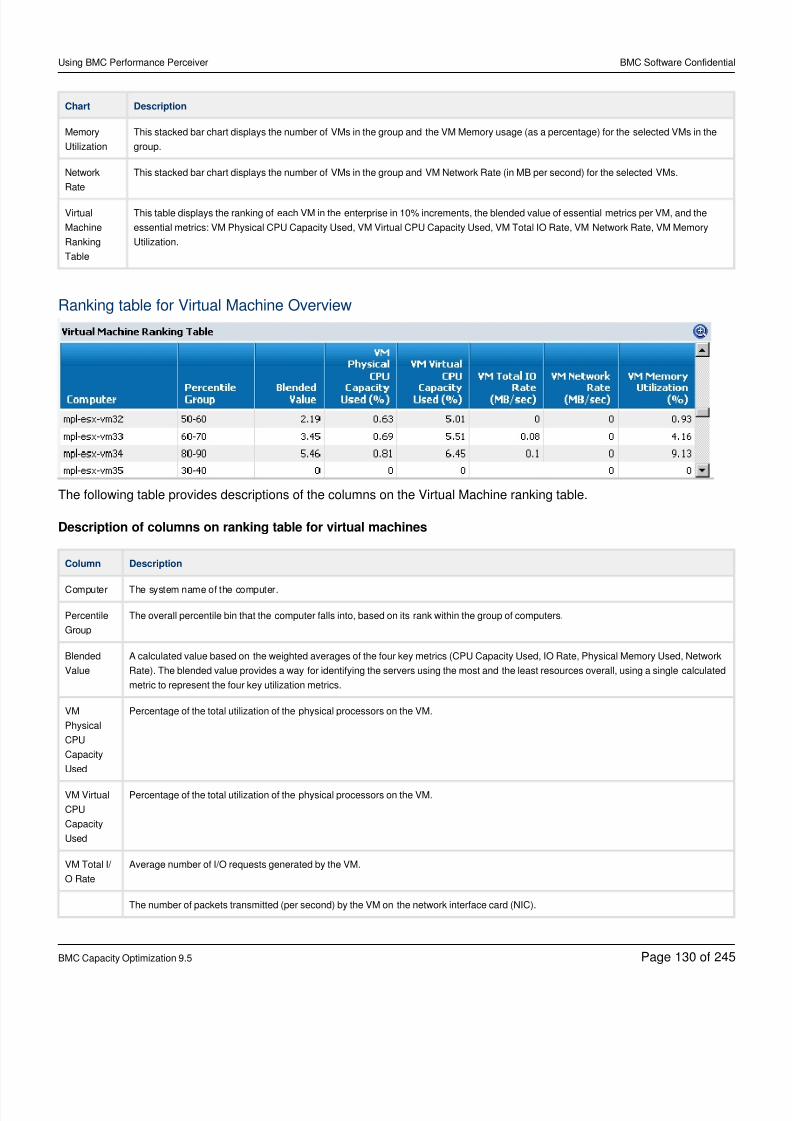
8/21/2019 Using BMC Performance Perceiver-V5-20141128_0503
http://slidepdf.com/reader/full/using-bmc-performance-perceiver-v5-201411280503 130/245
Using BMC Performance Perceiver BMC Software Confidential
BMC Capacity Optimization 9.5 Page of130 245
Chart Description
Memory
Utilization
This stacked bar chart displays the number of VMs in the group and the VM Memory usage (as a percentage) for the selected VMs in the
group.
Network
Rate
This stacked bar chart displays the number of VMs in the group and VM Network Rate (in MB per second) for the selected VMs.
Virtual
Machine
Ranking
Table
This table displays the ranking of each VM in the enterprise in 10% increments, the blended value of essential metrics per VM, and the
essential metrics: VM Physical CPU Capacity Used, VM Virtual CPU Capacity Used, VM Total IO Rate, VM Network Rate, VM Memory
Utilization.
Ranking table for Virtual Machine Overview
The following table provides descriptions of the columns on the Virtual Machine ranking table.
Description of columns on ranking table for virtual machines
Column Description
Computer The system name of the computer.
Percentile
Group
The overall percentile bin that the computer falls into, based on its rank within the group of computers.
Blended
Value
A calculated value based on the weighted averages of the four key metrics (CPU Capacity Used, IO Rate, Physical Memory Used, Network
Rate). The blended value provides a way for identifying the servers using the most and the least resources overall, using a single calculated
metric to represent the four key utilization metrics.
VM
Physical
CPU
Capacity
Used
Percentage of the total utilization of the physical processors on the VM.
VM Virtual
CPU
Capacity
Used
Percentage of the total utilization of the physical processors on the VM.
VM Total I/
O Rate
Average number of I/O requests generated by the VM.
The number of packets transmitted (per second) by the VM on the network interface card (NIC).
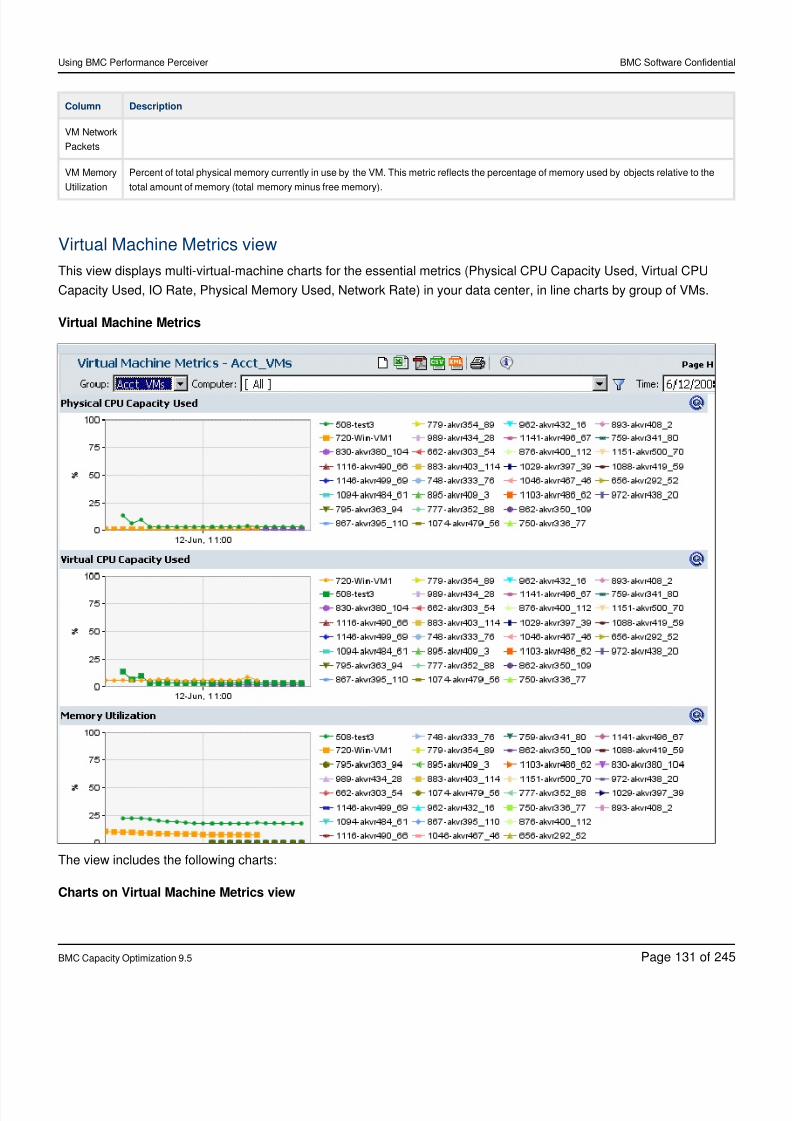
8/21/2019 Using BMC Performance Perceiver-V5-20141128_0503
http://slidepdf.com/reader/full/using-bmc-performance-perceiver-v5-201411280503 131/245
Using BMC Performance Perceiver BMC Software Confidential
BMC Capacity Optimization 9.5 Page of131 245
Column Description
VM Network
Packets
VM Memory
Utilization
Percent of total physical memory currently in use by the VM. This metric reflects the percentage of memory used by objects relative to the
total amount of memory (total memory minus free memory).
Virtual Machine Metrics view
This view displays multi-virtual-machine charts for the essential metrics (Physical CPU Capacity Used, Virtual CPU
Capacity Used, IO Rate, Physical Memory Used, Network Rate) in your data center, in line charts by group of VMs.
Virtual Machine Metrics
The view includes the following charts:
Charts on Virtual Machine Metrics view
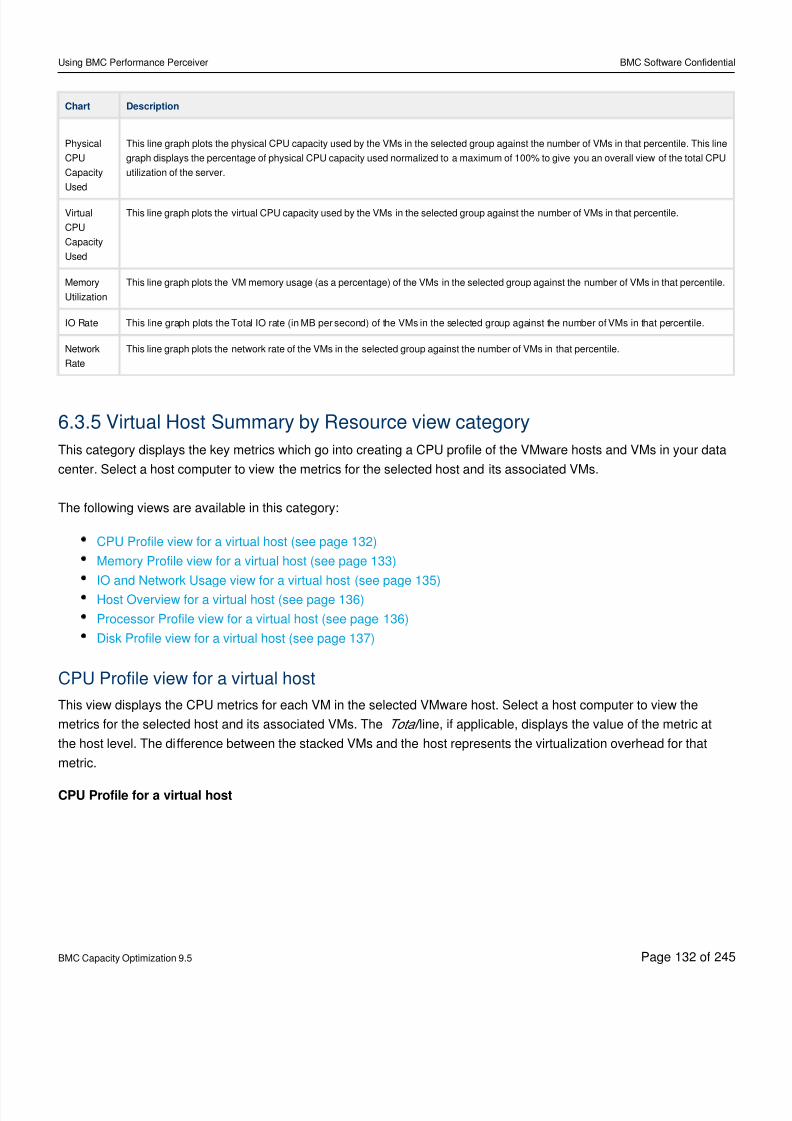
8/21/2019 Using BMC Performance Perceiver-V5-20141128_0503
http://slidepdf.com/reader/full/using-bmc-performance-perceiver-v5-201411280503 132/245
Using BMC Performance Perceiver BMC Software Confidential
BMC Capacity Optimization 9.5 Page of132 245
Chart Description
Physical
CPU
Capacity
Used
This line graph plots the physical CPU capacity used by the VMs in the selected group against the number of VMs in that percentile. This line
graph displays the percentage of physical CPU capacity used normalized to a maximum of 100% to give you an overall view of the total CPU
utilization of the server.
Virtual
CPU
Capacity
Used
This line graph plots the virtual CPU capacity used by the VMs in the selected group against the number of VMs in that percentile.
Memory
Utilization
This line graph plots the VM memory usage (as a percentage) of the VMs in the selected group against the number of VMs in that percentile.
IO Rate This line graph plots the Total IO rate (in MB per second) of the VMs in the selected group against the number of VMs in that percentile.
Network
Rate
This line graph plots the network rate of the VMs in the selected group against the number of VMs in that percentile.
6.3.5 Virtual Host Summary by Resource view category
This category displays the key metrics which go into creating a CPU profile of the VMware hosts and VMs in your data
center. Select a host computer to view the metrics for the selected host and its associated VMs.
The following views are available in this category:
CPU Profile view for a virtual host (see page 132)
Memory Profile view for a virtual host (see page 133)
IO and Network Usage view for a virtual host (see page 135)
Host Overview for a virtual host (see page 136)
Processor Profile view for a virtual host (see page 136)
Disk Profile view for a virtual host (see page 137)
CPU Profile view for a virtual host
This view displays the CPU metrics for each VM in the selected VMware host. Select a host computer to view the
metrics for the selected host and its associated VMs. The line, if applicable, displays the value of the metric atTotal
the host level. The difference between the stacked VMs and the host represents the virtualization overhead for that
metric.
CPU Profile for a virtual host
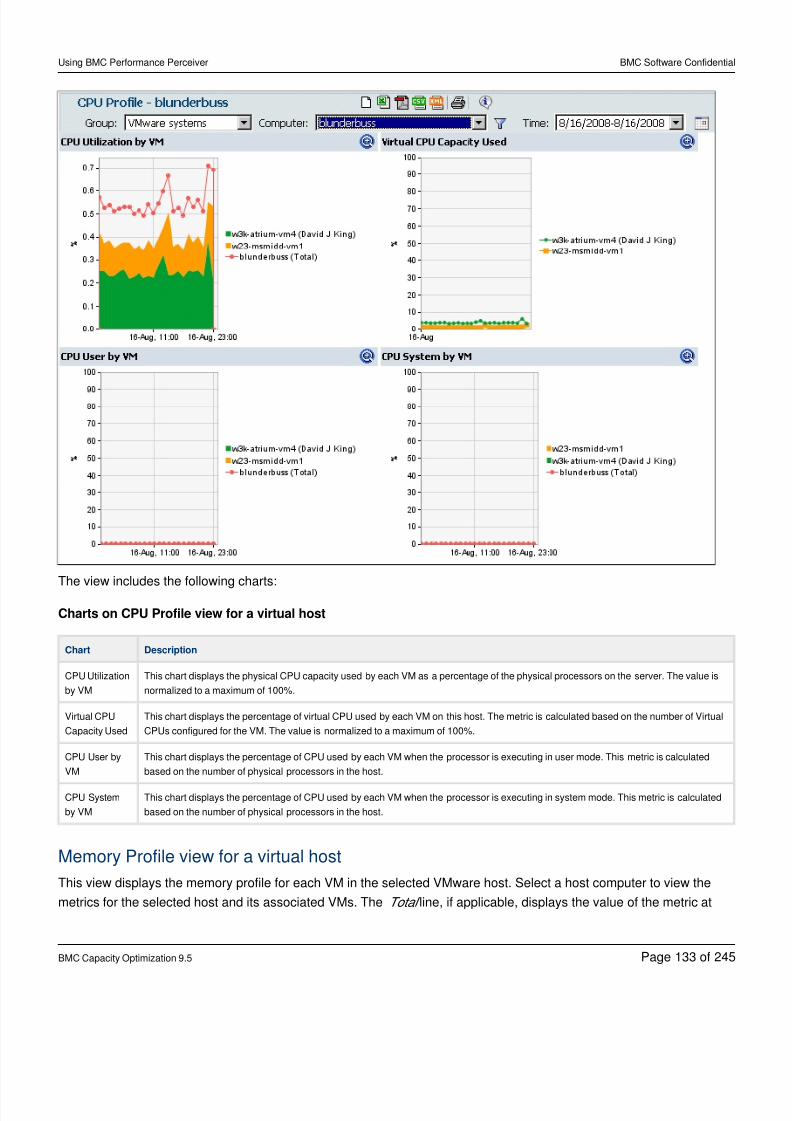
8/21/2019 Using BMC Performance Perceiver-V5-20141128_0503
http://slidepdf.com/reader/full/using-bmc-performance-perceiver-v5-201411280503 133/245
Using BMC Performance Perceiver BMC Software Confidential
BMC Capacity Optimization 9.5 Page of133 245
The view includes the following charts:
Charts on CPU Profile view for a virtual host
Chart Description
CPU Utilization
by VM
This chart displays the physical CPU capacity used by each VM as a percentage of the physical processors on the server. The value is
normalized to a maximum of 100%.
Virtual CPU
Capacity Used
This chart displays the percentage of virtual CPU used by each VM on this host. The metric is calculated based on the number of Virtual
CPUs configured for the VM. The value is normalized to a maximum of 100%.
CPU User by
VM
This chart displays the percentage of CPU used by each VM when the processor is executing in user mode. This metric is calculated
based on the number of physical processors in the host.
CPU System
by VM
This chart displays the percentage of CPU used by each VM when the processor is executing in system mode. This metric is calculated
based on the number of physical processors in the host.
Memory Profile view for a virtual host
This view displays the memory profile for each VM in the selected VMware host. Select a host computer to view the
metrics for the selected host and its associated VMs. The line, if applicable, displays the value of the metric atTotal
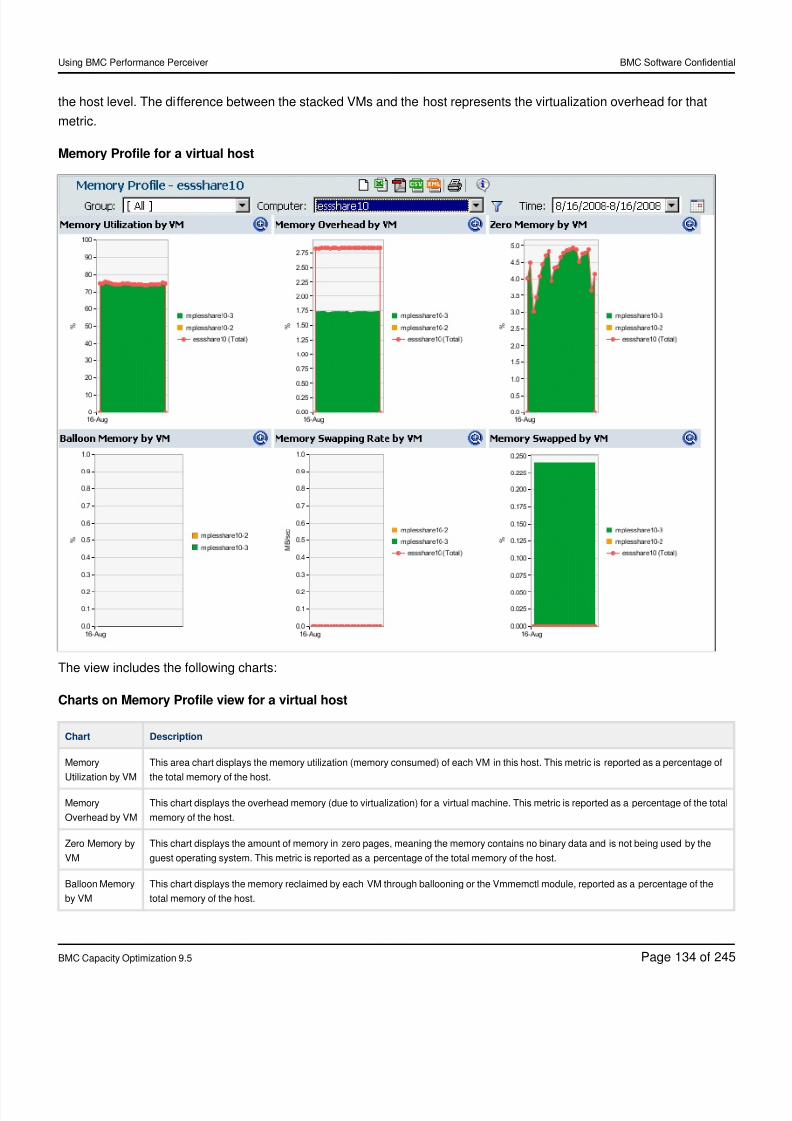
8/21/2019 Using BMC Performance Perceiver-V5-20141128_0503
http://slidepdf.com/reader/full/using-bmc-performance-perceiver-v5-201411280503 134/245
Using BMC Performance Perceiver BMC Software Confidential
BMC Capacity Optimization 9.5 Page of134 245
the host level. The difference between the stacked VMs and the host represents the virtualization overhead for that
metric.
Memory Profile for a virtual host
The view includes the following charts:
Charts on Memory Profile view for a virtual host
Chart Description
Memory
Utilization by VM
This area chart displays the memory utilization (memory consumed) of each VM in this host. This metric is reported as a percentage of
the total memory of the host.
Memory
Overhead by VM
This chart displays the overhead memory (due to virtualization) for a virtual machine. This metric is reported as a percentage of the total
memory of the host.
Zero Memory by
VM
This chart displays the amount of memory in zero pages, meaning the memory contains no binary data and is not being used by the
guest operating system. This metric is reported as a percentage of the total memory of the host.
Balloon Memory
by VM
This chart displays the memory reclaimed by each VM through ballooning or the Vmmemctl module, reported as a percentage of the
total memory of the host.
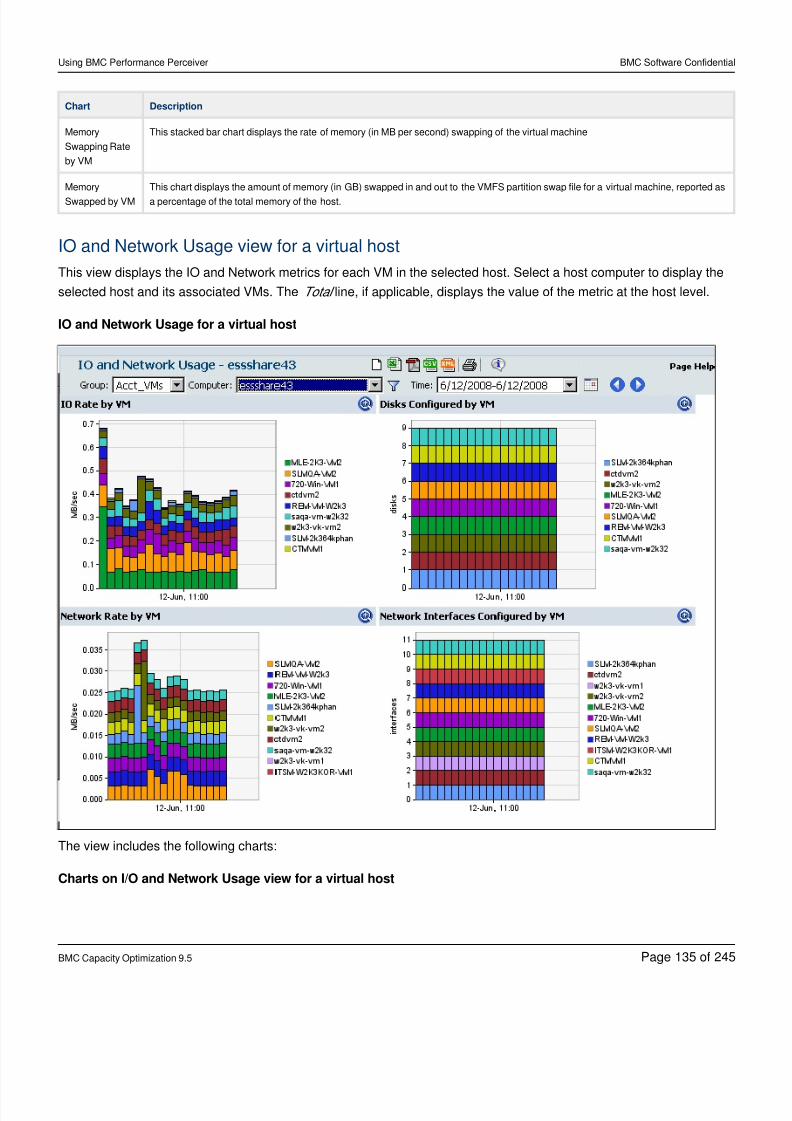
8/21/2019 Using BMC Performance Perceiver-V5-20141128_0503
http://slidepdf.com/reader/full/using-bmc-performance-perceiver-v5-201411280503 135/245
Using BMC Performance Perceiver BMC Software Confidential
BMC Capacity Optimization 9.5 Page of135 245
Chart Description
Memory
Swapping Rate
by VM
This stacked bar chart displays the rate of memory (in MB per second) swapping of the virtual machine
Memory
Swapped by VM
This chart displays the amount of memory (in GB) swapped in and out to the VMFS partition swap file for a virtual machine, reported as
a percentage of the total memory of the host.
IO and Network Usage view for a virtual host
This view displays the IO and Network metrics for each VM in the selected host. Select a host computer to display the
selected host and its associated VMs. The line, if applicable, displays the value of the metric at the host level.Total
IO and Network Usage for a virtual host
The view includes the following charts:
Charts on I/O and Network Usage view for a virtual host
8/21/2019 Using BMC Performance Perceiver-V5-20141128_0503
http://slidepdf.com/reader/full/using-bmc-performance-perceiver-v5-201411280503 136/245
Using BMC Performance Perceiver BMC Software Confidential
BMC Capacity Optimization 9.5 Page of136 245
Chart Description
IO Rate by VM This chart displays the total IO rate (in MB per second) for the selected VMware server and each of its VMs.
Disks Configured by VM This chart displays the number of configured disks for the selected VMware server and each of its VMs.
Network Rate by VM This chart displays the rate of network activity (in MB per second) for the selected VMware server and each of its VMs
.
Network Interfaces Configured by
VM
This chart displays the number of network interfaces that are configured for the selected VMware server and each of
its VMs.
Host Overview for a virtual host
This view displays multi-server charts for the essential metrics (Physical CPU Capacity Used, Average Virtual CPU
Used, Host Queue per Processor and Physical Memory Used) in your datacenter, in line charts by group of VMware
host servers.
The view includes the following charts.
Chart Description
Physical CPU Used This chart displays the percentage of physical CPU used for the selected virtual host. The value is normalized to a maximum of
100%.
Virtual CPU Used This chart displays the percentage of virtual CPU used for the selected virtual host. The value is normalized to a maximum of
100%.
Host Queue per
Processor
This chart displays the VM host queue per processor for the selected host.
Memory Used This chart displays the memory used for the selected host.
Processor Profile view for a virtual host
This view displays the per processor utilization configured on the selected VMware host.
Processor Profile
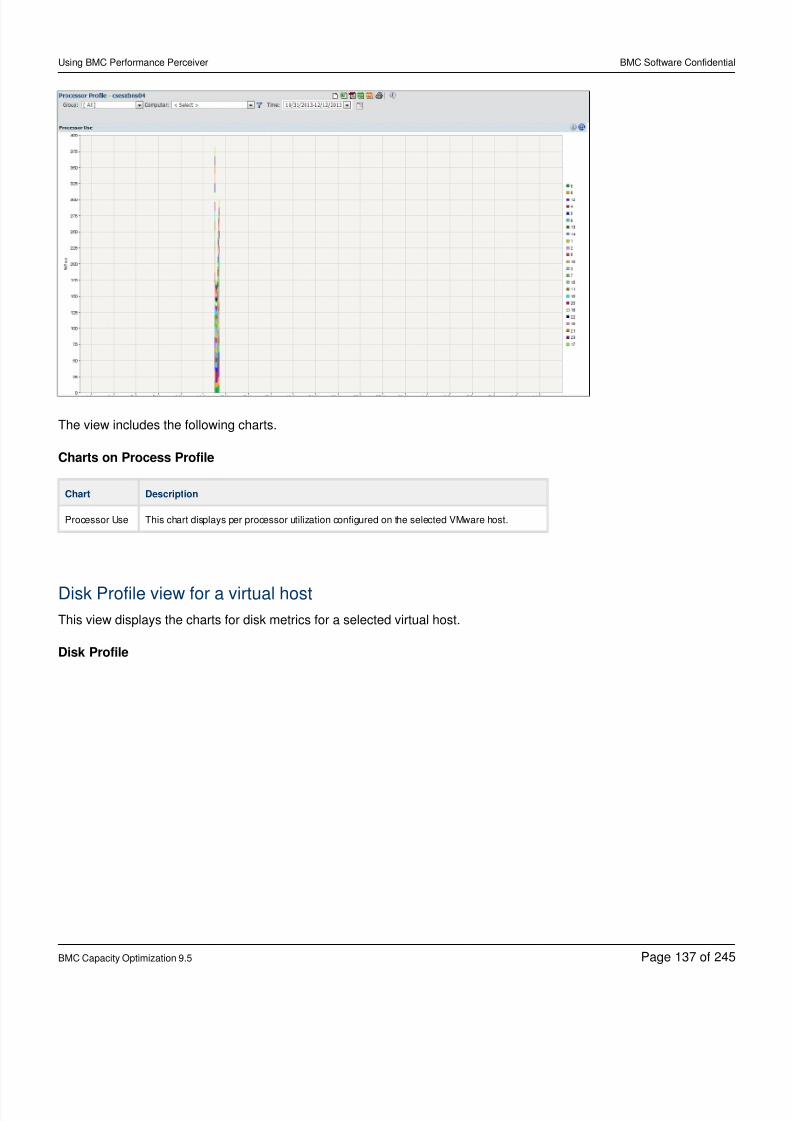
8/21/2019 Using BMC Performance Perceiver-V5-20141128_0503
http://slidepdf.com/reader/full/using-bmc-performance-perceiver-v5-201411280503 137/245
Using BMC Performance Perceiver BMC Software Confidential
BMC Capacity Optimization 9.5 Page of137 245
The view includes the following charts.
Charts on Process Profile
Chart Description
Processor Use This chart displays per processor utilization configured on the selected VMware host.
Disk Profile view for a virtual host
This view displays the charts for disk metrics for a selected virtual host.
Disk Profile
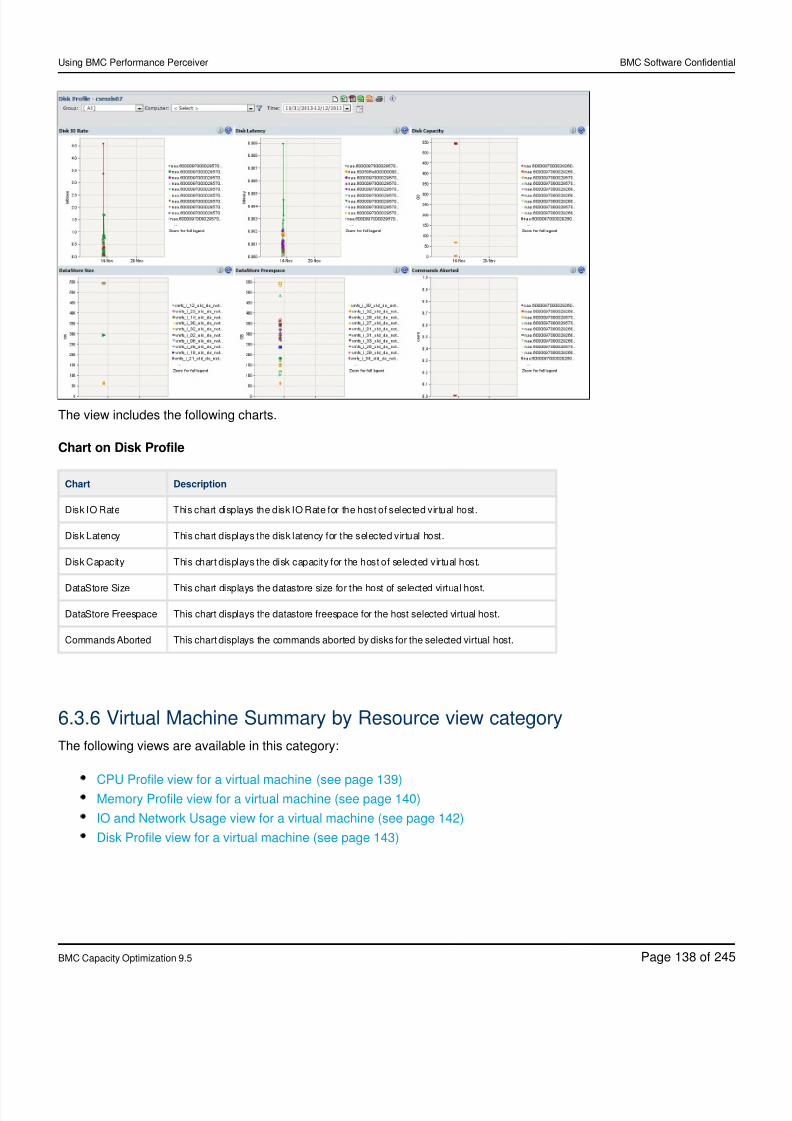
8/21/2019 Using BMC Performance Perceiver-V5-20141128_0503
http://slidepdf.com/reader/full/using-bmc-performance-perceiver-v5-201411280503 138/245
Using BMC Performance Perceiver BMC Software Confidential
BMC Capacity Optimization 9.5 Page of138 245
The view includes the following charts.
Chart on Disk Profile
Chart Description
Disk IO Rate This chart displays the disk IO Rate for the host of selected virtual host.
Disk Latency This chart displays the disk latency for the selected virtual host.
Disk Capacity This chart displays the disk capacity for the host of selected virtual host.
DataStore Size This chart displays the datastore size for the host of selected virtual host.
DataStore Freespace This chart displays the datastore freespace for the host selected virtual host.
Commands Aborted This chart displays the commands aborted by disks for the selected virtual host.
6.3.6 Virtual Machine Summary by Resource view category
The following views are available in this category:
CPU Profile view for a virtual machine (see page 139)Memory Profile view for a virtual machine (see page 140)
IO and Network Usage view for a virtual machine (see page 142)
Disk Profile view for a virtual machine (see page 143)
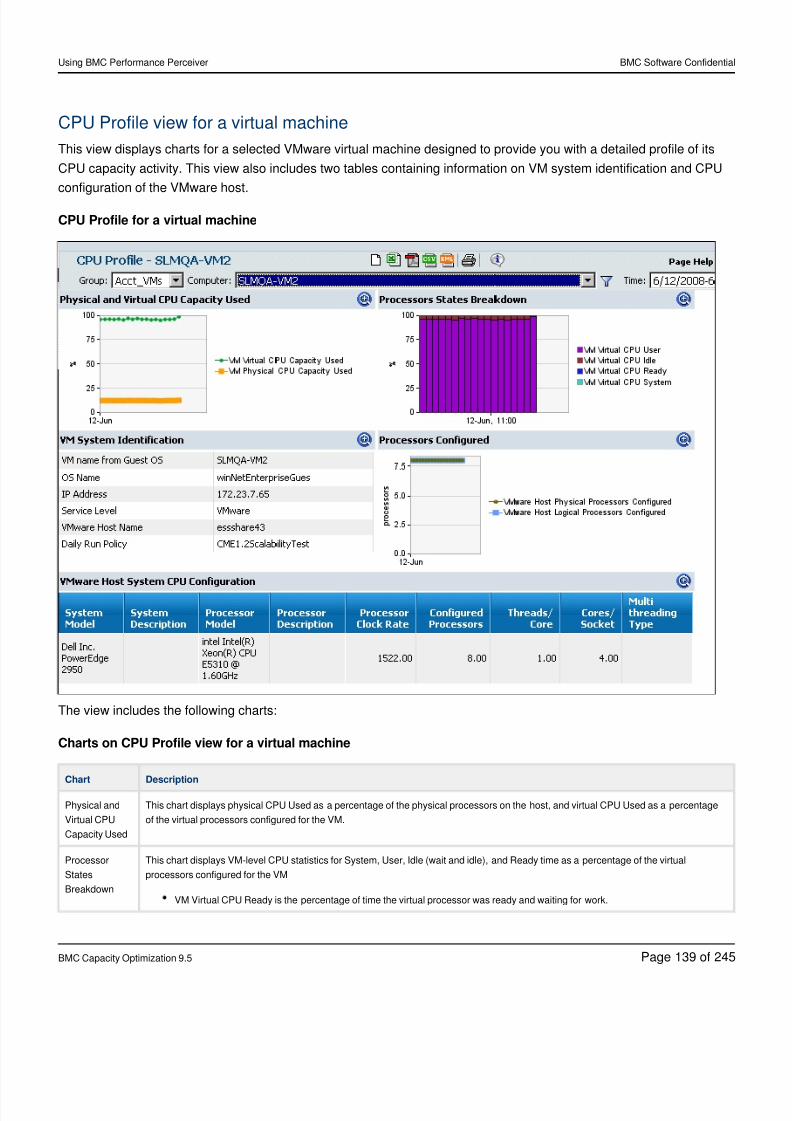
8/21/2019 Using BMC Performance Perceiver-V5-20141128_0503
http://slidepdf.com/reader/full/using-bmc-performance-perceiver-v5-201411280503 139/245
Using BMC Performance Perceiver BMC Software Confidential
BMC Capacity Optimization 9.5 Page of139 245
CPU Profile view for a virtual machine
This view displays charts for a selected VMware virtual machine designed to provide you with a detailed profile of its
CPU capacity activity. This view also includes two tables containing information on VM system identification and CPU
configuration of the VMware host.
CPU Profile for a virtual machine
The view includes the following charts:
Charts on CPU Profile view for a virtual machine
Chart Description
Physical and
Virtual CPU
Capacity Used
This chart displays physical CPU Used as a percentage of the physical processors on the host, and virtual CPU Used as a percentage
of the virtual processors configured for the VM.
Processor
States
Breakdown
This chart displays VM-level CPU statistics for System, User, Idle (wait and idle), and Ready time as a percentage of the virtual
processors configured for the VM
VM Virtual CPU Ready is the percentage of time the virtual processor was ready and waiting for work.
8/21/2019 Using BMC Performance Perceiver-V5-20141128_0503
http://slidepdf.com/reader/full/using-bmc-performance-perceiver-v5-201411280503 140/245
Using BMC Performance Perceiver BMC Software Confidential
BMC Capacity Optimization 9.5 Page of140 245
Chart Description
VM Virtual CPU idle is the percentage of time the virtual processor spent in the idle state.
VM Virtual CPU user is the time the virtual processor spends executing in user mode (for example, executing applications or
subsystems).
VM Virtual CPU system time is the time the virtual processor spends executing operating system tasks that support the
applications and subsystems (all CPU tasks that were not executing applications).
VM System
Identification
table
This table displays a text chart that provides VMware host configuration information for the measurement data. It also contains attributes
that pertain to the type of operating system that is run on the VM, and information about the service level that was used to collect the
measurement data. The chart provides system configuration information, such as:
A description of the server (if available).
The name of the Daily Run policy in which the server included for data collection.
The name of the domain to which the server belongs.
The IP address of the server.
The version number of the operating system running on the server.
The Service Level for the data collection, which is Bronze for Perceiver.
The host name designated for the server.
The operating system running on the server.
The serial number for the server.
Processors
Configured
This chart displays the number of physical and logical processors that are configured on the VMware host. It also charts the number of
virtual processors configured for the VM.
VMware Host
System CPU
Configuration
table
This chart displays a text chart that provides the system configuration information for the VMware host. The chart is useful in asset
identification. You will see multiple entries in this chart if the VM is moved from one server to another (Vmotion) within the selected
interval. The chart provides hardware information for the host, such as:
The CPU model of the server, for example a Dell PowerEdge 2550.
The processor description (manufacturer and processor type).
The processor clock rate.
The type of multi-threading technology in use, if any (such as HyperThreading, SMT, and CMT)
The number of processors configured for the server.The number of threads per core.
The number of cores per CPU socket.
A description of the processor model.
The system board, or baseboard model for the server.
The Collect Mode, or data collection method (such as proxy host or Perform Agent).
A description of the server (if available).
The start time represents the data and time in the collected data when the server CPU model. information was first identified. This
value is useful to see when the server CPU is upgraded.
Memory Profile view for a virtual machine
This view displays charts for a selected VMware virtual machine designed to provide a detailed profile of its memoryusage. The memory usages in this view are reported as a percentage of memory configured for the virtual machine.
Memory Profile for a virtual machine
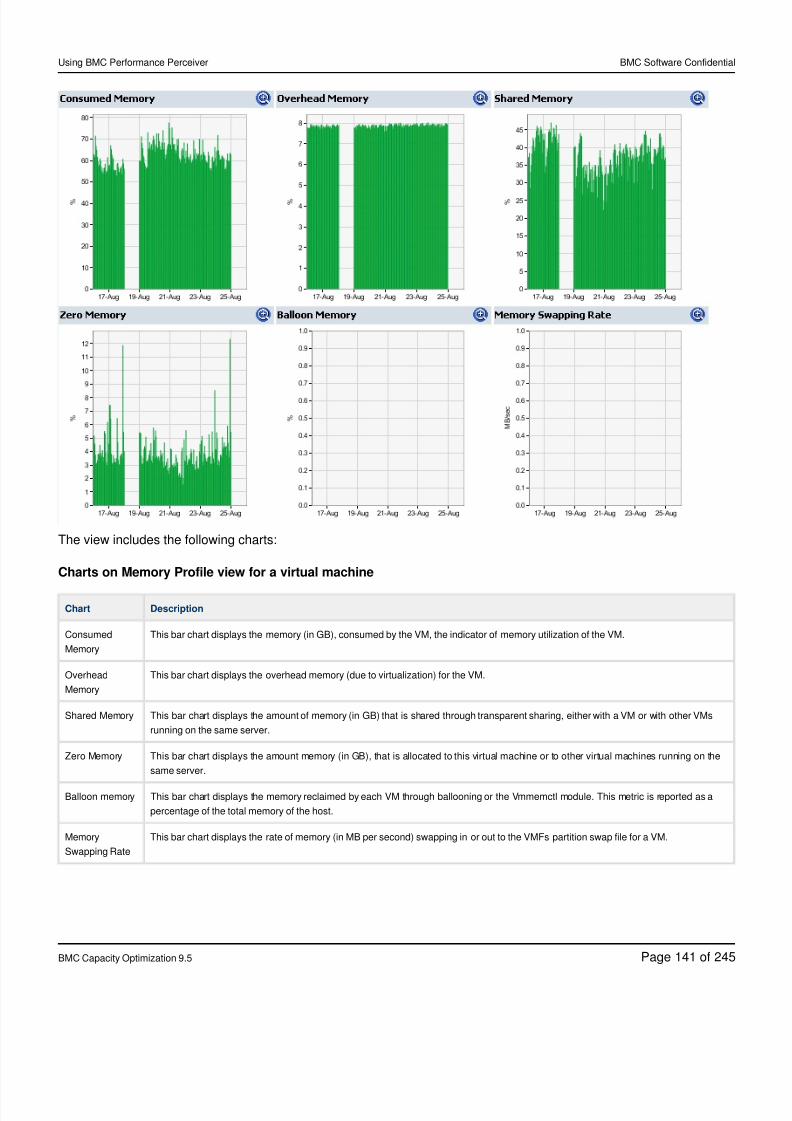
8/21/2019 Using BMC Performance Perceiver-V5-20141128_0503
http://slidepdf.com/reader/full/using-bmc-performance-perceiver-v5-201411280503 141/245
Using BMC Performance Perceiver BMC Software Confidential
BMC Capacity Optimization 9.5 Page of141 245
The view includes the following charts:
Charts on Memory Profile view for a virtual machine
Chart Description
Consumed
Memory
This bar chart displays the memory (in GB), consumed by the VM, the indicator of memory utilization of the VM.
Overhead
Memory
This bar chart displays the overhead memory (due to virtualization) for the VM.
Shared Memory This bar chart displays the amount of memory (in GB) that is shared through transparent sharing, either with a VM or with other VMs
running on the same server.
Zero Memory This bar chart displays the amount memory (in GB), that is allocated to this virtual machine or to other virtual machines running on the
same server.
Balloon memory This bar chart displays the memory reclaimed by each VM through ballooning or the Vmmemctl module. This metric is reported as a
percentage of the total memory of the host.
Memory
Swapping Rate
This bar chart displays the rate of memory (in MB per second) swapping in or out to the VMFs partition swap file for a VM.
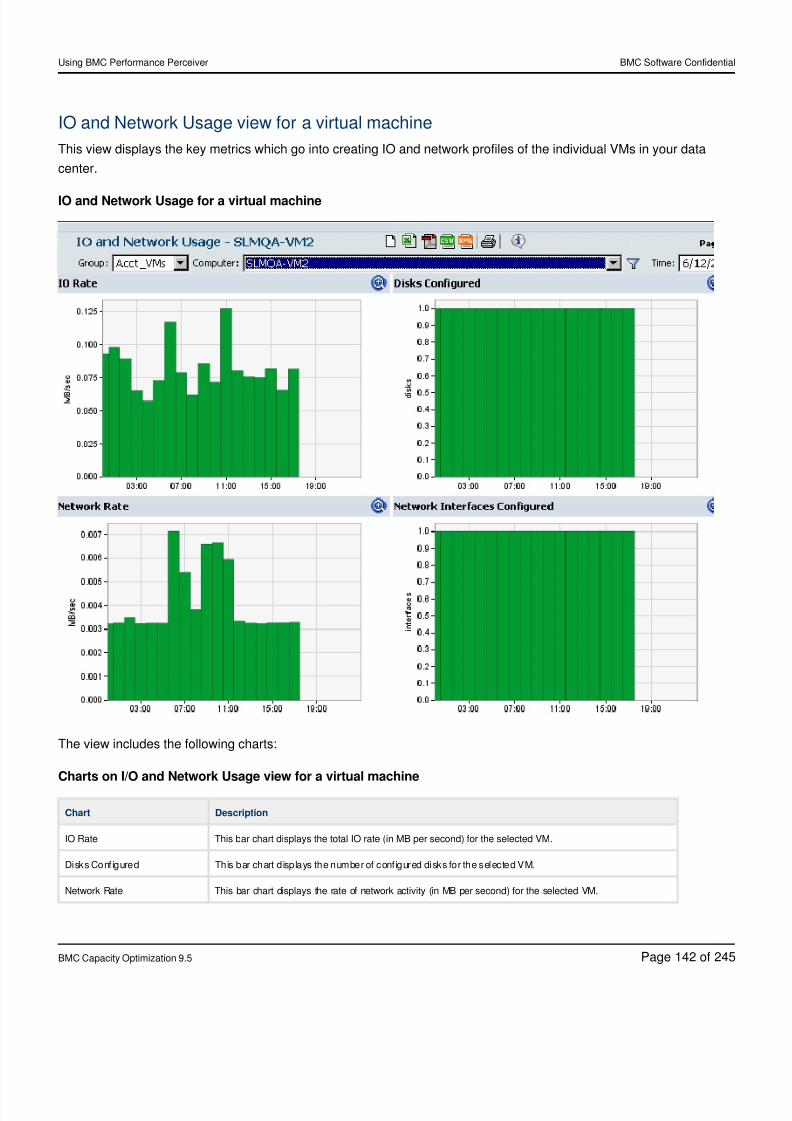
8/21/2019 Using BMC Performance Perceiver-V5-20141128_0503
http://slidepdf.com/reader/full/using-bmc-performance-perceiver-v5-201411280503 142/245
Using BMC Performance Perceiver BMC Software Confidential
BMC Capacity Optimization 9.5 Page of142 245
IO and Network Usage view for a virtual machine
This view displays the key metrics which go into creating IO and network profiles of the individual VMs in your data
center.
IO and Network Usage for a virtual machine
The view includes the following charts:
Charts on I/O and Network Usage view for a virtual machine
Chart Description
IO Rate This bar chart displays the total IO rate (in MB per second) for the selected VM.
Disks Conf igured This bar chart displays the number of conf igured disks for the selected VM.
Network Rate This bar chart displays the rate of network activity (in MB per second) for the selected VM.
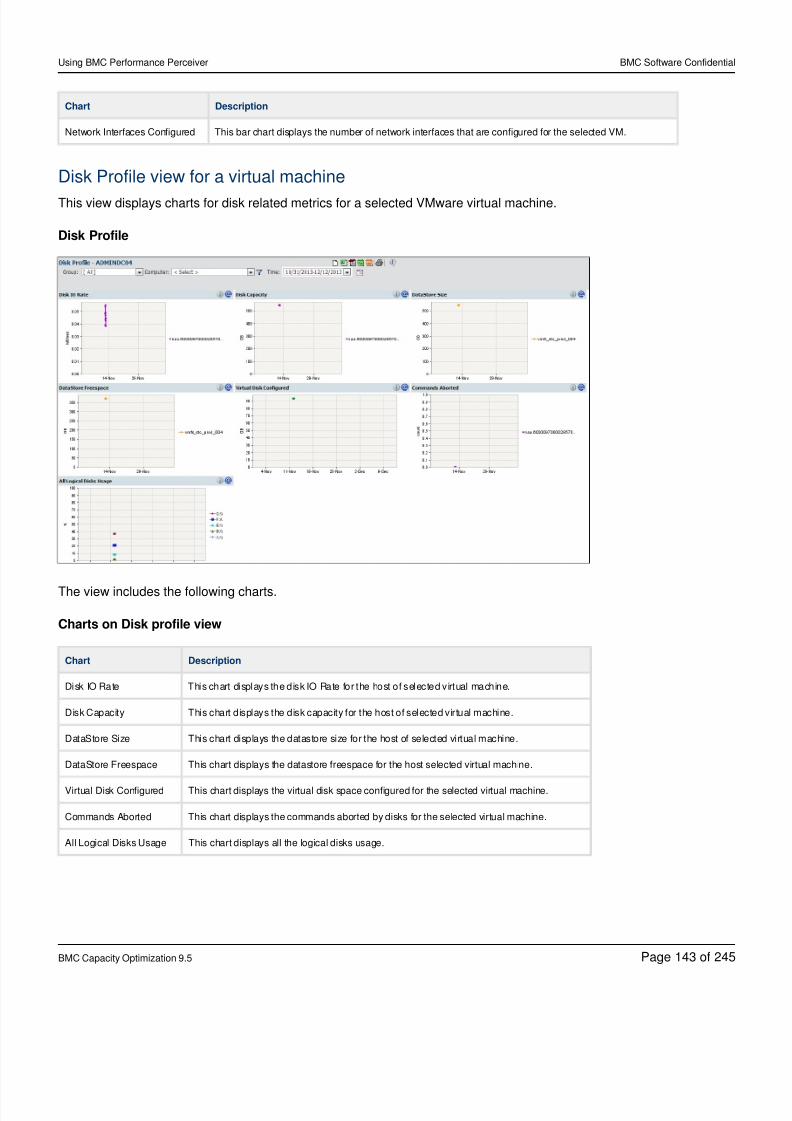
8/21/2019 Using BMC Performance Perceiver-V5-20141128_0503
http://slidepdf.com/reader/full/using-bmc-performance-perceiver-v5-201411280503 143/245
Using BMC Performance Perceiver BMC Software Confidential
BMC Capacity Optimization 9.5 Page of143 245
Chart Description
Network Interfaces Configured This bar chart displays the number of network interfaces that are configured for the selected VM.
Disk Profile view for a virtual machine
This view displays charts for disk related metrics for a selected VMware virtual machine.
Disk Profile
The view includes the following charts.
Charts on Disk profile view
Chart Description
Disk IO Rate This chart displays the disk IO Rate for the host of selected virtual machine.
Disk Capacity This chart displays the disk capacity for the host of selected virtual machine.
DataStore Size This chart displays the datastore size for the host of selected virtual machine.
DataStore Freespace This chart displays the datastore freespace for the host selected virtual machine.
Virtual Disk Configured This chart displays the virtual disk space configured for the selected virtual machine.
Commands Aborted This chart displays the commands aborted by disks for the selected virtual machine.
All Logical Disks Usage This chart displays all the logical disks usage.
8/21/2019 Using BMC Performance Perceiver-V5-20141128_0503
http://slidepdf.com/reader/full/using-bmc-performance-perceiver-v5-201411280503 144/245
Using BMC Performance Perceiver BMC Software Confidential
BMC Capacity Optimization 9.5 Page of144 245
6.3.7 Resource Pool Summary view category
The following views are available in this category:
Resource Pool Overview (see page 144)
Resource Usage by Virtual Machine (see page 144)
Resource Pool Overview
This view displays charts like CPU Capacity Used, Memory Capacity Used, Swapped and Balloon memory for
selected groups of resource pools.
The view includes the following charts
Charts on Resource Pool Overview
Chart Description
CPU Usage -
GHz
This chart displays CPU used by the virtual machines in the selected resource pool reported in GHz. The total line shows the CPU
usage of the resource pool.
Memory Usage -
GB
This chart displays Memory used by the virtual machines in the resource pool reported in GB. The total line shows the memory usage
of the resource pool.
Swapped
Memory
This chart displays Swapped memory used by the virtual machines in the selected resource pool.
Balloon Memory This chart displays Balloon memory used by the virtual machines in the selected resource pool.
Resource Usage by Virtual Machine
The Resource Pool Usage by VM view is the only view available in this category.
Resource Pool Usage by VM view
This view displays CPU used by the virtual machines in the selected resource pool reported in MHz, Memory used by
the virtual machines in the resource pool reported in GB. The line shows the usage of the resource pool andTotal
resource pool configuration.
Resource Pool Usage by VM
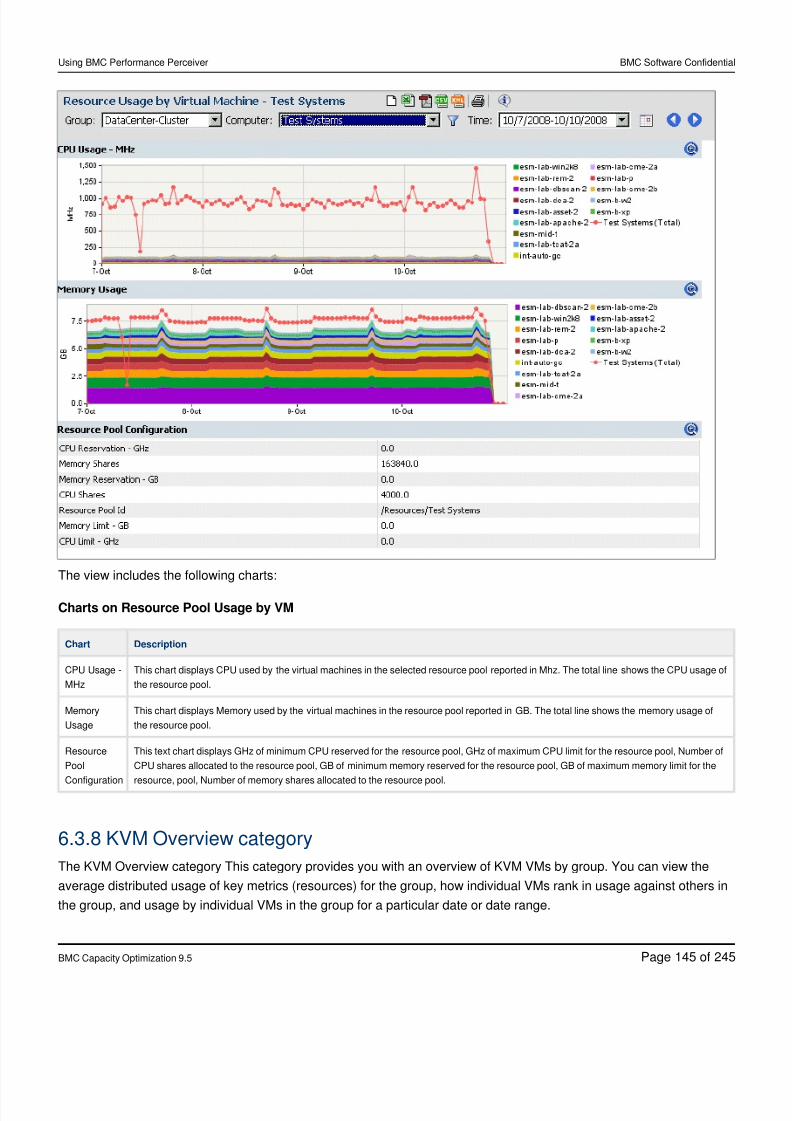
8/21/2019 Using BMC Performance Perceiver-V5-20141128_0503
http://slidepdf.com/reader/full/using-bmc-performance-perceiver-v5-201411280503 145/245
Using BMC Performance Perceiver BMC Software Confidential
BMC Capacity Optimization 9.5 Page of145 245
The view includes the following charts:
Charts on Resource Pool Usage by VM
Chart Description
CPU Usage -
MHz
This chart displays CPU used by the virtual machines in the selected resource pool reported in Mhz. The total line shows the CPU usage of
the resource pool.
Memory
Usage
This chart displays Memory used by the virtual machines in the resource pool reported in GB. The total line shows the memory usage of
the resource pool.
Resource
Pool
Configuration
This text chart displays GHz of minimum CPU reserved for the resource pool, GHz of maximum CPU limit for the resource pool, Number of
CPU shares allocated to the resource pool, GB of minimum memory reserved for the resource pool, GB of maximum memory limit for the
resource, pool, Number of memory shares allocated to the resource pool.
6.3.8 KVM Overview category
The KVM Overview category This category provides you with an overview of KVM VMs by group. You can view the
average distributed usage of key metrics (resources) for the group, how individual VMs rank in usage against others in
the group, and usage by individual VMs in the group for a particular date or date range.
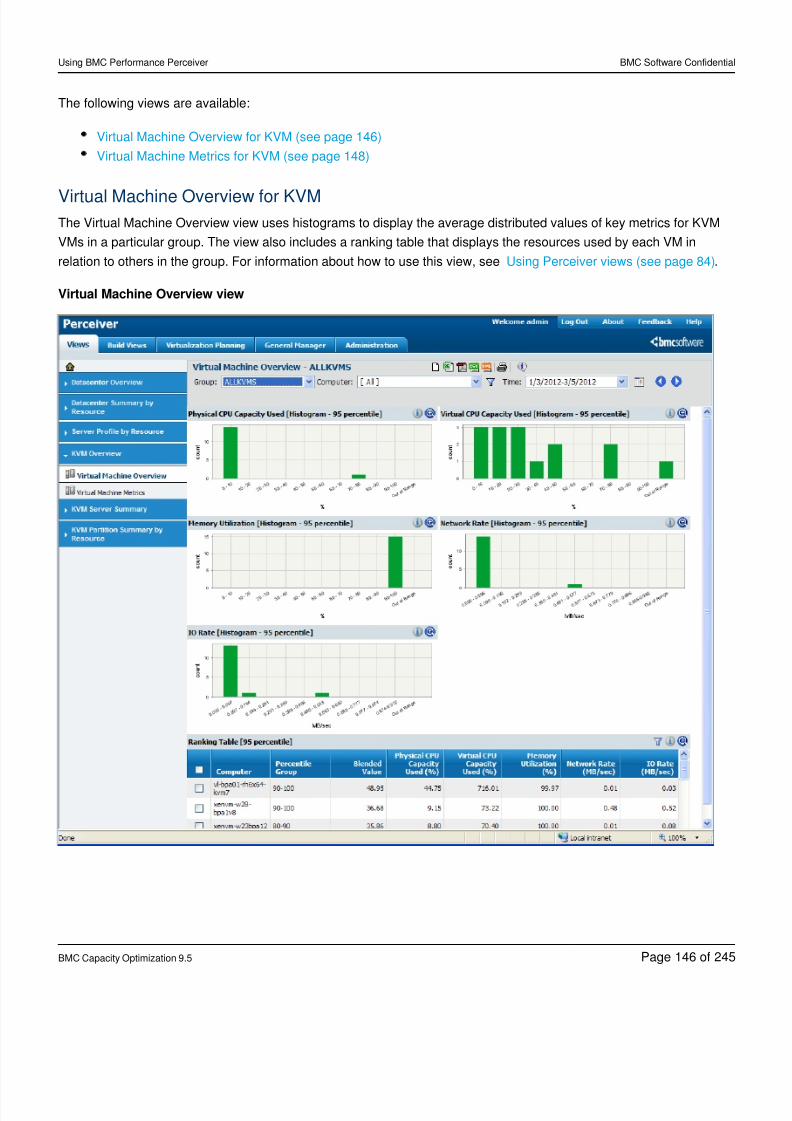
8/21/2019 Using BMC Performance Perceiver-V5-20141128_0503
http://slidepdf.com/reader/full/using-bmc-performance-perceiver-v5-201411280503 146/245
Using BMC Performance Perceiver BMC Software Confidential
BMC Capacity Optimization 9.5 Page of146 245
The following views are available:
Virtual Machine Overview for KVM (see page 146)
Virtual Machine Metrics for KVM (see page 148)
Virtual Machine Overview for KVMThe Virtual Machine Overview view uses histograms to display the average distributed values of key metrics for KVM
VMs in a particular group. The view also includes a ranking table that displays the resources used by each VM in
relation to others in the group. For information about how to use this view, see .Using Perceiver views (see page 84)
Virtual Machine Overview view
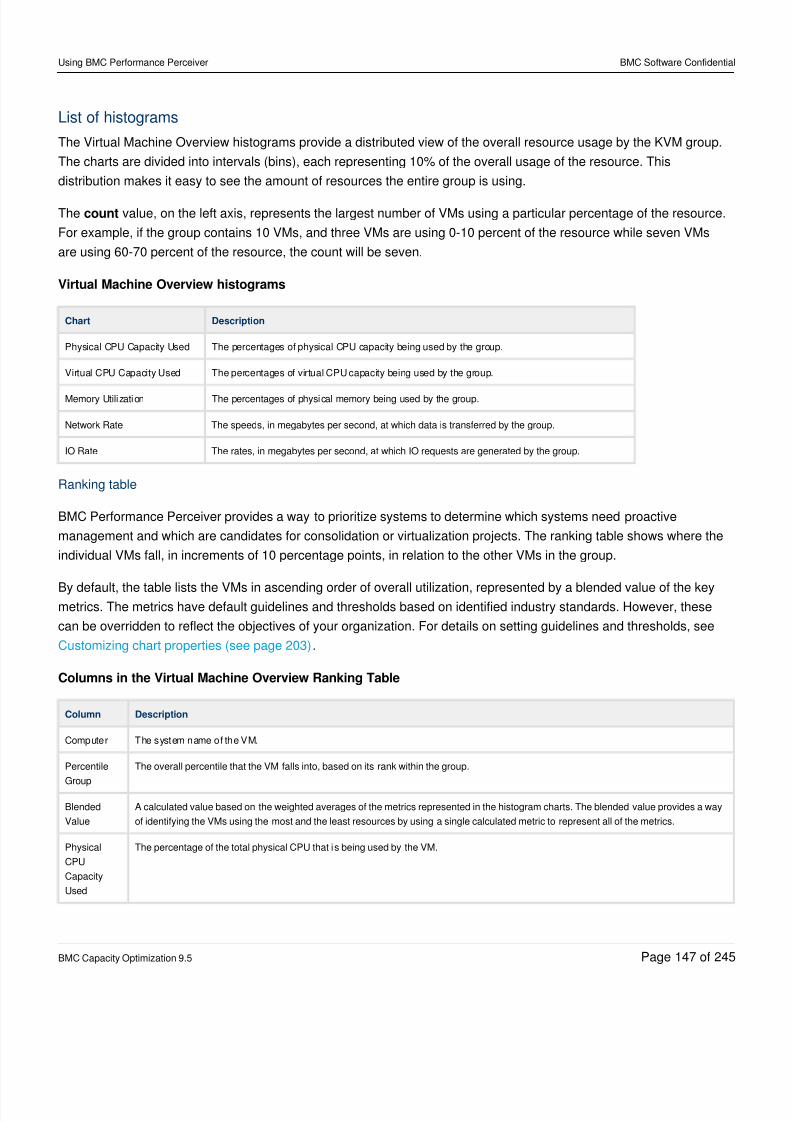
8/21/2019 Using BMC Performance Perceiver-V5-20141128_0503
http://slidepdf.com/reader/full/using-bmc-performance-perceiver-v5-201411280503 147/245
Using BMC Performance Perceiver BMC Software Confidential
BMC Capacity Optimization 9.5 Page of147 245
List of histograms
The Virtual Machine Overview histograms provide a distributed view of the overall resource usage by the KVM group.
The charts are divided into intervals (bins), each representing 10% of the overall usage of the resource. This
distribution makes it easy to see the amount of resources the entire group is using.
The value, on the left axis, represents the largest number of VMs using a particular percentage of the resource.count
For example, if the group contains 10 VMs, and three VMs are using 0-10 percent of the resource while seven VMs
are using 60-70 percent of the resource, the count will be seven.
Virtual Machine Overview histograms
Chart Description
Physical CPU Capacity Used The percentages of physical CPU capacity being used by the group.
Virtual CPU Capacity Used The percentages of virtual CPU capacity being used by the group.
Memory Utilization The percentages of physical memory being used by the group.
Network Rate The speeds, in megabytes per second, at which data is transferred by the group.
IO Rate The rates, in megabytes per second, at which IO requests are generated by the group.
Ranking table
BMC Performance Perceiver provides a way to prioritize systems to determine which systems need proactive
management and which are candidates for consolidation or virtualization projects. The ranking table shows where the
individual VMs fall, in increments of 10 percentage points, in relation to the other VMs in the group.
By default, the table lists the VMs in ascending order of overall utilization, represented by a blended value of the keymetrics. The metrics have default guidelines and thresholds based on identified industry standards. However, these
can be overridden to reflect the objectives of your organization. For details on setting guidelines and thresholds, see
.Customizing chart properties (see page 203)
Columns in the Virtual Machine Overview Ranking Table
Column Description
Computer The system name of the VM.
Percentile
Group
The overall percentile that the VM falls into, based on its rank within the group.
Blended
Value
A calculated value based on the weighted averages of the metrics represented in the histogram charts. The blended value provides a way
of identifying the VMs using the most and the least resources by using a single calculated metric to represent all of the metrics.
Physical
CPU
Capacity
Used
The percentage of the total physical CPU that is being used by the VM.
8/21/2019 Using BMC Performance Perceiver-V5-20141128_0503
http://slidepdf.com/reader/full/using-bmc-performance-perceiver-v5-201411280503 148/245
Using BMC Performance Perceiver BMC Software Confidential
BMC Capacity Optimization 9.5 Page of148 245
Column Description
Virtual CPU
Capacity
Used
The percentage of the total virtual CPU that is being used by the VM.
Memory
Utilization
Percent of total physical memory in use. This metric reflects the percentage of memory used by objects relative to the total amount of
memory (total memory minus free memory).
Network
Rate
The speed, in megabytes per second, at which data is transferred by the VM.
IO Rate The rate, in megabytes per second, at which IO requests are generated by the VM.
Virtual Machine Metrics for KVM
The Virtual Machine Metrics view uses line charts to display key metric usage data, by date, for the KVM VMs in a
particular group. The legend to the right of each chart indicates which line color and pattern matches each VM in the
group. For information about how to use this view, see .Using Perceiver views (see page 84)
Virtual Machine Metrics view
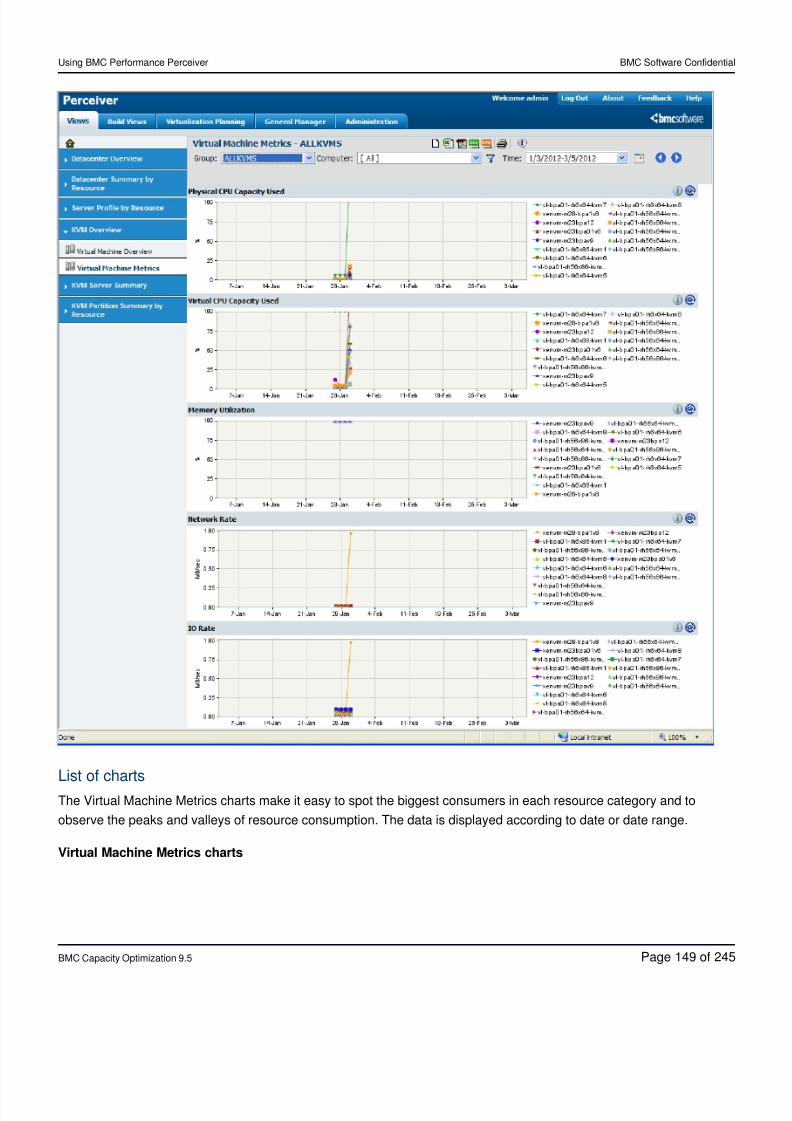
8/21/2019 Using BMC Performance Perceiver-V5-20141128_0503
http://slidepdf.com/reader/full/using-bmc-performance-perceiver-v5-201411280503 149/245
Using BMC Performance Perceiver BMC Software Confidential
BMC Capacity Optimization 9.5 Page of149 245
List of charts
The Virtual Machine Metrics charts make it easy to spot the biggest consumers in each resource category and to
observe the peaks and valleys of resource consumption. The data is displayed according to date or date range.
Virtual Machine Metrics charts
8/21/2019 Using BMC Performance Perceiver-V5-20141128_0503
http://slidepdf.com/reader/full/using-bmc-performance-perceiver-v5-201411280503 150/245
Using BMC Performance Perceiver BMC Software Confidential
BMC Capacity Optimization 9.5 Page of150 245
Chart Description
Physical CPU Capacity Used The percentage of physical CPU capacity being used by each VM.
Virtual CPU Capacity Used The percentage of virtual CPU capacity being used by each VM.
Memory Utilization The percentage of physical memory being used by each VM.
Network Rate Measured in megabytes per second, the speed at which data is transferred by each VM.
IO Rate Measured in megabytes per second, the rate at which IO requests are generated by each VM.
6.3.9 KVM Server Summary category
The KVM Server Summary category provides you with a detailed look at a selected KVM host. You can view VM, CPU
, disk, and network configuration, CPU activity, memory usage, and network transfer and IO rates for the host and its
VMs.
The following views are available:
CPU Profile for a KVM host (see page 150)
Memory Profile for a KVM host (see page 153)
Network and IO Profile for a KVM host (see page 154)
CPU Profile for a KVM host
The CPU Profile view uses line and bar charts and tables to provide a detailed profile of a selected KVM host and CPU
activity data for the VMs running on that host. For information about how to use this view, see Using Perceiver views (
.see page 84)
CPU Profile view
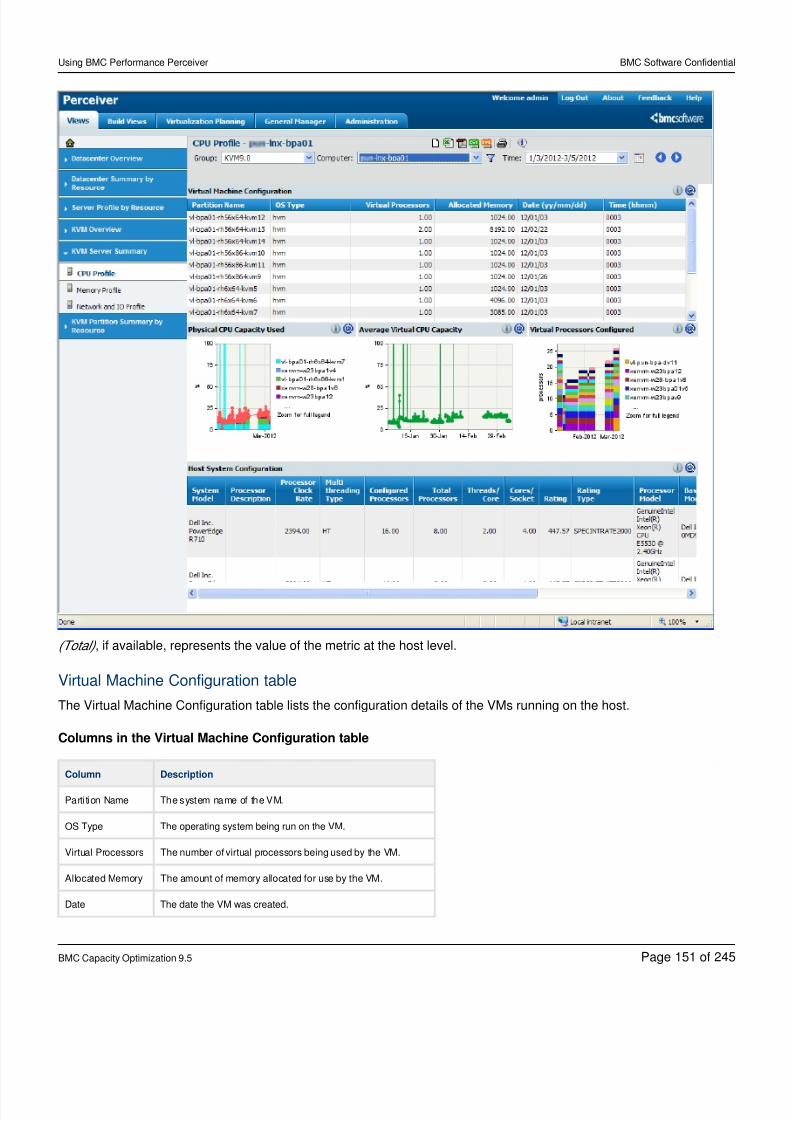
8/21/2019 Using BMC Performance Perceiver-V5-20141128_0503
http://slidepdf.com/reader/full/using-bmc-performance-perceiver-v5-201411280503 151/245
Using BMC Performance Perceiver BMC Software Confidential
BMC Capacity Optimization 9.5 Page of151 245
(Total) , if available, represents the value of the metric at the host level.
Virtual Machine Configuration table
The Virtual Machine Configuration table lists the configuration details of the VMs running on the host.
Columns in the Virtual Machine Configuration table
Column Description
Partition Name The system name of the VM.
OS Type The operating system being run on the VM.
Virtual Processors The number of virtual processors being used by the VM.
Allocated Memory The amount of memory allocated for use by the VM.
Date The date the VM was created.
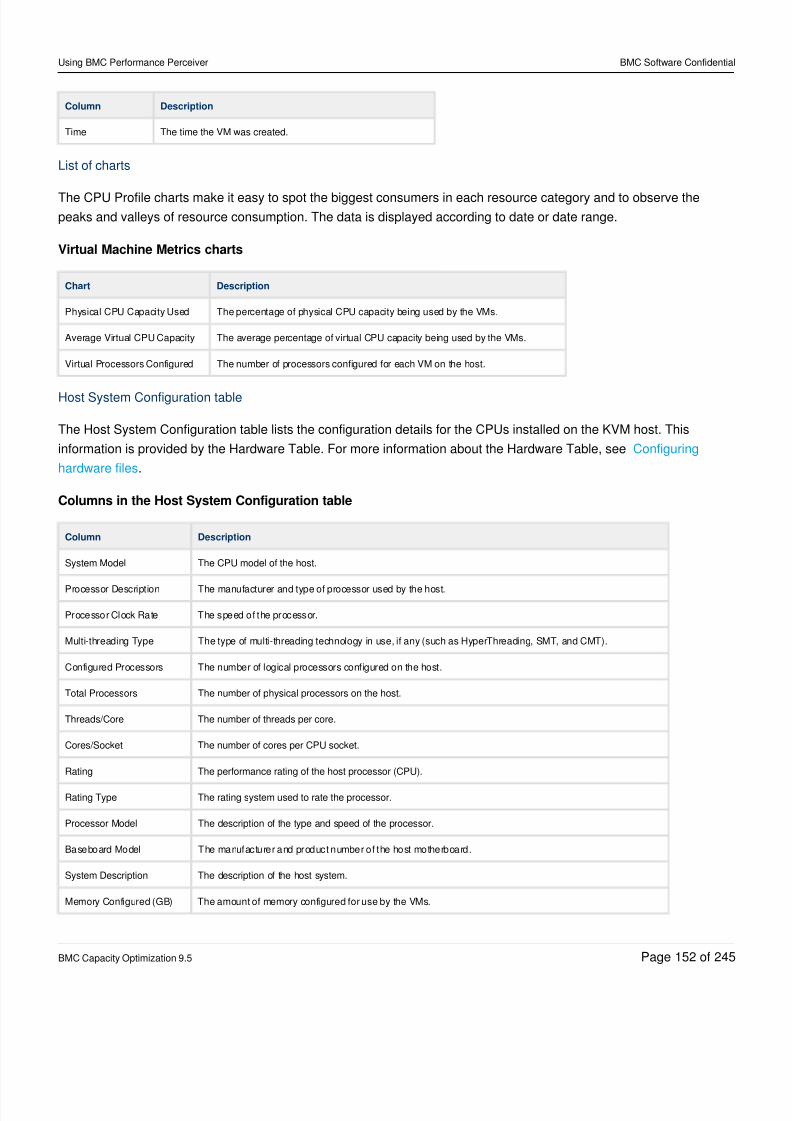
8/21/2019 Using BMC Performance Perceiver-V5-20141128_0503
http://slidepdf.com/reader/full/using-bmc-performance-perceiver-v5-201411280503 152/245
Using BMC Performance Perceiver BMC Software Confidential
BMC Capacity Optimization 9.5 Page of152 245
Column Description
Time The time the VM was created.
List of charts
The CPU Profile charts make it easy to spot the biggest consumers in each resource category and to observe thepeaks and valleys of resource consumption. The data is displayed according to date or date range.
Virtual Machine Metrics charts
Chart Description
Physical CPU Capacity Used The percentage of physical CPU capacity being used by the VMs.
Average Virtual CPU Capacity The average percentage of virtual CPU capacity being used by the VMs.
Virtual Processors Configured The number of processors configured for each VM on the host.
Host System Configuration table
The Host System Configuration table lists the configuration details for the CPUs installed on the KVM host. This
information is provided by the Hardware Table. For more information about the Hardware Table, see Configuring
.hardware files
Columns in the Host System Configuration table
Column Description
System Model The CPU model of the host.
Processor Description The manufacturer and type of processor used by the host.
Processor Clock Rate The speed of the processor.
Multi-threading Type The type of multi-threading technology in use, if any (such as HyperThreading, SMT, and CMT).
Configured Processors The number of logical processors configured on the host.
Total Processors The number of physical processors on the host.
Threads/Core The number of threads per core.
Cores/Socket The number of cores per CPU socket.
Rating The performance rating of the host processor (CPU).
Rating Type The rating system used to rate the processor.
Processor Model The description of the type and speed of the processor.
Baseboard Model The manufacturer and product number of the host motherboard.
System Description The description of the host system.
Memory Configured (GB) The amount of memory configured for use by the VMs.
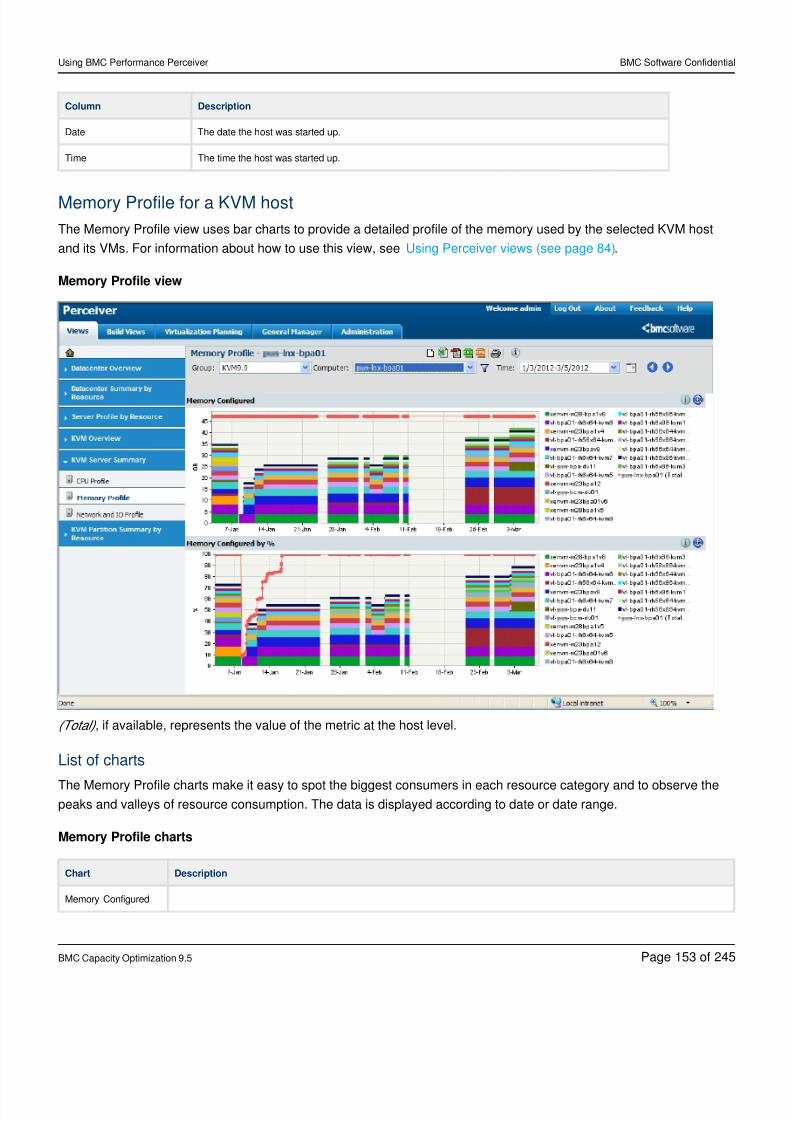
8/21/2019 Using BMC Performance Perceiver-V5-20141128_0503
http://slidepdf.com/reader/full/using-bmc-performance-perceiver-v5-201411280503 153/245
Using BMC Performance Perceiver BMC Software Confidential
BMC Capacity Optimization 9.5 Page of153 245
Column Description
Date The date the host was started up.
Time The time the host was started up.
Memory Profile for a KVM host
The Memory Profile view uses bar charts to provide a detailed profile of the memory used by the selected KVM host
and its VMs. For information about how to use this view, see .Using Perceiver views (see page 84)
Memory Profile view
(Total) , if available, represents the value of the metric at the host level.
List of charts
The Memory Profile charts make it easy to spot the biggest consumers in each resource category and to observe thepeaks and valleys of resource consumption. The data is displayed according to date or date range.
Memory Profile charts
Chart Description
Memory Configured
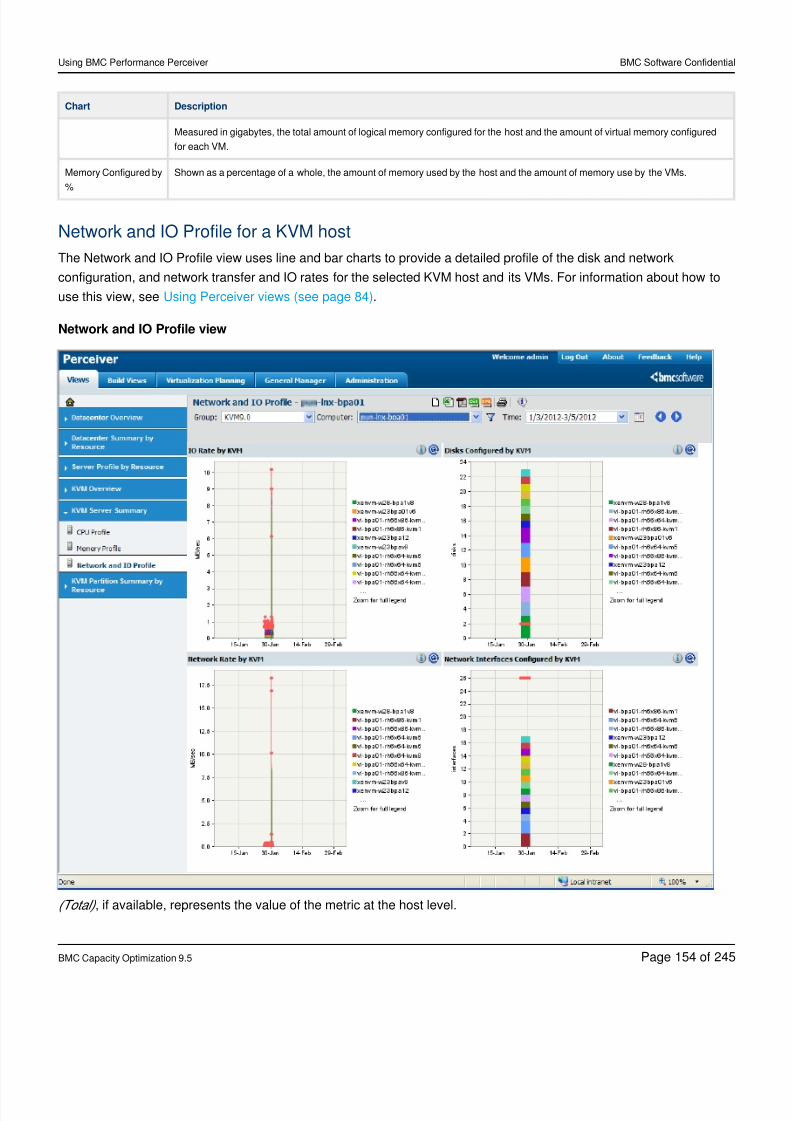
8/21/2019 Using BMC Performance Perceiver-V5-20141128_0503
http://slidepdf.com/reader/full/using-bmc-performance-perceiver-v5-201411280503 154/245
Using BMC Performance Perceiver BMC Software Confidential
BMC Capacity Optimization 9.5 Page of154 245
Chart Description
Measured in gigabytes, the total amount of logical memory configured for the host and the amount of virtual memory configured
for each VM.
Memory Configured by
%
Shown as a percentage of a whole, the amount of memory used by the host and the amount of memory use by the VMs.
Network and IO Profile for a KVM host
The Network and IO Profile view uses line and bar charts to provide a detailed profile of the disk and network
configuration, and network transfer and IO rates for the selected KVM host and its VMs. For information about how to
use this view, see .Using Perceiver views (see page 84)
Network and IO Profile view
(Total) , if available, represents the value of the metric at the host level.
8/21/2019 Using BMC Performance Perceiver-V5-20141128_0503
http://slidepdf.com/reader/full/using-bmc-performance-perceiver-v5-201411280503 155/245
Using BMC Performance Perceiver BMC Software Confidential
BMC Capacity Optimization 9.5 Page of155 245
List of charts
The Network and IO Profile charts make it is easy to spot the biggest consumers in each resource category and to
observe the peaks and valleys of resource consumption. The data is displayed according to date or date range.
Network and IO Profile charts
Chart Description
IO Rate by KVM Measured in megabytes per second, the rate at which IO requests are generated by the host and its VMs.
Disks Configured by KVM The number of disks configured for the host and each of its VMs.
Network Rate by KVM Measured in megabytes per second, the speed at which data is transferred by the host and its VMs.
Network Interfaces Configured by KVM The number of network interfaces configured for the host and each of its VMs.
6.3.10 KVM Partition Summary by Resource category
The KVM Partition Summary by Resource category provides you with a detailed look at a selected KVM VM. You can
view VM, host, CPU, disk, and network configuration, CPU activity, memory usage, and network transfer and IO rates
for the VM.
The following views are available:
CPU Profile for a KVM VM (see page 155)
Memory Profile for a KVM VM (see page 158)
IO and Network Usage for a KVM VM (see page 159)
CPU Profile for a KVM VMThe CPU Profile view uses line and bar charts and tables to provide a detailed profile of a selected VM and its CPU
activity data. For information about how to use this view, see .Using Perceiver views (see page 84)
CPU Profile view
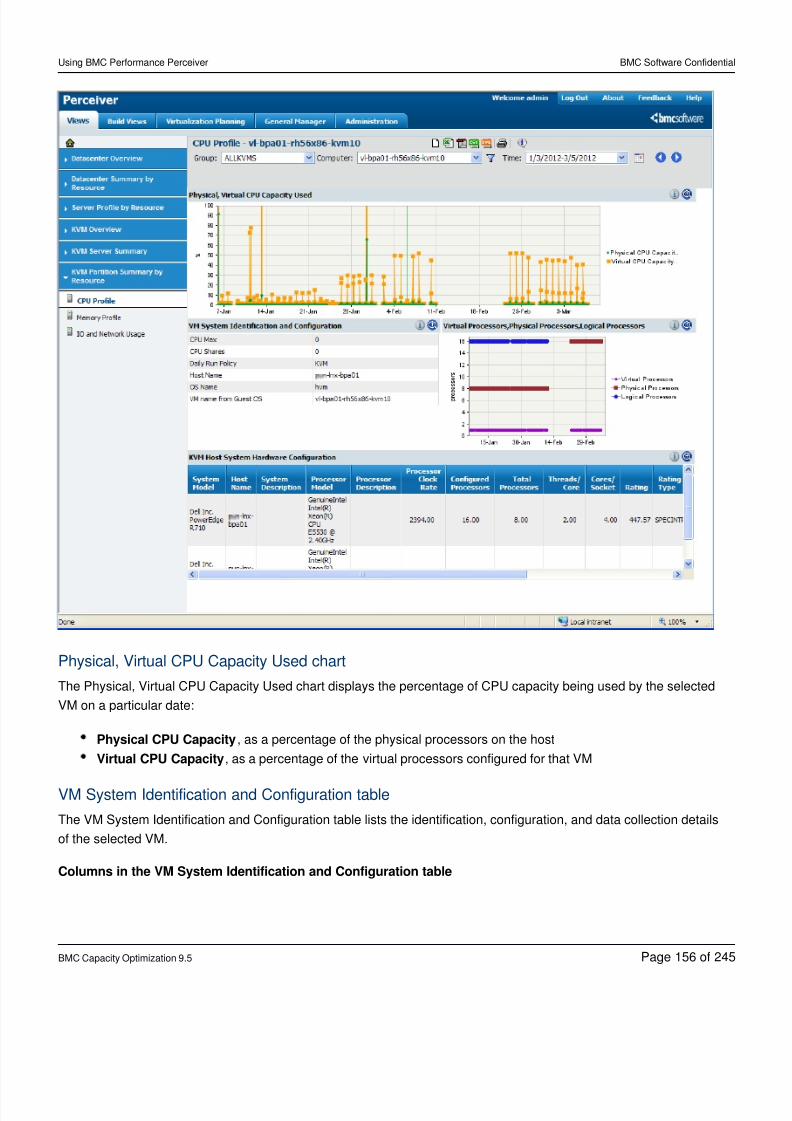
8/21/2019 Using BMC Performance Perceiver-V5-20141128_0503
http://slidepdf.com/reader/full/using-bmc-performance-perceiver-v5-201411280503 156/245
Using BMC Performance Perceiver BMC Software Confidential
BMC Capacity Optimization 9.5 Page of156 245
Physical, Virtual CPU Capacity Used chart
The Physical, Virtual CPU Capacity Used chart displays the percentage of CPU capacity being used by the selected
VM on a particular date:
Physical CPU Capacity, as a percentage of the physical processors on the host
Virtual CPU Capacity, as a percentage of the virtual processors configured for that VM
VM System Identification and Configuration table
The VM System Identification and Configuration table lists the identification, configuration, and data collection details
of the selected VM.
Columns in the VM System Identification and Configuration table
8/21/2019 Using BMC Performance Perceiver-V5-20141128_0503
http://slidepdf.com/reader/full/using-bmc-performance-perceiver-v5-201411280503 157/245
Using BMC Performance Perceiver BMC Software Confidential
BMC Capacity Optimization 9.5 Page of157 245
Column Description
CPU Max The maximum percentage of CPU resources the VM can use. The valid range of values is from zero ("0") to the number representing
the total physical CPU resources.
CPU Shares The portion of the host's CPU resources that is allocated to the VM.
Daily Run Policy The name of the Manager run used to collect data.
Host Name The name of the KVM host.
OS Name The operating system being run on the VM.
VM Name from
Guest OS
The system name of the VM.
Virtual Processors, Physical Processors, Logical Processors chart
The Virtual Processors, Physical Processors, Logical Processors chart displays the number of physical and logical
processors configured on the host, and the number of virtual processors configured for the VM on a particular date.
KVM Host System Hardware Configuration table
The KVM Host System Hardware Configuration table lists the configuration details for the CPUs installed on the KVM
host. This information is provided by the Hardware Table. For more information about the Hardware Table, see
.Configuring hardware files
Columns in the KVM Host System Hardware Configuration table
Column Description
System Model The CPU model of the host.
Host Name The name of the KVM host.
System Description The description of the host system.
Processor Model The manufacturer and type of processor used by the host.
System Description The description of the processor.
Processor Clock Rate The speed of the processor.
Configured Processors The number of logical processors configured on the host.
Total Processors The number of physical processors on the host.
Threads/Core The number of threads per core.
Cores/Socket The number of cores per CPU socket.
Rating The performance rating of the host processor (CPU).
Rating Type The rating system used to rate the processor.
Multi-threading Type The type of multi-threading technology in use, if any (such as HyperThreading, SMT, and CMT).
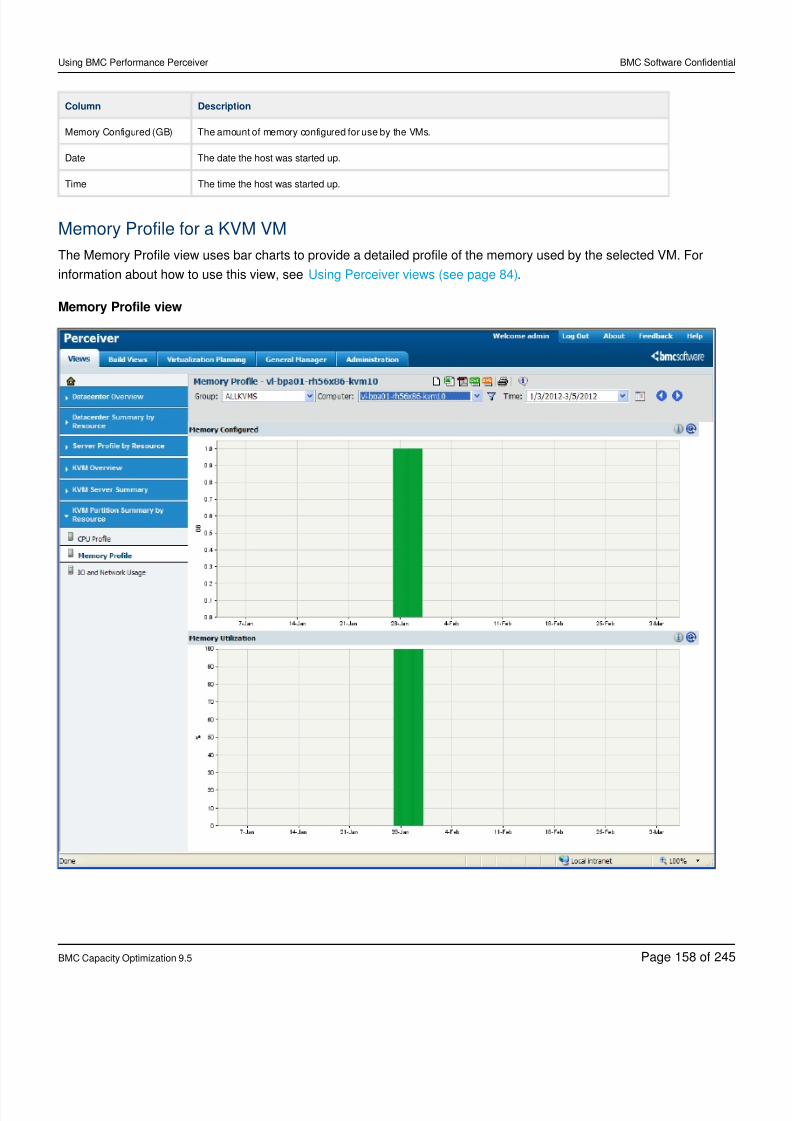
8/21/2019 Using BMC Performance Perceiver-V5-20141128_0503
http://slidepdf.com/reader/full/using-bmc-performance-perceiver-v5-201411280503 158/245
Using BMC Performance Perceiver BMC Software Confidential
BMC Capacity Optimization 9.5 Page of158 245
Column Description
Memory Configured (GB) The amount of memory configured for use by the VMs.
Date The date the host was started up.
Time The time the host was started up.
Memory Profile for a KVM VM
The Memory Profile view uses bar charts to provide a detailed profile of the memory used by the selected VM. For
information about how to use this view, see .Using Perceiver views (see page 84)
Memory Profile view
8/21/2019 Using BMC Performance Perceiver-V5-20141128_0503
http://slidepdf.com/reader/full/using-bmc-performance-perceiver-v5-201411280503 159/245
Using BMC Performance Perceiver BMC Software Confidential
BMC Capacity Optimization 9.5 Page of159 245
List of charts
The Memory Profile charts make it easy to view the resource consumption of a particular VM and to observe the peaks
and valleys of that consumption. The data is displayed according to date or date range.
Memory Profile charts
Chart Description
Memory Configured Measured in gigabytes, the total amount of virtual memory configured for the VM.
Memory Utilization Shown as a percentage of a whole, the amount of memory used by the VM.
IO and Network Usage for a KVM VM
The IO and Network Usage view uses line and bar charts to provide a detailed profile of the disk, network, and IO
configuration for the selected VM. For information about how to use this view, see Using Perceiver views (see page
.84)
IO and Network Usage view
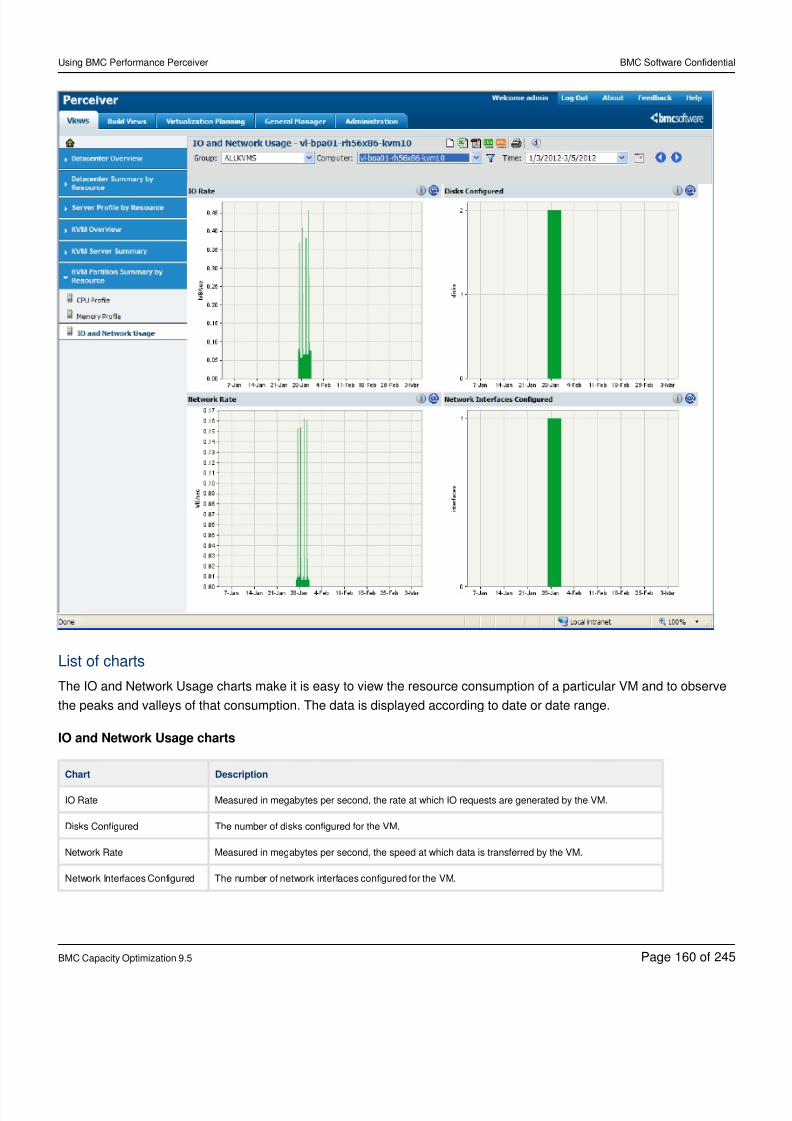
8/21/2019 Using BMC Performance Perceiver-V5-20141128_0503
http://slidepdf.com/reader/full/using-bmc-performance-perceiver-v5-201411280503 160/245
Using BMC Performance Perceiver BMC Software Confidential
BMC Capacity Optimization 9.5 Page of160 245
List of charts
The IO and Network Usage charts make it is easy to view the resource consumption of a particular VM and to observe
the peaks and valleys of that consumption. The data is displayed according to date or date range.
IO and Network Usage charts
Chart Description
IO Rate Measured in megabytes per second, the rate at which IO requests are generated by the VM.
Disks Configured The number of disks configured for the VM.
Network Rate Measured in megabytes per second, the speed at which data is transferred by the VM.
Network Interfaces Configured The number of network interfaces configured for the VM.
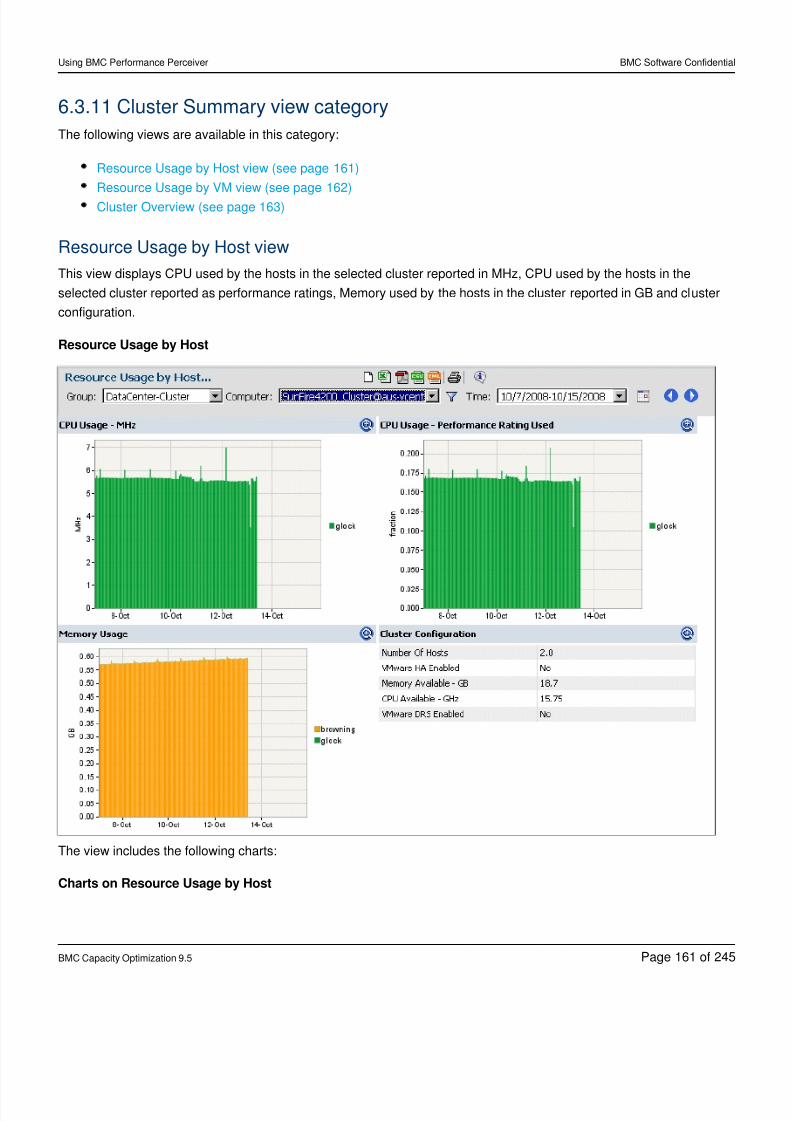
8/21/2019 Using BMC Performance Perceiver-V5-20141128_0503
http://slidepdf.com/reader/full/using-bmc-performance-perceiver-v5-201411280503 161/245
Using BMC Performance Perceiver BMC Software Confidential
BMC Capacity Optimization 9.5 Page of161 245
6.3.11 Cluster Summary view category
The following views are available in this category:
Resource Usage by Host view (see page 161)
Resource Usage by VM view (see page 162)
Cluster Overview (see page 163)
Resource Usage by Host view
This view displays CPU used by the hosts in the selected cluster reported in MHz, CPU used by the hosts in the
selected cluster reported as performance ratings, Memory used by the hosts in the cluster reported in GB and cluster
configuration.
Resource Usage by Host
The view includes the following charts:
Charts on Resource Usage by Host
8/21/2019 Using BMC Performance Perceiver-V5-20141128_0503
http://slidepdf.com/reader/full/using-bmc-performance-perceiver-v5-201411280503 162/245
Using BMC Performance Perceiver BMC Software Confidential
BMC Capacity Optimization 9.5 Page of162 245
Chart Description
CPU Usage -
MHz
This chart displays CPU used by the hosts in the selected cluster reported in MHz.
CPU Usage -
Performance
Rating Used
This chart displays CPU used by the hosts in the selected cluster reported as performance ratings.
Memory
Usage
This chart displays Memory used by the hosts in the cluster reported in GB.
Cluster
Configuration
This text chart displays Total number of hosts in the cluster, Total CPU capacity available reported in GHz, this is the sum of the cpu
capacity available from the hosts in the cluster, Total memory available reported in GB this is the sum of the memory available from the
hosts in the cluster, indicates whether high availability is turned on for the cluster and Indicates whether distributed resource scheduling is
available for the cluster.
Resource Usage by VM view
This view displays CPU used by the virtual machines in the selected cluster reported in MHz, CPU used by the virtualmachines in the selected cluster reported as performance ratings and Memory used by the virtual machines in the
cluster reported in GB.
Resource Usage by VM
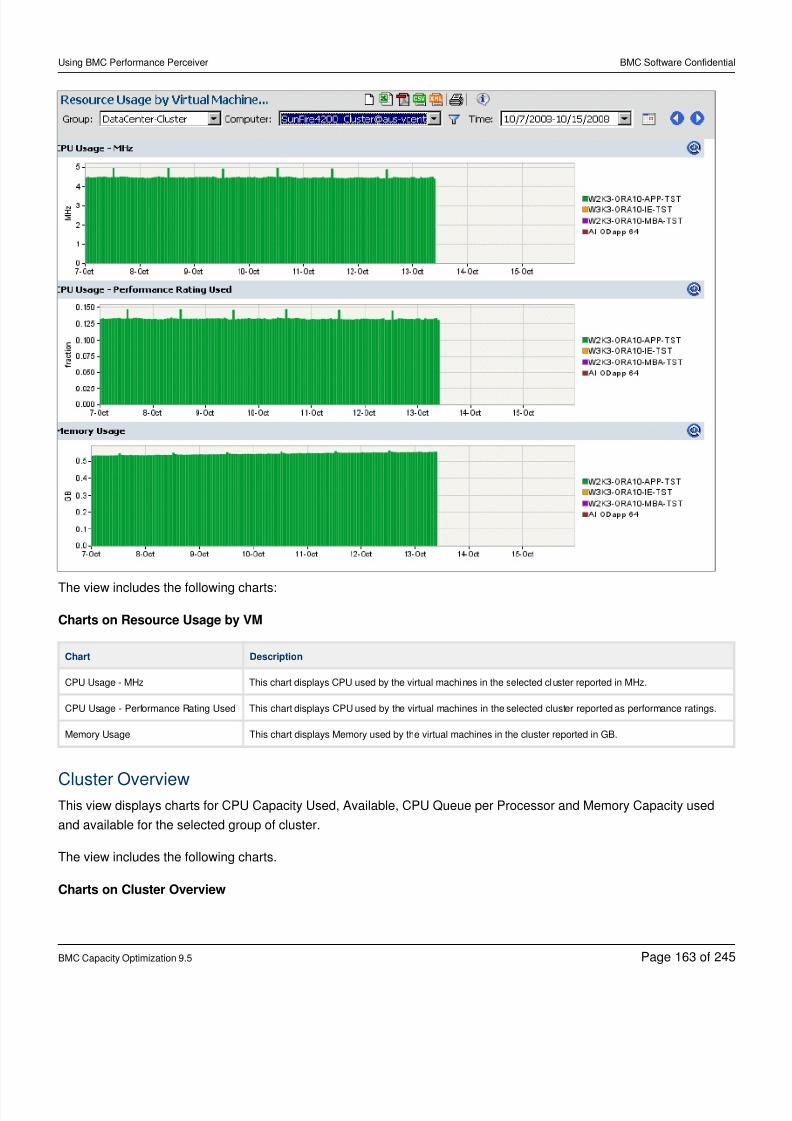
8/21/2019 Using BMC Performance Perceiver-V5-20141128_0503
http://slidepdf.com/reader/full/using-bmc-performance-perceiver-v5-201411280503 163/245
Using BMC Performance Perceiver BMC Software Confidential
BMC Capacity Optimization 9.5 Page of163 245
The view includes the following charts:
Charts on Resource Usage by VM
Chart Description
CPU Usage - MHz This chart displays CPU used by the virtual machines in the selected cluster reported in MHz.
CPU Usage - Performance Rating Used This chart displays CPU used by the virtual machines in the selected cluster reported as performance ratings.
Memory Usage This chart displays Memory used by the virtual machines in the cluster reported in GB.
Cluster OverviewThis view displays charts for CPU Capacity Used, Available, CPU Queue per Processor and Memory Capacity used
and available for the selected group of cluster.
The view includes the following charts.
Charts on Cluster Overview
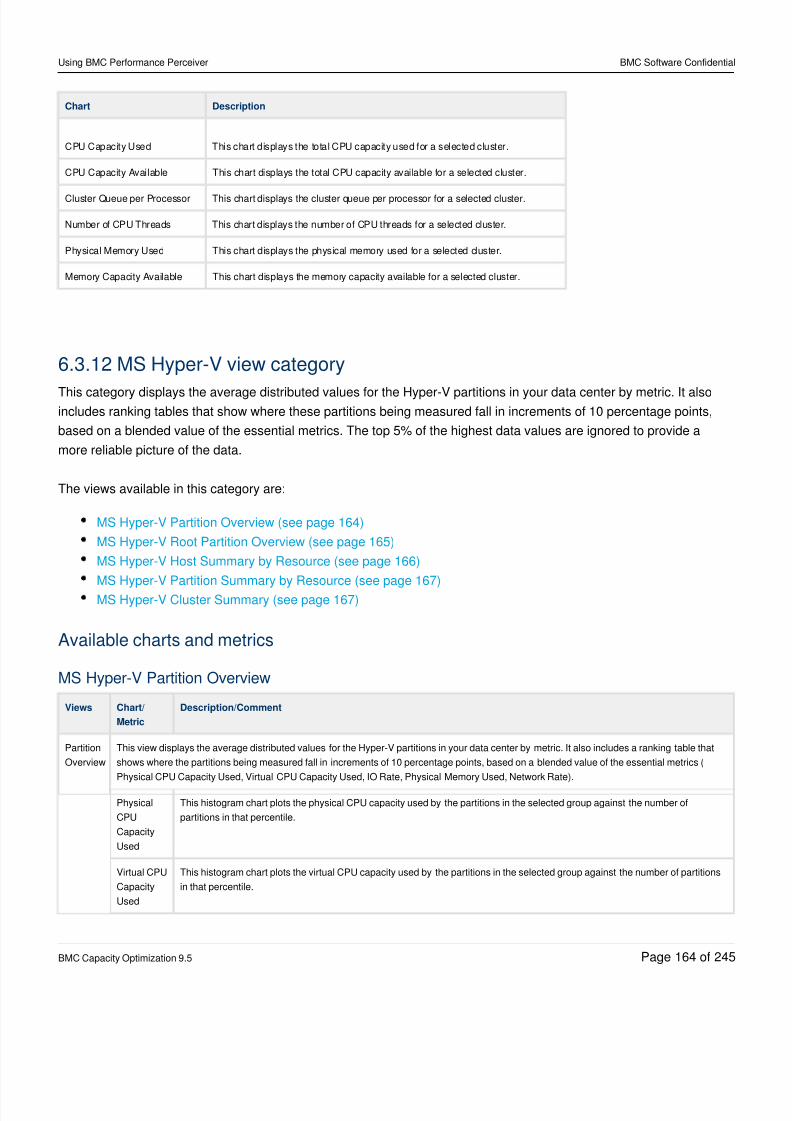
8/21/2019 Using BMC Performance Perceiver-V5-20141128_0503
http://slidepdf.com/reader/full/using-bmc-performance-perceiver-v5-201411280503 164/245
Using BMC Performance Perceiver BMC Software Confidential
BMC Capacity Optimization 9.5 Page of164 245
Chart Description
CPU Capacity Used This chart displays the total CPU capacity used for a selected cluster.
CPU Capacity Available This chart displays the total CPU capacity available for a selected cluster.
Cluster Queue per Processor This chart displays the cluster queue per processor for a selected cluster.
Number of CPU Threads This chart displays the number of CPU threads for a selected cluster.
Physical Memory Used This chart displays the physical memory used for a selected cluster.
Memory Capacity Available This chart displays the memory capacity available for a selected cluster.
6.3.12 MS Hyper-V view category
This category displays the average distributed values for the Hyper-V partitions in your data center by metric. It alsoincludes ranking tables that show where these partitions being measured fall in increments of 10 percentage points,
based on a blended value of the essential metrics. The top 5% of the highest data values are ignored to provide a
more reliable picture of the data.
The views available in this category are:
MS Hyper-V Partition Overview (see page 164)
MS Hyper-V Root Partition Overview (see page 165)
MS Hyper-V Host Summary by Resource (see page 166)
MS Hyper-V Partition Summary by Resource (see page 167)
MS Hyper-V Cluster Summary (see page 167)
Available charts and metrics
MS Hyper-V Partition Overview
Views Chart/
Metric
Description/Comment
Partition
Overview
This view displays the average distributed values for the Hyper-V partitions in your data center by metric. It also includes a ranking table that
shows where the partitions being measured fall in increments of 10 percentage points, based on a blended value of the essential metrics (
Physical CPU Capacity Used, Virtual CPU Capacity Used, IO Rate, Physical Memory Used, Network Rate).
Physical
CPU
Capacity
Used
This histogram chart plots the physical CPU capacity used by the partitions in the selected group against the number of
partitions in that percentile.
Virtual CPU
Capacity
Used
This histogram chart plots the virtual CPU capacity used by the partitions in the selected group against the number of partitions
in that percentile.
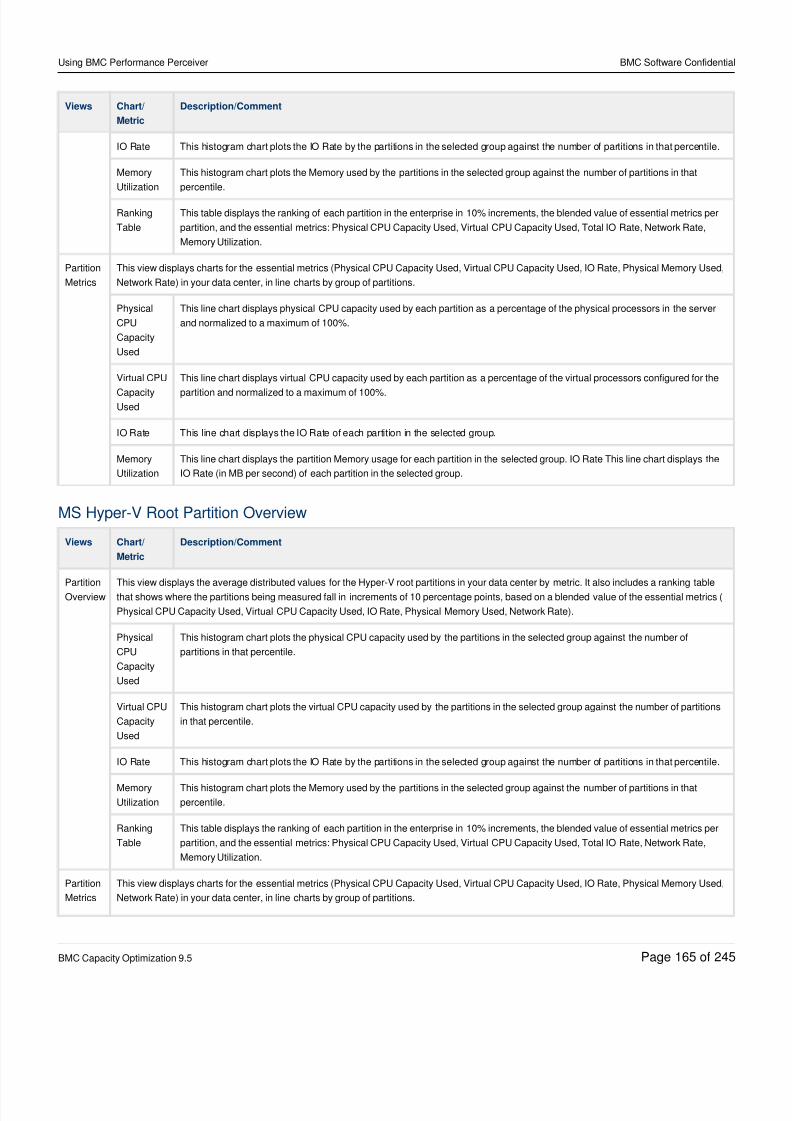
8/21/2019 Using BMC Performance Perceiver-V5-20141128_0503
http://slidepdf.com/reader/full/using-bmc-performance-perceiver-v5-201411280503 165/245
Using BMC Performance Perceiver BMC Software Confidential
BMC Capacity Optimization 9.5 Page of165 245
Views Chart/
Metric
Description/Comment
IO Rate This histogram chart plots the IO Rate by the partitions in the selected group against the number of partitions in that percentile.
Memory
Utilization
This histogram chart plots the Memory used by the partitions in the selected group against the number of partitions in that
percentile.
Ranking
Table
This table displays the ranking of each partition in the enterprise in 10% increments, the blended value of essential metrics per
partition, and the essential metrics: Physical CPU Capacity Used, Virtual CPU Capacity Used, Total IO Rate, Network Rate,
Memory Utilization.
Partition
Metrics
This view displays charts for the essential metrics (Physical CPU Capacity Used, Virtual CPU Capacity Used, IO Rate, Physical Memory Used,
Network Rate) in your data center, in line charts by group of partitions.
Physical
CPU
Capacity
Used
This line chart displays physical CPU capacity used by each partition as a percentage of the physical processors in the server
and normalized to a maximum of 100%.
Virtual CPU
CapacityUsed
This line chart displays virtual CPU capacity used by each partition as a percentage of the virtual processors configured for the
partition and normalized to a maximum of 100%.
IO Rate This line chart displays the IO Rate of each partition in the selected group.
Memory
Utilization
This line chart displays the partition Memory usage for each partition in the selected group. IO Rate This line chart displays the
IO Rate (in MB per second) of each partition in the selected group.
MS Hyper-V Root Partition Overview
Views Chart/
Metric
Description/Comment
Partition
Overview
This view displays the average distributed values for the Hyper-V root partitions in your data center by metric. It also includes a ranking table
that shows where the partitions being measured fall in increments of 10 percentage points, based on a blended value of the essential metrics (
Physical CPU Capacity Used, Virtual CPU Capacity Used, IO Rate, Physical Memory Used, Network Rate).
Physical
CPU
Capacity
Used
This histogram chart plots the physical CPU capacity used by the partitions in the selected group against the number of
partitions in that percentile.
Virtual CPU
Capacity
Used
This histogram chart plots the virtual CPU capacity used by the partitions in the selected group against the number of partitions
in that percentile.
IO Rate This histogram chart plots the IO Rate by the partitions in the selected group against the number of partitions in that percentile.
Memory
Utilization
This histogram chart plots the Memory used by the partitions in the selected group against the number of partitions in that
percentile.
Ranking
Table
This table displays the ranking of each partition in the enterprise in 10% increments, the blended value of essential metrics per
partition, and the essential metrics: Physical CPU Capacity Used, Virtual CPU Capacity Used, Total IO Rate, Network Rate,
Memory Utilization.
Partition
Metrics
This view displays charts for the essential metrics (Physical CPU Capacity Used, Virtual CPU Capacity Used, IO Rate, Physical Memory Used,
Network Rate) in your data center, in line charts by group of partitions.
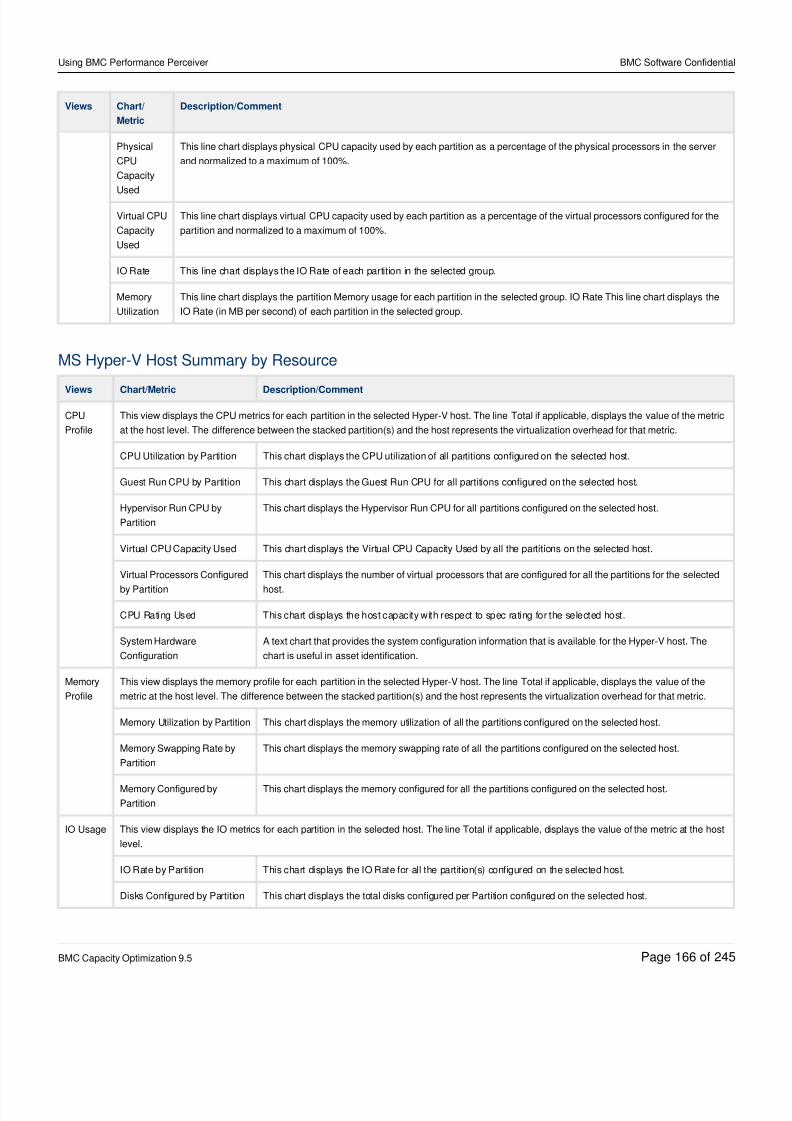
8/21/2019 Using BMC Performance Perceiver-V5-20141128_0503
http://slidepdf.com/reader/full/using-bmc-performance-perceiver-v5-201411280503 166/245
Using BMC Performance Perceiver BMC Software Confidential
BMC Capacity Optimization 9.5 Page of166 245
Views Chart/
Metric
Description/Comment
Physical
CPU
Capacity
Used
This line chart displays physical CPU capacity used by each partition as a percentage of the physical processors in the server
and normalized to a maximum of 100%.
Virtual CPU
Capacity
Used
This line chart displays virtual CPU capacity used by each partition as a percentage of the virtual processors configured for the
partition and normalized to a maximum of 100%.
IO Rate This line chart displays the IO Rate of each partition in the selected group.
Memory
Utilization
This line chart displays the partition Memory usage for each partition in the selected group. IO Rate This line chart displays the
IO Rate (in MB per second) of each partition in the selected group.
MS Hyper-V Host Summary by Resource
Views Chart/Metric Description/Comment
CPU
Profile
This view displays the CPU metrics for each partition in the selected Hyper-V host. The line Total if applicable, displays the value of the metric
at the host level. The difference between the stacked partition(s) and the host represents the virtualization overhead for that metric.
CPU Utilization by Partition This chart displays the CPU utilization of all partitions configured on the selected host.
Guest Run CPU by Partition This chart displays the Guest Run CPU for all partitions configured on the selected host.
Hypervisor Run CPU by
Partition
This chart displays the Hypervisor Run CPU for all partitions configured on the selected host.
Virtual CPU Capacity Used This chart displays the Virtual CPU Capacity Used by all the partitions on the selected host.
Virtual Processors Configured
by Partition
This chart displays the number of virtual processors that are configured for all the partitions for the selected
host.
CPU Rating Used This chart displays the host capacity with respect to spec rating for the selected host.
System Hardware
Configuration
A text chart that provides the system configuration information that is available for the Hyper-V host. The
chart is useful in asset identification.
Memory
Profile
This view displays the memory profile for each partition in the selected Hyper-V host. The line Total if applicable, displays the value of the
metric at the host level. The difference between the stacked partition(s) and the host represents the virtualization overhead for that metric.
Memory Utilization by Partition This chart displays the memory utilization of all the partitions configured on the selected host.
Memory Swapping Rate by
Partition
This chart displays the memory swapping rate of all the partitions configured on the selected host.
Memory Configured by
Partition
This chart displays the memory configured for all the partitions configured on the selected host.
IO Usage This view displays the IO metrics for each partition in the selected host. The line Total if applicable, displays the value of the metric at the host
level.
IO Rate by Partition This chart displays the IO Rate for all the partition(s) configured on the selected host.
Disks Configured by Partition This chart displays the total disks configured per Partition configured on the selected host.
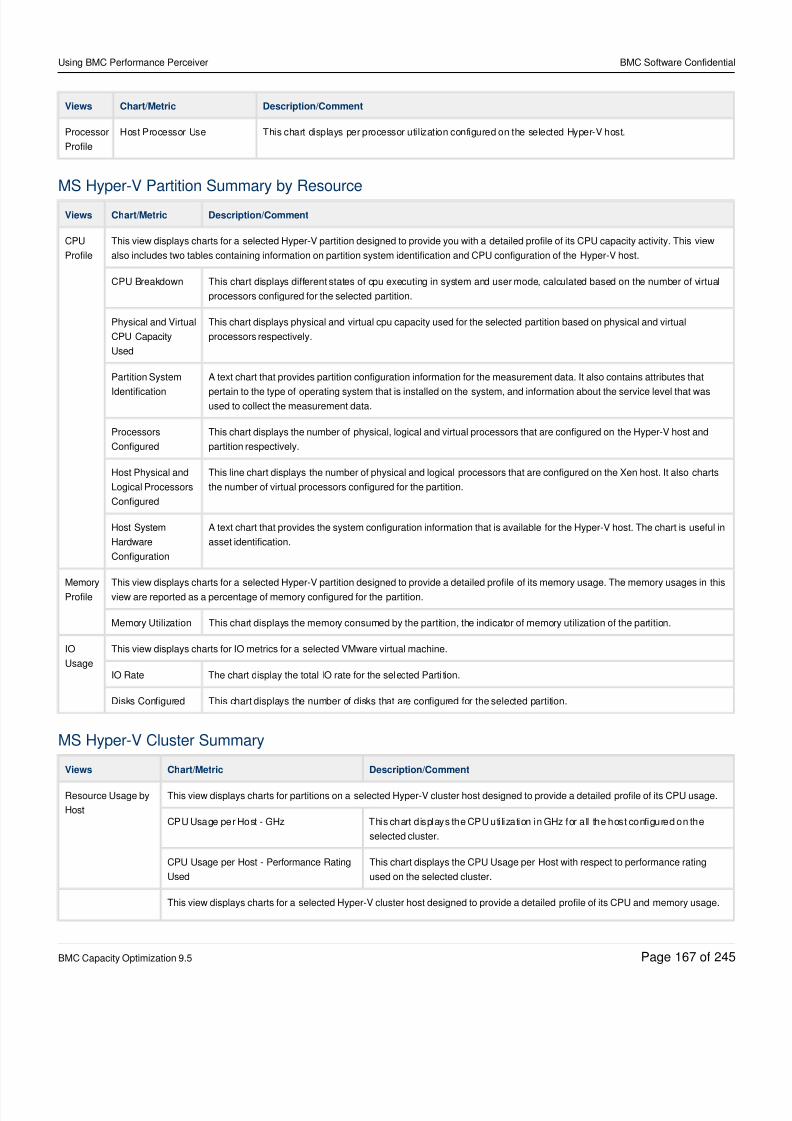
8/21/2019 Using BMC Performance Perceiver-V5-20141128_0503
http://slidepdf.com/reader/full/using-bmc-performance-perceiver-v5-201411280503 167/245
Using BMC Performance Perceiver BMC Software Confidential
BMC Capacity Optimization 9.5 Page of167 245
Views Chart/Metric Description/Comment
Processor
Profile
Host Processor Use This chart displays per processor utilization configured on the selected Hyper-V host.
MS Hyper-V Partition Summary by Resource
Views Chart/Metric Description/Comment
CPU
Profile
This view displays charts for a selected Hyper-V partition designed to provide you with a detailed profile of its CPU capacity activity. This view
also includes two tables containing information on partition system identification and CPU configuration of the Hyper-V host.
CPU Breakdown This chart displays different states of cpu executing in system and user mode, calculated based on the number of virtual
processors configured for the selected partition.
Physical and Virtual
CPU Capacity
Used
This chart displays physical and virtual cpu capacity used for the selected partition based on physical and virtual
processors respectively.
Partition System
Identification
A text chart that provides partition configuration information for the measurement data. It also contains attributes that
pertain to the type of operating system that is installed on the system, and information about the service level that wasused to collect the measurement data.
Processors
Configured
This chart displays the number of physical, logical and virtual processors that are configured on the Hyper-V host and
partition respectively.
Host Physical and
Logical Processors
Configured
This line chart displays the number of physical and logical processors that are configured on the Xen host. It also charts
the number of virtual processors configured for the partition.
Host System
Hardware
Configuration
A text chart that provides the system configuration information that is available for the Hyper-V host. The chart is useful in
asset identification.
Memory
Profile
This view displays charts for a selected Hyper-V partition designed to provide a detailed profile of its memory usage. The memory usages in this
view are reported as a percentage of memory configured for the partition.
Memory Utilization This chart displays the memory consumed by the partition, the indicator of memory utilization of the partition.
IO
Usage
This view displays charts for IO metrics for a selected VMware virtual machine.
IO Rate The chart display the total IO rate for the selected Parti tion.
Disks Configured This chart displays the number of disks that are configured for the selected partition.
MS Hyper-V Cluster Summary
Views Chart/Metric Description/Comment
Resource Usage by
Host
This view displays charts for partitions on a selected Hyper-V cluster host designed to provide a detailed profile of its CPU usage.
CPU Usage per Host - GHz This chart displays the CPU uti lization in GHz for all the host configured on the
selected cluster.
CPU Usage per Host - Performance Rating
Used
This chart displays the CPU Usage per Host with respect to performance rating
used on the selected cluster.
This view displays charts for a selected Hyper-V cluster host designed to provide a detailed profile of its CPU and memory usage.
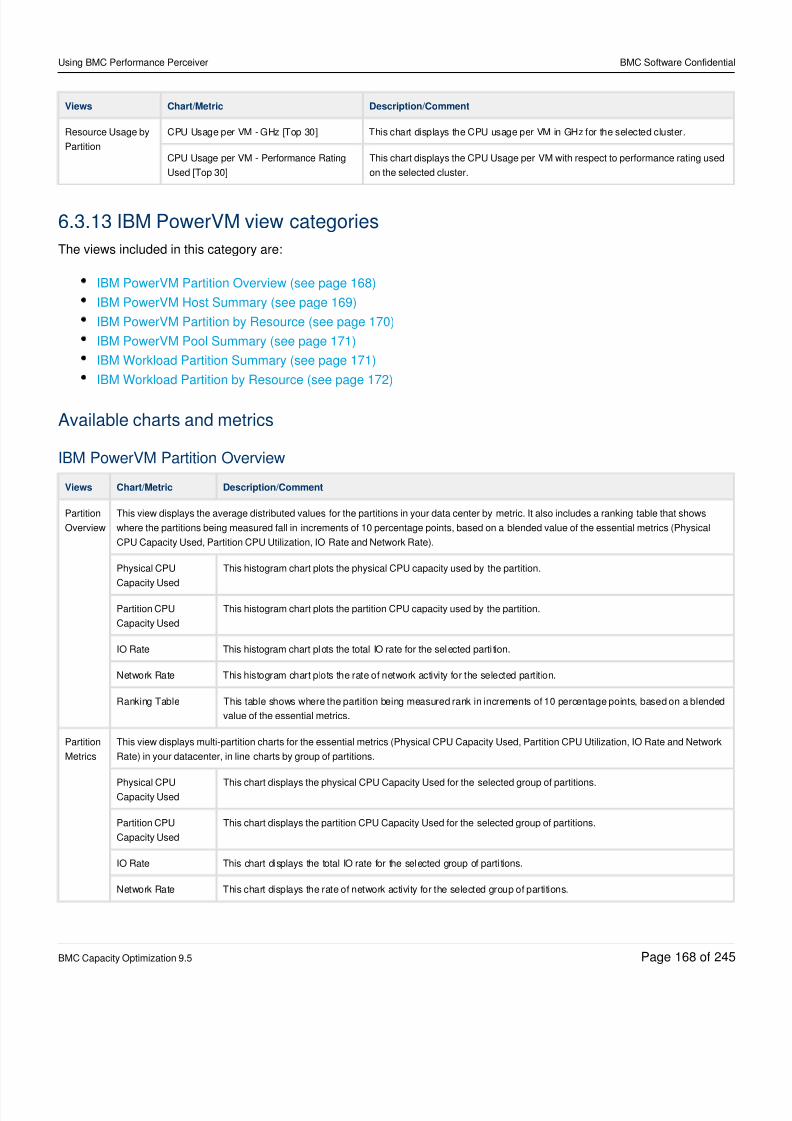
8/21/2019 Using BMC Performance Perceiver-V5-20141128_0503
http://slidepdf.com/reader/full/using-bmc-performance-perceiver-v5-201411280503 168/245
Using BMC Performance Perceiver BMC Software Confidential
BMC Capacity Optimization 9.5 Page of168 245
Views Chart/Metric Description/Comment
Resource Usage by
Partition
CPU Usage per VM - GHz [Top 30] This chart displays the CPU usage per VM in GHz for the selected cluster.
CPU Usage per VM - Performance Rating
Used [Top 30]
This chart displays the CPU Usage per VM with respect to performance rating used
on the selected cluster.
6.3.13 IBM PowerVM view categories
The views included in this category are:
IBM PowerVM Partition Overview (see page 168)
IBM PowerVM Host Summary (see page 169)
IBM PowerVM Partition by Resource (see page 170)
IBM PowerVM Pool Summary (see page 171)
IBM Workload Partition Summary (see page 171)
IBM Workload Partition by Resource (see page 172)
Available charts and metrics
IBM PowerVM Partition Overview
Views Chart/Metric Description/Comment
Partition
Overview
This view displays the average distributed values for the partitions in your data center by metric. It also includes a ranking table that shows
where the partitions being measured fall in increments of 10 percentage points, based on a blended value of the essential metrics (Physical
CPU Capacity Used, Partition CPU Utilization, IO Rate and Network Rate).
Physical CPU
Capacity Used
This histogram chart plots the physical CPU capacity used by the partition.
Partition CPU
Capacity Used
This histogram chart plots the partition CPU capacity used by the partition.
IO Rate This histogram chart plots the total IO rate for the selected parti tion.
Network Rate This histogram chart plots the rate of network activity for the selected partition.
Ranking Table This table shows where the partition being measured rank in increments of 10 percentage points, based on a blended
value of the essential metrics.
Partition
Metrics
This view displays multi-partition charts for the essential metrics (Physical CPU Capacity Used, Partition CPU Utilization, IO Rate and Network
Rate) in your datacenter, in line charts by group of partitions.
Physical CPUCapacity Used
This chart displays the physical CPU Capacity Used for the selected group of partitions.
Partition CPU
Capacity Used
This chart displays the partition CPU Capacity Used for the selected group of partitions.
IO Rate This chart displays the total IO rate for the selected group of parti tions.
Network Rate This chart displays the rate of network activity for the selected group of partitions.
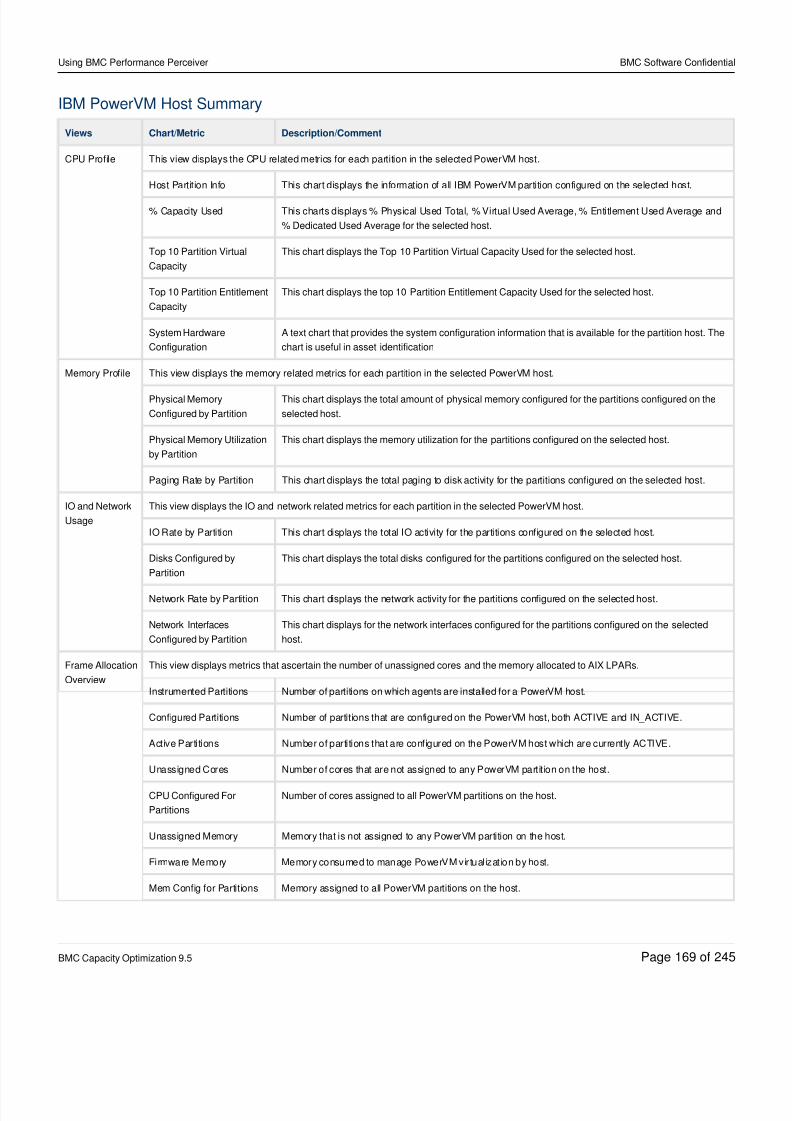
8/21/2019 Using BMC Performance Perceiver-V5-20141128_0503
http://slidepdf.com/reader/full/using-bmc-performance-perceiver-v5-201411280503 169/245
Using BMC Performance Perceiver BMC Software Confidential
BMC Capacity Optimization 9.5 Page of169 245
IBM PowerVM Host Summary
Views Chart/Metric Description/Comment
CPU Profile This view displays the CPU related metrics for each partition in the selected PowerVM host.
Host Partition Info This chart displays the information of all IBM PowerVM partition configured on the selected host.
% Capacity Used This charts displays % Physical Used Total, % Virtual Used Average, % Entitlement Used Average and
% Dedicated Used Average for the selected host.
Top 10 Partition Virtual
Capacity
This chart displays the Top 10 Partition Virtual Capacity Used for the selected host.
Top 10 Partition Entitlement
Capacity
This chart displays the top 10 Partition Entitlement Capacity Used for the selected host.
System Hardware
Configuration
A text chart that provides the system configuration information that is available for the partition host. The
chart is useful in asset identification
Memory Profile This view displays the memory related metrics for each partition in the selected PowerVM host.
Physical Memory
Configured by Partition
This chart displays the total amount of physical memory configured for the partitions configured on the
selected host.
Physical Memory Utilization
by Partition
This chart displays the memory utilization for the partitions configured on the selected host.
Paging Rate by Partition This chart displays the total paging to disk activity for the partitions configured on the selected host.
IO and Network
Usage
This view displays the IO and network related metrics for each partition in the selected PowerVM host.
IO Rate by Partition This chart displays the total IO activity for the partitions configured on the selected host.
Disks Configured by
Partition
This chart displays the total disks configured for the partitions configured on the selected host.
Network Rate by Partition This chart displays the network activity for the partitions configured on the selected host.
Network Interfaces
Configured by Partition
This chart displays for the network interfaces configured for the partitions configured on the selected
host.
Frame Allocation
Overview
This view displays metrics that ascertain the number of unassigned cores and the memory allocated to AIX LPARs.
Instrumented Partitions Number of partitions on which agents are installed for a PowerVM host.
Configured Partitions Number of partitions that are configured on the PowerVM host, both ACTIVE and IN_ACTIVE.
Active Partitions Number of partitions that are configured on the PowerVM host which are currently ACTIVE.
Unassigned Cores Number of cores that are not assigned to any PowerVM partit ion on the host.
CPU Configured For
Partitions
Number of cores assigned to all PowerVM partitions on the host.
Unassigned Memory Memory that is not assigned to any PowerVM partition on the host.
Firmware Memory Memory consumed to manage PowerVM vir tualizat ion by host.
Mem Config for Partitions Memory assigned to all PowerVM partitions on the host.
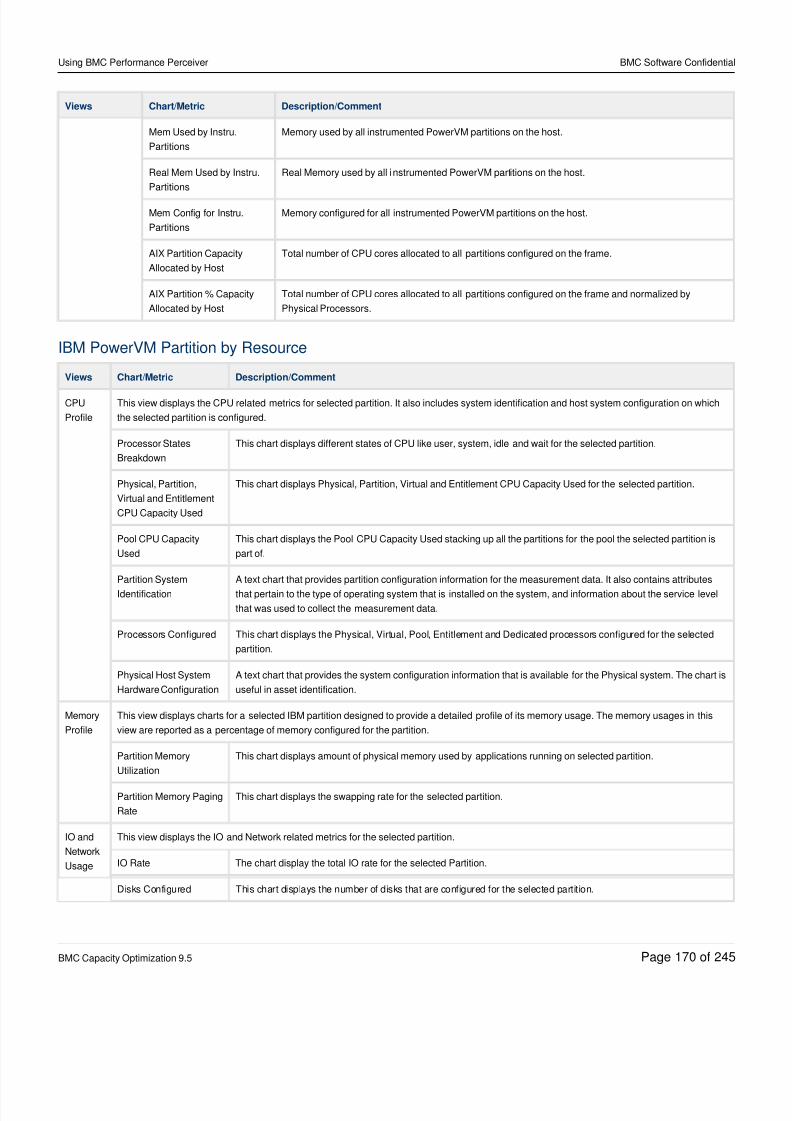
8/21/2019 Using BMC Performance Perceiver-V5-20141128_0503
http://slidepdf.com/reader/full/using-bmc-performance-perceiver-v5-201411280503 170/245
Using BMC Performance Perceiver BMC Software Confidential
BMC Capacity Optimization 9.5 Page of170 245
Views Chart/Metric Description/Comment
Mem Used by Instru.
Partitions
Memory used by all instrumented PowerVM partitions on the host.
Real Mem Used by Instru.
Partitions
Real Memory used by all instrumented PowerVM partitions on the host.
Mem Config for Instru.
Partitions
Memory configured for all instrumented PowerVM partitions on the host.
AIX Partition Capacity
Allocated by Host
Total number of CPU cores allocated to all partitions configured on the frame.
AIX Partition % Capacity
Allocated by Host
Total number of CPU cores allocated to all partitions configured on the frame and normalized by
Physical Processors.
IBM PowerVM Partition by Resource
Views Chart/Metric Description/Comment
CPU
Profile
This view displays the CPU related metrics for selected partition. It also includes system identification and host system configuration on which
the selected partition is configured.
Processor States
Breakdown
This chart displays different states of CPU like user, system, idle and wait for the selected partition.
Physical, Partition,
Virtual and Entitlement
CPU Capacity Used
This chart displays Physical, Partition, Virtual and Entitlement CPU Capacity Used for the selected partition.
Pool CPU Capacity
Used
This chart displays the Pool CPU Capacity Used stacking up all the partitions for the pool the selected partition is
part of.
Partition System
Identification
A text chart that provides partition configuration information for the measurement data. It also contains attributes
that pertain to the type of operating system that is installed on the system, and information about the service level
that was used to collect the measurement data.
Processors Configured This chart displays the Physical, Virtual, Pool, Entitlement and Dedicated processors configured for the selected
partition.
Physical Host System
Hardware Configuration
A text chart that provides the system configuration information that is available for the Physical system. The chart is
useful in asset identification.
Memory
Profile
This view displays charts for a selected IBM partition designed to provide a detailed profile of its memory usage. The memory usages in this
view are reported as a percentage of memory configured for the partition.
Partition Memory
Utilization
This chart displays amount of physical memory used by applications running on selected partition.
Partition Memory Paging
Rate
This chart displays the swapping rate for the selected partition.
IO and
Network
Usage
This view displays the IO and Network related metrics for the selected partition.
IO Rate The chart display the total IO rate for the selected Partition.
Disks Configured This chart displays the number of disks that are configured for the selected partition.
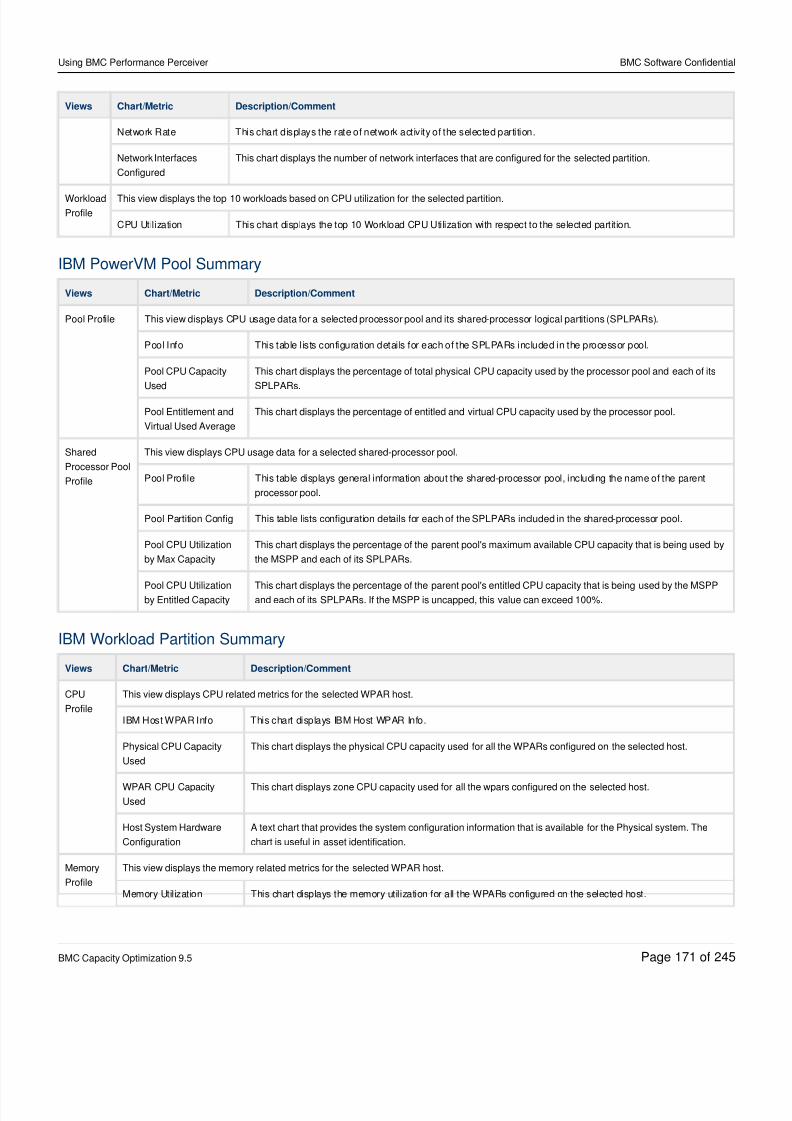
8/21/2019 Using BMC Performance Perceiver-V5-20141128_0503
http://slidepdf.com/reader/full/using-bmc-performance-perceiver-v5-201411280503 171/245
Using BMC Performance Perceiver BMC Software Confidential
BMC Capacity Optimization 9.5 Page of171 245
Views Chart/Metric Description/Comment
Network Rate This chart displays the rate of network activity of the selected partition.
Network Interfaces
Configured
This chart displays the number of network interfaces that are configured for the selected partition.
Workload
Profile
This view displays the top 10 workloads based on CPU utilization for the selected partition.
CPU Utilization This chart displays the top 10 Workload CPU Utilization with respect to the selected partition.
IBM PowerVM Pool Summary
Views Chart/Metric Description/Comment
Pool Profile This view displays CPU usage data for a selected processor pool and its shared-processor logical partitions (SPLPARs).
Pool Info This table lists configuration details for each of the SPLPARs included in the processor pool.
Pool CPU Capacity
Used
This chart displays the percentage of total physical CPU capacity used by the processor pool and each of its
SPLPARs.
Pool Entitlement and
Virtual Used Average
This chart displays the percentage of entitled and virtual CPU capacity used by the processor pool.
Shared
Processor Pool
Profile
This view displays CPU usage data for a selected shared-processor pool.
Pool Profile This table displays general information about the shared-processor pool, including the name of the parent
processor pool.
Pool Partition Config This table lists configuration details for each of the SPLPARs included in the shared-processor pool.
Pool CPU Utilization
by Max Capacity
This chart displays the percentage of the parent pool's maximum available CPU capacity that is being used by
the MSPP and each of its SPLPARs.
Pool CPU Utilizationby Entitled Capacity
This chart displays the percentage of the parent pool's entitled CPU capacity that is being used by the MSPPand each of its SPLPARs. If the MSPP is uncapped, this value can exceed 100%.
IBM Workload Partition Summary
Views Chart/Metric Description/Comment
CPU
Profile
This view displays CPU related metrics for the selected WPAR host.
IBM Host WPAR Info This chart displays IBM Host WPAR Info.
Physical CPU Capacity
Used
This chart displays the physical CPU capacity used for all the WPARs configured on the selected host.
WPAR CPU CapacityUsed
This chart displays zone CPU capacity used for all the wpars configured on the selected host.
Host System Hardware
Configuration
A text chart that provides the system configuration information that is available for the Physical system. The
chart is useful in asset identification.
Memory
Profile
This view displays the memory related metrics for the selected WPAR host.
Memory Utilization This chart displays the memory utilization for all the WPARs configured on the selected host.
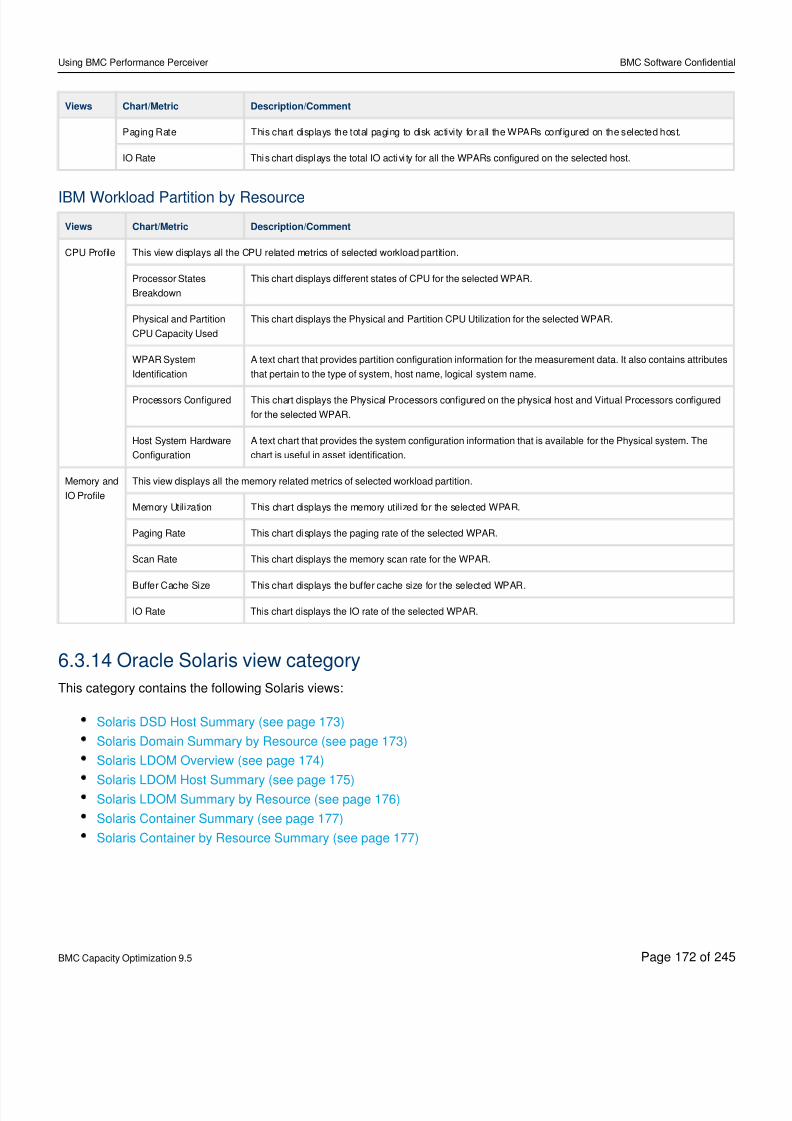
8/21/2019 Using BMC Performance Perceiver-V5-20141128_0503
http://slidepdf.com/reader/full/using-bmc-performance-perceiver-v5-201411280503 172/245
Using BMC Performance Perceiver BMC Software Confidential
BMC Capacity Optimization 9.5 Page of172 245
Views Chart/Metric Description/Comment
Paging Rate This chart displays the total paging to disk activity for all the WPARs configured on the selected host.
IO Rate This chart displays the total IO activi ty for all the WPARs configured on the selected host.
IBM Workload Partition by Resource
Views Chart/Metric Description/Comment
CPU Profile This view displays all the CPU related metrics of selected workload partition.
Processor States
Breakdown
This chart displays different states of CPU for the selected WPAR.
Physical and Partition
CPU Capacity Used
This chart displays the Physical and Partition CPU Utilization for the selected WPAR.
WPAR System
Identification
A text chart that provides partition configuration information for the measurement data. It also contains attributes
that pertain to the type of system, host name, logical system name.
Processors Configured This chart displays the Physical Processors configured on the physical host and Virtual Processors configured
for the selected WPAR.
Host System Hardware
Configuration
A text chart that provides the system configuration information that is available for the Physical system. The
chart is useful in asset identification.
Memory and
IO Profile
This view displays all the memory related metrics of selected workload partition.
Memory Utilization This chart displays the memory utilized for the selected WPAR.
Paging Rate This chart displays the paging rate of the selected WPAR.
Scan Rate This chart displays the memory scan rate for the WPAR.
Buffer Cache Size This chart displays the buffer cache size for the selected WPAR.
IO Rate This chart displays the IO rate of the selected WPAR.
6.3.14 Oracle Solaris view category
This category contains the following Solaris views:
Solaris DSD Host Summary (see page 173)
Solaris Domain Summary by Resource (see page 173)
Solaris LDOM Overview (see page 174)
Solaris LDOM Host Summary (see page 175)Solaris LDOM Summary by Resource (see page 176)
Solaris Container Summary (see page 177)
Solaris Container by Resource Summary (see page 177)
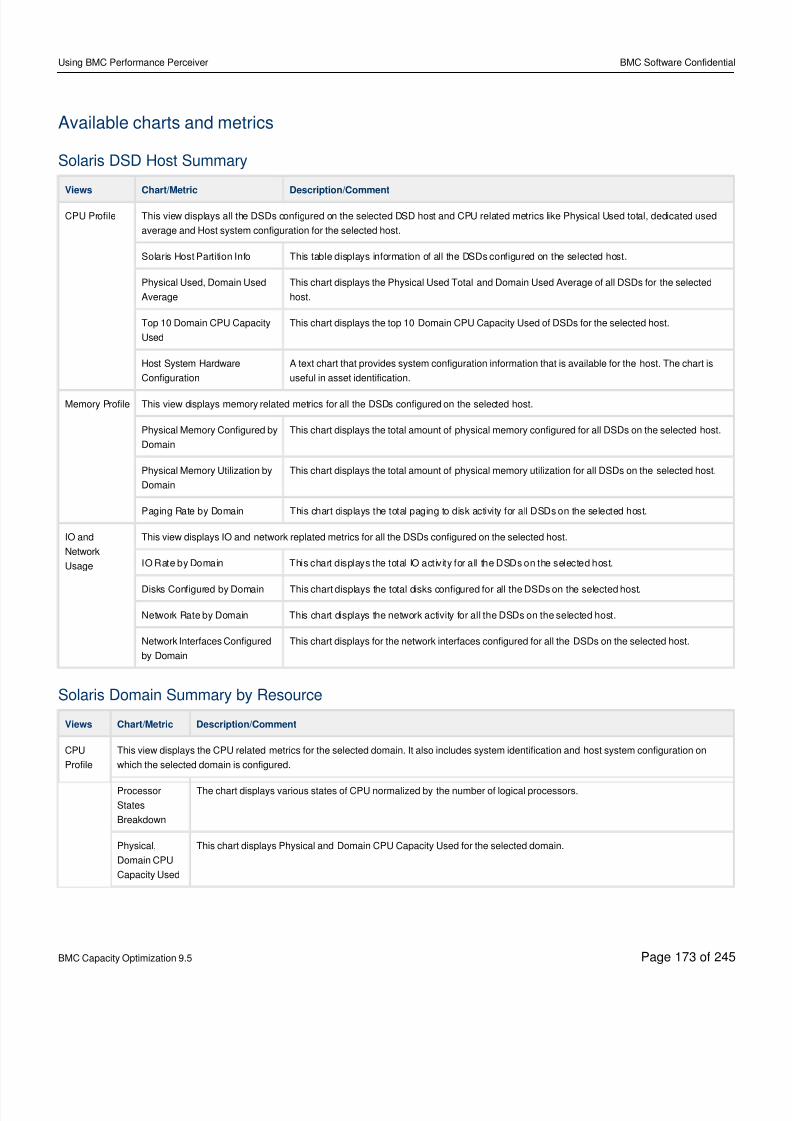
8/21/2019 Using BMC Performance Perceiver-V5-20141128_0503
http://slidepdf.com/reader/full/using-bmc-performance-perceiver-v5-201411280503 173/245
Using BMC Performance Perceiver BMC Software Confidential
BMC Capacity Optimization 9.5 Page of173 245
Available charts and metrics
Solaris DSD Host Summary
Views Chart/Metric Description/Comment
CPU Profile This view displays all the DSDs configured on the selected DSD host and CPU related metrics like Physical Used total, dedicated used
average and Host system configuration for the selected host.
Solaris Host Partition Info This table displays information of all the DSDs configured on the selected host.
Physical Used, Domain Used
Average
This chart displays the Physical Used Total and Domain Used Average of all DSDs for the selected
host.
Top 10 Domain CPU Capacity
Used
This chart displays the top 10 Domain CPU Capacity Used of DSDs for the selected host.
Host System Hardware
Configuration
A text chart that provides system configuration information that is available for the host. The chart is
useful in asset identification.
Memory Profile This view displays memory related metrics for all the DSDs configured on the selected host.
Physical Memory Configured by
Domain
This chart displays the total amount of physical memory configured for all DSDs on the selected host.
Physical Memory Utilization by
Domain
This chart displays the total amount of physical memory utilization for all DSDs on the selected host.
Paging Rate by Domain This chart displays the total paging to disk activity for all DSDs on the selected host.
IO and
Network
Usage
This view displays IO and network replated metrics for all the DSDs configured on the selected host.
IO Rate by Domain This chart displays the total IO activity for all the DSDs on the selected host.
Disks Configured by Domain This chart displays the total disks configured for all the DSDs on the selected host.
Network Rate by Domain This chart displays the network activity for all the DSDs on the selected host.
Network Interfaces Configured
by Domain
This chart displays for the network interfaces configured for all the DSDs on the selected host.
Solaris Domain Summary by Resource
Views Chart/Metric Description/Comment
CPU
Profile
This view displays the CPU related metrics for the selected domain. It also includes system identification and host system configuration on
which the selected domain is configured.
Processor
States
Breakdown
The chart displays various states of CPU normalized by the number of logical processors.
Physical,
Domain CPU
Capacity Used
This chart displays Physical and Domain CPU Capacity Used for the selected domain.
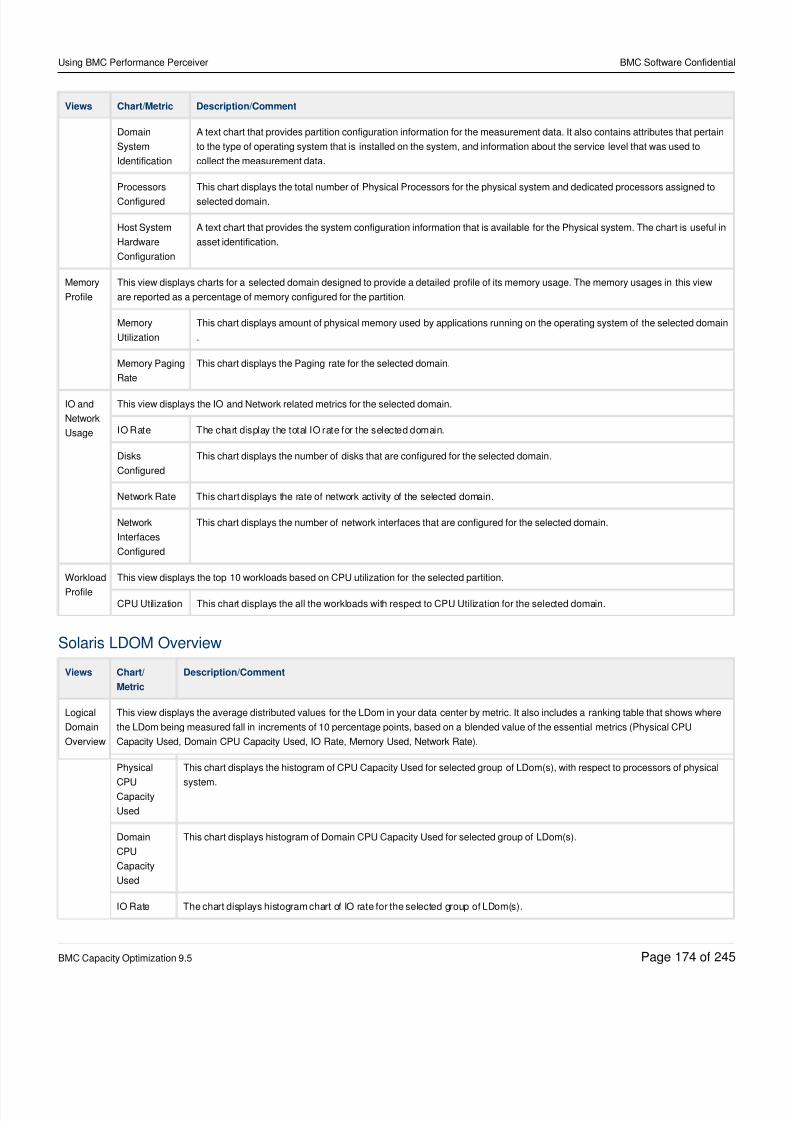
8/21/2019 Using BMC Performance Perceiver-V5-20141128_0503
http://slidepdf.com/reader/full/using-bmc-performance-perceiver-v5-201411280503 174/245
Using BMC Performance Perceiver BMC Software Confidential
BMC Capacity Optimization 9.5 Page of174 245
Views Chart/Metric Description/Comment
Domain
System
Identification
A text chart that provides partition configuration information for the measurement data. It also contains attributes that pertain
to the type of operating system that is installed on the system, and information about the service level that was used to
collect the measurement data.
Processors
Configured
This chart displays the total number of Physical Processors for the physical system and dedicated processors assigned to
selected domain.
Host System
Hardware
Configuration
A text chart that provides the system configuration information that is available for the Physical system. The chart is useful in
asset identification.
Memory
Profile
This view displays charts for a selected domain designed to provide a detailed profile of its memory usage. The memory usages in this view
are reported as a percentage of memory configured for the partition.
Memory
Utilization
This chart displays amount of physical memory used by applications running on the operating system of the selected domain
.
Memory Paging
Rate
This chart displays the Paging rate for the selected domain.
IO and
Network
Usage
This view displays the IO and Network related metrics for the selected domain.
IO Rate The chart display the total IO rate for the selected domain.
Disks
Configured
This chart displays the number of disks that are configured for the selected domain.
Network Rate This chart displays the rate of network activity of the selected domain.
Network
Interfaces
Configured
This chart displays the number of network interfaces that are configured for the selected domain.
Workload
Profile
This view displays the top 10 workloads based on CPU utilization for the selected partition.
CPU Utilization This chart displays the all the workloads with respect to CPU Utilization for the selected domain.
Solaris LDOM Overview
Views Chart/
Metric
Description/Comment
Logical
Domain
Overview
This view displays the average distributed values for the LDom in your data center by metric. It also includes a ranking table that shows where
the LDom being measured fall in increments of 10 percentage points, based on a blended value of the essential metrics (Physical CPU
Capacity Used, Domain CPU Capacity Used, IO Rate, Memory Used, Network Rate).
Physical
CPUCapacity
Used
This chart displays the histogram of CPU Capacity Used for selected group of LDom(s), with respect to processors of physical
system.
Domain
CPU
Capacity
Used
This chart displays histogram of Domain CPU Capacity Used for selected group of LDom(s).
IO Rate The chart displays histogram chart of IO rate for the selected group of LDom(s).
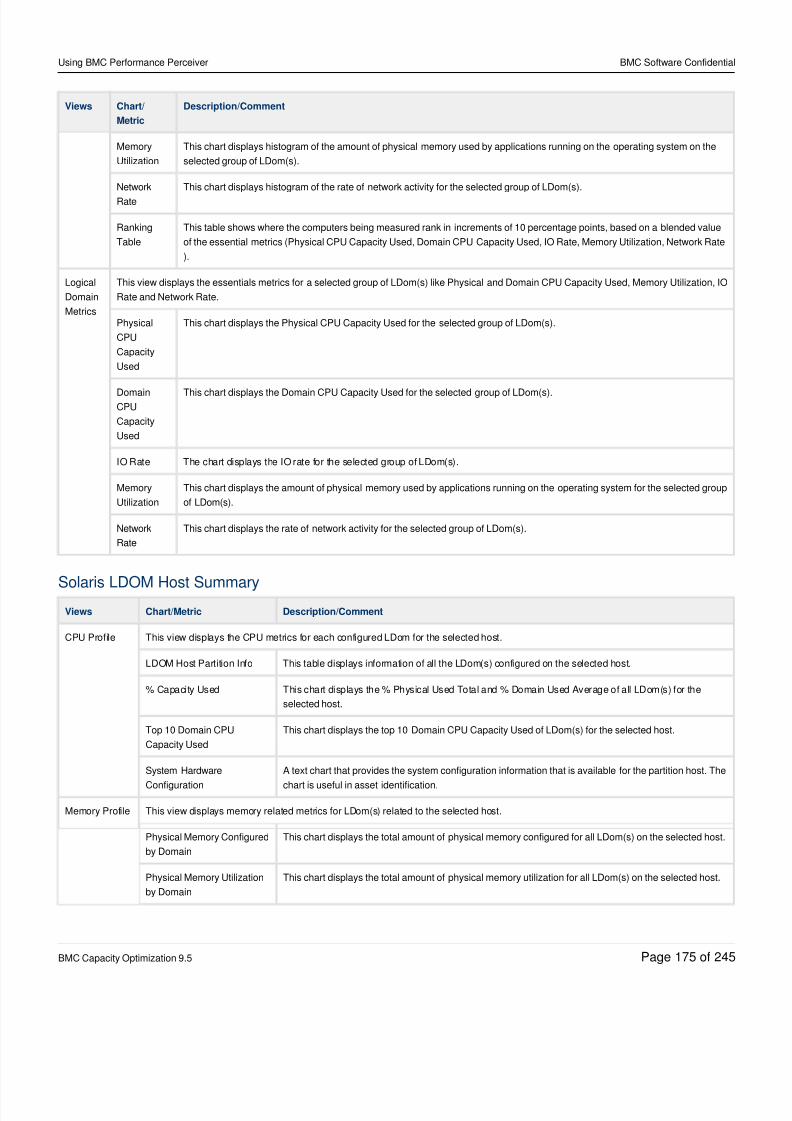
8/21/2019 Using BMC Performance Perceiver-V5-20141128_0503
http://slidepdf.com/reader/full/using-bmc-performance-perceiver-v5-201411280503 175/245
Using BMC Performance Perceiver BMC Software Confidential
BMC Capacity Optimization 9.5 Page of175 245
Views Chart/
Metric
Description/Comment
Memory
Utilization
This chart displays histogram of the amount of physical memory used by applications running on the operating system on the
selected group of LDom(s).
Network
Rate
This chart displays histogram of the rate of network activity for the selected group of LDom(s).
Ranking
Table
This table shows where the computers being measured rank in increments of 10 percentage points, based on a blended value
of the essential metrics (Physical CPU Capacity Used, Domain CPU Capacity Used, IO Rate, Memory Utilization, Network Rate
).
Logical
Domain
Metrics
This view displays the essentials metrics for a selected group of LDom(s) like Physical and Domain CPU Capacity Used, Memory Utilization, IO
Rate and Network Rate.
Physical
CPU
Capacity
Used
This chart displays the Physical CPU Capacity Used for the selected group of LDom(s).
DomainCPU
Capacity
Used
This chart displays the Domain CPU Capacity Used for the selected group of LDom(s).
IO Rate The chart displays the IO rate for the selected group of LDom(s).
Memory
Utilization
This chart displays the amount of physical memory used by applications running on the operating system for the selected group
of LDom(s).
Network
Rate
This chart displays the rate of network activity for the selected group of LDom(s).
Solaris LDOM Host SummaryViews Chart/Metric Description/Comment
CPU Profile This view displays the CPU metrics for each configured LDom for the selected host.
LDOM Host Partition Info This table displays information of all the LDom(s) configured on the selected host.
% Capacity Used This chart displays the % Physical Used Total and % Domain Used Average of all LDom(s) for the
selected host.
Top 10 Domain CPU
Capacity Used
This chart displays the top 10 Domain CPU Capacity Used of LDom(s) for the selected host.
System Hardware
Configuration
A text chart that provides the system configuration information that is available for the partition host. The
chart is useful in asset identification.
Memory Profile This view displays memory related metrics for LDom(s) related to the selected host.
Physical Memory Configured
by Domain
This chart displays the total amount of physical memory configured for all LDom(s) on the selected host.
Physical Memory Utilization
by Domain
This chart displays the total amount of physical memory utilization for all LDom(s) on the selected host.
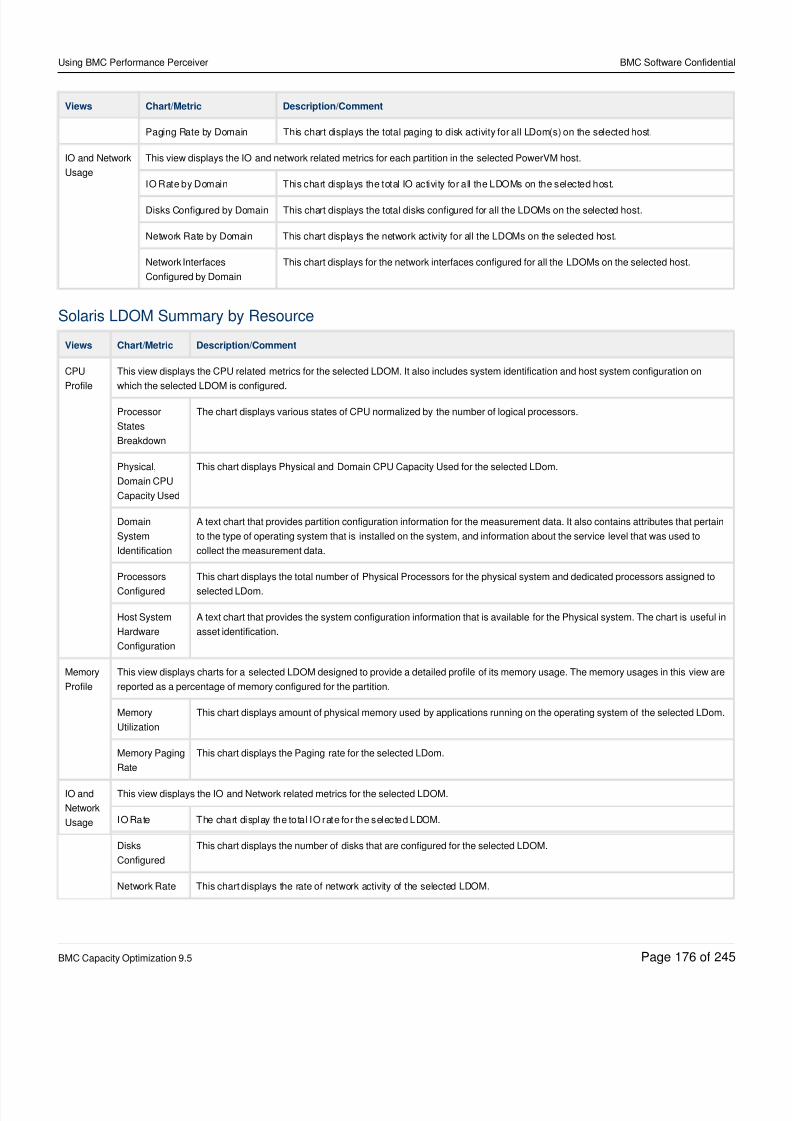
8/21/2019 Using BMC Performance Perceiver-V5-20141128_0503
http://slidepdf.com/reader/full/using-bmc-performance-perceiver-v5-201411280503 176/245
Using BMC Performance Perceiver BMC Software Confidential
BMC Capacity Optimization 9.5 Page of176 245
Views Chart/Metric Description/Comment
Paging Rate by Domain This chart displays the total paging to disk activity for all LDom(s) on the selected host.
IO and Network
Usage
This view displays the IO and network related metrics for each partition in the selected PowerVM host.
IO Rate by Domain This chart displays the total IO activity for all the LDOMs on the selected host.
Disks Configured by Domain This chart displays the total disks configured for all the LDOMs on the selected host.
Network Rate by Domain This chart displays the network activity for all the LDOMs on the selected host.
Network Interfaces
Configured by Domain
This chart displays for the network interfaces configured for all the LDOMs on the selected host.
Solaris LDOM Summary by Resource
Views Chart/Metric Description/Comment
CPU
Profile
This view displays the CPU related metrics for the selected LDOM. It also includes system identification and host system configuration on
which the selected LDOM is configured.
Processor
States
Breakdown
The chart displays various states of CPU normalized by the number of logical processors.
Physical,
Domain CPU
Capacity Used
This chart displays Physical and Domain CPU Capacity Used for the selected LDom.
Domain
System
Identification
A text chart that provides partition configuration information for the measurement data. It also contains attributes that pertain
to the type of operating system that is installed on the system, and information about the service level that was used to
collect the measurement data.
Processors
Configured
This chart displays the total number of Physical Processors for the physical system and dedicated processors assigned to
selected LDom.
Host System
Hardware
Configuration
A text chart that provides the system configuration information that is available for the Physical system. The chart is useful in
asset identification.
Memory
Profile
This view displays charts for a selected LDOM designed to provide a detailed profile of its memory usage. The memory usages in this view are
reported as a percentage of memory configured for the partition.
Memory
Utilization
This chart displays amount of physical memory used by applications running on the operating system of the selected LDom.
Memory Paging
Rate
This chart displays the Paging rate for the selected LDom.
IO and
Network
Usage
This view displays the IO and Network related metrics for the selected LDOM.
IO Rate The chart display the total IO rate for the selected LDOM.
Disks
Configured
This chart displays the number of disks that are configured for the selected LDOM.
Network Rate This chart displays the rate of network activity of the selected LDOM.
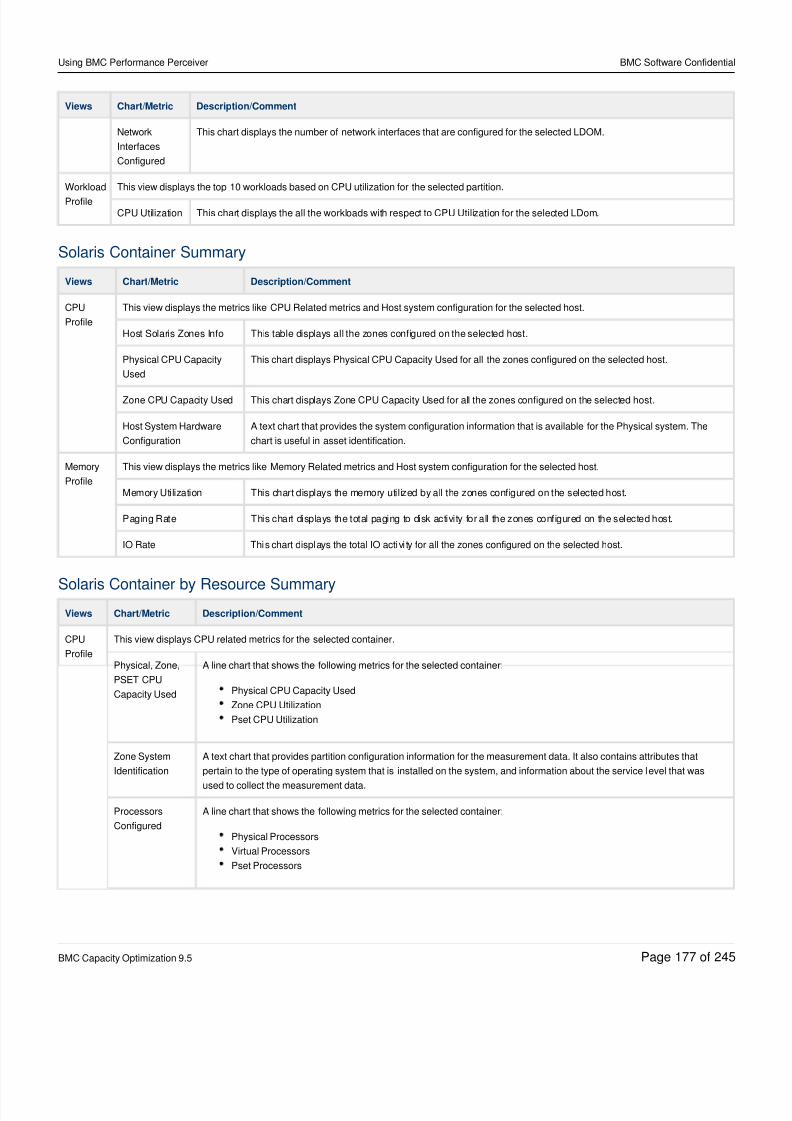
8/21/2019 Using BMC Performance Perceiver-V5-20141128_0503
http://slidepdf.com/reader/full/using-bmc-performance-perceiver-v5-201411280503 177/245
Using BMC Performance Perceiver BMC Software Confidential
BMC Capacity Optimization 9.5 Page of177 245
Views Chart/Metric Description/Comment
Network
Interfaces
Configured
This chart displays the number of network interfaces that are configured for the selected LDOM.
Workload
Profile
This view displays the top 10 workloads based on CPU utilization for the selected partition.
CPU Utilization This chart displays the all the workloads with respect to CPU Utilization for the selected LDom.
Solaris Container Summary
Views Chart/Metric Description/Comment
CPU
Profile
This view displays the metrics like CPU Related metrics and Host system configuration for the selected host.
Host Solaris Zones Info This table displays all the zones configured on the selected host.
Physical CPU Capacity
Used
This chart displays Physical CPU Capacity Used for all the zones configured on the selected host.
Zone CPU Capacity Used This chart displays Zone CPU Capacity Used for all the zones configured on the selected host.
Host System Hardware
Configuration
A text chart that provides the system configuration information that is available for the Physical system. The
chart is useful in asset identification.
Memory
Profile
This view displays the metrics like Memory Related metrics and Host system configuration for the selected host.
Memory Utilization This chart displays the memory utilized by all the zones configured on the selected host.
Paging Rate This chart displays the total paging to disk activity for all the zones configured on the selected host.
IO Rate This chart displays the total IO activi ty for all the zones configured on the selected host.
Solaris Container by Resource SummaryViews Chart/Metric Description/Comment
CPU
Profile
This view displays CPU related metrics for the selected container.
Physical, Zone,
PSET CPU
Capacity Used
A line chart that shows the following metrics for the selected container:
Physical CPU Capacity Used
Zone CPU Utilization
Pset CPU Utilization
Zone System
Identification
A text chart that provides partition configuration information for the measurement data. It also contains attributes that
pertain to the type of operating system that is installed on the system, and information about the service level that was
used to collect the measurement data.
Processors
Configured
A line chart that shows the following metrics for the selected container:
Physical Processors
Virtual Processors
Pset Processors
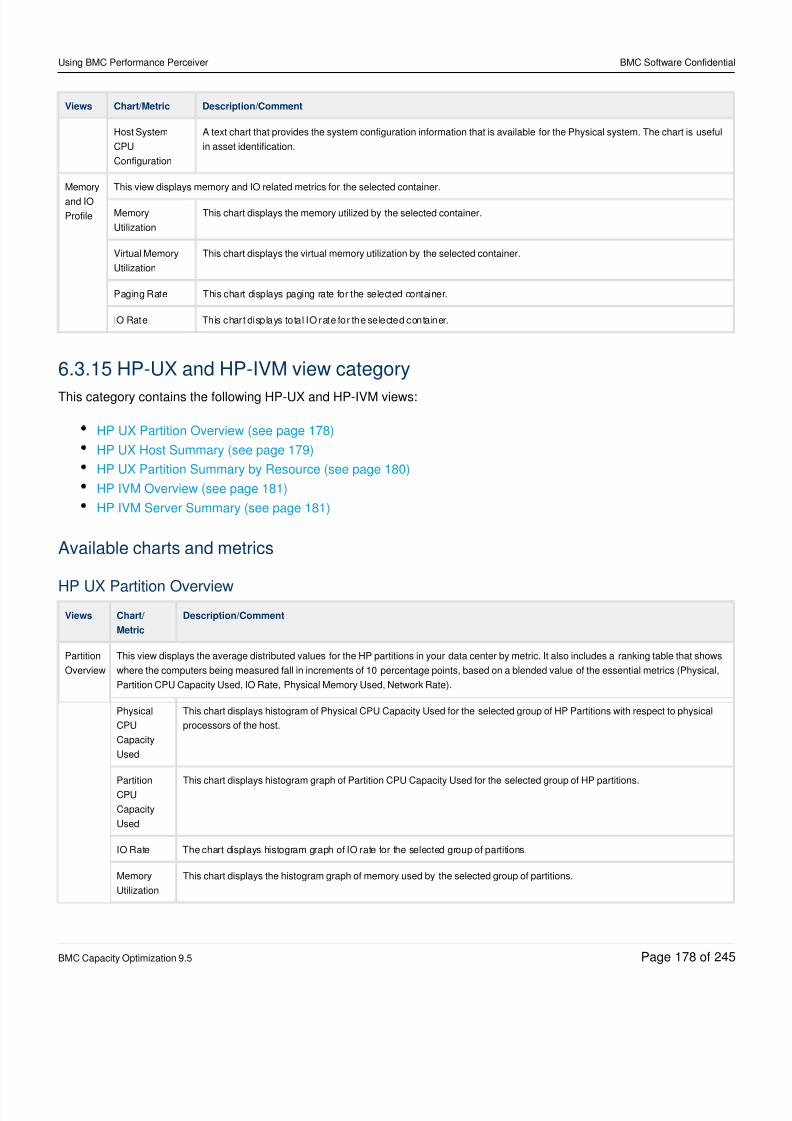
8/21/2019 Using BMC Performance Perceiver-V5-20141128_0503
http://slidepdf.com/reader/full/using-bmc-performance-perceiver-v5-201411280503 178/245
Using BMC Performance Perceiver BMC Software Confidential
BMC Capacity Optimization 9.5 Page of178 245
Views Chart/Metric Description/Comment
Host System
CPU
Configuration
A text chart that provides the system configuration information that is available for the Physical system. The chart is useful
in asset identification.
Memory
and IO
Profile
This view displays memory and IO related metrics for the selected container.
Memory
Utilization
This chart displays the memory utilized by the selected container.
Virtual Memory
Utilization
This chart displays the virtual memory utilization by the selected container.
Paging Rate This chart displays paging rate for the selected container.
IO Rate This chart displays total IO rate for the selected container.
6.3.15 HP-UX and HP-IVM view category
This category contains the following HP-UX and HP-IVM views:
HP UX Partition Overview (see page 178)
HP UX Host Summary (see page 179)
HP UX Partition Summary by Resource (see page 180)
HP IVM Overview (see page 181)
HP IVM Server Summary (see page 181)
Available charts and metrics
HP UX Partition OverviewViews Chart/
Metric
Description/Comment
Partition
Overview
This view displays the average distributed values for the HP partitions in your data center by metric. It also includes a ranking table that shows
where the computers being measured fall in increments of 10 percentage points, based on a blended value of the essential metrics (Physical,
Partition CPU Capacity Used, IO Rate, Physical Memory Used, Network Rate).
Physical
CPU
Capacity
Used
This chart displays histogram of Physical CPU Capacity Used for the selected group of HP Partitions with respect to physical
processors of the host.
Partition
CPU
Capacity
Used
This chart displays histogram graph of Partition CPU Capacity Used for the selected group of HP partitions.
IO Rate The chart displays histogram graph of IO rate for the selected group of partitions.
Memory
Utilization
This chart displays the histogram graph of memory used by the selected group of partitions.
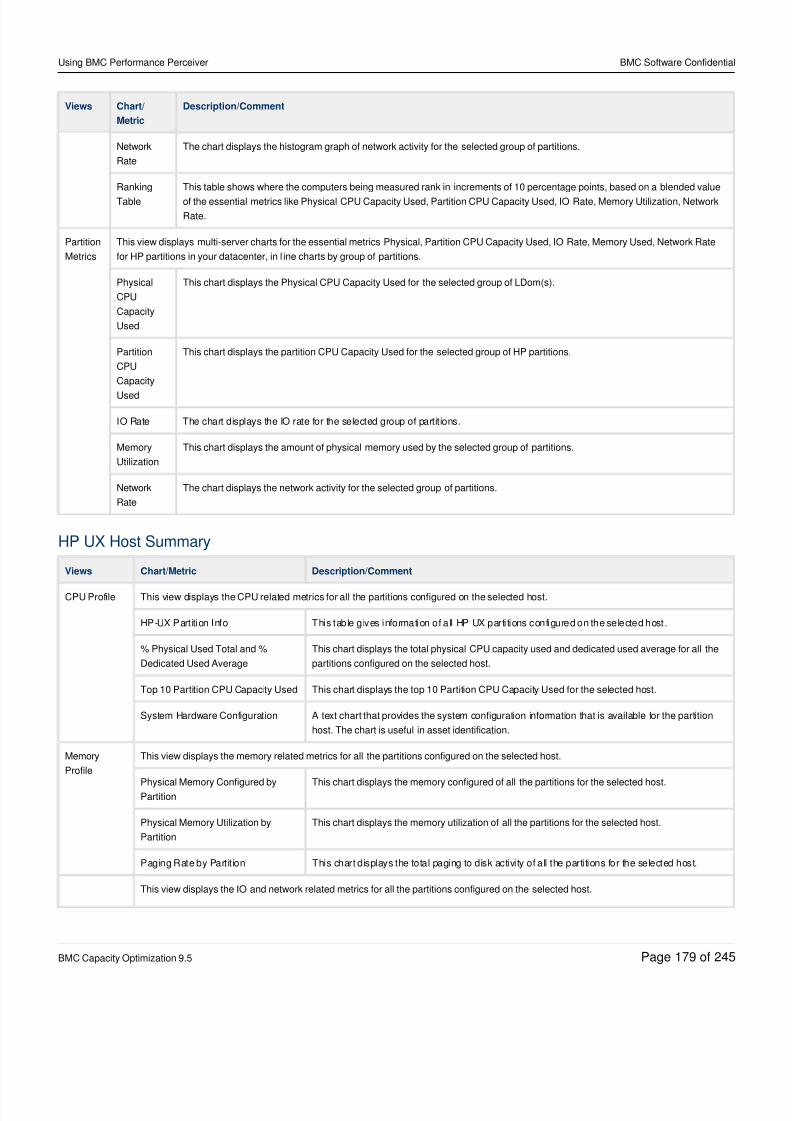
8/21/2019 Using BMC Performance Perceiver-V5-20141128_0503
http://slidepdf.com/reader/full/using-bmc-performance-perceiver-v5-201411280503 179/245
Using BMC Performance Perceiver BMC Software Confidential
BMC Capacity Optimization 9.5 Page of179 245
Views Chart/
Metric
Description/Comment
Network
Rate
The chart displays the histogram graph of network activity for the selected group of partitions.
Ranking
Table
This table shows where the computers being measured rank in increments of 10 percentage points, based on a blended value
of the essential metrics like Physical CPU Capacity Used, Partition CPU Capacity Used, IO Rate, Memory Utilization, Network
Rate.
Partition
Metrics
This view displays multi-server charts for the essential metrics Physical, Partition CPU Capacity Used, IO Rate, Memory Used, Network Rate
for HP partitions in your datacenter, in l ine charts by group of partitions.
Physical
CPU
Capacity
Used
This chart displays the Physical CPU Capacity Used for the selected group of LDom(s).
Partition
CPU
Capacity
Used
This chart displays the partition CPU Capacity Used for the selected group of HP partitions.
IO Rate The chart displays the IO rate for the selected group of partitions.
Memory
Utilization
This chart displays the amount of physical memory used by the selected group of partitions.
Network
Rate
The chart displays the network activity for the selected group of partitions.
HP UX Host Summary
Views Chart/Metric Description/Comment
CPU Profile This view displays the CPU related metrics for all the partitions configured on the selected host.
HP-UX Part ition Info This table gives information of all HP UX partitions configured on the selected host.
% Physical Used Total and %
Dedicated Used Average
This chart displays the total physical CPU capacity used and dedicated used average for all the
partitions configured on the selected host.
Top 10 Partition CPU Capacity Used This chart displays the top 10 Partition CPU Capacity Used for the selected host.
System Hardware Configuration A text chart that provides the system configuration information that is available for the partition
host. The chart is useful in asset identification.
Memory
Profile
This view displays the memory related metrics for all the partitions configured on the selected host.
Physical Memory Configured byPartition
This chart displays the memory configured of all the partitions for the selected host.
Physical Memory Utilization by
Partition
This chart displays the memory utilization of all the partitions for the selected host.
Paging Rate by Partit ion This chart displays the total paging to disk activity of all the partitions for the selected host.
This view displays the IO and network related metrics for all the partitions configured on the selected host.
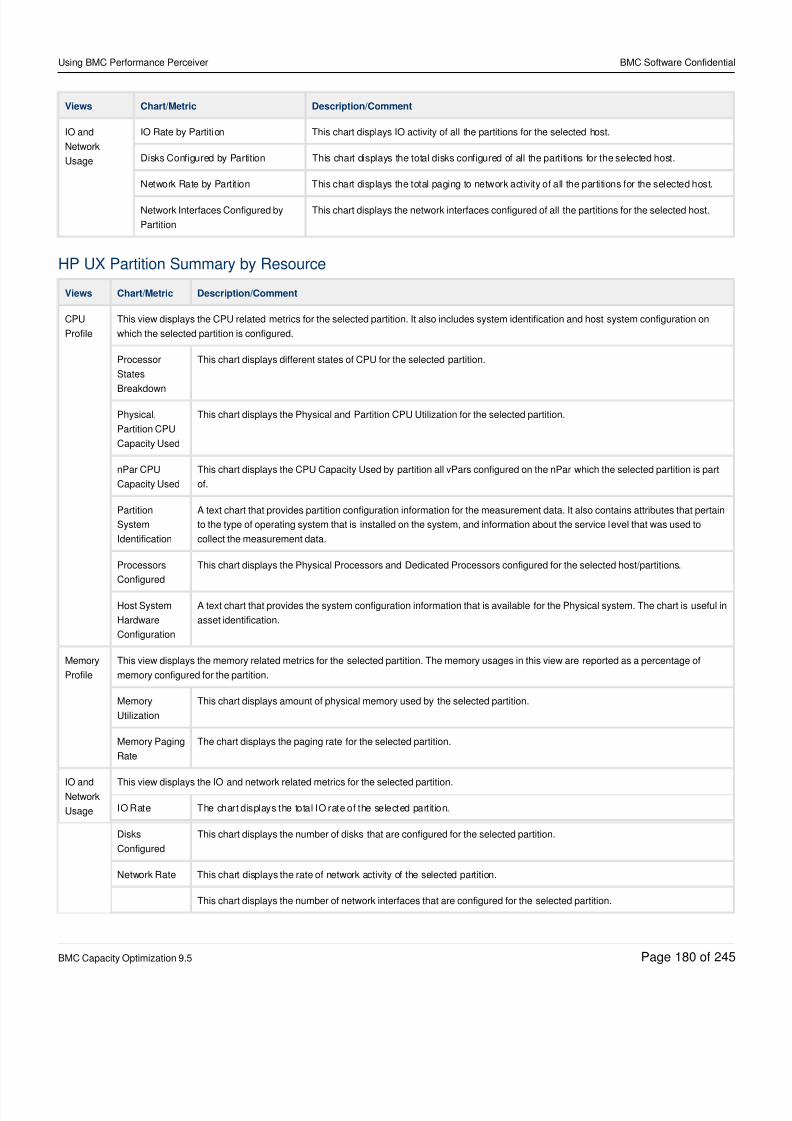
8/21/2019 Using BMC Performance Perceiver-V5-20141128_0503
http://slidepdf.com/reader/full/using-bmc-performance-perceiver-v5-201411280503 180/245
Using BMC Performance Perceiver BMC Software Confidential
BMC Capacity Optimization 9.5 Page of180 245
Views Chart/Metric Description/Comment
IO and
Network
Usage
IO Rate by Partition This chart displays IO activity of all the partitions for the selected host.
Disks Configured by Partition This chart displays the total disks configured of all the partitions for the selected host.
Network Rate by Partition This chart displays the total paging to network activity of all the partitions for the selected host.
Network Interfaces Configured by
Partition
This chart displays the network interfaces configured of all the partitions for the selected host.
HP UX Partition Summary by Resource
Views Chart/Metric Description/Comment
CPU
Profile
This view displays the CPU related metrics for the selected partition. It also includes system identification and host system configuration on
which the selected partition is configured.
Processor
States
Breakdown
This chart displays different states of CPU for the selected partition.
Physical,
Partition CPU
Capacity Used
This chart displays the Physical and Partition CPU Utilization for the selected partition.
nPar CPU
Capacity Used
This chart displays the CPU Capacity Used by partition all vPars configured on the nPar which the selected partition is part
of.
Partition
System
Identification
A text chart that provides partition configuration information for the measurement data. It also contains attributes that pertain
to the type of operating system that is installed on the system, and information about the service level that was used to
collect the measurement data.
Processors
Configured
This chart displays the Physical Processors and Dedicated Processors configured for the selected host/partitions.
Host System
Hardware
Configuration
A text chart that provides the system configuration information that is available for the Physical system. The chart is useful in
asset identification.
Memory
Profile
This view displays the memory related metrics for the selected partition. The memory usages in this view are reported as a percentage of
memory configured for the partition.
Memory
Utilization
This chart displays amount of physical memory used by the selected partition.
Memory Paging
Rate
The chart displays the paging rate for the selected partition.
IO andNetwork
Usage
This view displays the IO and network related metrics for the selected partition.
IO Rate The chart displays the total IO rate of the selected partit ion.
Disks
Configured
This chart displays the number of disks that are configured for the selected partition.
Network Rate This chart displays the rate of network activity of the selected partition.
This chart displays the number of network interfaces that are configured for the selected partition.
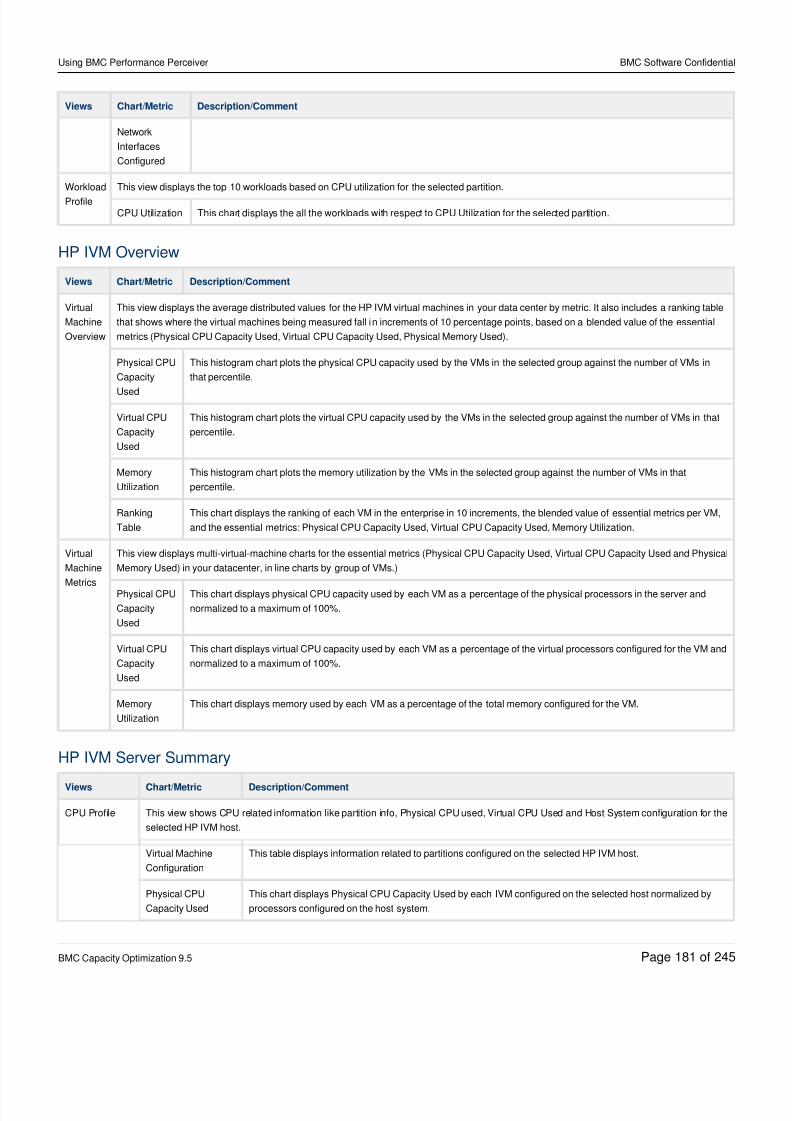
8/21/2019 Using BMC Performance Perceiver-V5-20141128_0503
http://slidepdf.com/reader/full/using-bmc-performance-perceiver-v5-201411280503 181/245
Using BMC Performance Perceiver BMC Software Confidential
BMC Capacity Optimization 9.5 Page of181 245
Views Chart/Metric Description/Comment
Network
Interfaces
Configured
Workload
Profile
This view displays the top 10 workloads based on CPU utilization for the selected partition.
CPU Utilization This chart displays the all the workloads with respect to CPU Utilization for the selected partition.
HP IVM Overview
Views Chart/Metric Description/Comment
Virtual
Machine
Overview
This view displays the average distributed values for the HP IVM virtual machines in your data center by metric. It also includes a ranking table
that shows where the virtual machines being measured fall in increments of 10 percentage points, based on a blended value of the essential
metrics (Physical CPU Capacity Used, Virtual CPU Capacity Used, Physical Memory Used).
Physical CPU
Capacity
Used
This histogram chart plots the physical CPU capacity used by the VMs in the selected group against the number of VMs in
that percentile.
Virtual CPU
Capacity
Used
This histogram chart plots the virtual CPU capacity used by the VMs in the selected group against the number of VMs in that
percentile.
Memory
Utilization
This histogram chart plots the memory utilization by the VMs in the selected group against the number of VMs in that
percentile.
Ranking
Table
This chart displays the ranking of each VM in the enterprise in 10 increments, the blended value of essential metrics per VM,
and the essential metrics: Physical CPU Capacity Used, Virtual CPU Capacity Used, Memory Utilization.
Virtual
Machine
Metrics
This view displays multi-virtual-machine charts for the essential metrics (Physical CPU Capacity Used, Virtual CPU Capacity Used and Physical
Memory Used) in your datacenter, in line charts by group of VMs.)
Physical CPU
Capacity
Used
This chart displays physical CPU capacity used by each VM as a percentage of the physical processors in the server and
normalized to a maximum of 100%.
Virtual CPU
Capacity
Used
This chart displays virtual CPU capacity used by each VM as a percentage of the virtual processors configured for the VM and
normalized to a maximum of 100%.
Memory
Utilization
This chart displays memory used by each VM as a percentage of the total memory configured for the VM.
HP IVM Server Summary
Views Chart/Metric Description/Comment
CPU Profile This view shows CPU related information like partition info, Physical CPU used, Virtual CPU Used and Host System configuration for the
selected HP IVM host.
Virtual Machine
Configuration
This table displays information related to partitions configured on the selected HP IVM host.
Physical CPU
Capacity Used
This chart displays Physical CPU Capacity Used by each IVM configured on the selected host normalized by
processors configured on the host system.
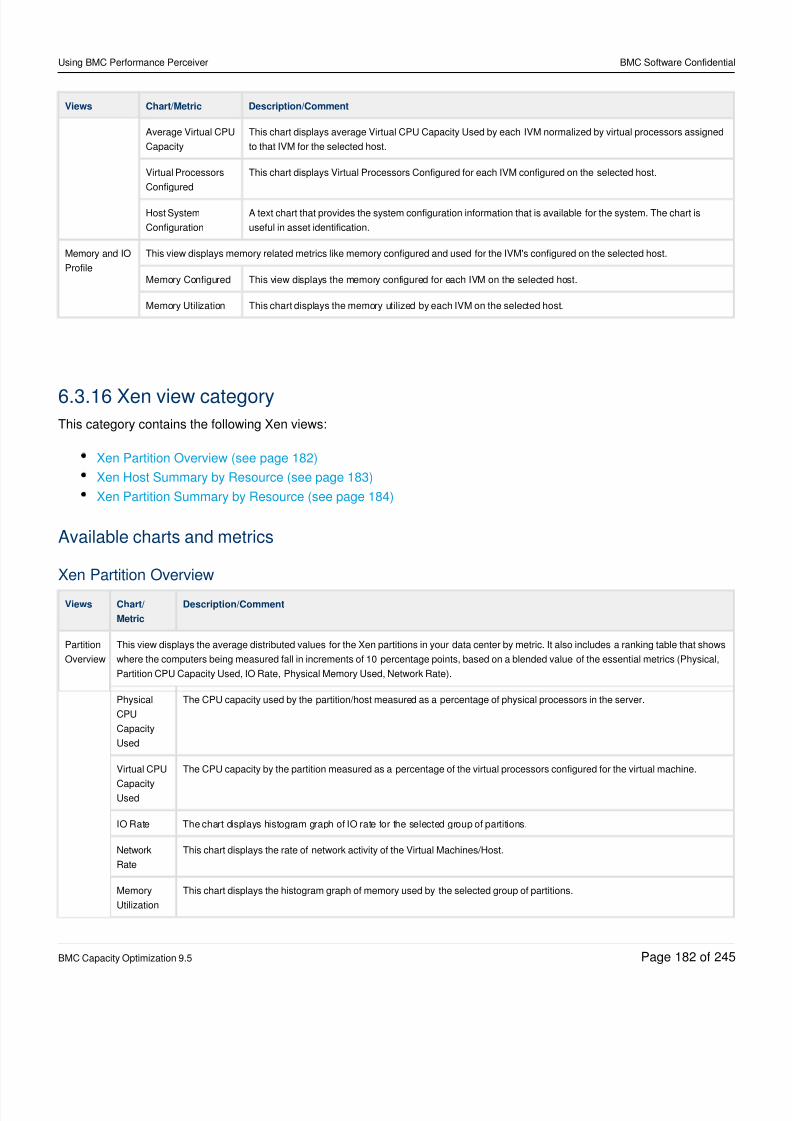
8/21/2019 Using BMC Performance Perceiver-V5-20141128_0503
http://slidepdf.com/reader/full/using-bmc-performance-perceiver-v5-201411280503 182/245
Using BMC Performance Perceiver BMC Software Confidential
BMC Capacity Optimization 9.5 Page of182 245
Views Chart/Metric Description/Comment
Average Virtual CPU
Capacity
This chart displays average Virtual CPU Capacity Used by each IVM normalized by virtual processors assigned
to that IVM for the selected host.
Virtual Processors
Configured
This chart displays Virtual Processors Configured for each IVM configured on the selected host.
Host System
Configuration
A text chart that provides the system configuration information that is available for the system. The chart is
useful in asset identification.
Memory and IO
Profile
This view displays memory related metrics like memory configured and used for the IVM's configured on the selected host.
Memory Configured This view displays the memory configured for each IVM on the selected host.
Memory Utilization This chart displays the memory utilized by each IVM on the selected host.
6.3.16 Xen view categoryThis category contains the following Xen views:
Xen Partition Overview (see page 182)
Xen Host Summary by Resource (see page 183)
Xen Partition Summary by Resource (see page 184)
Available charts and metrics
Xen Partition Overview
Views Chart/
Metric
Description/Comment
Partition
Overview
This view displays the average distributed values for the Xen partitions in your data center by metric. It also includes a ranking table that shows
where the computers being measured fall in increments of 10 percentage points, based on a blended value of the essential metrics (Physical,
Partition CPU Capacity Used, IO Rate, Physical Memory Used, Network Rate).
Physical
CPU
Capacity
Used
The CPU capacity used by the partition/host measured as a percentage of physical processors in the server.
Virtual CPU
CapacityUsed
The CPU capacity by the partition measured as a percentage of the virtual processors configured for the virtual machine.
IO Rate The chart displays histogram graph of IO rate for the selected group of partitions.
Network
Rate
This chart displays the rate of network activity of the Virtual Machines/Host.
Memory
Utilization
This chart displays the histogram graph of memory used by the selected group of partitions.
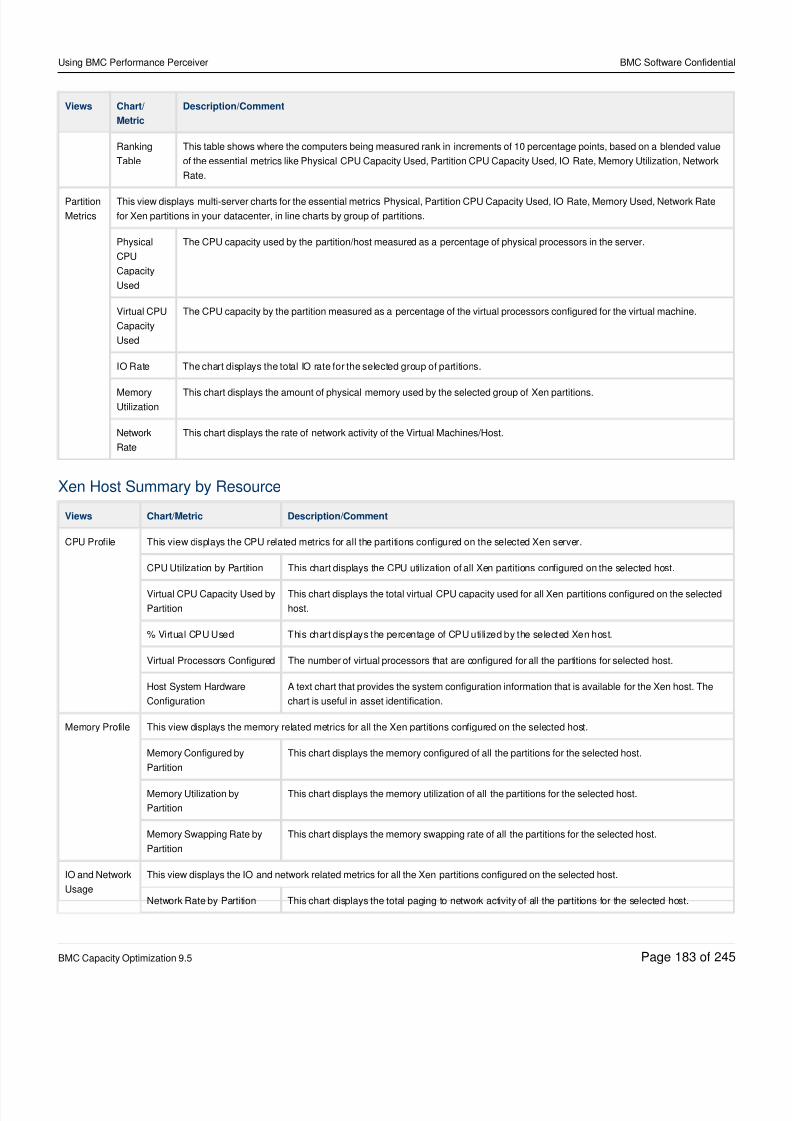
8/21/2019 Using BMC Performance Perceiver-V5-20141128_0503
http://slidepdf.com/reader/full/using-bmc-performance-perceiver-v5-201411280503 183/245
Using BMC Performance Perceiver BMC Software Confidential
BMC Capacity Optimization 9.5 Page of183 245
Views Chart/
Metric
Description/Comment
Ranking
Table
This table shows where the computers being measured rank in increments of 10 percentage points, based on a blended value
of the essential metrics like Physical CPU Capacity Used, Partition CPU Capacity Used, IO Rate, Memory Utilization, Network
Rate.
Partition
Metrics
This view displays multi-server charts for the essential metrics Physical, Partition CPU Capacity Used, IO Rate, Memory Used, Network Rate
for Xen partitions in your datacenter, in line charts by group of partitions.
Physical
CPU
Capacity
Used
The CPU capacity used by the partition/host measured as a percentage of physical processors in the server.
Virtual CPU
Capacity
Used
The CPU capacity by the partition measured as a percentage of the virtual processors configured for the virtual machine.
IO Rate The chart displays the total IO rate for the selected group of partitions.
MemoryUtilization
This chart displays the amount of physical memory used by the selected group of Xen partitions.
Network
Rate
This chart displays the rate of network activity of the Virtual Machines/Host.
Xen Host Summary by Resource
Views Chart/Metric Description/Comment
CPU Profile This view displays the CPU related metrics for all the partitions configured on the selected Xen server.
CPU Utilization by Partition This chart displays the CPU utilization of all Xen partitions configured on the selected host.
Virtual CPU Capacity Used by
Partition
This chart displays the total virtual CPU capacity used for all Xen partitions configured on the selected
host.
% Virtual CPU Used This chart displays the percentage of CPU utilized by the selected Xen host.
Virtual Processors Configured The number of virtual processors that are configured for all the partitions for selected host.
Host System Hardware
Configuration
A text chart that provides the system configuration information that is available for the Xen host. The
chart is useful in asset identification.
Memory Profile This view displays the memory related metrics for all the Xen partitions configured on the selected host.
Memory Configured by
Partition
This chart displays the memory configured of all the partitions for the selected host.
Memory Utilization by
Partition
This chart displays the memory utilization of all the partitions for the selected host.
Memory Swapping Rate by
Partition
This chart displays the memory swapping rate of all the partitions for the selected host.
IO and Network
Usage
This view displays the IO and network related metrics for all the Xen partitions configured on the selected host.
Network Rate by Partition This chart displays the total paging to network activity of all the partitions for the selected host.
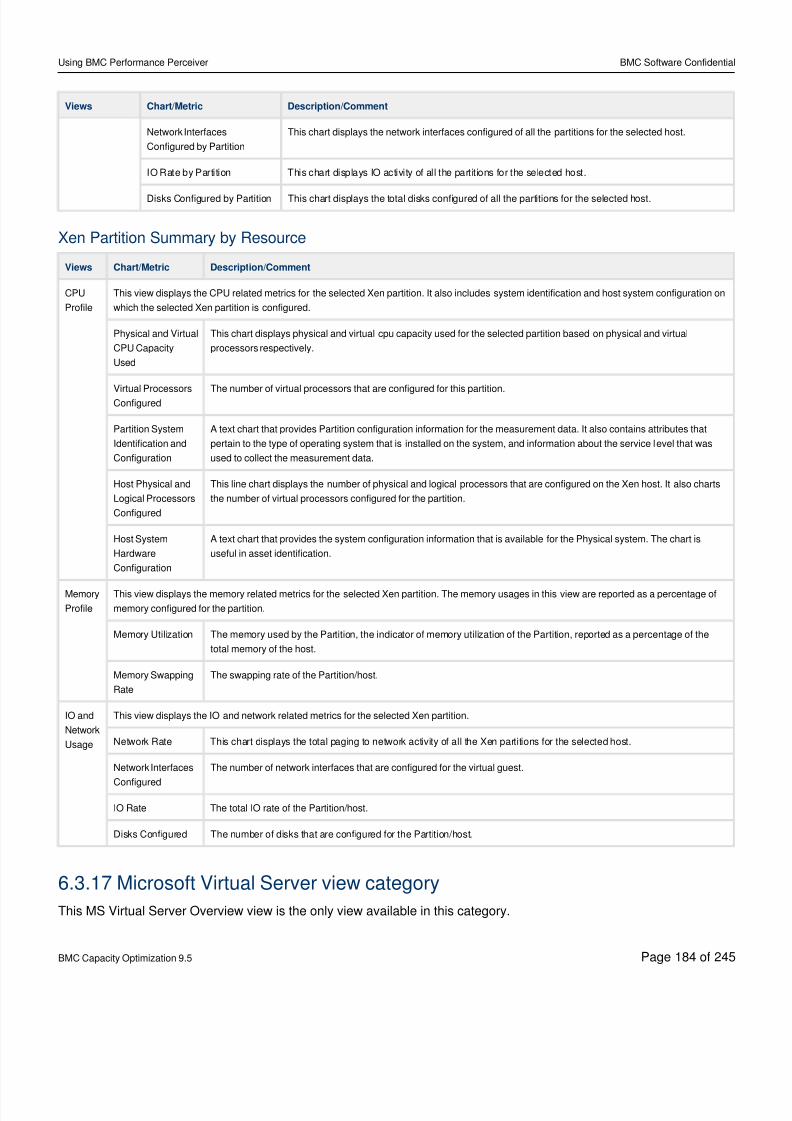
8/21/2019 Using BMC Performance Perceiver-V5-20141128_0503
http://slidepdf.com/reader/full/using-bmc-performance-perceiver-v5-201411280503 184/245
Using BMC Performance Perceiver BMC Software Confidential
BMC Capacity Optimization 9.5 Page of184 245
Views Chart/Metric Description/Comment
Network Interfaces
Configured by Partition
This chart displays the network interfaces configured of all the partitions for the selected host.
IO Rate by Partition This chart displays IO activity of all the partit ions for the selected host.
Disks Configured by Partition This chart displays the total disks configured of all the partitions for the selected host.
Xen Partition Summary by Resource
Views Chart/Metric Description/Comment
CPU
Profile
This view displays the CPU related metrics for the selected Xen partition. It also includes system identification and host system configuration on
which the selected Xen partition is configured.
Physical and Virtual
CPU Capacity
Used
This chart displays physical and virtual cpu capacity used for the selected partition based on physical and virtual
processors respectively.
Virtual ProcessorsConfigured
The number of virtual processors that are configured for this partition.
Partition System
Identification and
Configuration
A text chart that provides Partition configuration information for the measurement data. It also contains attributes that
pertain to the type of operating system that is installed on the system, and information about the service level that was
used to collect the measurement data.
Host Physical and
Logical Processors
Configured
This line chart displays the number of physical and logical processors that are configured on the Xen host. It also charts
the number of virtual processors configured for the partition.
Host System
Hardware
Configuration
A text chart that provides the system configuration information that is available for the Physical system. The chart is
useful in asset identification.
Memory
Profile
This view displays the memory related metrics for the selected Xen partition. The memory usages in this view are reported as a percentage of
memory configured for the partition.
Memory Utilization The memory used by the Partition, the indicator of memory utilization of the Partition, reported as a percentage of the
total memory of the host.
Memory Swapping
Rate
The swapping rate of the Partition/host.
IO and
Network
Usage
This view displays the IO and network related metrics for the selected Xen partition.
Network Rate This chart displays the total paging to network activity of all the Xen partitions for the selected host.
Network Interfaces
Configured
The number of network interfaces that are configured for the virtual guest.
IO Rate The total IO rate of the Partition/host.
Disks Configured The number of disks that are configured for the Partition/host.
6.3.17 Microsoft Virtual Server view category
This MS Virtual Server Overview view is the only view available in this category.
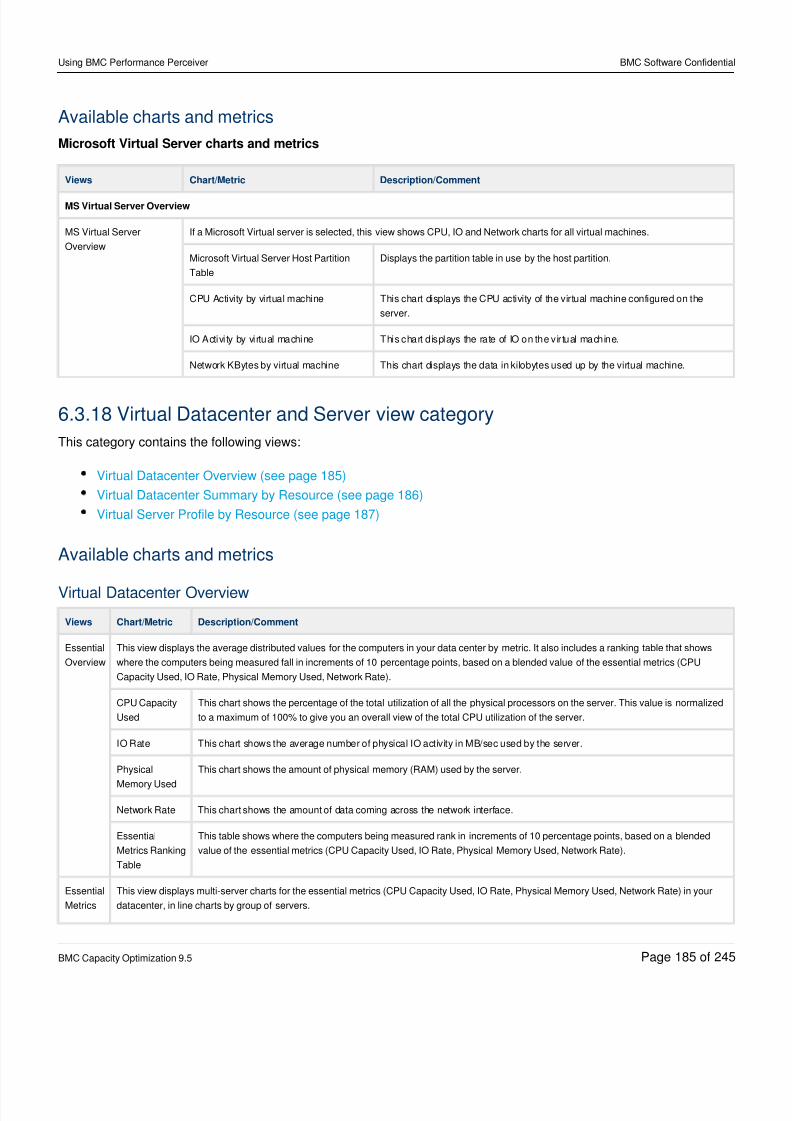
8/21/2019 Using BMC Performance Perceiver-V5-20141128_0503
http://slidepdf.com/reader/full/using-bmc-performance-perceiver-v5-201411280503 185/245
Using BMC Performance Perceiver BMC Software Confidential
BMC Capacity Optimization 9.5 Page of185 245
Available charts and metrics
Microsoft Virtual Server charts and metrics
Views Chart/Metric Description/Comment
MS Virtual Server Overview
MS Virtual Server
Overview
If a Microsoft Virtual server is selected, this view shows CPU, IO and Network charts for all virtual machines.
Microsoft Virtual Server Host Partition
Table
Displays the partition table in use by the host partition.
CPU Activity by virtual machine This chart displays the CPU activity of the virtual machine configured on the
server.
IO Activity by virtual machine This chart displays the rate of IO on the vir tual machine.
Network KBytes by virtual machine This chart displays the data in kilobytes used up by the virtual machine.
6.3.18 Virtual Datacenter and Server view category
This category contains the following views:
Virtual Datacenter Overview (see page 185)
Virtual Datacenter Summary by Resource (see page 186)
Virtual Server Profile by Resource (see page 187)
Available charts and metrics
Virtual Datacenter Overview
Views Chart/Metric Description/Comment
Essential
Overview
This view displays the average distributed values for the computers in your data center by metric. It also includes a ranking table that shows
where the computers being measured fall in increments of 10 percentage points, based on a blended value of the essential metrics (CPU
Capacity Used, IO Rate, Physical Memory Used, Network Rate).
CPU Capacity
Used
This chart shows the percentage of the total utilization of all the physical processors on the server. This value is normalized
to a maximum of 100% to give you an overall view of the total CPU utilization of the server.
IO Rate This chart shows the average number of physical IO activity in MB/sec used by the server.
Physical
Memory Used
This chart shows the amount of physical memory (RAM) used by the server.
Network Rate This chart shows the amount of data coming across the network interface.
Essential
Metrics Ranking
Table
This table shows where the computers being measured rank in increments of 10 percentage points, based on a blended
value of the essential metrics (CPU Capacity Used, IO Rate, Physical Memory Used, Network Rate).
Essential
Metrics
This view displays multi-server charts for the essential metrics (CPU Capacity Used, IO Rate, Physical Memory Used, Network Rate) in your
datacenter, in line charts by group of servers.
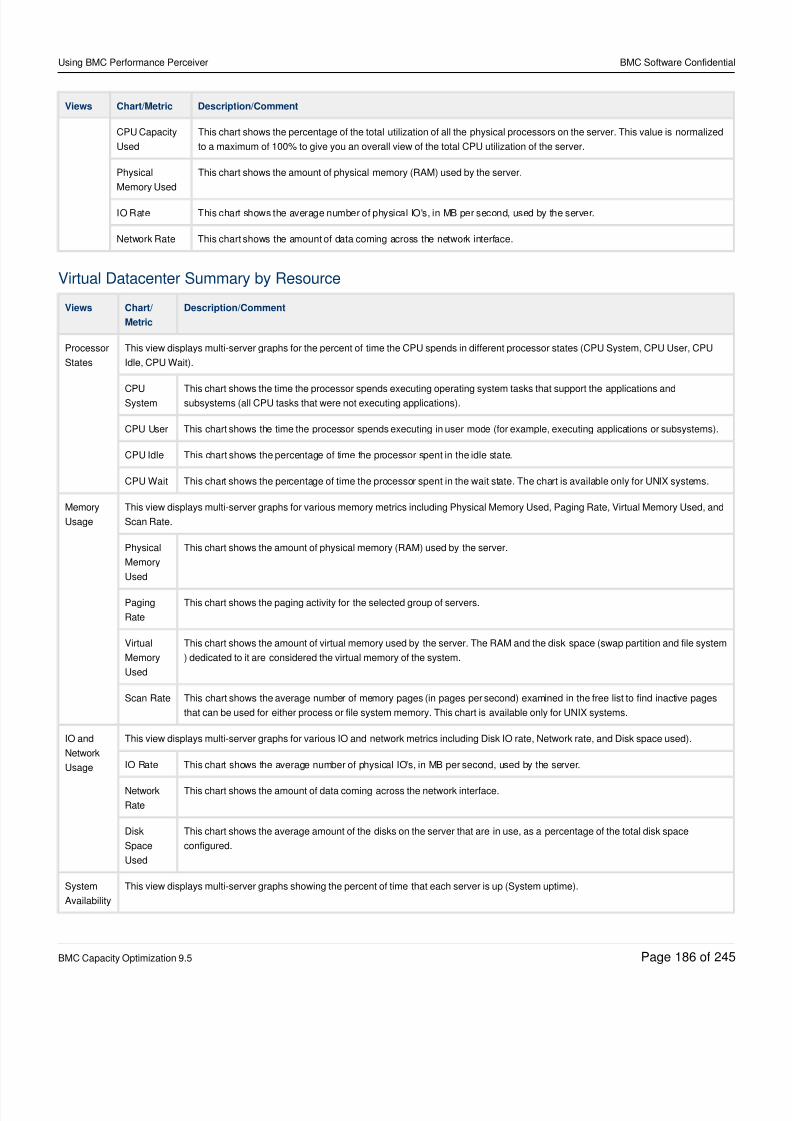
8/21/2019 Using BMC Performance Perceiver-V5-20141128_0503
http://slidepdf.com/reader/full/using-bmc-performance-perceiver-v5-201411280503 186/245
Using BMC Performance Perceiver BMC Software Confidential
BMC Capacity Optimization 9.5 Page of186 245
Views Chart/Metric Description/Comment
CPU Capacity
Used
This chart shows the percentage of the total utilization of all the physical processors on the server. This value is normalized
to a maximum of 100% to give you an overall view of the total CPU utilization of the server.
Physical
Memory Used
This chart shows the amount of physical memory (RAM) used by the server.
IO Rate This chart shows the average number of physical IO's, in MB per second, used by the server.
Network Rate This chart shows the amount of data coming across the network interface.
Virtual Datacenter Summary by Resource
Views Chart/
Metric
Description/Comment
Processor
States
This view displays multi-server graphs for the percent of time the CPU spends in different processor states (CPU System, CPU User, CPU
Idle, CPU Wait).
CPUSystem
This chart shows the time the processor spends executing operating system tasks that support the applications andsubsystems (all CPU tasks that were not executing applications).
CPU User This chart shows the time the processor spends executing in user mode (for example, executing applications or subsystems).
CPU Idle This chart shows the percentage of time the processor spent in the idle state.
CPU Wait This chart shows the percentage of time the processor spent in the wait state. The chart is available only for UNIX systems.
Memory
Usage
This view displays multi-server graphs for various memory metrics including Physical Memory Used, Paging Rate, Virtual Memory Used, and
Scan Rate.
Physical
Memory
Used
This chart shows the amount of physical memory (RAM) used by the server.
Paging
Rate
This chart shows the paging activity for the selected group of servers.
Virtual
Memory
Used
This chart shows the amount of virtual memory used by the server. The RAM and the disk space (swap partition and file system
) dedicated to it are considered the virtual memory of the system.
Scan Rate This chart shows the average number of memory pages (in pages per second) examined in the free list to find inactive pages
that can be used for either process or file system memory. This chart is available only for UNIX systems.
IO and
Network
Usage
This view displays multi-server graphs for various IO and network metrics including Disk IO rate, Network rate, and Disk space used).
IO Rate This chart shows the average number of physical IO's, in MB per second, used by the server.
Network
Rate
This chart shows the amount of data coming across the network interface.
Disk
Space
Used
This chart shows the average amount of the disks on the server that are in use, as a percentage of the total disk space
configured.
System
Availability
This view displays multi-server graphs showing the percent of time that each server is up (System uptime).
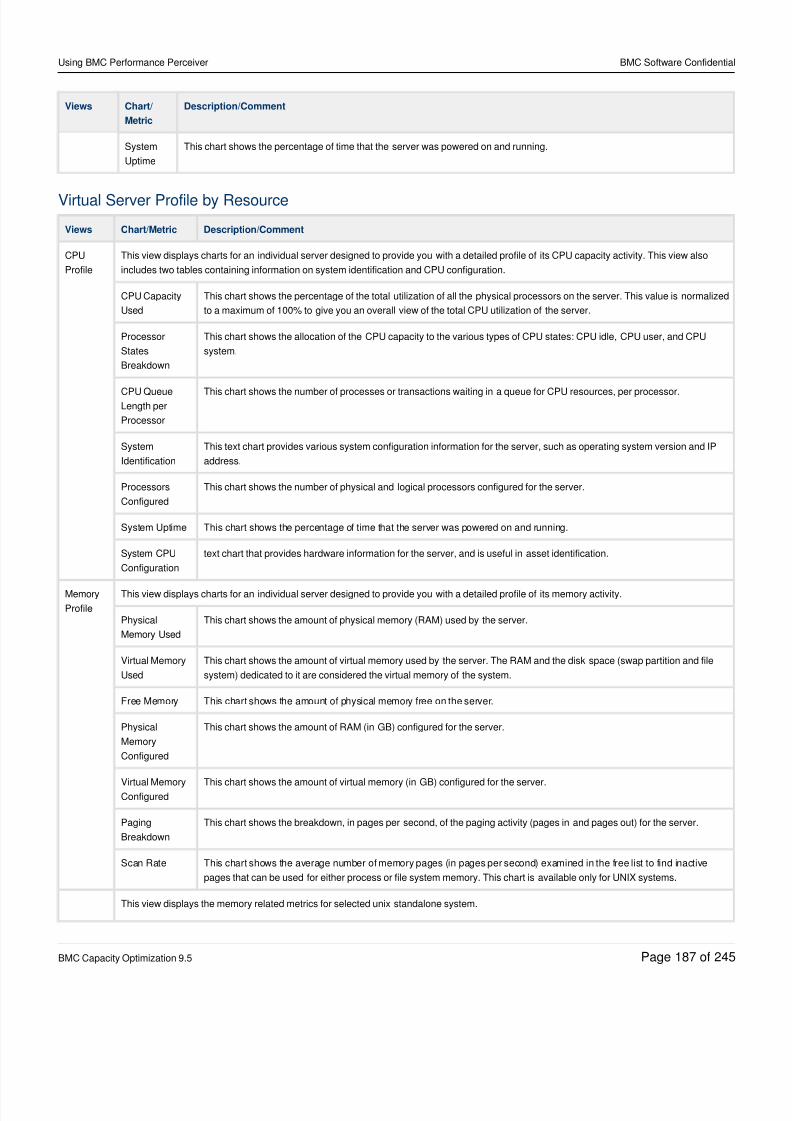
8/21/2019 Using BMC Performance Perceiver-V5-20141128_0503
http://slidepdf.com/reader/full/using-bmc-performance-perceiver-v5-201411280503 187/245
Using BMC Performance Perceiver BMC Software Confidential
BMC Capacity Optimization 9.5 Page of187 245
Views Chart/
Metric
Description/Comment
System
Uptime
This chart shows the percentage of time that the server was powered on and running.
Virtual Server Profile by Resource
Views Chart/Metric Description/Comment
CPU
Profile
This view displays charts for an individual server designed to provide you with a detailed profile of its CPU capacity activity. This view also
includes two tables containing information on system identification and CPU configuration.
CPU Capacity
Used
This chart shows the percentage of the total utilization of all the physical processors on the server. This value is normalized
to a maximum of 100% to give you an overall view of the total CPU utilization of the server.
Processor
States
Breakdown
This chart shows the allocation of the CPU capacity to the various types of CPU states: CPU idle, CPU user, and CPU
system.
CPU QueueLength per
Processor
This chart shows the number of processes or transactions waiting in a queue for CPU resources, per processor.
System
Identification
This text chart provides various system configuration information for the server, such as operating system version and IP
address.
Processors
Configured
This chart shows the number of physical and logical processors configured for the server.
System Uptime This chart shows the percentage of time that the server was powered on and running.
System CPU
Configuration
text chart that provides hardware information for the server, and is useful in asset identification.
Memory
Profile
This view displays charts for an individual server designed to provide you with a detailed profile of its memory activity.
Physical
Memory Used
This chart shows the amount of physical memory (RAM) used by the server.
Virtual Memory
Used
This chart shows the amount of virtual memory used by the server. The RAM and the disk space (swap partition and file
system) dedicated to it are considered the virtual memory of the system.
Free Memory This chart shows the amount of physical memory free on the server.
Physical
Memory
Configured
This chart shows the amount of RAM (in GB) configured for the server.
Virtual MemoryConfigured
This chart shows the amount of virtual memory (in GB) configured for the server.
Paging
Breakdown
This chart shows the breakdown, in pages per second, of the paging activity (pages in and pages out) for the server.
Scan Rate This chart shows the average number of memory pages (in pages per second) examined in the free list to find inactive
pages that can be used for either process or file system memory. This chart is available only for UNIX systems.
This view displays the memory related metrics for selected unix standalone system.
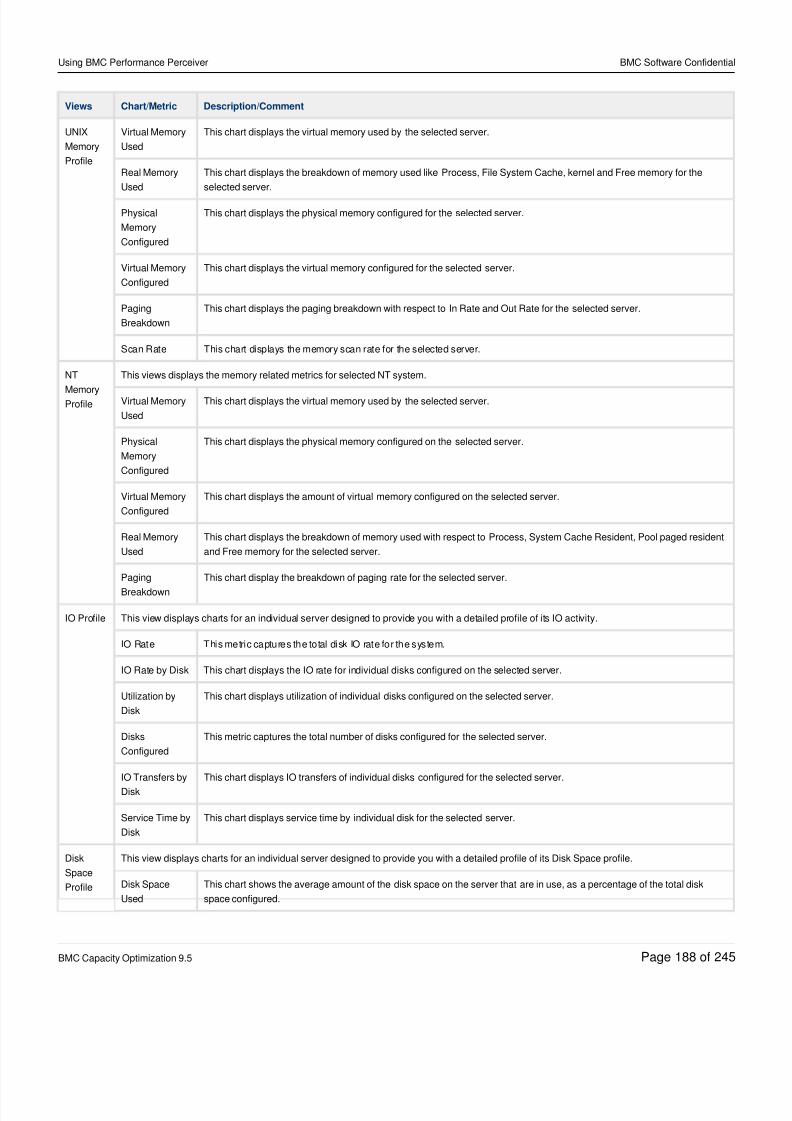
8/21/2019 Using BMC Performance Perceiver-V5-20141128_0503
http://slidepdf.com/reader/full/using-bmc-performance-perceiver-v5-201411280503 188/245
Using BMC Performance Perceiver BMC Software Confidential
BMC Capacity Optimization 9.5 Page of188 245
Views Chart/Metric Description/Comment
UNIX
Memory
Profile
Virtual Memory
Used
This chart displays the virtual memory used by the selected server.
Real Memory
Used
This chart displays the breakdown of memory used like Process, File System Cache, kernel and Free memory for the
selected server.
Physical
Memory
Configured
This chart displays the physical memory configured for the selected server.
Virtual Memory
Configured
This chart displays the virtual memory configured for the selected server.
Paging
Breakdown
This chart displays the paging breakdown with respect to In Rate and Out Rate for the selected server.
Scan Rate This chart displays the memory scan rate for the selected server.
NT
MemoryProfile
This views displays the memory related metrics for selected NT system.
Virtual Memory
Used
This chart displays the virtual memory used by the selected server.
Physical
Memory
Configured
This chart displays the physical memory configured on the selected server.
Virtual Memory
Configured
This chart displays the amount of virtual memory configured on the selected server.
Real Memory
Used
This chart displays the breakdown of memory used with respect to Process, System Cache Resident, Pool paged resident
and Free memory for the selected server.
Paging
Breakdown
This chart display the breakdown of paging rate for the selected server.
IO Profile This view displays charts for an individual server designed to provide you with a detailed profile of its IO activity.
IO Rate This metric captures the total disk IO rate for the system.
IO Rate by Disk This chart displays the IO rate for individual disks configured on the selected server.
Utilization by
Disk
This chart displays utilization of individual disks configured on the selected server.
Disks
Configured
This metric captures the total number of disks configured for the selected server.
IO Transfers by
Disk
This chart displays IO transfers of individual disks configured for the selected server.
Service Time by
Disk
This chart displays service time by individual disk for the selected server.
Disk
Space
Profile
This view displays charts for an individual server designed to provide you with a detailed profile of its Disk Space profile.
Disk Space
Used
This chart shows the average amount of the disk space on the server that are in use, as a percentage of the total disk
space configured.
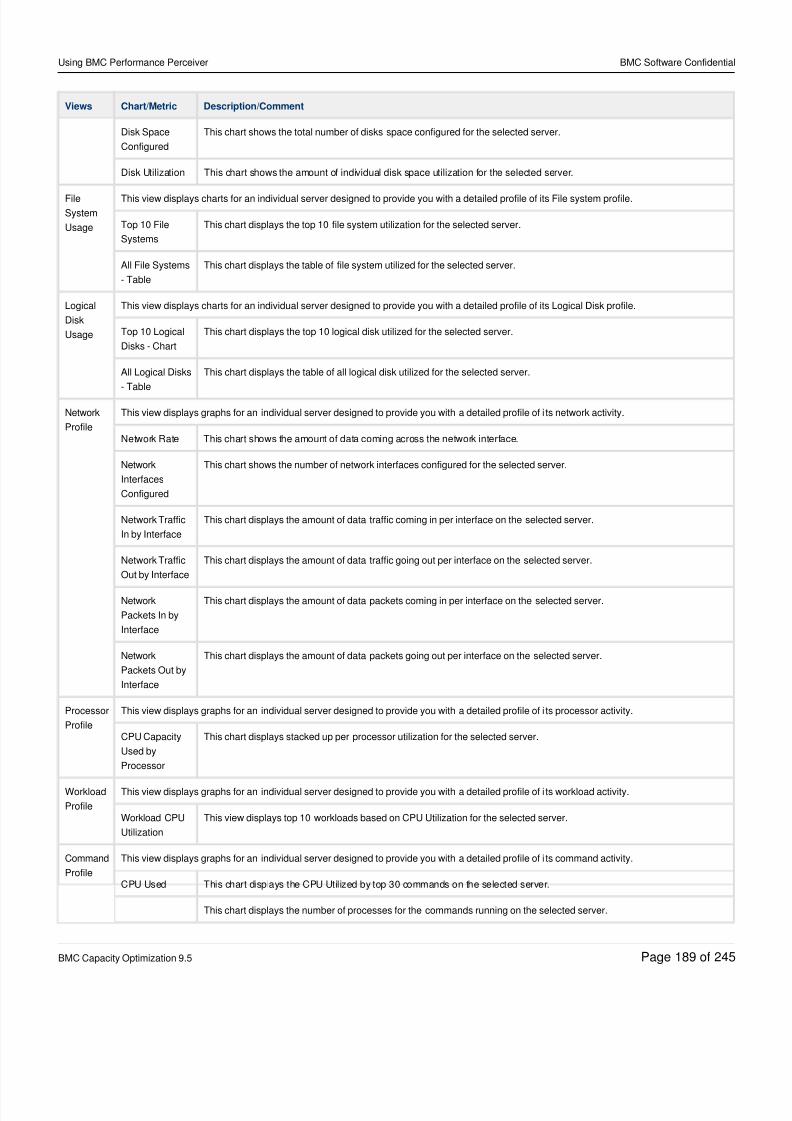
8/21/2019 Using BMC Performance Perceiver-V5-20141128_0503
http://slidepdf.com/reader/full/using-bmc-performance-perceiver-v5-201411280503 189/245
Using BMC Performance Perceiver BMC Software Confidential
BMC Capacity Optimization 9.5 Page of189 245
Views Chart/Metric Description/Comment
Disk Space
Configured
This chart shows the total number of disks space configured for the selected server.
Disk Utilization This chart shows the amount of individual disk space utilization for the selected server.
File
System
Usage
This view displays charts for an individual server designed to provide you with a detailed profile of its File system profile.
Top 10 File
Systems
This chart displays the top 10 file system utilization for the selected server.
All File Systems
- Table
This chart displays the table of file system utilized for the selected server.
Logical
Disk
Usage
This view displays charts for an individual server designed to provide you with a detailed profile of its Logical Disk profile.
Top 10 Logical
Disks - Chart
This chart displays the top 10 logical disk utilized for the selected server.
All Logical Disks
- Table
This chart displays the table of all logical disk utilized for the selected server.
Network
Profile
This view displays graphs for an individual server designed to provide you with a detailed profile of i ts network activity.
Network Rate This chart shows the amount of data coming across the network interface.
Network
Interfaces
Configured
This chart shows the number of network interfaces configured for the selected server.
Network Traffic
In by Interface
This chart displays the amount of data traffic coming in per interface on the selected server.
Network Traffic
Out by Interface
This chart displays the amount of data traffic going out per interface on the selected server.
Network
Packets In by
Interface
This chart displays the amount of data packets coming in per interface on the selected server.
Network
Packets Out by
Interface
This chart displays the amount of data packets going out per interface on the selected server.
Processor
Profile
This view displays graphs for an individual server designed to provide you with a detailed profile of i ts processor activity.
CPU Capacity
Used by
Processor
This chart displays stacked up per processor utilization for the selected server.
Workload
Profile
This view displays graphs for an individual server designed to provide you with a detailed profile of i ts workload activity.
Workload CPU
Utilization
This view displays top 10 workloads based on CPU Utilization for the selected server.
Command
Profile
This view displays graphs for an individual server designed to provide you with a detailed profile of i ts command activity.
CPU Used This chart displays the CPU Utilized by top 30 commands on the selected server.
This chart displays the number of processes for the commands running on the selected server.
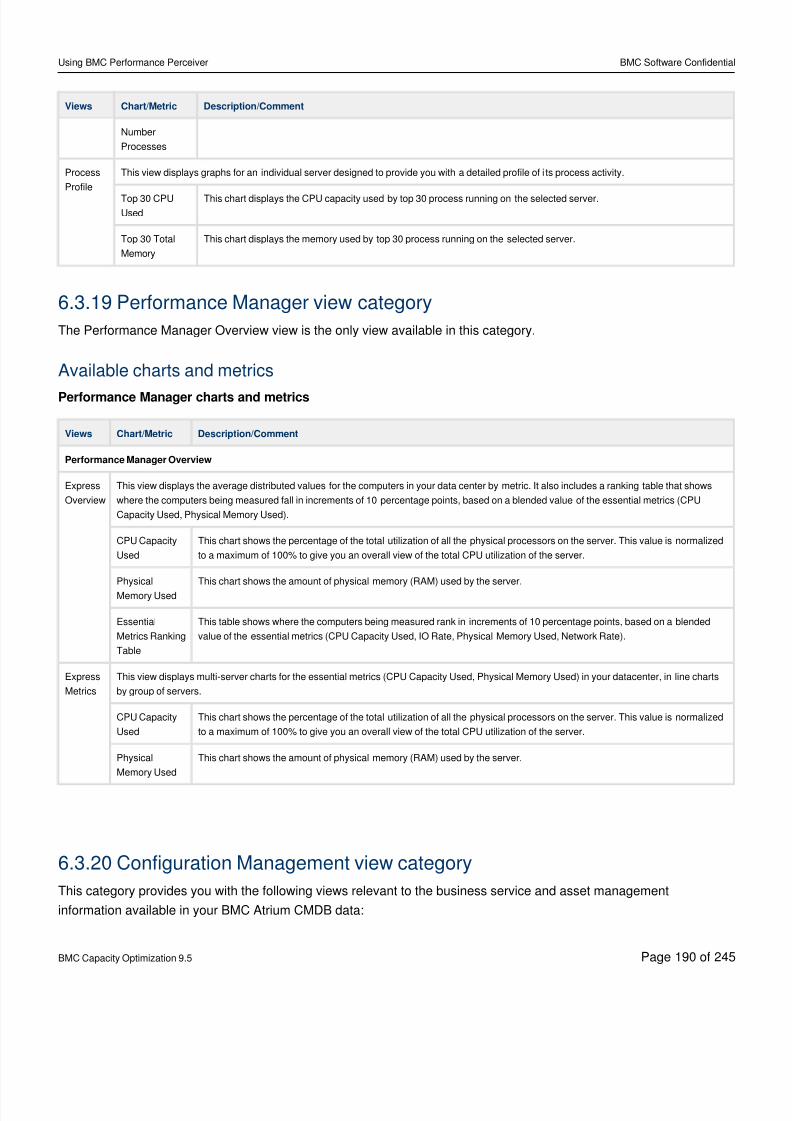
8/21/2019 Using BMC Performance Perceiver-V5-20141128_0503
http://slidepdf.com/reader/full/using-bmc-performance-perceiver-v5-201411280503 190/245
Using BMC Performance Perceiver BMC Software Confidential
BMC Capacity Optimization 9.5 Page of190 245
Views Chart/Metric Description/Comment
Number
Processes
Process
Profile
This view displays graphs for an individual server designed to provide you with a detailed profile of i ts process activity.
Top 30 CPU
Used
This chart displays the CPU capacity used by top 30 process running on the selected server.
Top 30 Total
Memory
This chart displays the memory used by top 30 process running on the selected server.
6.3.19 Performance Manager view category
The Performance Manager Overview view is the only view available in this category.
Available charts and metrics
Performance Manager charts and metrics
Views Chart/Metric Description/Comment
Performance Manager Overview
Express
Overview
This view displays the average distributed values for the computers in your data center by metric. It also includes a ranking table that shows
where the computers being measured fall in increments of 10 percentage points, based on a blended value of the essential metrics (CPU
Capacity Used, Physical Memory Used).
CPU Capacity
Used
This chart shows the percentage of the total utilization of all the physical processors on the server. This value is normalized
to a maximum of 100% to give you an overall view of the total CPU utilization of the server.
Physical
Memory Used
This chart shows the amount of physical memory (RAM) used by the server.
Essential
Metrics Ranking
Table
This table shows where the computers being measured rank in increments of 10 percentage points, based on a blended
value of the essential metrics (CPU Capacity Used, IO Rate, Physical Memory Used, Network Rate).
Express
Metrics
This view displays multi-server charts for the essential metrics (CPU Capacity Used, Physical Memory Used) in your datacenter, in line charts
by group of servers.
CPU Capacity
Used
This chart shows the percentage of the total utilization of all the physical processors on the server. This value is normalized
to a maximum of 100% to give you an overall view of the total CPU utilization of the server.
Physical
Memory Used
This chart shows the amount of physical memory (RAM) used by the server.
6.3.20 Configuration Management view category
This category provides you with the following views relevant to the business service and asset management
information available in your BMC Atrium CMDB data:
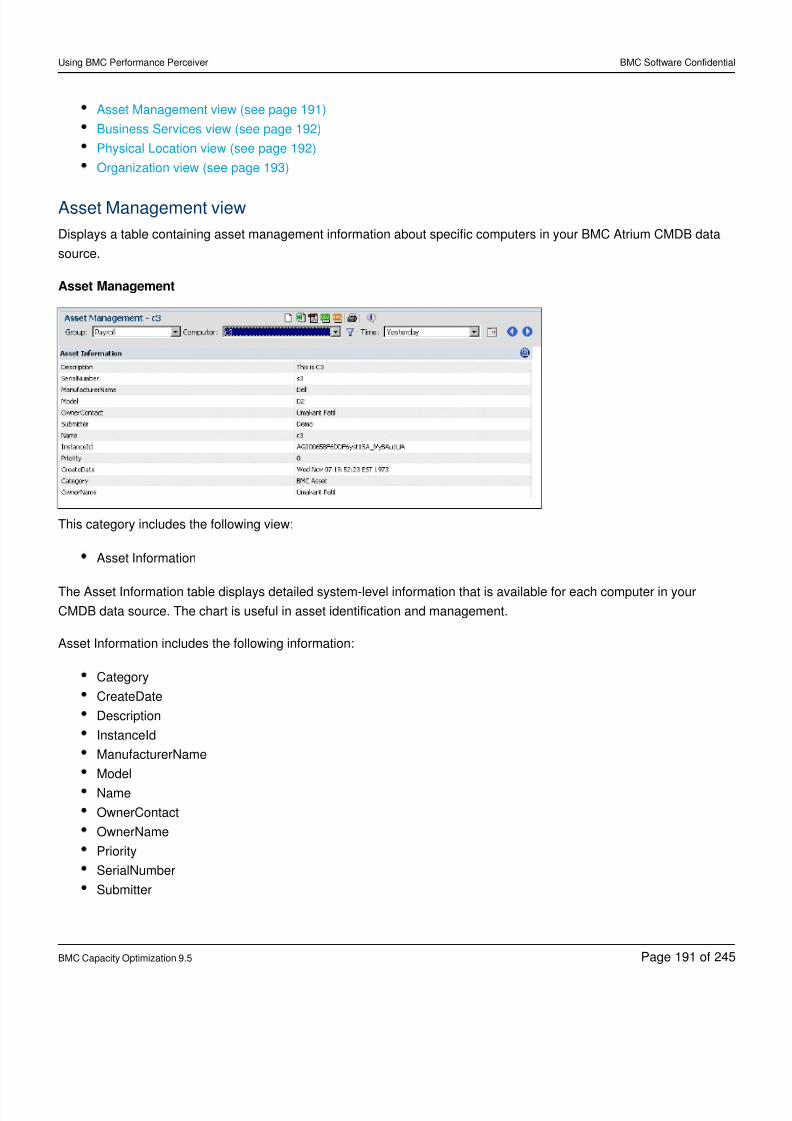
8/21/2019 Using BMC Performance Perceiver-V5-20141128_0503
http://slidepdf.com/reader/full/using-bmc-performance-perceiver-v5-201411280503 191/245
Using BMC Performance Perceiver BMC Software Confidential
BMC Capacity Optimization 9.5 Page of191 245
Asset Management view (see page 191)
Business Services view (see page 192)
Physical Location view (see page 192)
Organization view (see page 193)
Asset Management view
Displays a table containing asset management information about specific computers in your BMC Atrium CMDB data
source.
Asset Management
This category includes the following view:
Asset Information
The Asset Information table displays detailed system-level information that is available for each computer in your
CMDB data source. The chart is useful in asset identification and management.
Asset Information includes the following information:
Category
CreateDate
Description
InstanceId
ManufacturerName
Model
Name
OwnerContact
OwnerName
Priority
SerialNumber
Submitter
8/21/2019 Using BMC Performance Perceiver-V5-20141128_0503
http://slidepdf.com/reader/full/using-bmc-performance-perceiver-v5-201411280503 192/245
Using BMC Performance Perceiver BMC Software Confidential
BMC Capacity Optimization 9.5 Page of192 245
Business Services view
Displays a table containing information about the business services in your CMDB data source.
This category includes the following view:
Business Service Information
The Business Service Information table provides information about the business services stored in your CMDB data
source. A business service is typically a process used to conduct business that is shared by organizations within your
enterprise such as timekeeping, record keeping, problem reporting. Depending on the level of detail in your database,
you can see the business service name, owner name, description, and priority. The chart is useful for identifying the
variety of business services available in your enterprise.
Information provided in the chart includes:
Business Service: This table provides information about the business services stored in your CMDB data source. A business service is typically a process used to conduct business that is shared by organizations within your
enterprise such as timekeeping, record keeping, problem reporting. Depending on the level of detail in your
database, you can see the business service name, owner name, description, and priority. The chart is useful for
identifying the variety of business services available in your enterprise.
Owner Name
Description
Priority
Physical Location view
This table provides information about the physical location of corporate assets stored in your CMDB data source.Depending on the level of detail in your database, you can see the location, a description, the owner name, priority, the
city, and country. For example, you might have a physical location called the Martin Gosher campus located in Baton
Rouge, Louisiana. The chart is useful for identifying the geographic distribution of assets in your enterprise.
This category includes the following view:
Physical Location Information
Physical Location Information includes the following charts:
Physical Location: This table provides information about the physical location of corporate assets stored in your
CMDB data source. Depending on the level of detail in your database, you can see the location, a description,
the owner name, priority, the city, and country. For example, you might have a physical location called the
Martin Gosher campus located in Baton Rouge, Louisiana. The chart is useful for identifying the geographic
distribution of assets in your enterprise.
Description
Owner Name
8/21/2019 Using BMC Performance Perceiver-V5-20141128_0503
http://slidepdf.com/reader/full/using-bmc-performance-perceiver-v5-201411280503 193/245
Using BMC Performance Perceiver BMC Software Confidential
BMC Capacity Optimization 9.5 Page of193 245
Priority
City
Country
Organization view
Displays a table containing information about the organizations in your BMC Atrium CMDB data source.
This category includes the following view:
Organization Information
Organization Information includes the following charts:
Organization: This table provides information about the different organizations stored in your CMDB data source
such as development, marketing, strategic development. Depending on the level of detail in your database, you
can see the organization name, the owner name, priority, description, and business category into which the
organization falls. For example, you may have multiple organizations (Enterprise Management, Service
Automation) that fall in the same business category (research and development or marketing). The chart is
useful for identifying the various organizations in your enterprise and the business category into which they fall.
Description
Owner Name
Priority
Description
BusinessCategory
6.4 Custom Perceiver viewsAs a BMC Performance Perceiver administrator (sometimes referred to as analyst), you play an integral role in the
data center by maintaining the reporting tool that helps determine the health of your network environment and aid in
performance planning.
BMC Performance Perceiver provides a selection of predefined views that can be used for viewing the common key
metrics. However, as every environment is unique, you can customize BMC Performance Perceiver views to better
report on your system's status, meet required security criterion (restrict views to certain users or groups of users), and
to respond to the needs of your customers and organization.
For information about how to customize a view, see:
The Build Views tab and predefined view categories (see page 194)
Creating a new view (see page 199)
Deleting a custom view (see page 206)
Editing an existing view (see page 206)
Removing view categories (see page 208)
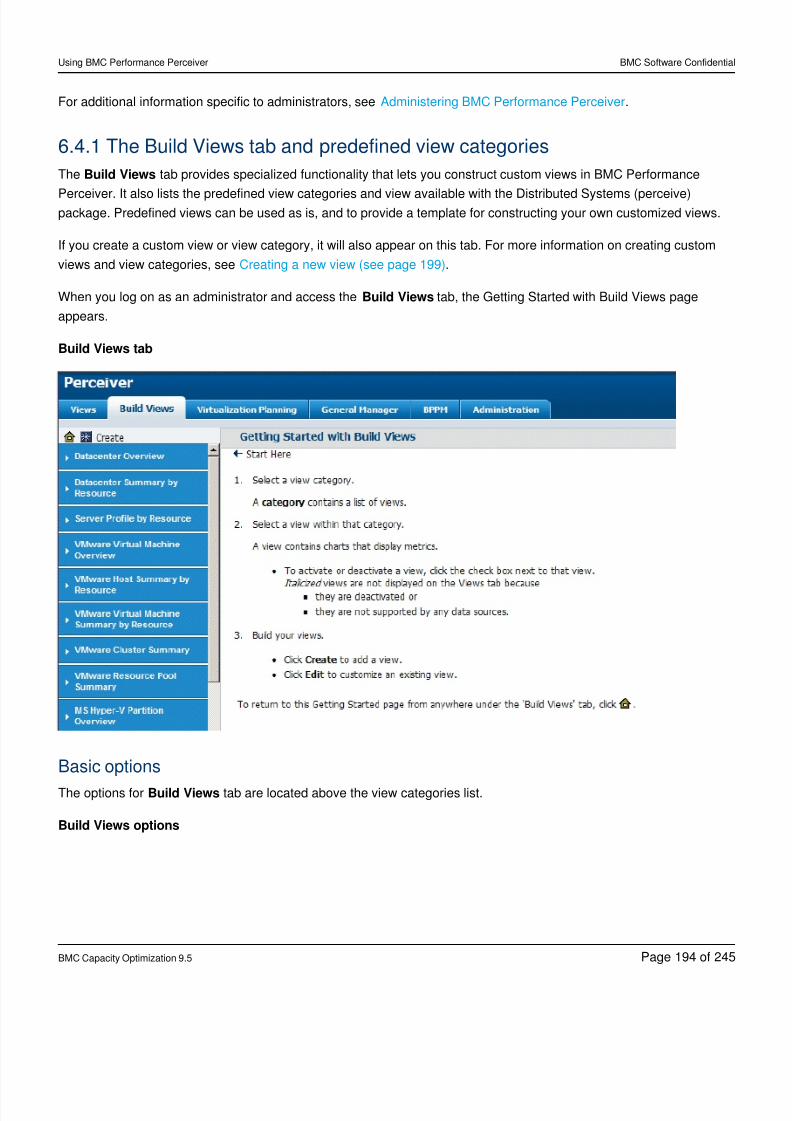
8/21/2019 Using BMC Performance Perceiver-V5-20141128_0503
http://slidepdf.com/reader/full/using-bmc-performance-perceiver-v5-201411280503 194/245
Using BMC Performance Perceiver BMC Software Confidential
BMC Capacity Optimization 9.5 Page of194 245
For additional information specific to administrators, see .Administering BMC Performance Perceiver
6.4.1 The Build Views tab and predefined view categories
The tab provides specialized functionality that lets you construct custom views in BMC PerformanceBuild Views
Perceiver. It also lists the predefined view categories and view available with the Distributed Systems (perceive)package. Predefined views can be used as is, and to provide a template for constructing your own customized views.
If you create a custom view or view category, it will also appear on this tab. For more information on creating custom
views and view categories, see .Creating a new view (see page 199)
When you log on as an administrator and access the tab, the Getting Started with Build Views pageBuild Views
appears.
Build Views tab
Basic options
The options for tab are located above the view categories list.Build Views
Build Views options
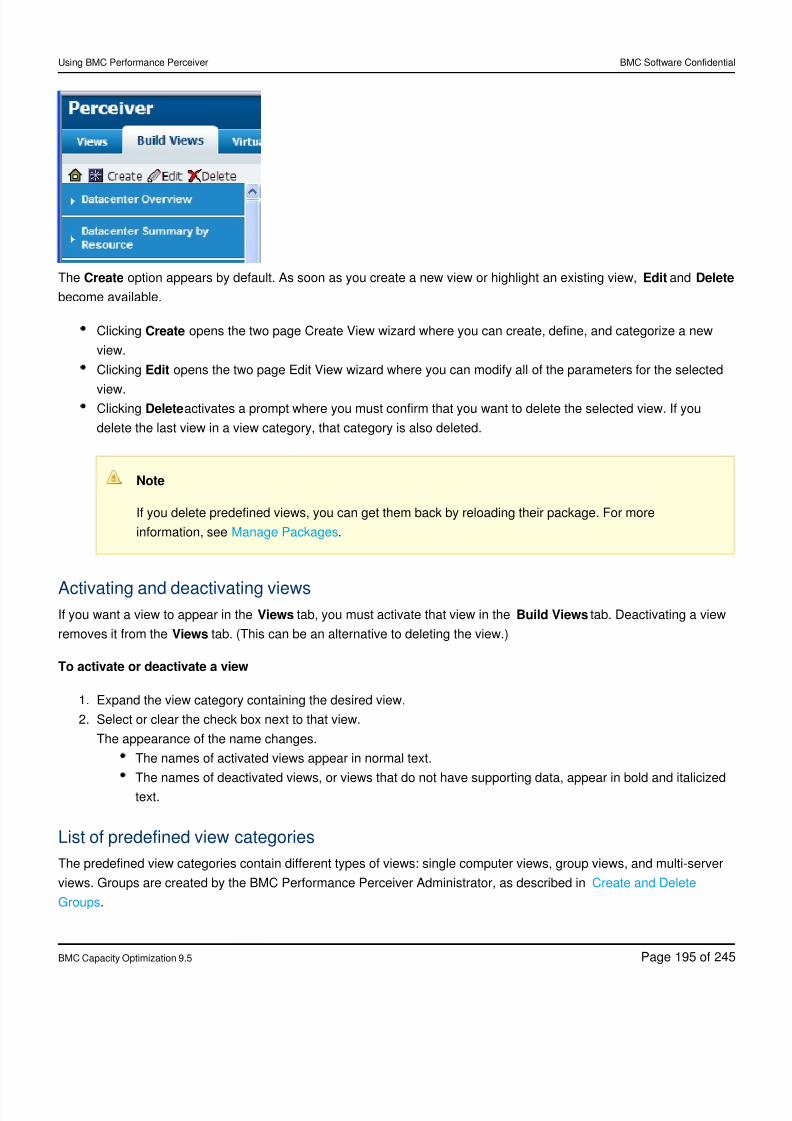
8/21/2019 Using BMC Performance Perceiver-V5-20141128_0503
http://slidepdf.com/reader/full/using-bmc-performance-perceiver-v5-201411280503 195/245
Using BMC Performance Perceiver BMC Software Confidential
BMC Capacity Optimization 9.5 Page of195 245
1.
2.
The option appears by default. As soon as you create a new view or highlight an existing view, andCreate Edit Delete
become available.
Clicking opens the two page Create View wizard where you can create, define, and categorize a newCreate
view.
Clicking opens the two page Edit View wizard where you can modify all of the parameters for the selectedEdit
view.Clicking activates a prompt where you must confirm that you want to delete the selected view. If youDelete
delete the last view in a view category, that category is also deleted.
Note
If you delete predefined views, you can get them back by reloading their package. For more
information, see .Manage Packages
Activating and deactivating viewsIf you want a view to appear in the tab, you must activate that view in the tab. Deactivating a viewViews Build Views
removes it from the tab. (This can be an alternative to deleting the view.)Views
To activate or deactivate a view
Expand the view category containing the desired view.
Select or clear the check box next to that view.
The appearance of the name changes.
The names of activated views appear in normal text.
The names of deactivated views, or views that do not have supporting data, appear in bold and italicized
text.
List of predefined view categories
The predefined view categories contain different types of views: single computer views, group views, and multi-server
views. Groups are created by the BMC Performance Perceiver Administrator, as described in Create and Delete
.Groups
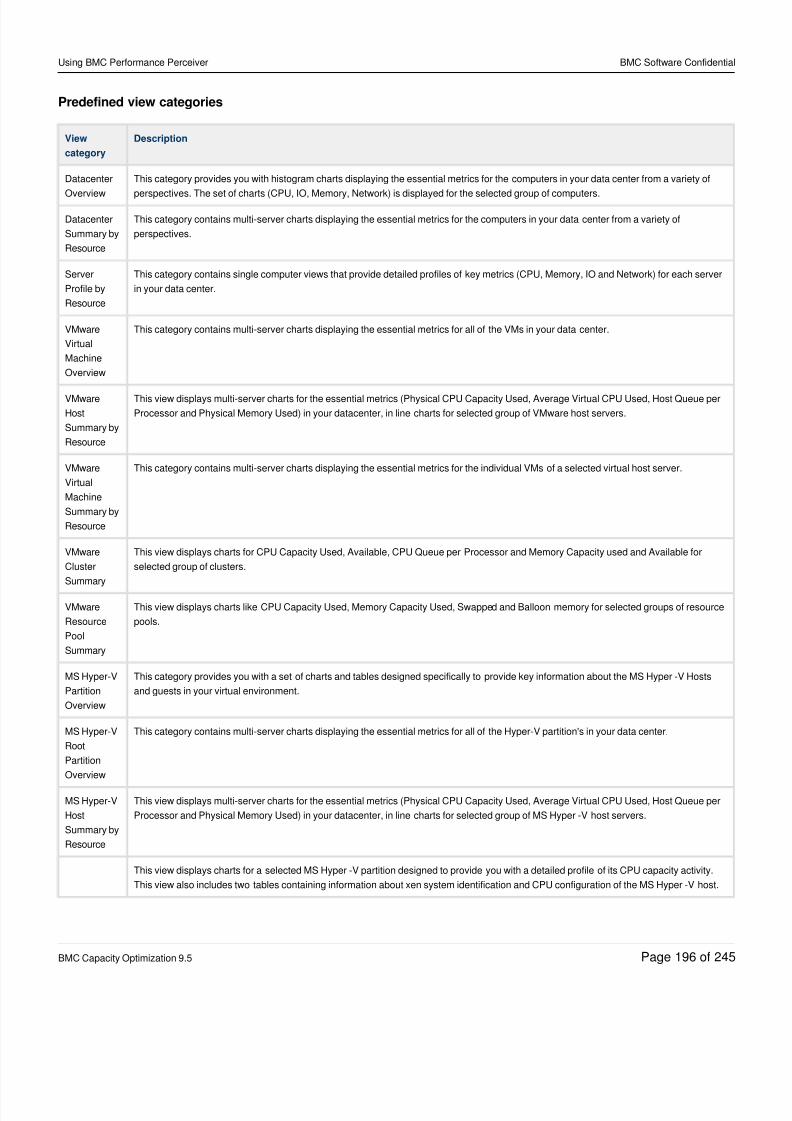
8/21/2019 Using BMC Performance Perceiver-V5-20141128_0503
http://slidepdf.com/reader/full/using-bmc-performance-perceiver-v5-201411280503 196/245
Using BMC Performance Perceiver BMC Software Confidential
BMC Capacity Optimization 9.5 Page of196 245
Predefined view categories
View
category
Description
Datacenter
Overview
This category provides you with histogram charts displaying the essential metrics for the computers in your data center from a variety of
perspectives. The set of charts (CPU, IO, Memory, Network) is displayed for the selected group of computers.
Datacenter
Summary by
Resource
This category contains multi-server charts displaying the essential metrics for the computers in your data center from a variety of
perspectives.
Server
Profile by
Resource
This category contains single computer views that provide detailed profiles of key metrics (CPU, Memory, IO and Network) for each server
in your data center.
VMware
Virtual
Machine
Overview
This category contains multi-server charts displaying the essential metrics for all of the VMs in your data center.
VMware
Host
Summary by
Resource
This view displays multi-server charts for the essential metrics (Physical CPU Capacity Used, Average Virtual CPU Used, Host Queue per
Processor and Physical Memory Used) in your datacenter, in line charts for selected group of VMware host servers.
VMware
Virtual
Machine
Summary by
Resource
This category contains multi-server charts displaying the essential metrics for the individual VMs of a selected virtual host server.
VMware
Cluster
Summary
This view displays charts for CPU Capacity Used, Available, CPU Queue per Processor and Memory Capacity used and Available for
selected group of clusters.
VMware
Resource
Pool
Summary
This view displays charts like CPU Capacity Used, Memory Capacity Used, Swapped and Balloon memory for selected groups of resource
pools.
MS Hyper-V
Partition
Overview
This category provides you with a set of charts and tables designed specifically to provide key information about the MS Hyper -V Hosts
and guests in your virtual environment.
MS Hyper-V
Root
Partition
Overview
This category contains multi-server charts displaying the essential metrics for all of the Hyper-V partition's in your data center.
MS Hyper-V
Host
Summary by
Resource
This view displays multi-server charts for the essential metrics (Physical CPU Capacity Used, Average Virtual CPU Used, Host Queue per
Processor and Physical Memory Used) in your datacenter, in line charts for selected group of MS Hyper -V host servers.
This view displays charts for a selected MS Hyper -V partition designed to provide you with a detailed profile of its CPU capacity activity.
This view also includes two tables containing information about xen system identification and CPU configuration of the MS Hyper -V host.
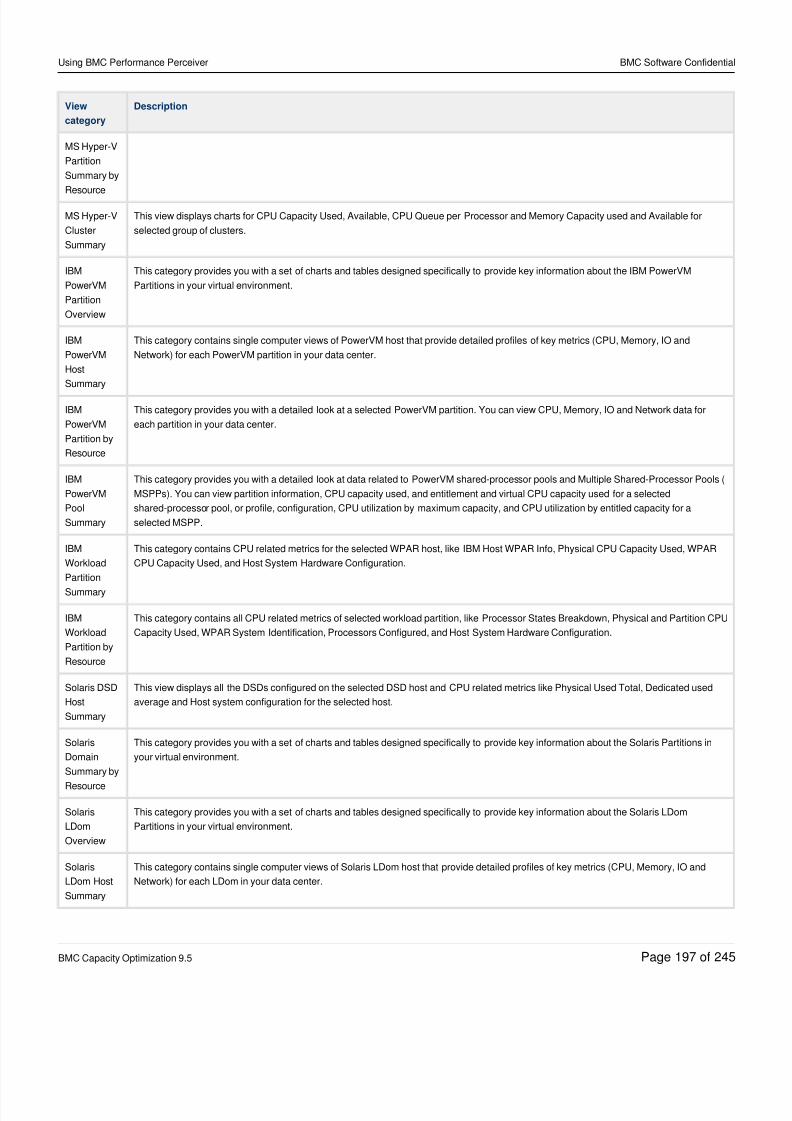
8/21/2019 Using BMC Performance Perceiver-V5-20141128_0503
http://slidepdf.com/reader/full/using-bmc-performance-perceiver-v5-201411280503 197/245
Using BMC Performance Perceiver BMC Software Confidential
BMC Capacity Optimization 9.5 Page of197 245
View
category
Description
MS Hyper-V
Partition
Summary by
Resource
MS Hyper-V
Cluster
Summary
This view displays charts for CPU Capacity Used, Available, CPU Queue per Processor and Memory Capacity used and Available for
selected group of clusters.
IBM
PowerVM
Partition
Overview
This category provides you with a set of charts and tables designed specifically to provide key information about the IBM PowerVM
Partitions in your virtual environment.
IBM
PowerVM
Host
Summary
This category contains single computer views of PowerVM host that provide detailed profiles of key metrics (CPU, Memory, IO and
Network) for each PowerVM partition in your data center.
IBM
PowerVM
Partition by
Resource
This category provides you with a detailed look at a selected PowerVM partition. You can view CPU, Memory, IO and Network data for
each partition in your data center.
IBM
PowerVM
Pool
Summary
This category provides you with a detailed look at data related to PowerVM shared-processor pools and Multiple Shared-Processor Pools (
MSPPs). You can view partition information, CPU capacity used, and entitlement and virtual CPU capacity used for a selected
shared-processor pool, or profile, configuration, CPU utilization by maximum capacity, and CPU utilization by entitled capacity for a
selected MSPP.
IBM
Workload
Partition
Summary
This category contains CPU related metrics for the selected WPAR host, like IBM Host WPAR Info, Physical CPU Capacity Used, WPAR
CPU Capacity Used, and Host System Hardware Configuration.
IBM
Workload
Partition by
Resource
This category contains all CPU related metrics of selected workload partition, like Processor States Breakdown, Physical and Partition CPU
Capacity Used, WPAR System Identification, Processors Configured, and Host System Hardware Configuration.
Solaris DSD
Host
Summary
This view displays all the DSDs configured on the selected DSD host and CPU related metrics like Physical Used Total, Dedicated used
average and Host system configuration for the selected host.
Solaris
Domain
Summary by
Resource
This category provides you with a set of charts and tables designed specifically to provide key information about the Solaris Partitions in
your virtual environment.
Solaris
LDom
Overview
This category provides you with a set of charts and tables designed specifically to provide key information about the Solaris LDom
Partitions in your virtual environment.
Solaris
LDom Host
Summary
This category contains single computer views of Solaris LDom host that provide detailed profiles of key metrics (CPU, Memory, IO and
Network) for each LDom in your data center.
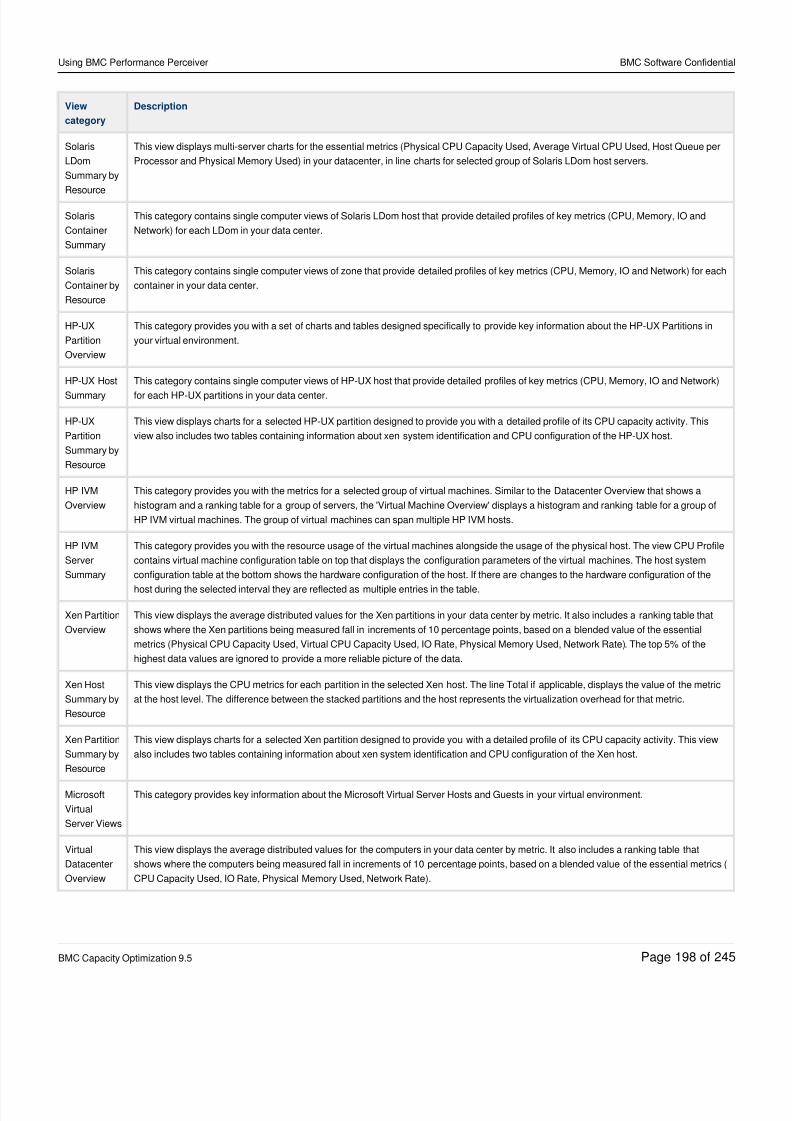
8/21/2019 Using BMC Performance Perceiver-V5-20141128_0503
http://slidepdf.com/reader/full/using-bmc-performance-perceiver-v5-201411280503 198/245
Using BMC Performance Perceiver BMC Software Confidential
BMC Capacity Optimization 9.5 Page of198 245
View
category
Description
Solaris
LDom
Summary by
Resource
This view displays multi-server charts for the essential metrics (Physical CPU Capacity Used, Average Virtual CPU Used, Host Queue per
Processor and Physical Memory Used) in your datacenter, in line charts for selected group of Solaris LDom host servers.
Solaris
Container
Summary
This category contains single computer views of Solaris LDom host that provide detailed profiles of key metrics (CPU, Memory, IO and
Network) for each LDom in your data center.
Solaris
Container by
Resource
This category contains single computer views of zone that provide detailed profiles of key metrics (CPU, Memory, IO and Network) for each
container in your data center.
HP-UX
Partition
Overview
This category provides you with a set of charts and tables designed specifically to provide key information about the HP-UX Partitions in
your virtual environment.
HP-UX Host
Summary
This category contains single computer views of HP-UX host that provide detailed profiles of key metrics (CPU, Memory, IO and Network)
for each HP-UX partitions in your data center.
HP-UX
Partition
Summary by
Resource
This view displays charts for a selected HP-UX partition designed to provide you with a detailed profile of its CPU capacity activity. This
view also includes two tables containing information about xen system identification and CPU configuration of the HP-UX host.
HP IVM
Overview
This category provides you with the metrics for a selected group of virtual machines. Similar to the Datacenter Overview that shows a
histogram and a ranking table for a group of servers, the 'Virtual Machine Overview' displays a histogram and ranking table for a group of
HP IVM virtual machines. The group of virtual machines can span multiple HP IVM hosts.
HP IVM
Server
Summary
This category provides you with the resource usage of the virtual machines alongside the usage of the physical host. The view CPU Profile
contains virtual machine configuration table on top that displays the configuration parameters of the virtual machines. The host system
configuration table at the bottom shows the hardware configuration of the host. If there are changes to the hardware configuration of the
host during the selected interval they are reflected as multiple entries in the table.
Xen Partition
Overview
This view displays the average distributed values for the Xen partitions in your data center by metric. It also includes a ranking table that
shows where the Xen partitions being measured fall in increments of 10 percentage points, based on a blended value of the essential
metrics (Physical CPU Capacity Used, Virtual CPU Capacity Used, IO Rate, Physical Memory Used, Network Rate). The top 5% of the
highest data values are ignored to provide a more reliable picture of the data.
Xen Host
Summary by
Resource
This view displays the CPU metrics for each partition in the selected Xen host. The line Total if applicable, displays the value of the metric
at the host level. The difference between the stacked partitions and the host represents the virtualization overhead for that metric.
Xen Partition
Summary by
Resource
This view displays charts for a selected Xen partition designed to provide you with a detailed profile of its CPU capacity activity. This view
also includes two tables containing information about xen system identification and CPU configuration of the Xen host.
Microsoft
Virtual
Server Views
This category provides key information about the Microsoft Virtual Server Hosts and Guests in your virtual environment.
Virtual
Datacenter
Overview
This view displays the average distributed values for the computers in your data center by metric. It also includes a ranking table that
shows where the computers being measured fall in increments of 10 percentage points, based on a blended value of the essential metrics (
CPU Capacity Used, IO Rate, Physical Memory Used, Network Rate).
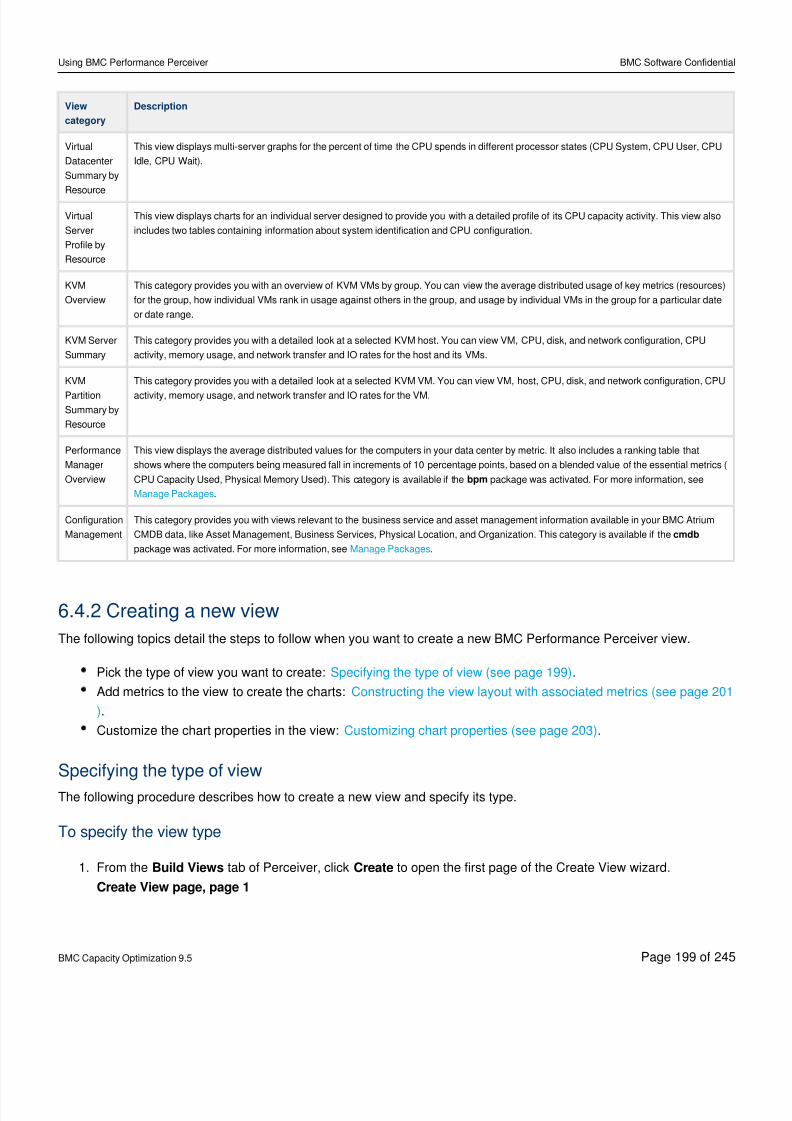
8/21/2019 Using BMC Performance Perceiver-V5-20141128_0503
http://slidepdf.com/reader/full/using-bmc-performance-perceiver-v5-201411280503 199/245
Using BMC Performance Perceiver BMC Software Confidential
BMC Capacity Optimization 9.5 Page of199 245
1.
View
category
Description
Virtual
Datacenter
Summary by
Resource
This view displays multi-server graphs for the percent of time the CPU spends in different processor states (CPU System, CPU User, CPU
Idle, CPU Wait).
Virtual
Server
Profile by
Resource
This view displays charts for an individual server designed to provide you with a detailed profile of its CPU capacity activity. This view also
includes two tables containing information about system identification and CPU configuration.
KVM
Overview
This category provides you with an overview of KVM VMs by group. You can view the average distributed usage of key metrics (resources)
for the group, how individual VMs rank in usage against others in the group, and usage by individual VMs in the group for a particular date
or date range.
KVM Server
Summary
This category provides you with a detailed look at a selected KVM host. You can view VM, CPU, disk, and network configuration, CPU
activity, memory usage, and network transfer and IO rates for the host and its VMs.
KVM
Partition
Summary by
Resource
This category provides you with a detailed look at a selected KVM VM. You can view VM, host, CPU, disk, and network configuration, CPU
activity, memory usage, and network transfer and IO rates for the VM.
Performance
Manager
Overview
This view displays the average distributed values for the computers in your data center by metric. It also includes a ranking table that
shows where the computers being measured fall in increments of 10 percentage points, based on a blended value of the essential metrics (
CPU Capacity Used, Physical Memory Used). This category is available if the package was activated. For more information, seebpm
.Manage Packages
Configuration
Management
This category provides you with views relevant to the business service and asset management information available in your BMC Atrium
CMDB data, like Asset Management, Business Services, Physical Location, and Organization. This category is available if the cmdb
package was activated. For more information, see .Manage Packages
6.4.2 Creating a new view
The following topics detail the steps to follow when you want to create a new BMC Performance Perceiver view.
Pick the type of view you want to create: .Specifying the type of view (see page 199)
Add metrics to the view to create the charts: Constructing the view layout with associated metrics (see page 201
.)
Customize the chart properties in the view: .Customizing chart properties (see page 203)
Specifying the type of view
The following procedure describes how to create a new view and specify its type.
To specify the view type
From the tab of Perceiver, click to open the first page of the Create View wizard.Build Views Create
Create View page, page 1
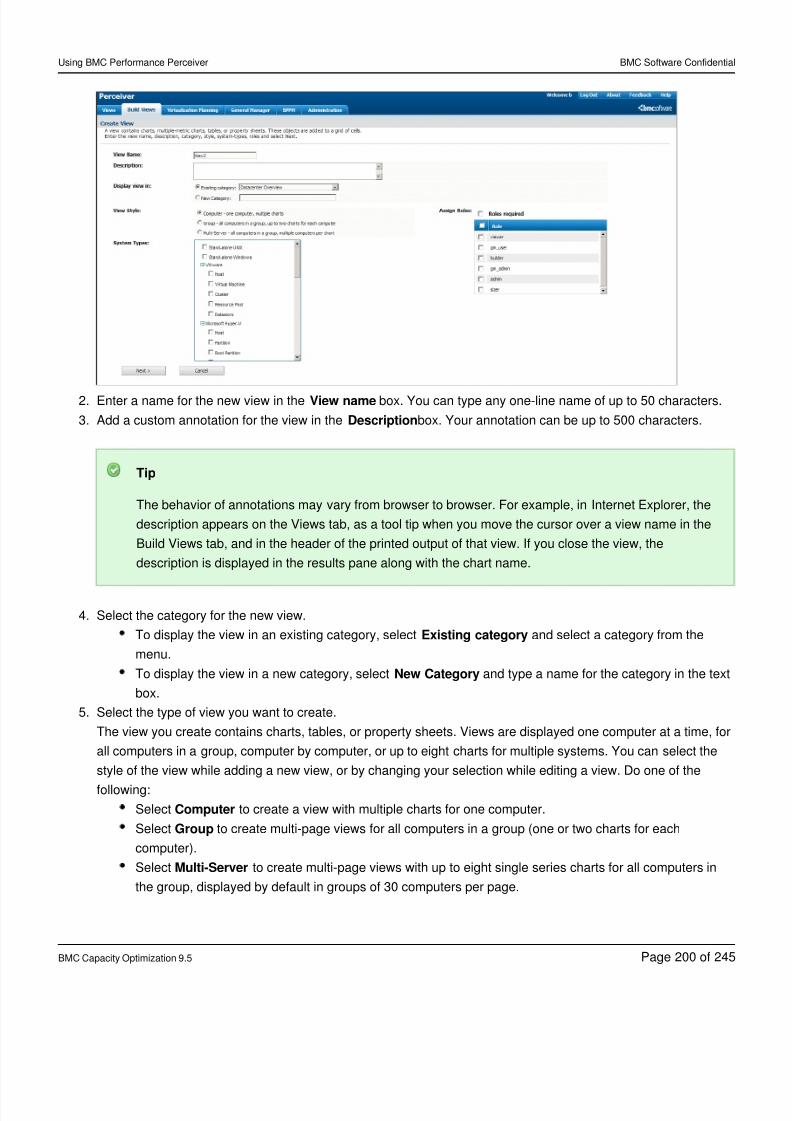
8/21/2019 Using BMC Performance Perceiver-V5-20141128_0503
http://slidepdf.com/reader/full/using-bmc-performance-perceiver-v5-201411280503 200/245
Using BMC Performance Perceiver BMC Software Confidential
BMC Capacity Optimization 9.5 Page of200 245
2.
3.
4.
5.
Enter a name for the new view in the box. You can type any one-line name of up to 50 characters.View name
Add a custom annotation for the view in the box. Your annotation can be up to 500 characters.Description
Tip
The behavior of annotations may vary from browser to browser. For example, in Internet Explorer, the
description appears on the Views tab, as a tool tip when you move the cursor over a view name in the
Build Views tab, and in the header of the printed output of that view. If you close the view, the
description is displayed in the results pane along with the chart name.
Select the category for the new view.
To display the view in an existing category, select and select a category from theExisting category
menu.
To display the view in a new category, select and type a name for the category in the textNew Category
box.
Select the type of view you want to create.
The view you create contains charts, tables, or property sheets. Views are displayed one computer at a time, for
all computers in a group, computer by computer, or up to eight charts for multiple systems. You can select the
style of the view while adding a new view, or by changing your selection while editing a view. Do one of the
following:
Select to create a view with multiple charts for one computer.Computer
Select to create multi-page views for all computers in a group (one or two charts for eachGroup
computer).
Select to create multi-page views with up to eight single series charts for all computers inMulti-Server
the group, displayed by default in groups of 30 computers per page.
8/21/2019 Using BMC Performance Perceiver-V5-20141128_0503
http://slidepdf.com/reader/full/using-bmc-performance-perceiver-v5-201411280503 201/245
Using BMC Performance Perceiver BMC Software Confidential
BMC Capacity Optimization 9.5 Page of201 245
6.
7.
8.
Select one or more system types to include in this view.
Select one or more system types to create the view. If you do not make a selection here, all of the system types
will be charted together. Because not aall systems collect the same metrics or use the same names for similar
metrics, this can cause data to be missing from the view. For example, if Microsoft Windows, UNIX, and
VMware metrics are charted in the same view, you will get the message, , whereverData is unavailable
the view calls for metrics that are not available from one or another system. To avoid this, you can filter the
metrics based on system type and refine the views to display charts for the chosen metrics. What you select
here defines which metrics will be available for charting, as displayed in the metric tree on the second page of
the Create View wizard:
If you select only one system type, the metric tree displays all metrics for that one system type. For
example, you can chart just the UNIX systems in your data center, or you can combine VMware Hosts
and VMware Guests in the same chart, or you can display Windows stand-alone systems.
If you select two or more system types, the metric tree displays only the metrics that are common to the
selected system types. For example, if you select UNIX systems and Windows systems, the metrics
available for charting will be only those metrics that are common to both systems.
Assign roles to this view.( ) Administrators can create roles to grant access rights to the various tabs and views in Perceiver. IfOptional
you assign one or more roles to a view, only users with that role will be able to access the view. To use this
feature, select the check box and the desired role from the table.Roles Required
Click when you are finished. The second page of the Create View wizard opens where you can select theNext
metrics you want to display in the sample view.
Continue with .Constructing the view layout with associated metrics (see page 201)
Constructing the view layout with associated metrics
The following procedure describes how to add metrics to construct the view and customize the layout by adding,
moving, or resizing charts. On the second page of the Create View wizard you can:
Create one or two charts for computer or group style views.
Create up to eight charts with multiple computers per chart.
The task pane of the second page contains a metric list, which you can use to build your custom view.
Create View page, page 2
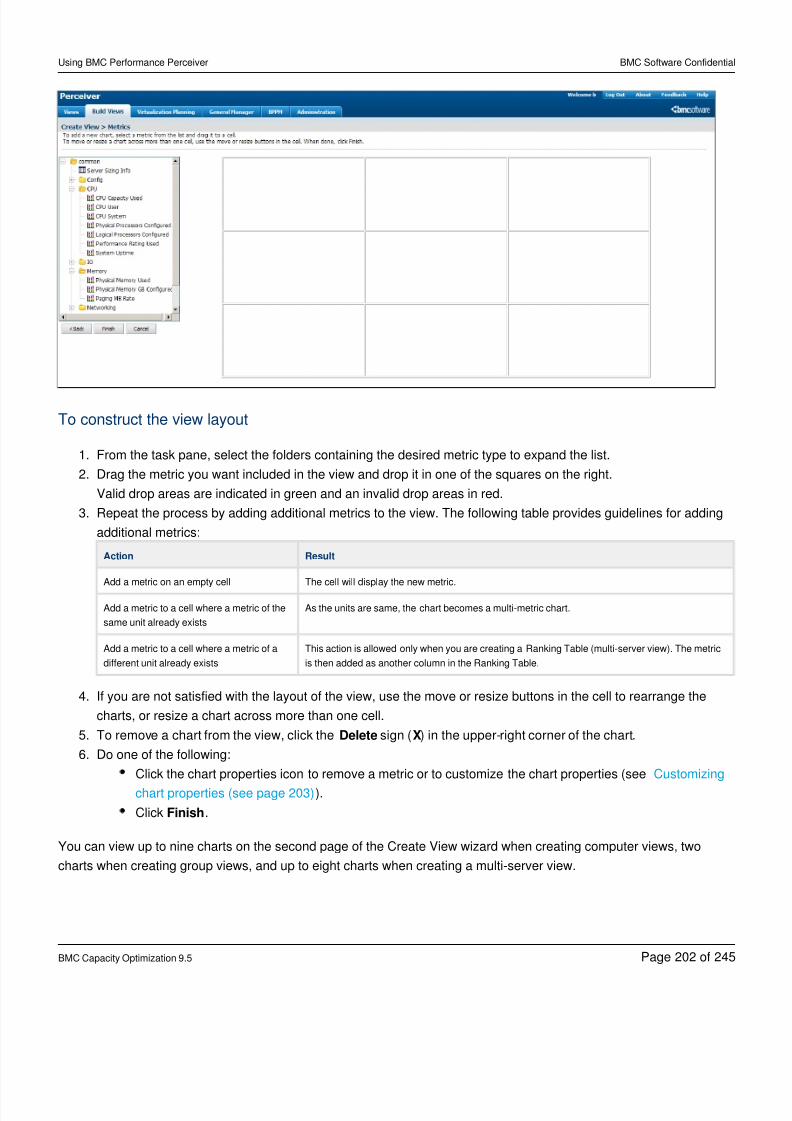
8/21/2019 Using BMC Performance Perceiver-V5-20141128_0503
http://slidepdf.com/reader/full/using-bmc-performance-perceiver-v5-201411280503 202/245
Using BMC Performance Perceiver BMC Software Confidential
BMC Capacity Optimization 9.5 Page of202 245
1.
2.
3.
4.
5.
6.
To construct the view layout
From the task pane, select the folders containing the desired metric type to expand the list.
Drag the metric you want included in the view and drop it in one of the squares on the right.
Valid drop areas are indicated in green and an invalid drop areas in red.
Repeat the process by adding additional metrics to the view. The following table provides guidelines for adding
additional metrics:
Action Result
Add a metric on an empty cell The cell will display the new metric.
Add a metric to a cell where a metric of the
same unit already exists
As the units are same, the chart becomes a multi-metric chart.
Add a metric to a cell where a metric of a
different unit already exists
This action is allowed only when you are creating a Ranking Table (multi-server view). The metric
is then added as another column in the Ranking Table.
If you are not satisfied with the layout of the view, use the move or resize buttons in the cell to rearrange the
charts, or resize a chart across more than one cell.
To remove a chart from the view, click the sign ( ) in the upper-right corner of the chart.Delete X
Do one of the following:
Click the chart properties icon to remove a metric or to customize the chart properties (see Customizing
).chart properties (see page 203)
Click .Finish
You can view up to nine charts on the second page of the Create View wizard when creating computer views, two
charts when creating group views, and up to eight charts when creating a multi-server view.
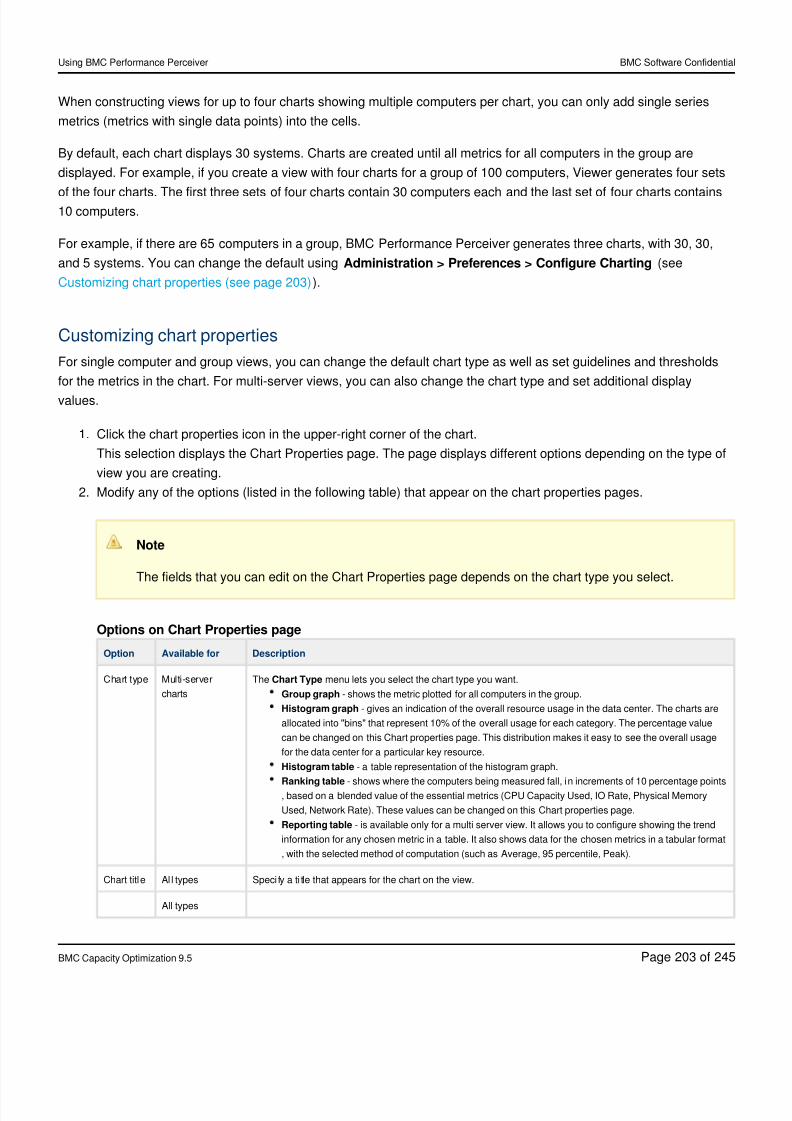
8/21/2019 Using BMC Performance Perceiver-V5-20141128_0503
http://slidepdf.com/reader/full/using-bmc-performance-perceiver-v5-201411280503 203/245
Using BMC Performance Perceiver BMC Software Confidential
BMC Capacity Optimization 9.5 Page of203 245
1.
2.
When constructing views for up to four charts showing multiple computers per chart, you can only add single series
metrics (metrics with single data points) into the cells.
By default, each chart displays 30 systems. Charts are created until all metrics for all computers in the group are
displayed. For example, if you create a view with four charts for a group of 100 computers, Viewer generates four sets
of the four charts. The first three sets of four charts contain 30 computers each and the last set of four charts contains10 computers.
For example, if there are 65 computers in a group, BMC Performance Perceiver generates three charts, with 30, 30,
and 5 systems. You can change the default using (seeAdministration > Preferences > Configure Charting
).Customizing chart properties (see page 203)
Customizing chart properties
For single computer and group views, you can change the default chart type as well as set guidelines and thresholds
for the metrics in the chart. For multi-server views, you can also change the chart type and set additional display
values.
Click the chart properties icon in the upper-right corner of the chart.
This selection displays the Chart Properties page. The page displays different options depending on the type of
view you are creating.
Modify any of the options (listed in the following table) that appear on the chart properties pages.
Note
The fields that you can edit on the Chart Properties page depends on the chart type you select.
Options on Chart Properties page
Option Available for Description
Chart type Multi-server
charts
The menu lets you select the chart type you want.Chart Type
Group graph - shows the metric plotted for all computers in the group.
Histogram graph - gives an indication of the overall resource usage in the data center. The charts are
allocated into "bins" that represent 10% of the overall usage for each category. The percentage value
can be changed on this Chart properties page. This distribution makes it easy to see the overall usage
for the data center for a particular key resource.
Histogram table - a table representation of the histogram graph.
Ranking table - shows where the computers being measured fall, in increments of 10 percentage points, based on a blended value of the essential metrics (CPU Capacity Used, IO Rate, Physical Memory
Used, Network Rate). These values can be changed on this Chart properties page.
Reporting table - is available only for a multi server view. It allows you to configure showing the trend
information for any chosen metric in a table. It also shows data for the chosen metrics in a tabular format
, with the selected method of computation (such as Average, 95 percentile, Peak).
Chart title Al l types Speci fy a ti tle that appears for the chart on the view.
All types
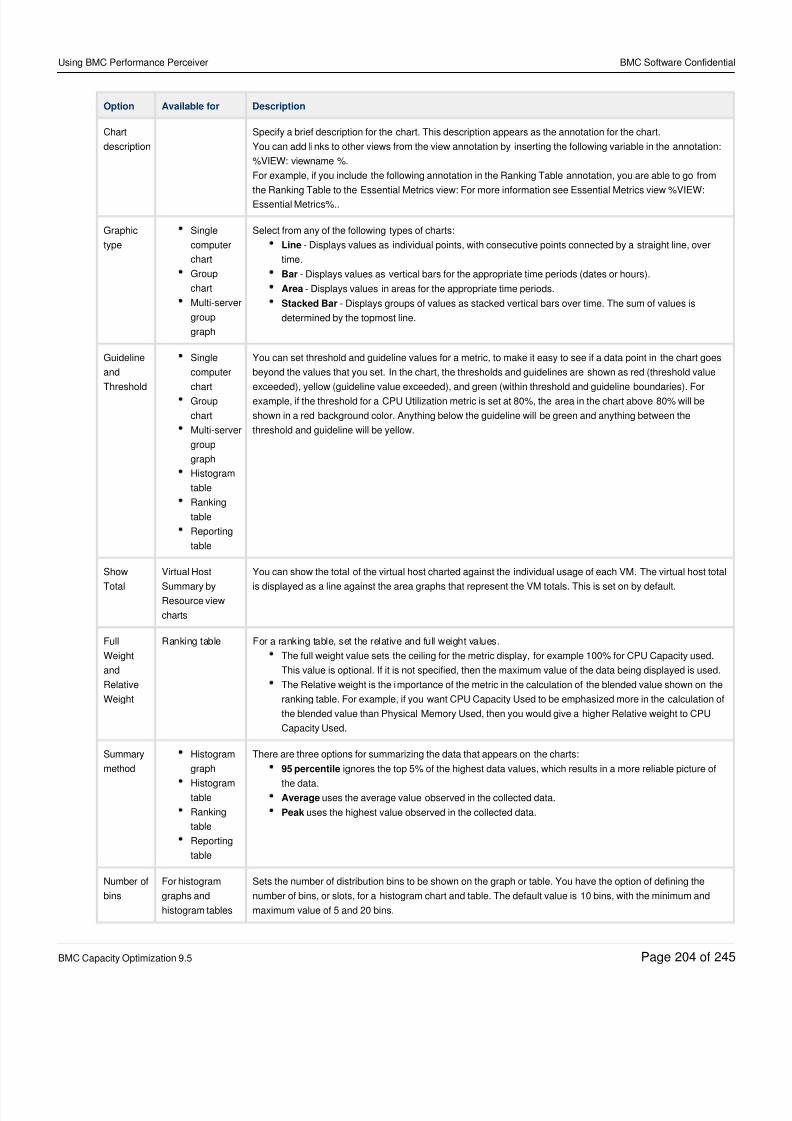
8/21/2019 Using BMC Performance Perceiver-V5-20141128_0503
http://slidepdf.com/reader/full/using-bmc-performance-perceiver-v5-201411280503 204/245
Using BMC Performance Perceiver BMC Software Confidential
BMC Capacity Optimization 9.5 Page of204 245
Option Available for Description
Chart
description
Specify a brief description for the chart. This description appears as the annotation for the chart.
You can add links to other views from the view annotation by inserting the following variable in the annotation:
%VIEW: viewname %.
For example, if you include the following annotation in the Ranking Table annotation, you are able to go from
the Ranking Table to the Essential Metrics view: For more information see Essential Metrics view %VIEW:
Essential Metrics%..
Graphic
type
Single
computer
chart
Group
chart
Multi-server
group
graph
Select from any of the following types of charts:
Line - Displays values as individual points, with consecutive points connected by a straight line, over
time.
Bar - Displays values as vertical bars for the appropriate time periods (dates or hours).
Area - Displays values in areas for the appropriate time periods.
Stacked Bar - Displays groups of values as stacked vertical bars over time. The sum of values is
determined by the topmost line.
Guideline
and
Threshold
Single
computer
chart
Group
chart
Multi-server
group
graph
Histogram
table
Ranking
table
Reporting
table
You can set threshold and guideline values for a metric, to make it easy to see if a data point in the chart goes
beyond the values that you set. In the chart, the thresholds and guidelines are shown as red (threshold value
exceeded), yellow (guideline value exceeded), and green (within threshold and guideline boundaries). For
example, if the threshold for a CPU Utilization metric is set at 80%, the area in the chart above 80% will be
shown in a red background color. Anything below the guideline will be green and anything between the
threshold and guideline will be yellow.
Show
Total
Virtual Host
Summary byResource view
charts
You can show the total of the virtual host charted against the individual usage of each VM. The virtual host total
is displayed as a line against the area graphs that represent the VM totals. This is set on by default.
Full
Weight
and
Relative
Weight
Ranking table For a ranking table, set the relative and full weight values.
The full weight value sets the ceiling for the metric display, for example 100% for CPU Capacity used.
This value is optional. If it is not specified, then the maximum value of the data being displayed is used.
The Relative weight is the importance of the metric in the calculation of the blended value shown on the
ranking table. For example, if you want CPU Capacity Used to be emphasized more in the calculation of
the blended value than Physical Memory Used, then you would give a higher Relative weight to CPU
Capacity Used.
Summary
method
Histogram
graph
Histogramtable
Ranking
table
Reporting
table
There are three options for summarizing the data that appears on the charts:
95 percentile ignores the top 5% of the highest data values, which results in a more reliable picture of
the data.Average uses the average value observed in the collected data.
Peak uses the highest value observed in the collected data.
Number of
bins
For histogram
graphs and
histogram tables
Sets the number of distribution bins to be shown on the graph or table. You have the option of defining the
number of bins, or slots, for a histogram chart and table. The default value is 10 bins, with the minimum and
maximum value of 5 and 20 bins.
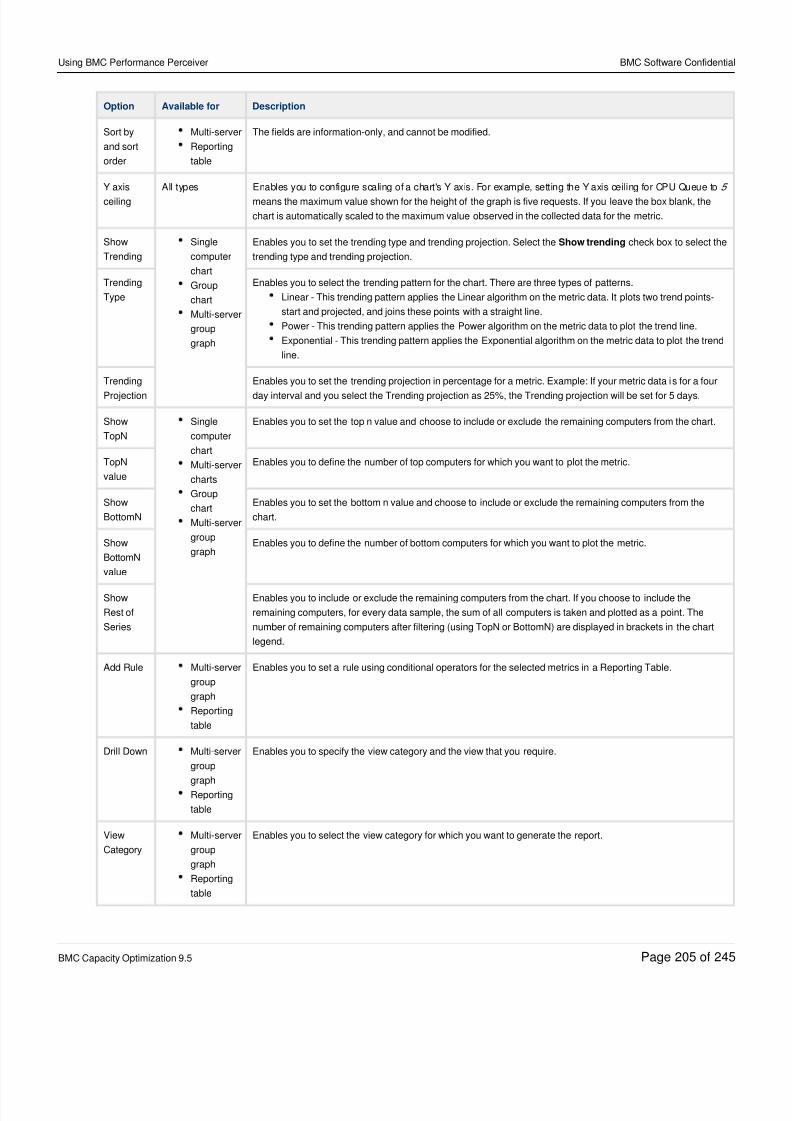
8/21/2019 Using BMC Performance Perceiver-V5-20141128_0503
http://slidepdf.com/reader/full/using-bmc-performance-perceiver-v5-201411280503 205/245
Using BMC Performance Perceiver BMC Software Confidential
BMC Capacity Optimization 9.5 Page of205 245
Option Available for Description
Sort by
and sort
order
Multi-server
Reporting
table
The fields are information-only, and cannot be modified.
Y axis
ceiling
All types Enables you to configure scaling of a chart's Y axis. For example, setting the Y axis ceiling for CPU Queue to 5
means the maximum value shown for the height of the graph is five requests. If you leave the box blank, the
chart is automatically scaled to the maximum value observed in the collected data for the metric.
Show
Trending
Single
computer
chart
Group
chart
Multi-server
group
graph
Enables you to set the trending type and trending projection. Select the check box to select theShow trending
trending type and trending projection.
Trending
Type
Enables you to select the trending pattern for the chart. There are three types of patterns.
Linear - This trending pattern applies the Linear algorithm on the metric data. It plots two trend points-
start and projected, and joins these points with a straight line.
Power - This trending pattern applies the Power algorithm on the metric data to plot the trend line.
Exponential - This trending pattern applies the Exponential algorithm on the metric data to plot the trend
line.
Trending
Projection
Enables you to set the trending projection in percentage for a metric. Example: If your metric data is for a four
day interval and you select the Trending projection as 25%, the Trending projection will be set for 5 days.
Show
TopN
Single
computer
chart
Multi-server
charts
Group
chart
Multi-server
group
graph
Enables you to set the top n value and choose to include or exclude the remaining computers from the chart.
TopN
value
Enables you to define the number of top computers for which you want to plot the metric.
Show
BottomN
Enables you to set the bottom n value and choose to include or exclude the remaining computers from the
chart.
Show
BottomN
value
Enables you to define the number of bottom computers for which you want to plot the metric.
Show
Rest of
Series
Enables you to include or exclude the remaining computers from the chart. If you choose to include the
remaining computers, for every data sample, the sum of all computers is taken and plotted as a point. The
number of remaining computers after filtering (using TopN or BottomN) are displayed in brackets in the chart
legend.
Add Rule Multi-server
group
graph
Reporting
table
Enables you to set a rule using conditional operators for the selected metrics in a Reporting Table.
Drill Down Multi-server
group
graph
Reporting
table
Enables you to specify the view category and the view that you require.
View
Category
Multi-server
group
graph
Reporting
table
Enables you to select the view category for which you want to generate the report.
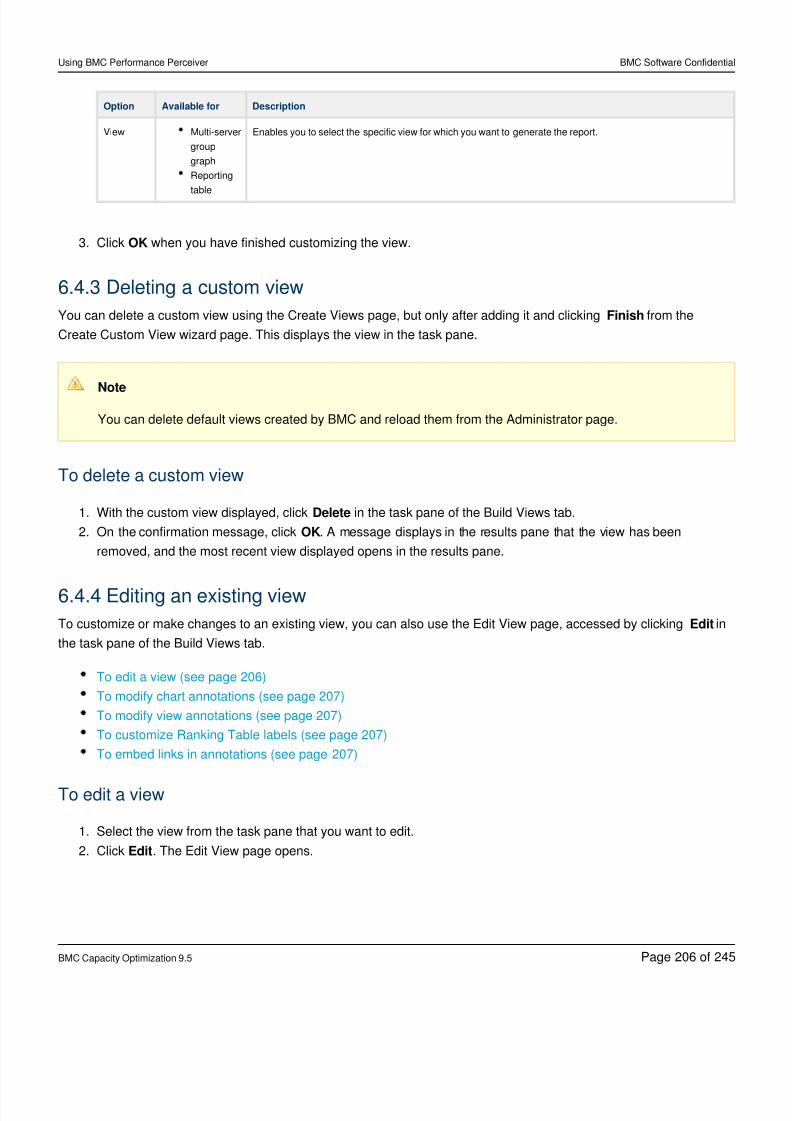
8/21/2019 Using BMC Performance Perceiver-V5-20141128_0503
http://slidepdf.com/reader/full/using-bmc-performance-perceiver-v5-201411280503 206/245
Using BMC Performance Perceiver BMC Software Confidential
BMC Capacity Optimization 9.5 Page of206 245
3.
1.
2.
1.
2.
Option Available for Description
View Multi-server
group
graph
Reporting
table
Enables you to select the specific view for which you want to generate the report.
Click when you have finished customizing the view.OK
6.4.3 Deleting a custom view
You can delete a custom view using the Create Views page, but only after adding it and clicking from theFinish
Create Custom View wizard page. This displays the view in the task pane.
Note
You can delete default views created by BMC and reload them from the Administrator page.
To delete a custom view
With the custom view displayed, click in the task pane of the Build Views tab.Delete
On the confirmation message, click . A message displays in the results pane that the view has beenOK
removed, and the most recent view displayed opens in the results pane.
6.4.4 Editing an existing view
To customize or make changes to an existing view, you can also use the Edit View page, accessed by clicking inEdit
the task pane of the Build Views tab.
To edit a view (see page 206)
To modify chart annotations (see page 207)
To modify view annotations (see page 207)
To customize Ranking Table labels (see page 207)
To embed links in annotations (see page 207)
To edit a view
Select the view from the task pane that you want to edit.
Click . The Edit View page opens.Edit
8/21/2019 Using BMC Performance Perceiver-V5-20141128_0503
http://slidepdf.com/reader/full/using-bmc-performance-perceiver-v5-201411280503 207/245
Using BMC Performance Perceiver BMC Software Confidential
BMC Capacity Optimization 9.5 Page of207 245
1.
2.
3.
4.
5.
6.
1.
2.
3.
4.
5.
6.
7.
1.
2.
3.
4.
5.
6.
7.
You can edit the view by resizing existing objects, adding metrics from the metric list, changing the chart type, or
deleting the chart from the view. For example, you can resize a chart by expanding the chart across two cells by
clicking .< >
After you make changes, click to close the page and display the customized view in BMC PerformanceFinish
Perceiver.
To modify chart annotations
Log on as an Administrator or Builder.
On the Build Views tab, select the view containing the chart you want to modify from the navigation pane.
Click load the view in the Create View wizard.Edit to
Click the icon in the chart you want to modify.Properties Page
Modify the chart annotation that appears in the box and click to save the modifiedChart Description OK
annotation and return to the Create Views wizard.
Click to save all changes.Finish
To modify view annotations
Log on as the Administrator or Builder.
On the Build Views tab, select the view you want to modify from the navigation pane.
Click load the view in the Create Views wizard.Edit to
Click to display all the view attributes.Back
Modify the view annotation that appears in the Description field.
Click to return to the second page of the wizard.Next
Click to save the modified annotation.Finish
To customize Ranking Table labels
Log on as the Administrator or Builder.
On the Build Views tab, click to create a ranking table.Create
Click load the view in the Build Views wizard.Edit to
Click the icon in the chart you want to modify.Properties Page
Modify the chart annotation that appears in the field. Use the following variables:Chart Description
%TOP5%
%TOP10%%BOTTOM5%
%BOTTOM10%
Click to save the modified annotation and return to the Create Views wizard.OK
Click to save all changes.Finish
To embed links in annotations
8/21/2019 Using BMC Performance Perceiver-V5-20141128_0503
http://slidepdf.com/reader/full/using-bmc-performance-perceiver-v5-201411280503 208/245
Using BMC Performance Perceiver BMC Software Confidential
BMC Capacity Optimization 9.5 Page of208 245
1.
2.
3.
4.
5.
6.
Log on as the Administrator or Builder.
On the Build Views tab, select the view you want to edit and click to load the view in the Create ViewsEdit
wizard.
Click the icon in the chart you want to modify.Properties Page
Enter the following variable in the box: .Chart Description %VIEW:viewname%
For example, if you want your consumer to be able to go from the Ranking Table in the Essential Overview view
to the charts in the Essential Metrics view, you could add the following sentence and variable to the Ranking
Table annotation:
For more information, see the Essential Metrics view %VIEW:Essential Metrics%.
Click to save the modified annotation and return to the Create Views wizard.OK
Click to save all changes.Finish
6.4.5 Removing view categories
View categories can be removed by authorized administrators and analysts by doing one of the following:
Deleting all the views in a category, which automatically deletes the category.
Clearing the check boxes for all the views in a category, which results in the category no longer appearing on
the Views tab.
6.5 Common Perceiver metrics
To maximize your return on investment, BMC developed and included a minimum set of predefined view templates
that should provide you with the most common use cases, such as checking system health or investigating I/O
behavior. These views are based on a set of performance metrics and metric groups common or similar for both UNIX
and Windows platforms.
The following sections outline the common metrics supported, and list them in tables so that you can easily distinguish
among them:
Chart types available in BMC Performance Perceiver (see page 209)
Memory metrics (see page 209)
Networking metrics (see page 209)
CPU metrics (see page 211)
IO metrics (see page 212)
Workload metrics (see page 214)
System configuration metrics (see page 214)
System information metrics (see page 214)
Configuration metrics (see page 215)
Data availability metrics (see page 215)
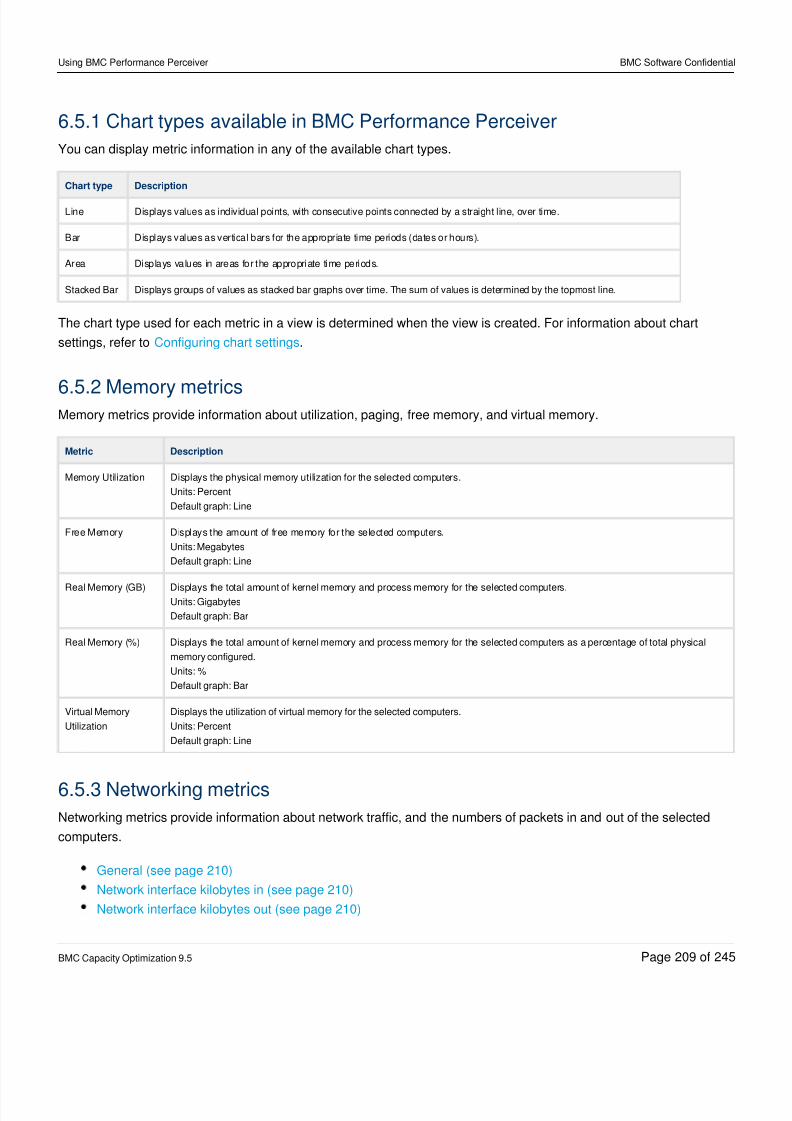
8/21/2019 Using BMC Performance Perceiver-V5-20141128_0503
http://slidepdf.com/reader/full/using-bmc-performance-perceiver-v5-201411280503 209/245
Using BMC Performance Perceiver BMC Software Confidential
BMC Capacity Optimization 9.5 Page of209 245
6.5.1 Chart types available in BMC Performance Perceiver
You can display metric information in any of the available chart types.
Chart type Description
Line Displays values as individual points, with consecutive points connected by a straight line, over time.
Bar Displays values as vertical bars for the appropriate time periods (dates or hours).
Area Displays values in areas for the appropriate time periods.
Stacked Bar Displays groups of values as stacked bar graphs over time. The sum of values is determined by the topmost line.
The chart type used for each metric in a view is determined when the view is created. For information about chart
settings, refer to .Configuring chart settings
6.5.2 Memory metricsMemory metrics provide information about utilization, paging, free memory, and virtual memory.
Metric Description
Memory Utilization Displays the physical memory utilization for the selected computers.
Units: Percent
Default graph: Line
Free Memory Displays the amount of free memory for the selected computers.
Units: Megabytes
Default graph: Line
Real Memory (GB) Displays the total amount of kernel memory and process memory for the selected computers.Units: Gigabytes
Default graph: Bar
Real Memory (%) Displays the total amount of kernel memory and process memory for the selected computers as a percentage of total physical
memory configured.
Units: %
Default graph: Bar
Virtual Memory
Utilization
Displays the utilization of virtual memory for the selected computers.
Units: Percent
Default graph: Line
6.5.3 Networking metricsNetworking metrics provide information about network traffic, and the numbers of packets in and out of the selected
computers.
General (see page 210)
Network interface kilobytes in (see page 210)
Network interface kilobytes out (see page 210)
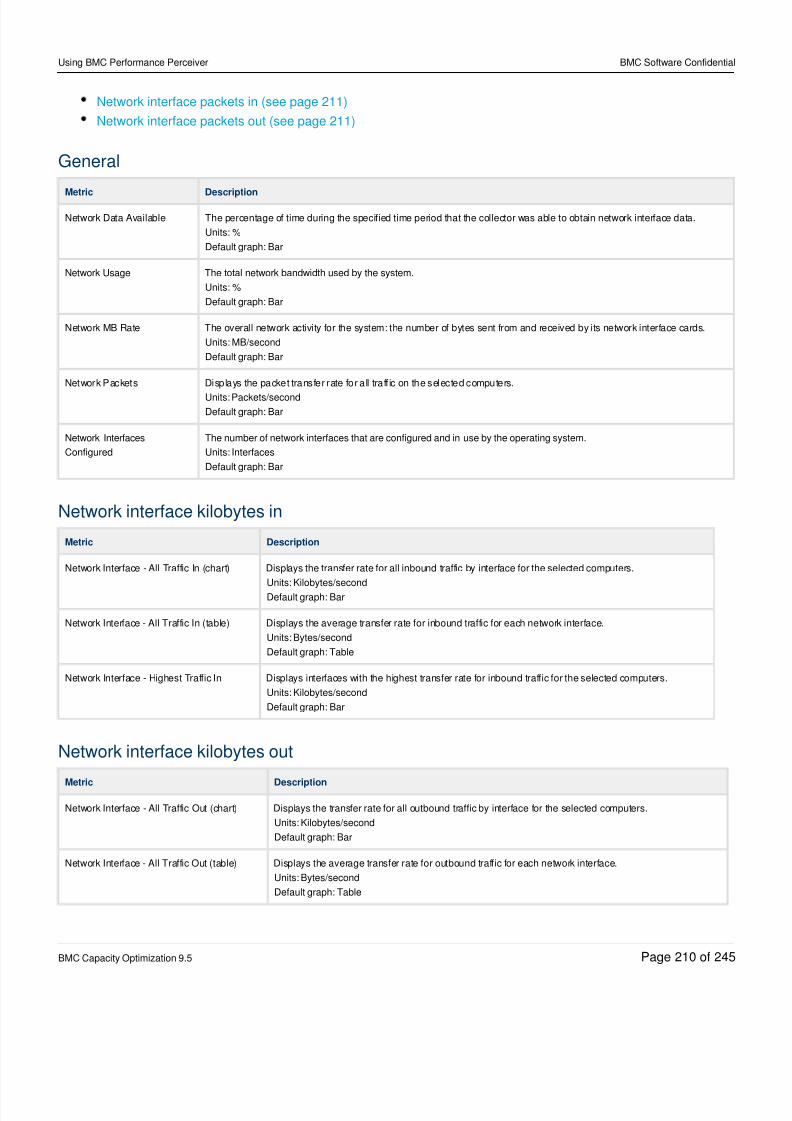
8/21/2019 Using BMC Performance Perceiver-V5-20141128_0503
http://slidepdf.com/reader/full/using-bmc-performance-perceiver-v5-201411280503 210/245
Using BMC Performance Perceiver BMC Software Confidential
BMC Capacity Optimization 9.5 Page of210 245
Network interface packets in (see page 211)
Network interface packets out (see page 211)
General
Metric Description
Network Data Available The percentage of time during the specified time period that the collector was able to obtain network interface data.
Units: %
Default graph: Bar
Network Usage The total network bandwidth used by the system.
Units: %
Default graph: Bar
Network MB Rate The overall network activity for the system: the number of bytes sent from and received by its network interface cards.
Units: MB/second
Default graph: Bar
Network Packets Displays the packet transfer rate for all traff ic on the selected computers.
Units: Packets/second
Default graph: Bar
Network Interfaces
Configured
The number of network interfaces that are configured and in use by the operating system.
Units: Interfaces
Default graph: Bar
Network interface kilobytes in
Metric Description
Network Interface - All Traffic In (chart) Displays the transfer rate for all inbound traffic by interface for the selected computers.
Units: Kilobytes/second
Default graph: Bar
Network Interface - All Traffic In (table) Displays the average transfer rate for inbound traffic for each network interface.
Units: Bytes/second
Default graph: Table
Network Interface - Highest Traffic In Displays interfaces with the highest transfer rate for inbound traffic for the selected computers.
Units: Kilobytes/second
Default graph: Bar
Network interface kilobytes out
Metric Description
Network Interface - All Traffic Out (chart) Displays the transfer rate for all outbound traffic by interface for the selected computers.
Units: Kilobytes/second
Default graph: Bar
Network Interface - All Traffic Out (table) Displays the average transfer rate for outbound traffic for each network interface.
Units: Bytes/second
Default graph: Table
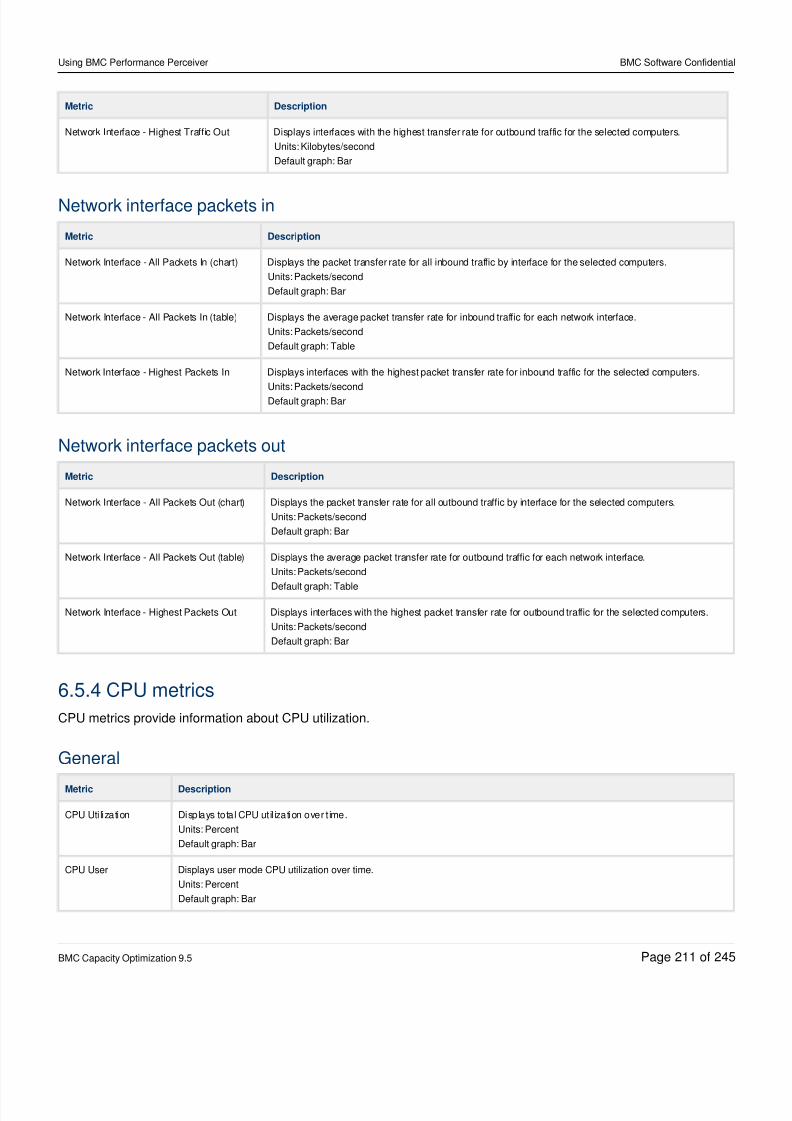
8/21/2019 Using BMC Performance Perceiver-V5-20141128_0503
http://slidepdf.com/reader/full/using-bmc-performance-perceiver-v5-201411280503 211/245
Using BMC Performance Perceiver BMC Software Confidential
BMC Capacity Optimization 9.5 Page of211 245
Metric Description
Network Interface - Highest Traffic Out Displays interfaces with the highest transfer rate for outbound traffic for the selected computers.
Units: Kilobytes/second
Default graph: Bar
Network interface packets in
Metric Description
Network Interface - All Packets In (chart) Displays the packet transfer rate for all inbound traffic by interface for the selected computers.
Units: Packets/second
Default graph: Bar
Network Interface - All Packets In (table) Displays the average packet transfer rate for inbound traffic for each network interface.
Units: Packets/second
Default graph: Table
Network Interface - Highest Packets In Displays interfaces with the highest packet transfer rate for inbound traffic for the selected computers.
Units: Packets/second
Default graph: Bar
Network interface packets out
Metric Description
Network Interface - All Packets Out (chart) Displays the packet transfer rate for all outbound traffic by interface for the selected computers.
Units: Packets/second
Default graph: Bar
Network Interface - All Packets Out (table) Displays the average packet transfer rate for outbound traffic for each network interface.
Units: Packets/second
Default graph: Table
Network Interface - Highest Packets Out Displays interfaces with the highest packet transfer rate for outbound traffic for the selected computers.
Units: Packets/second
Default graph: Bar
6.5.4 CPU metrics
CPU metrics provide information about CPU utilization.
General
Metric Description
CPU Utilization Displays total CPU ut il ization over t ime.
Units: Percent
Default graph: Bar
CPU User Displays user mode CPU utilization over time.
Units: Percent
Default graph: Bar
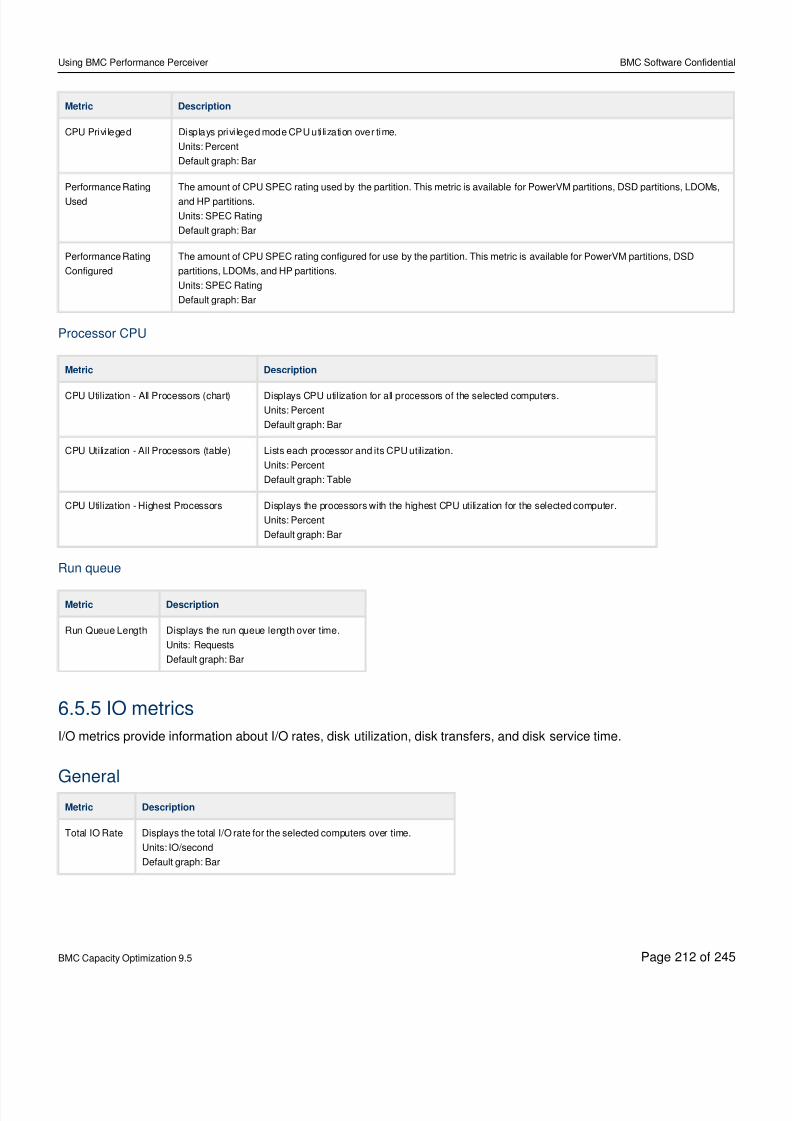
8/21/2019 Using BMC Performance Perceiver-V5-20141128_0503
http://slidepdf.com/reader/full/using-bmc-performance-perceiver-v5-201411280503 212/245
Using BMC Performance Perceiver BMC Software Confidential
BMC Capacity Optimization 9.5 Page of212 245
Metric Description
CPU Privileged Displays privi leged mode CPU uti lization over time.
Units: Percent
Default graph: Bar
Performance Rating
Used
The amount of CPU SPEC rating used by the partition. This metric is available for PowerVM partitions, DSD partitions, LDOMs,
and HP partitions.
Units: SPEC Rating
Default graph: Bar
Performance Rating
Configured
The amount of CPU SPEC rating configured for use by the partition. This metric is available for PowerVM partitions, DSD
partitions, LDOMs, and HP partitions.
Units: SPEC Rating
Default graph: Bar
Processor CPU
Metric Description
CPU Utilization - All Processors (chart) Displays CPU utilization for all processors of the selected computers.
Units: Percent
Default graph: Bar
CPU Utilization - All Processors (table) Lists each processor and its CPU utilization.
Units: Percent
Default graph: Table
CPU Utilization - Highest Processors Displays the processors with the highest CPU utilization for the selected computer.
Units: Percent
Default graph: Bar
Run queue
Metric Description
Run Queue Length Displays the run queue length over time.
Units: Requests
Default graph: Bar
6.5.5 IO metrics
I/O metrics provide information about I/O rates, disk utilization, disk transfers, and disk service time.
GeneralMetric Description
Total IO Rate Displays the total I/O rate for the selected computers over time.
Units: IO/second
Default graph: Bar
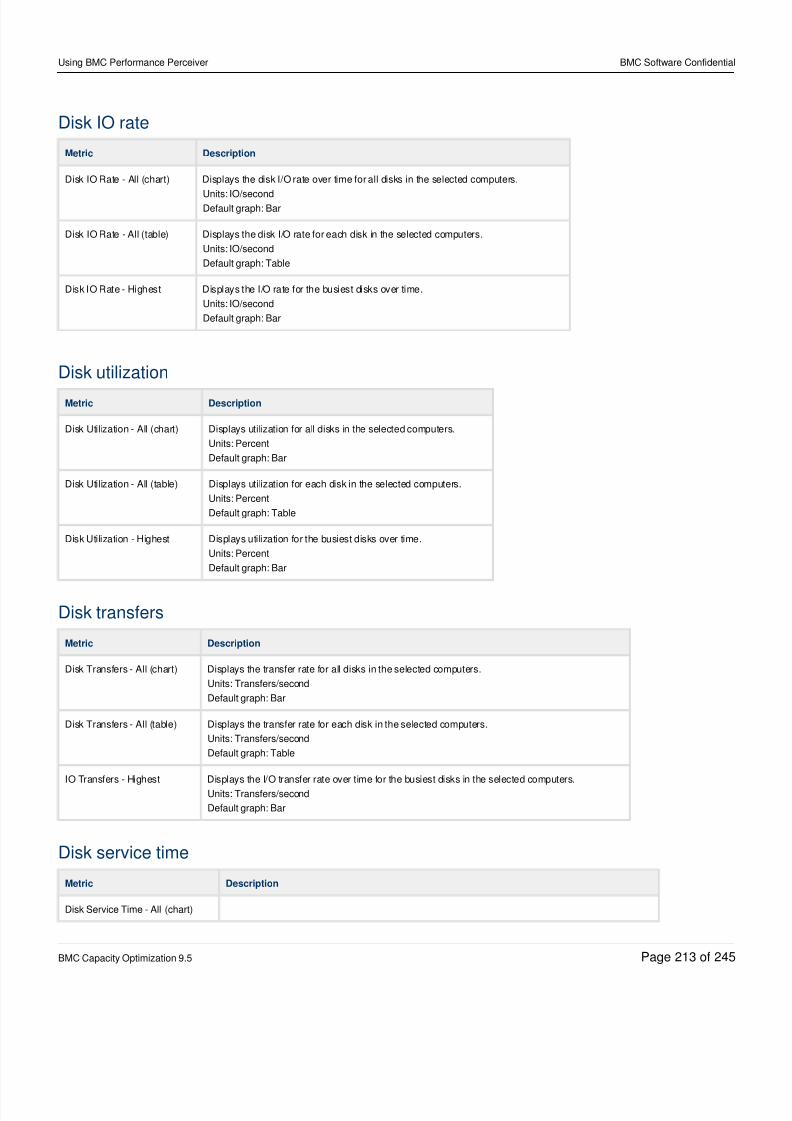
8/21/2019 Using BMC Performance Perceiver-V5-20141128_0503
http://slidepdf.com/reader/full/using-bmc-performance-perceiver-v5-201411280503 213/245
Using BMC Performance Perceiver BMC Software Confidential
BMC Capacity Optimization 9.5 Page of213 245
Disk IO rate
Metric Description
Disk IO Rate - All (chart) Displays the disk I/O rate over time for all disks in the selected computers.
Units: IO/secondDefault graph: Bar
Disk IO Rate - All (table) Displays the disk I/O rate for each disk in the selected computers.
Units: IO/second
Default graph: Table
Disk IO Rate - Highest Displays the I/O rate for the busiest disks over time.
Units: IO/second
Default graph: Bar
Disk utilization
Metric Description
Disk Utilization - All (chart) Displays utilization for all disks in the selected computers.
Units: Percent
Default graph: Bar
Disk Utilization - All (table) Displays utilization for each disk in the selected computers.
Units: Percent
Default graph: Table
Disk Utilization - Highest Displays utilization for the busiest disks over time.
Units: Percent
Default graph: Bar
Disk transfers
Metric Description
Disk Transfers - All (chart) Displays the transfer rate for all disks in the selected computers.
Units: Transfers/second
Default graph: Bar
Disk Transfers - All (table) Displays the transfer rate for each disk in the selected computers.
Units: Transfers/second
Default graph: Table
IO Transfers - Highest Displays the I/O transfer rate over time for the busiest disks in the selected computers.
Units: Transfers/second
Default graph: Bar
Disk service time
Metric Description
Disk Service Time - All (chart)
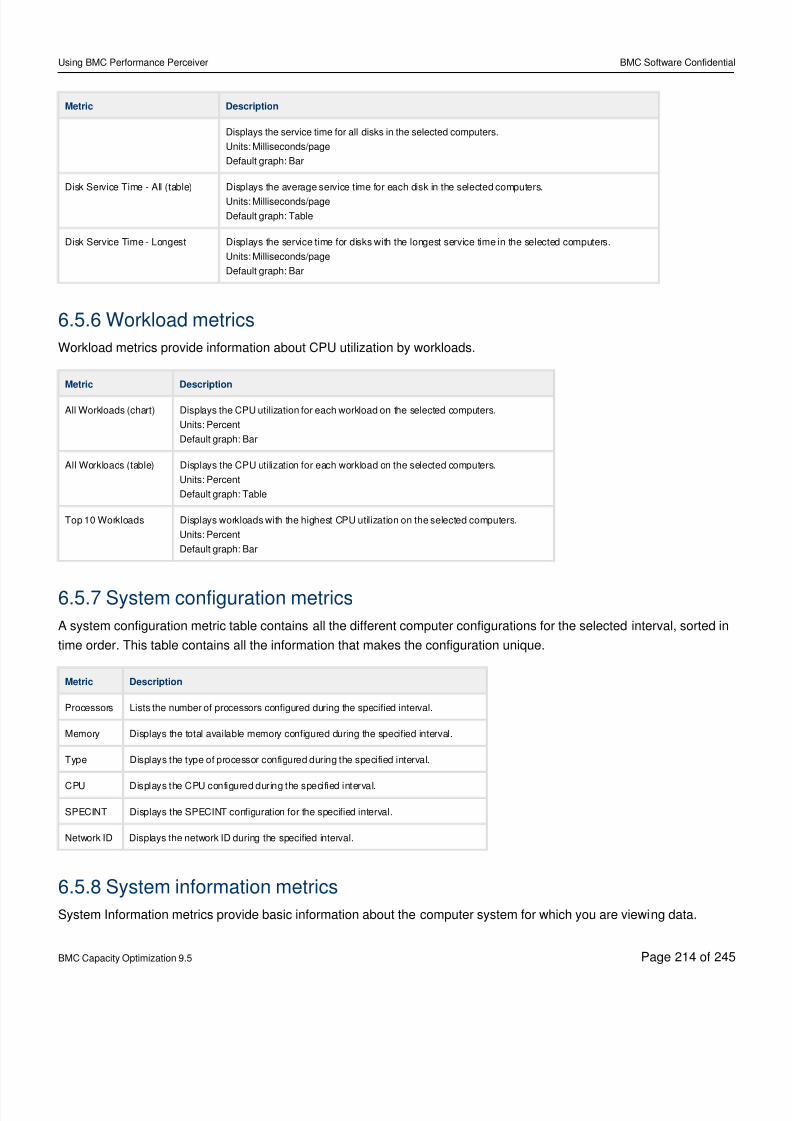
8/21/2019 Using BMC Performance Perceiver-V5-20141128_0503
http://slidepdf.com/reader/full/using-bmc-performance-perceiver-v5-201411280503 214/245
Using BMC Performance Perceiver BMC Software Confidential
BMC Capacity Optimization 9.5 Page of214 245
Metric Description
Displays the service time for all disks in the selected computers.
Units: Milliseconds/page
Default graph: Bar
Disk Service Time - All (table) Displays the average service time for each disk in the selected computers.
Units: Milliseconds/page
Default graph: Table
Disk Service Time - Longest Displays the service time for disks with the longest service time in the selected computers.
Units: Milliseconds/page
Default graph: Bar
6.5.6 Workload metrics
Workload metrics provide information about CPU utilization by workloads.
Metric Description
All Workloads (chart) Displays the CPU utilization for each workload on the selected computers.
Units: Percent
Default graph: Bar
All Workloads (table) Displays the CPU utilization for each workload on the selected computers.
Units: Percent
Default graph: Table
Top 10 Workloads Displays workloads with the highest CPU utilization on the selected computers.
Units: Percent
Default graph: Bar
6.5.7 System configuration metrics
A system configuration metric table contains all the different computer configurations for the selected interval, sorted in
time order. This table contains all the information that makes the configuration unique.
Metric Description
Processors Lists the number of processors configured during the specified interval.
Memory Displays the total available memory configured during the specified interval.
Type Displays the type of processor configured during the specified interval.
CPU Displays the CPU configured during the specified interval.
SPECINT Displays the SPECINT configuration for the specified interval.
Network ID Displays the network ID during the specified interval.
6.5.8 System information metrics
System Information metrics provide basic information about the computer system for which you are viewing data.
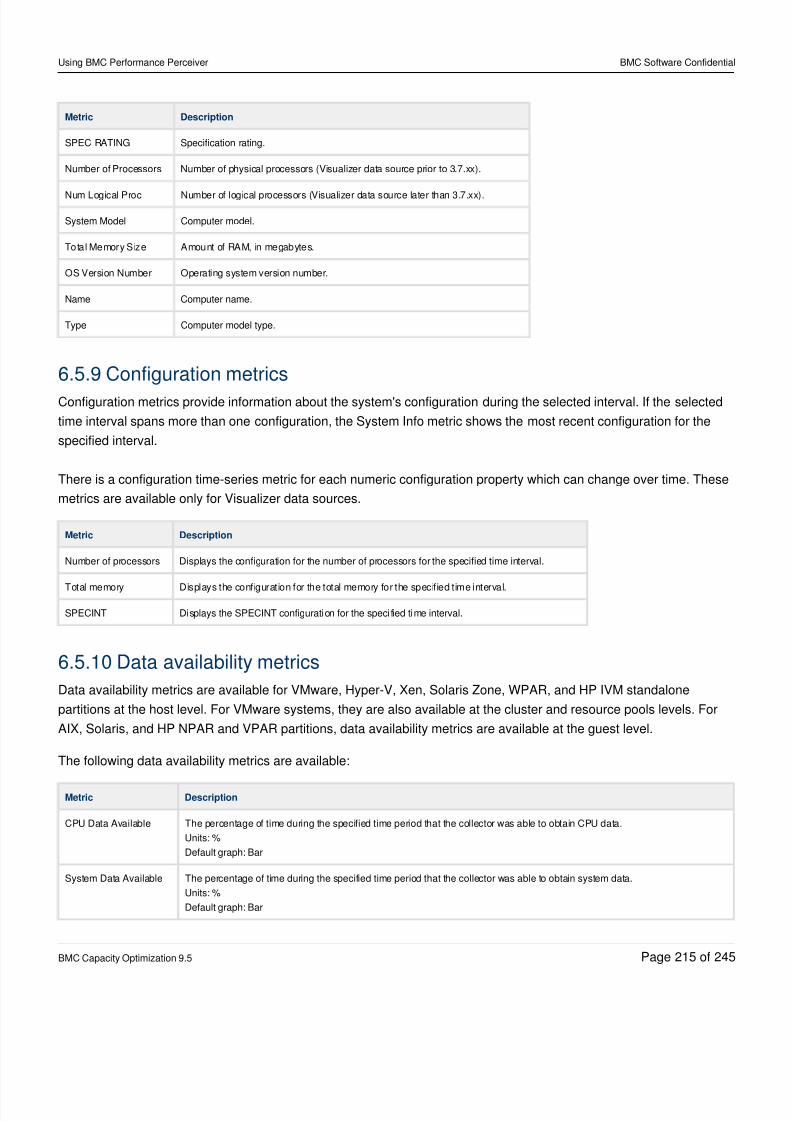
8/21/2019 Using BMC Performance Perceiver-V5-20141128_0503
http://slidepdf.com/reader/full/using-bmc-performance-perceiver-v5-201411280503 215/245
Using BMC Performance Perceiver BMC Software Confidential
BMC Capacity Optimization 9.5 Page of215 245
Metric Description
SPEC RATING Specification rating.
Number of Processors Number of physical processors (Visualizer data source prior to 3.7.xx).
Num Logical Proc Number of logical processors (Visualizer data source later than 3.7.xx).
System Model Computer model.
Total Memory Size Amount of RAM, in megabytes.
OS Version Number Operating system version number.
Name Computer name.
Type Computer model type.
6.5.9 Configuration metrics
Configuration metrics provide information about the system's configuration during the selected interval. If the selected
time interval spans more than one configuration, the System Info metric shows the most recent configuration for the
specified interval.
There is a configuration time-series metric for each numeric configuration property which can change over time. These
metrics are available only for Visualizer data sources.
Metric Description
Number of processors Displays the configuration for the number of processors for the specified time interval.
Total memory Displays the configuration for the total memory for the specified time interval.
SPECINT Displays the SPECINT configuration for the speci fied time interval.
6.5.10 Data availability metrics
Data availability metrics are available for VMware, Hyper-V, Xen, Solaris Zone, WPAR, and HP IVM standalone
partitions at the host level. For VMware systems, they are also available at the cluster and resource pools levels. For
AIX, Solaris, and HP NPAR and VPAR partitions, data availability metrics are available at the guest level.
The following data availability metrics are available:
Metric Description
CPU Data Available The percentage of time during the specified time period that the collector was able to obtain CPU data.
Units: %
Default graph: Bar
System Data Available The percentage of time during the specified time period that the collector was able to obtain system data.
Units: %
Default graph: Bar
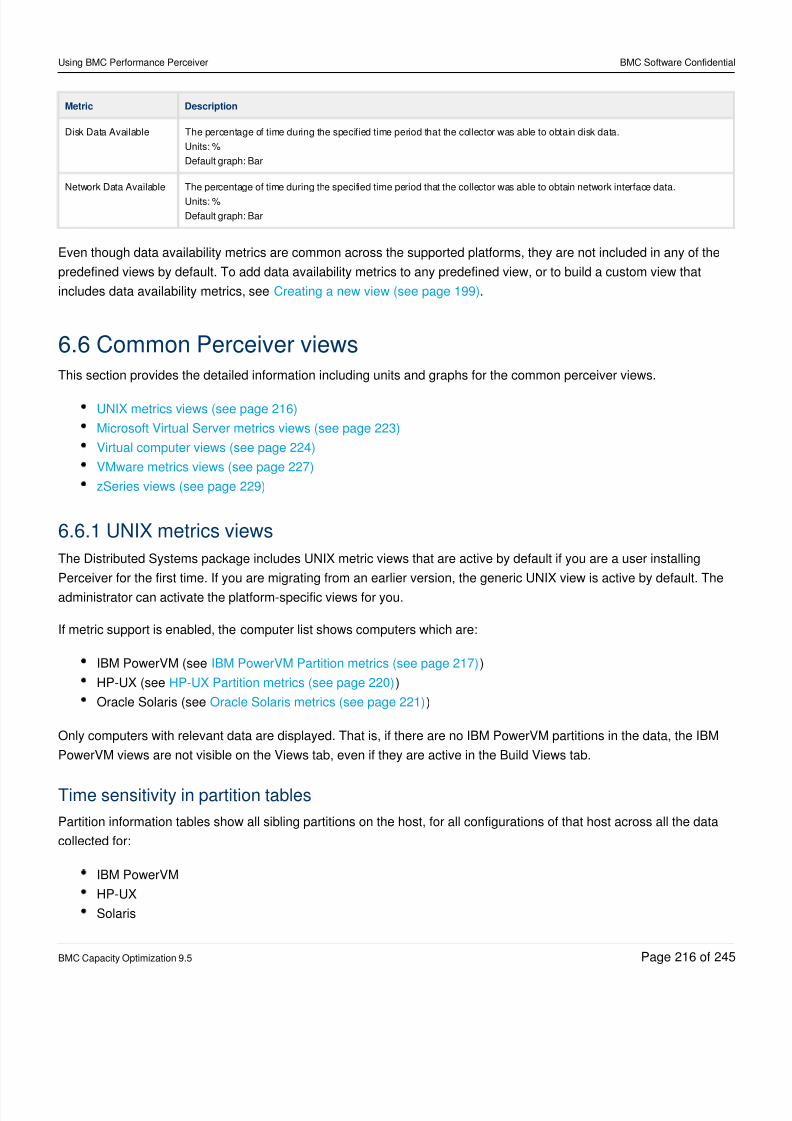
8/21/2019 Using BMC Performance Perceiver-V5-20141128_0503
http://slidepdf.com/reader/full/using-bmc-performance-perceiver-v5-201411280503 216/245
Using BMC Performance Perceiver BMC Software Confidential
BMC Capacity Optimization 9.5 Page of216 245
Metric Description
Disk Data Available The percentage of time during the specified time period that the collector was able to obtain disk data.
Units: %
Default graph: Bar
Network Data Available The percentage of time during the specified time period that the collector was able to obtain network interface data.
Units: %
Default graph: Bar
Even though data availability metrics are common across the supported platforms, they are not included in any of the
predefined views by default. To add data availability metrics to any predefined view, or to build a custom view that
includes data availability metrics, see .Creating a new view (see page 199)
6.6 Common Perceiver viewsThis section provides the detailed information including units and graphs for the common perceiver views.
UNIX metrics views (see page 216)
Microsoft Virtual Server metrics views (see page 223)
Virtual computer views (see page 224)
VMware metrics views (see page 227)
zSeries views (see page 229)
6.6.1 UNIX metrics views
The Distributed Systems package includes UNIX metric views that are active by default if you are a user installing
Perceiver for the first time. If you are migrating from an earlier version, the generic UNIX view is active by default. The
administrator can activate the platform-specific views for you.
If metric support is enabled, the computer list shows computers which are:
IBM PowerVM (see )IBM PowerVM Partition metrics (see page 217)
HP-UX (see )HP-UX Partition metrics (see page 220)
Oracle Solaris (see )Oracle Solaris metrics (see page 221)
Only computers with relevant data are displayed. That is, if there are no IBM PowerVM partitions in the data, the IBM
PowerVM views are not visible on the Views tab, even if they are active in the Build Views tab.
Time sensitivity in partition tables
Partition information tables show all sibling partitions on the host, for all configurations of that host across all the data
collected for:
IBM PowerVM
HP-UX
Solaris
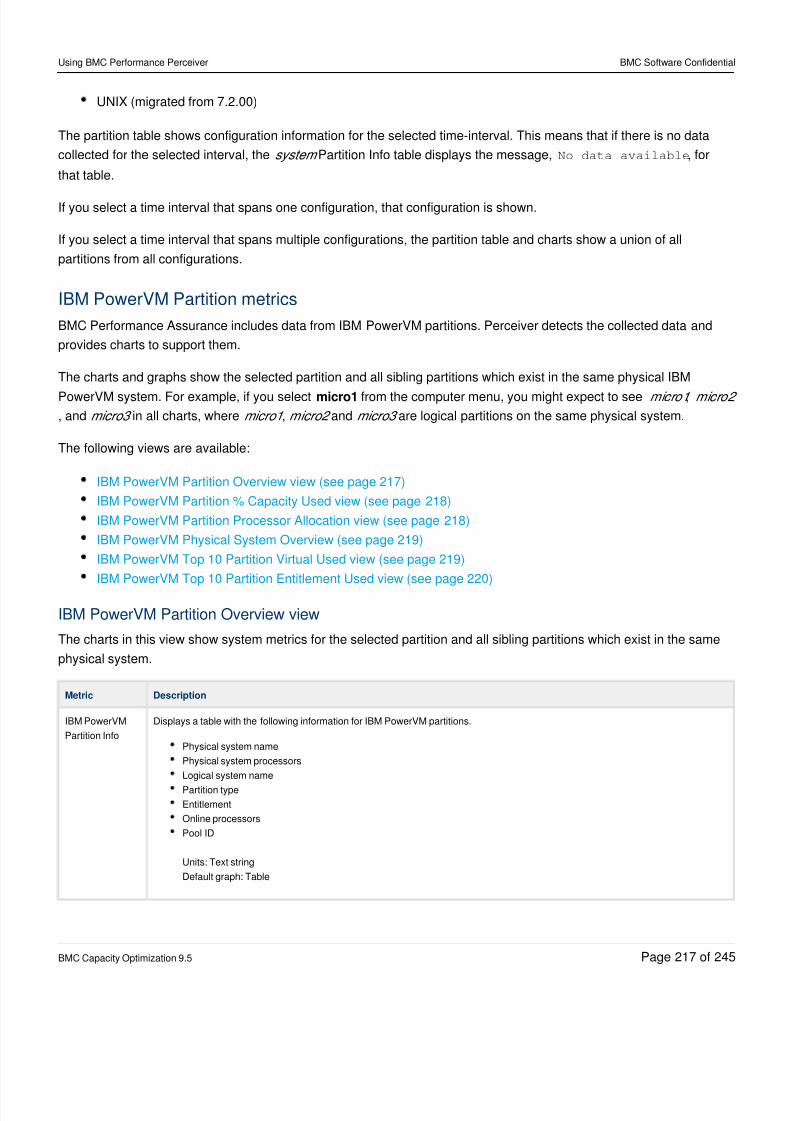
8/21/2019 Using BMC Performance Perceiver-V5-20141128_0503
http://slidepdf.com/reader/full/using-bmc-performance-perceiver-v5-201411280503 217/245
Using BMC Performance Perceiver BMC Software Confidential
BMC Capacity Optimization 9.5 Page of217 245
UNIX (migrated from 7.2.00)
The partition table shows configuration information for the selected time-interval. This means that if there is no data
collected for the selected interval, the Partition Info table displays the message, , forsystem No data available
that table.
If you select a time interval that spans one configuration, that configuration is shown.
If you select a time interval that spans multiple configurations, the partition table and charts show a union of all
partitions from all configurations.
IBM PowerVM Partition metrics
BMC Performance Assurance includes data from IBM PowerVM partitions. Perceiver detects the collected data and
provides charts to support them.
The charts and graphs show the selected partition and all sibling partitions which exist in the same physical IBM
PowerVM system. For example, if you select from the computer menu, you might expect to see ,micro1 micro1 micro2
, and in all charts, where , and are logical partitions on the same physical system.micro3 micro1 micro2 micro3
The following views are available:
IBM PowerVM Partition Overview view (see page 217)
IBM PowerVM Partition % Capacity Used view (see page 218)
IBM PowerVM Partition Processor Allocation view (see page 218)
IBM PowerVM Physical System Overview (see page 219)
IBM PowerVM Top 10 Partition Virtual Used view (see page 219)
IBM PowerVM Top 10 Partition Entitlement Used view (see page 220)
IBM PowerVM Partition Overview view
The charts in this view show system metrics for the selected partition and all sibling partitions which exist in the same
physical system.
Metric Description
IBM PowerVM
Partition Info
Displays a table with the following information for IBM PowerVM partitions.
Physical system name
Physical system processors
Logical system name
Partition type
Entitlement
Online processors
Pool ID
Units: Text string
Default graph: Table
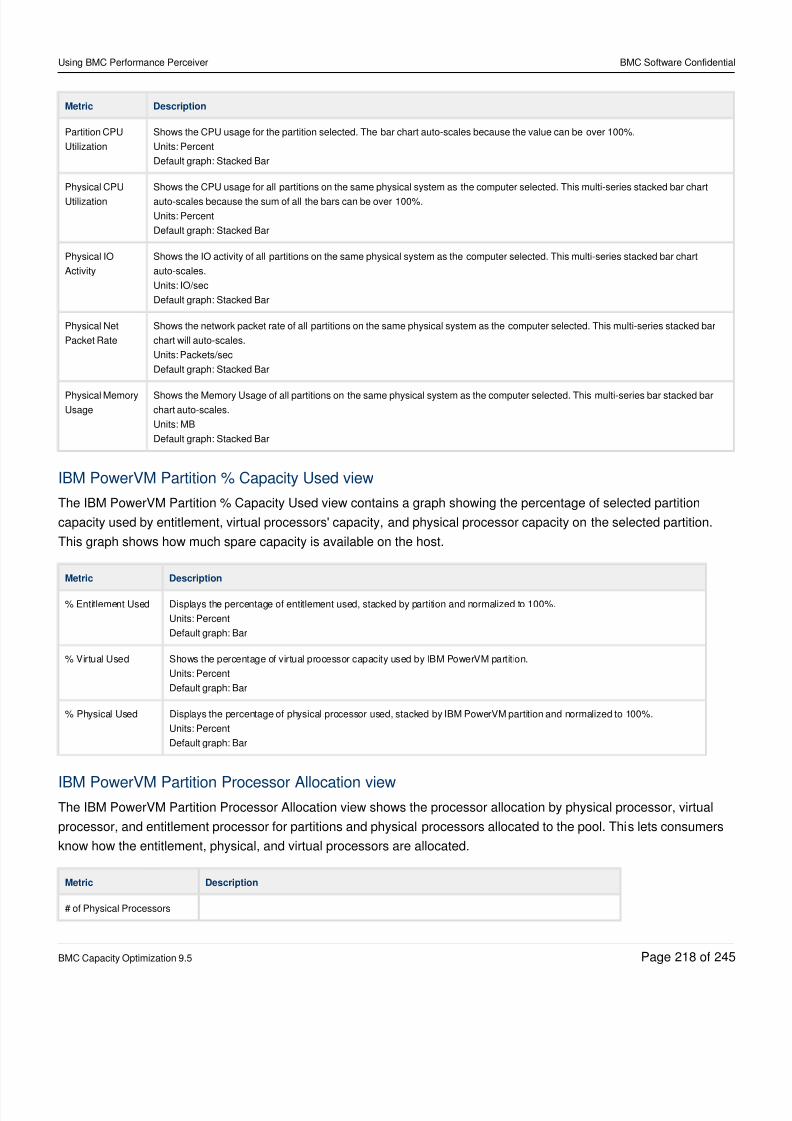
8/21/2019 Using BMC Performance Perceiver-V5-20141128_0503
http://slidepdf.com/reader/full/using-bmc-performance-perceiver-v5-201411280503 218/245
Using BMC Performance Perceiver BMC Software Confidential
BMC Capacity Optimization 9.5 Page of218 245
Metric Description
Partition CPU
Utilization
Shows the CPU usage for the partition selected. The bar chart auto-scales because the value can be over 100%.
Units: Percent
Default graph: Stacked Bar
Physical CPU
Utilization
Shows the CPU usage for all partitions on the same physical system as the computer selected. This multi-series stacked bar chart
auto-scales because the sum of all the bars can be over 100%.
Units: Percent
Default graph: Stacked Bar
Physical IO
Activity
Shows the IO activity of all partitions on the same physical system as the computer selected. This multi-series stacked bar chart
auto-scales.
Units: IO/sec
Default graph: Stacked Bar
Physical Net
Packet Rate
Shows the network packet rate of all partitions on the same physical system as the computer selected. This multi-series stacked bar
chart will auto-scales.
Units: Packets/sec
Default graph: Stacked Bar
Physical Memory
Usage
Shows the Memory Usage of all partitions on the same physical system as the computer selected. This multi-series bar stacked bar
chart auto-scales.
Units: MB
Default graph: Stacked Bar
IBM PowerVM Partition % Capacity Used view
The IBM PowerVM Partition % Capacity Used view contains a graph showing the percentage of selected partition
capacity used by entitlement, virtual processors' capacity, and physical processor capacity on the selected partition.
This graph shows how much spare capacity is available on the host.
Metric Description
% Entitlement Used Displays the percentage of entitlement used, stacked by partition and normalized to 100%.
Units: Percent
Default graph: Bar
% Virtual Used Shows the percentage of virtual processor capacity used by IBM PowerVM partition.
Units: Percent
Default graph: Bar
% Physical Used Displays the percentage of physical processor used, stacked by IBM PowerVM partition and normalized to 100%.
Units: Percent
Default graph: Bar
IBM PowerVM Partition Processor Allocation viewThe IBM PowerVM Partition Processor Allocation view shows the processor allocation by physical processor, virtual
processor, and entitlement processor for partitions and physical processors allocated to the pool. This lets consumers
know how the entitlement, physical, and virtual processors are allocated.
Metric Description
# of Physical Processors
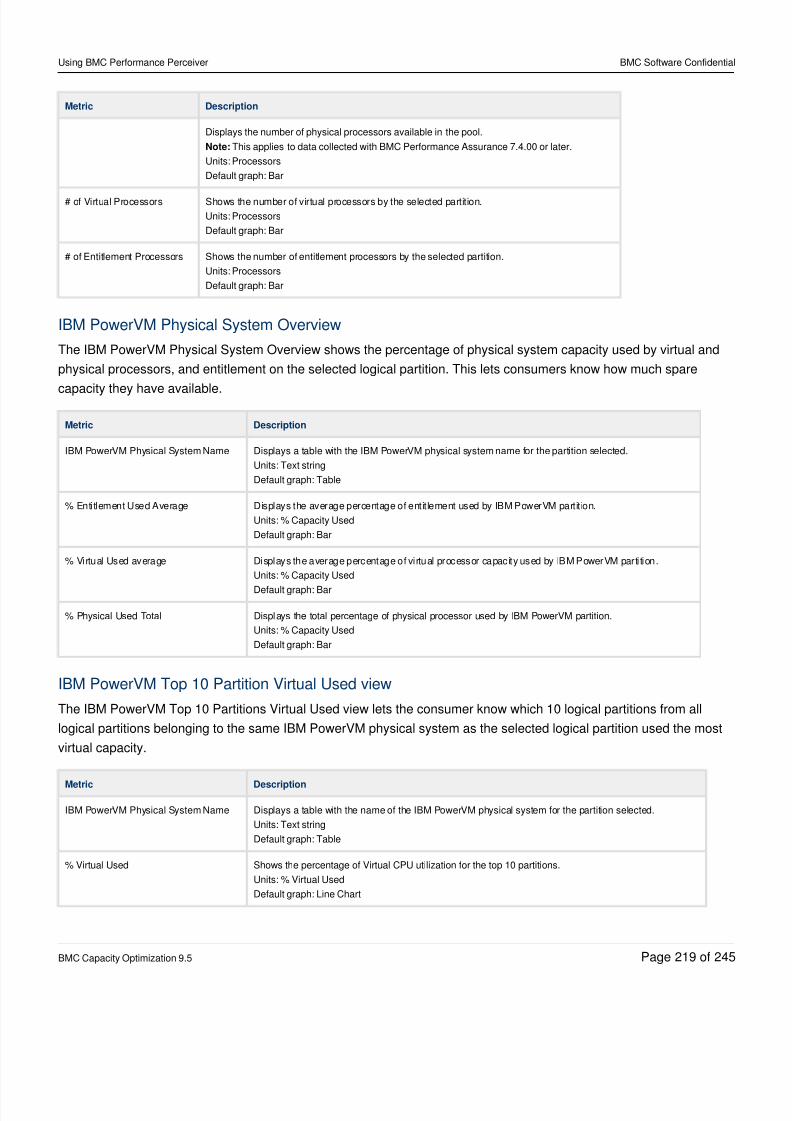
8/21/2019 Using BMC Performance Perceiver-V5-20141128_0503
http://slidepdf.com/reader/full/using-bmc-performance-perceiver-v5-201411280503 219/245
Using BMC Performance Perceiver BMC Software Confidential
BMC Capacity Optimization 9.5 Page of219 245
Metric Description
Displays the number of physical processors available in the pool.
This applies to data collected with BMC Performance Assurance 7.4.00 or later.Note:
Units: Processors
Default graph: Bar
# of Virtual Processors Shows the number of virtual processors by the selected partition.
Units: Processors
Default graph: Bar
# of Entitlement Processors Shows the number of entitlement processors by the selected partition.
Units: Processors
Default graph: Bar
IBM PowerVM Physical System Overview
The IBM PowerVM Physical System Overview shows the percentage of physical system capacity used by virtual and
physical processors, and entitlement on the selected logical partition. This lets consumers know how much spare
capacity they have available.
Metric Description
IBM PowerVM Physical System Name Displays a table with the IBM PowerVM physical system name for the partition selected.
Units: Text string
Default graph: Table
% Entitlement Used Average Displays the average percentage of entit lement used by IBM PowerVM partit ion.
Units: % Capacity Used
Default graph: Bar
% Virtual Used average Displays the average percentage of virtual processor capacity used by IBM PowerVM partition.
Units: % Capacity Used
Default graph: Bar
% Physical Used Total Displays the total percentage of physical processor used by IBM PowerVM partition.
Units: % Capacity Used
Default graph: Bar
IBM PowerVM Top 10 Partition Virtual Used view
The IBM PowerVM Top 10 Partitions Virtual Used view lets the consumer know which 10 logical partitions from all
logical partitions belonging to the same IBM PowerVM physical system as the selected logical partition used the most
virtual capacity.
Metric Description
IBM PowerVM Physical System Name Displays a table with the name of the IBM PowerVM physical system for the partition selected.
Units: Text string
Default graph: Table
% Virtual Used Shows the percentage of Virtual CPU utilization for the top 10 partitions.
Units: % Virtual Used
Default graph: Line Chart
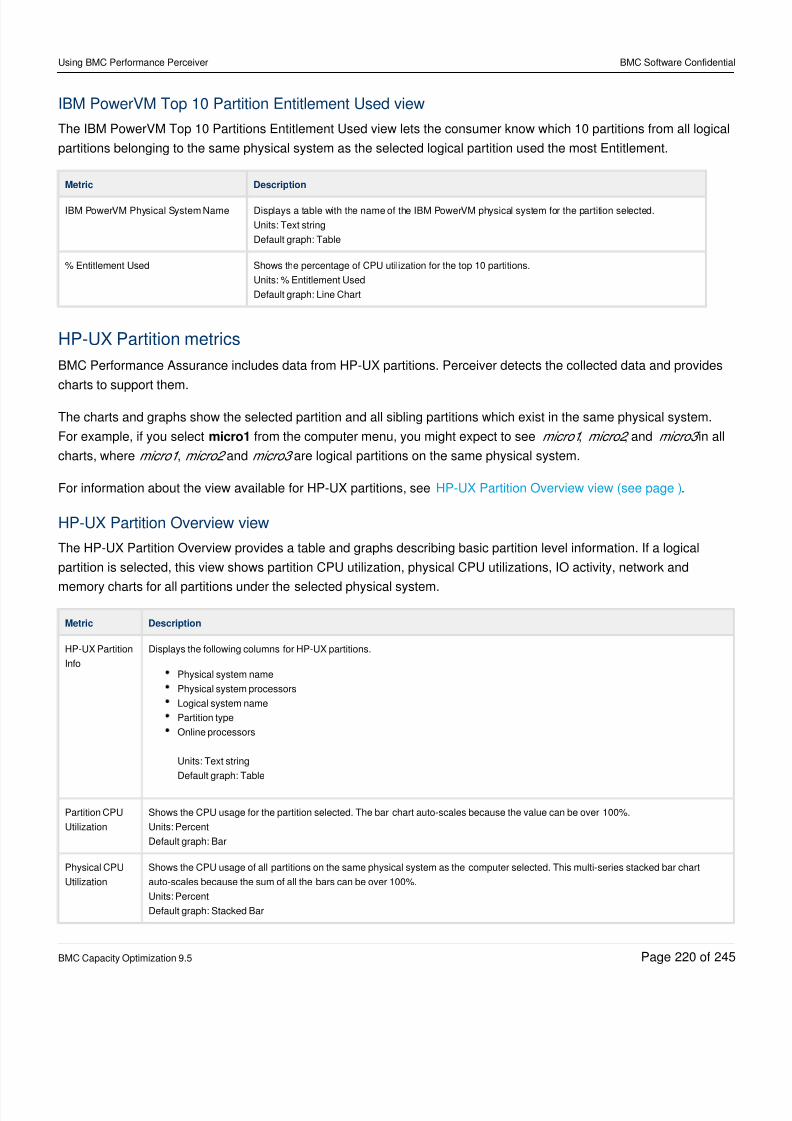
8/21/2019 Using BMC Performance Perceiver-V5-20141128_0503
http://slidepdf.com/reader/full/using-bmc-performance-perceiver-v5-201411280503 220/245
Using BMC Performance Perceiver BMC Software Confidential
BMC Capacity Optimization 9.5 Page of220 245
IBM PowerVM Top 10 Partition Entitlement Used view
The IBM PowerVM Top 10 Partitions Entitlement Used view lets the consumer know which 10 partitions from all logical
partitions belonging to the same physical system as the selected logical partition used the most Entitlement.
Metric Description
IBM PowerVM Physical System Name Displays a table with the name of the IBM PowerVM physical system for the partition selected.
Units: Text string
Default graph: Table
% Entitlement Used Shows the percentage of CPU utilization for the top 10 partitions.
Units: % Entitlement Used
Default graph: Line Chart
HP-UX Partition metrics
BMC Performance Assurance includes data from HP-UX partitions. Perceiver detects the collected data and provides
charts to support them.
The charts and graphs show the selected partition and all sibling partitions which exist in the same physical system.
For example, if you select from the computer menu, you might expect to see , , and in allmicro1 micro1 micro2 micro3
charts, where , and are logical partitions on the same physical system.micro1 micro2 micro3
For information about the view available for HP-UX partitions, see .HP-UX Partition Overview view (see page )
HP-UX Partition Overview view
The HP-UX Partition Overview provides a table and graphs describing basic partition level information. If a logical
partition is selected, this view shows partition CPU utilization, physical CPU utilizations, IO activity, network and
memory charts for all partitions under the selected physical system.
Metric Description
HP-UX Partition
Info
Displays the following columns for HP-UX partitions.
Physical system name
Physical system processors
Logical system name
Partition type
Online processors
Units: Text string
Default graph: Table
Partition CPU
Utilization
Shows the CPU usage for the partition selected. The bar chart auto-scales because the value can be over 100%.
Units: Percent
Default graph: Bar
Physical CPU
Utilization
Shows the CPU usage of all partitions on the same physical system as the computer selected. This multi-series stacked bar chart
auto-scales because the sum of all the bars can be over 100%.
Units: Percent
Default graph: Stacked Bar
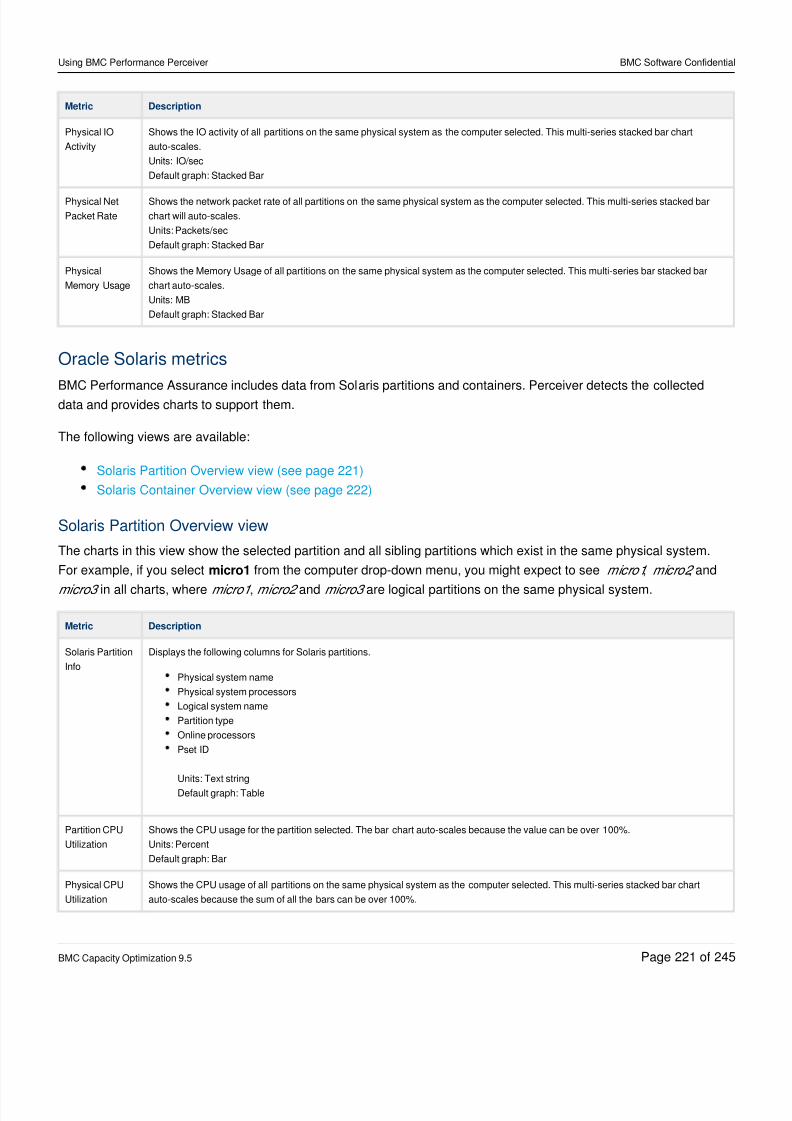
8/21/2019 Using BMC Performance Perceiver-V5-20141128_0503
http://slidepdf.com/reader/full/using-bmc-performance-perceiver-v5-201411280503 221/245
Using BMC Performance Perceiver BMC Software Confidential
BMC Capacity Optimization 9.5 Page of221 245
Metric Description
Physical IO
Activity
Shows the IO activity of all partitions on the same physical system as the computer selected. This multi-series stacked bar chart
auto-scales.
Units: IO/sec
Default graph: Stacked Bar
Physical Net
Packet Rate
Shows the network packet rate of all partitions on the same physical system as the computer selected. This multi-series stacked bar
chart will auto-scales.
Units: Packets/sec
Default graph: Stacked Bar
Physical
Memory Usage
Shows the Memory Usage of all partitions on the same physical system as the computer selected. This multi-series bar stacked bar
chart auto-scales.
Units: MB
Default graph: Stacked Bar
Oracle Solaris metrics
BMC Performance Assurance includes data from Solaris partitions and containers. Perceiver detects the collected
data and provides charts to support them.
The following views are available:
Solaris Partition Overview view (see page 221)
Solaris Container Overview view (see page 222)
Solaris Partition Overview view
The charts in this view show the selected partition and all sibling partitions which exist in the same physical system.
For example, if you select from the computer drop-down menu, you might expect to see , , andmicro1 micro1 micro2
in all charts, where , and are logical partitions on the same physical system.micro3 micro1 micro2 micro3
Metric Description
Solaris Partition
Info
Displays the following columns for Solaris partitions.
Physical system name
Physical system processors
Logical system name
Partition type
Online processors
Pset ID
Units: Text string
Default graph: Table
Partition CPU
Utilization
Shows the CPU usage for the partition selected. The bar chart auto-scales because the value can be over 100%.
Units: Percent
Default graph: Bar
Physical CPU
Utilization
Shows the CPU usage of all partitions on the same physical system as the computer selected. This multi-series stacked bar chart
auto-scales because the sum of all the bars can be over 100%.
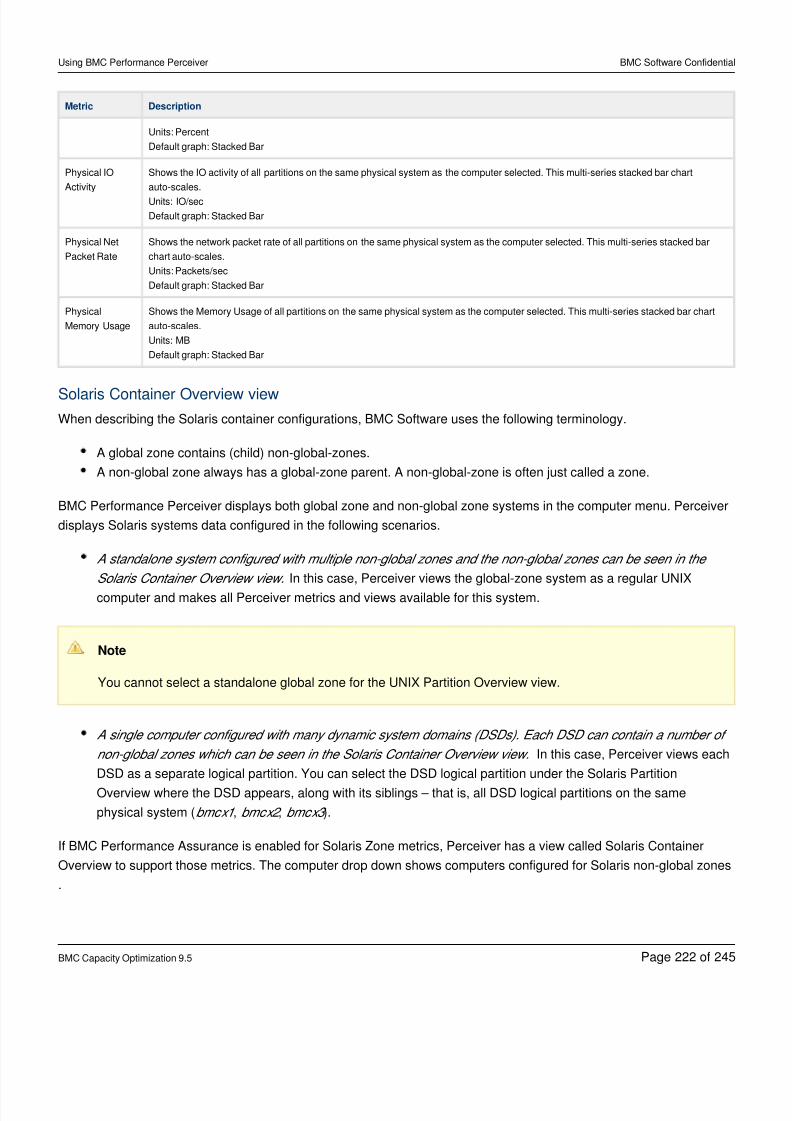
8/21/2019 Using BMC Performance Perceiver-V5-20141128_0503
http://slidepdf.com/reader/full/using-bmc-performance-perceiver-v5-201411280503 222/245
Using BMC Performance Perceiver BMC Software Confidential
BMC Capacity Optimization 9.5 Page of222 245
Metric Description
Units: Percent
Default graph: Stacked Bar
Physical IO
Activity
Shows the IO activity of all partitions on the same physical system as the computer selected. This multi-series stacked bar chart
auto-scales.
Units: IO/sec
Default graph: Stacked Bar
Physical Net
Packet Rate
Shows the network packet rate of all partitions on the same physical system as the computer selected. This multi-series stacked bar
chart auto-scales.
Units: Packets/sec
Default graph: Stacked Bar
Physical
Memory Usage
Shows the Memory Usage of all partitions on the same physical system as the computer selected. This multi-series stacked bar chart
auto-scales.
Units: MB
Default graph: Stacked Bar
Solaris Container Overview view
When describing the Solaris container configurations, BMC Software uses the following terminology.
A global zone contains (child) non-global-zones.
A non-global zone always has a global-zone parent. A non-global-zone is often just called a zone.
BMC Performance Perceiver displays both global zone and non-global zone systems in the computer menu. Perceiver
displays Solaris systems data configured in the following scenarios.
A standalone system configured with multiple non-global zones and the non-global zones can be seen in the
Solaris Container Overview view. In this case, Perceiver views the global-zone system as a regular UNIX
computer and makes all Perceiver metrics and views available for this system.
Note
You cannot select a standalone global zone for the UNIX Partition Overview view.
A single computer configured with many dynamic system domains (DSDs). Each DSD can contain a number of
non-global zones which can be seen in the Solaris Container Overview view. In this case, Perceiver views each
DSD as a separate logical partition. You can select the DSD logical partition under the Solaris Partition
Overview where the DSD appears, along with its siblings – that is, all DSD logical partitions on the same
physical system ( , , ).bmcx1 bmcx2 bmcx3
If BMC Performance Assurance is enabled for Solaris Zone metrics, Perceiver has a view called Solaris Container
Overview to support those metrics. The computer drop down shows computers configured for Solaris non-global zones
.
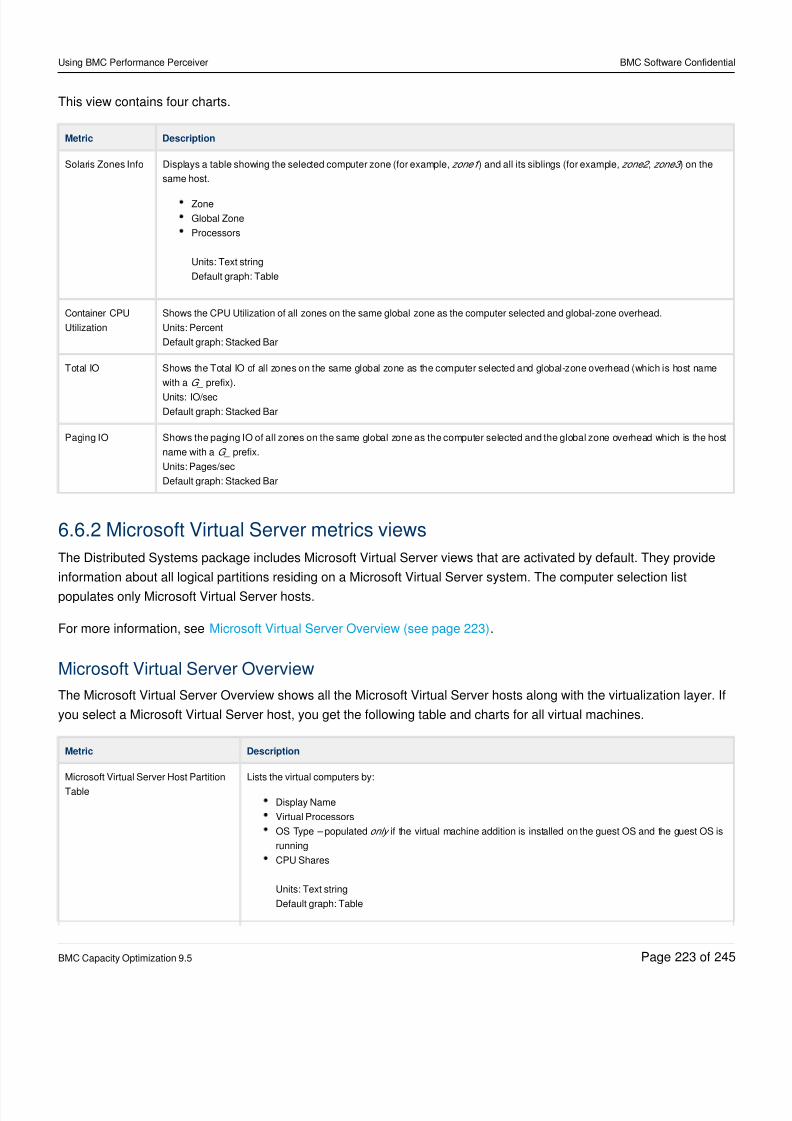
8/21/2019 Using BMC Performance Perceiver-V5-20141128_0503
http://slidepdf.com/reader/full/using-bmc-performance-perceiver-v5-201411280503 223/245
Using BMC Performance Perceiver BMC Software Confidential
BMC Capacity Optimization 9.5 Page of223 245
This view contains four charts.
Metric Description
Solaris Zones Info Displays a table showing the selected computer zone (for example, ) and all its siblings (for example, , ) on thezone1 zone2 zone3
same host.
Zone
Global Zone
Processors
Units: Text string
Default graph: Table
Container CPU
Utilization
Shows the CPU Utilization of all zones on the same global zone as the computer selected and global-zone overhead.
Units: Percent
Default graph: Stacked Bar
Total IO Shows the Total IO of all zones on the same global zone as the computer selected and global-zone overhead (which is host name
with a prefix).G_
Units: IO/sec
Default graph: Stacked Bar
Paging IO Shows the paging IO of all zones on the same global zone as the computer selected and the global zone overhead which is the host
name with a prefix.G_
Units: Pages/sec
Default graph: Stacked Bar
6.6.2 Microsoft Virtual Server metrics views
The Distributed Systems package includes Microsoft Virtual Server views that are activated by default. They provide
information about all logical partitions residing on a Microsoft Virtual Server system. The computer selection list
populates only Microsoft Virtual Server hosts.
For more information, see .Microsoft Virtual Server Overview (see page 223)
Microsoft Virtual Server Overview
The Microsoft Virtual Server Overview shows all the Microsoft Virtual Server hosts along with the virtualization layer. If
you select a Microsoft Virtual Server host, you get the following table and charts for all virtual machines.
Metric Description
Microsoft Virtual Server Host Partition
Table
Lists the virtual computers by:
Display Name
Virtual Processors
OS Type – populated if the virtual machine addition is installed on the guest OS and the guest OS isonly
running
CPU Shares
Units: Text string
Default graph: Table
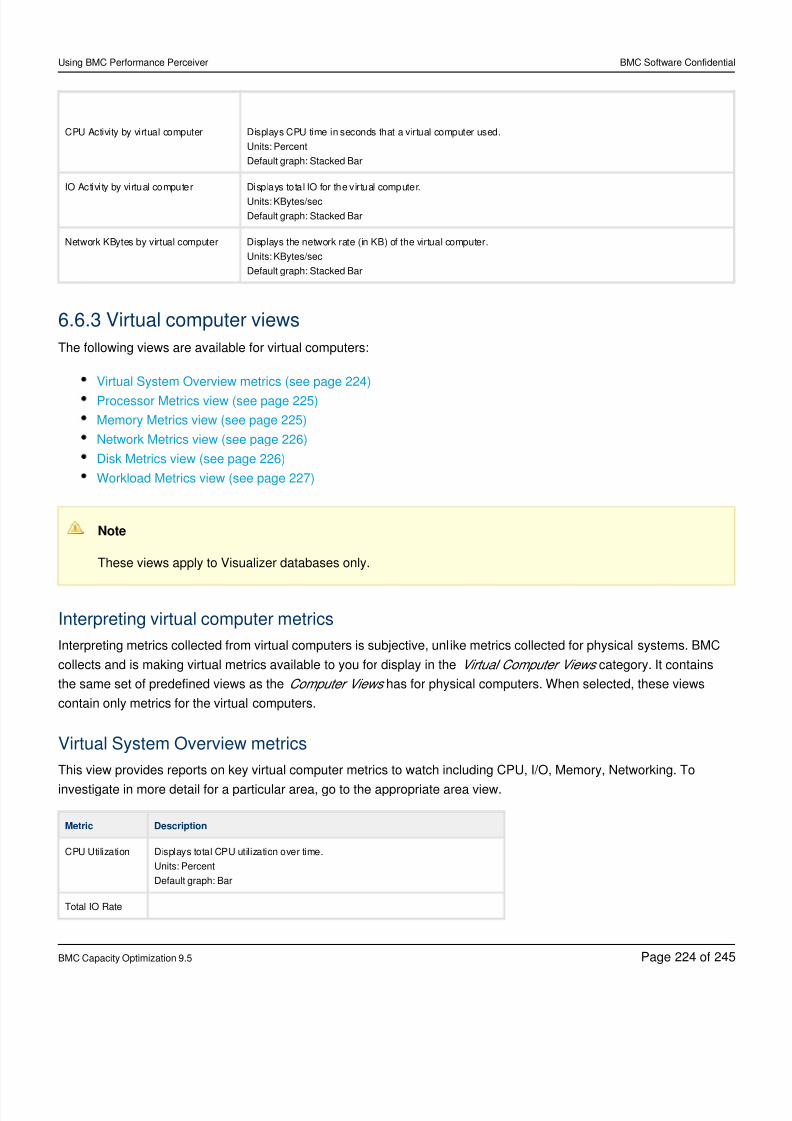
8/21/2019 Using BMC Performance Perceiver-V5-20141128_0503
http://slidepdf.com/reader/full/using-bmc-performance-perceiver-v5-201411280503 224/245
Using BMC Performance Perceiver BMC Software Confidential
BMC Capacity Optimization 9.5 Page of224 245
CPU Activity by virtual computer Displays CPU time in seconds that a virtual computer used.
Units: Percent
Default graph: Stacked Bar
IO Activity by virtual computer Displays total IO for the vir tual computer.
Units: KBytes/sec
Default graph: Stacked Bar
Network KBytes by virtual computer Displays the network rate (in KB) of the virtual computer.
Units: KBytes/sec
Default graph: Stacked Bar
6.6.3 Virtual computer views
The following views are available for virtual computers:
Virtual System Overview metrics (see page 224)
Processor Metrics view (see page 225)
Memory Metrics view (see page 225)
Network Metrics view (see page 226)
Disk Metrics view (see page 226)
Workload Metrics view (see page 227)
Note
These views apply to Visualizer databases only.
Interpreting virtual computer metrics
Interpreting metrics collected from virtual computers is subjective, unlike metrics collected for physical systems. BMC
collects and is making virtual metrics available to you for display in the category. It containsVirtual Computer Views
the same set of predefined views as the has for physical computers. When selected, these viewsComputer Views
contain only metrics for the virtual computers.
Virtual System Overview metrics
This view provides reports on key virtual computer metrics to watch including CPU, I/O, Memory, Networking. To
investigate in more detail for a particular area, go to the appropriate area view.
Metric Description
CPU Utilization Displays total CPU utilization over time.
Units: Percent
Default graph: Bar
Total IO Rate
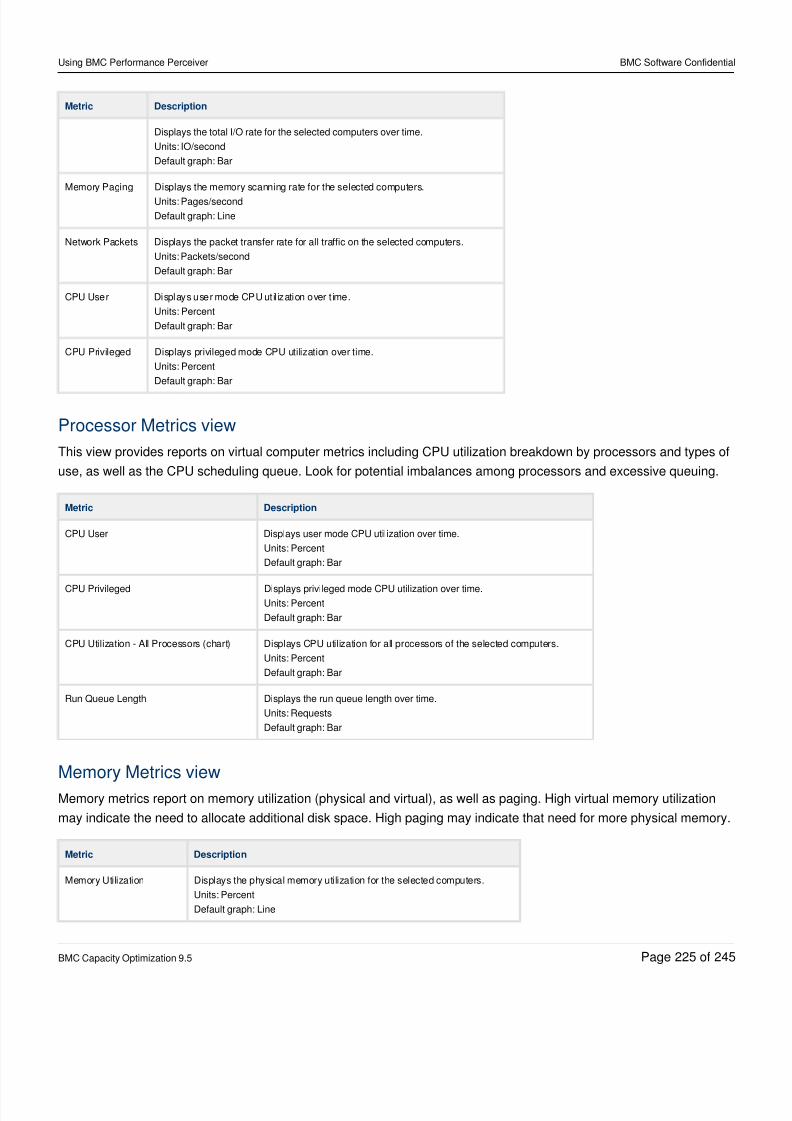
8/21/2019 Using BMC Performance Perceiver-V5-20141128_0503
http://slidepdf.com/reader/full/using-bmc-performance-perceiver-v5-201411280503 225/245
Using BMC Performance Perceiver BMC Software Confidential
BMC Capacity Optimization 9.5 Page of225 245
Metric Description
Displays the total I/O rate for the selected computers over time.
Units: IO/second
Default graph: Bar
Memory Paging Displays the memory scanning rate for the selected computers.
Units: Pages/second
Default graph: Line
Network Packets Displays the packet transfer rate for all traffic on the selected computers.
Units: Packets/second
Default graph: Bar
CPU User Displays user mode CPU ut il ization over t ime.
Units: Percent
Default graph: Bar
CPU Privileged Displays privileged mode CPU utilization over time.
Units: Percent
Default graph: Bar
Processor Metrics view
This view provides reports on virtual computer metrics including CPU utilization breakdown by processors and types of
use, as well as the CPU scheduling queue. Look for potential imbalances among processors and excessive queuing.
Metric Description
CPU User Displays user mode CPU utilization over time.
Units: Percent
Default graph: Bar
CPU Privileged Displays privileged mode CPU utilization over time.Units: Percent
Default graph: Bar
CPU Utilization - All Processors (chart) Displays CPU utilization for all processors of the selected computers.
Units: Percent
Default graph: Bar
Run Queue Length Displays the run queue length over time.
Units: Requests
Default graph: Bar
Memory Metrics view
Memory metrics report on memory utilization (physical and virtual), as well as paging. High virtual memory utilization
may indicate the need to allocate additional disk space. High paging may indicate that need for more physical memory.
Metric Description
Memory Utilization Displays the physical memory utilization for the selected computers.
Units: Percent
Default graph: Line
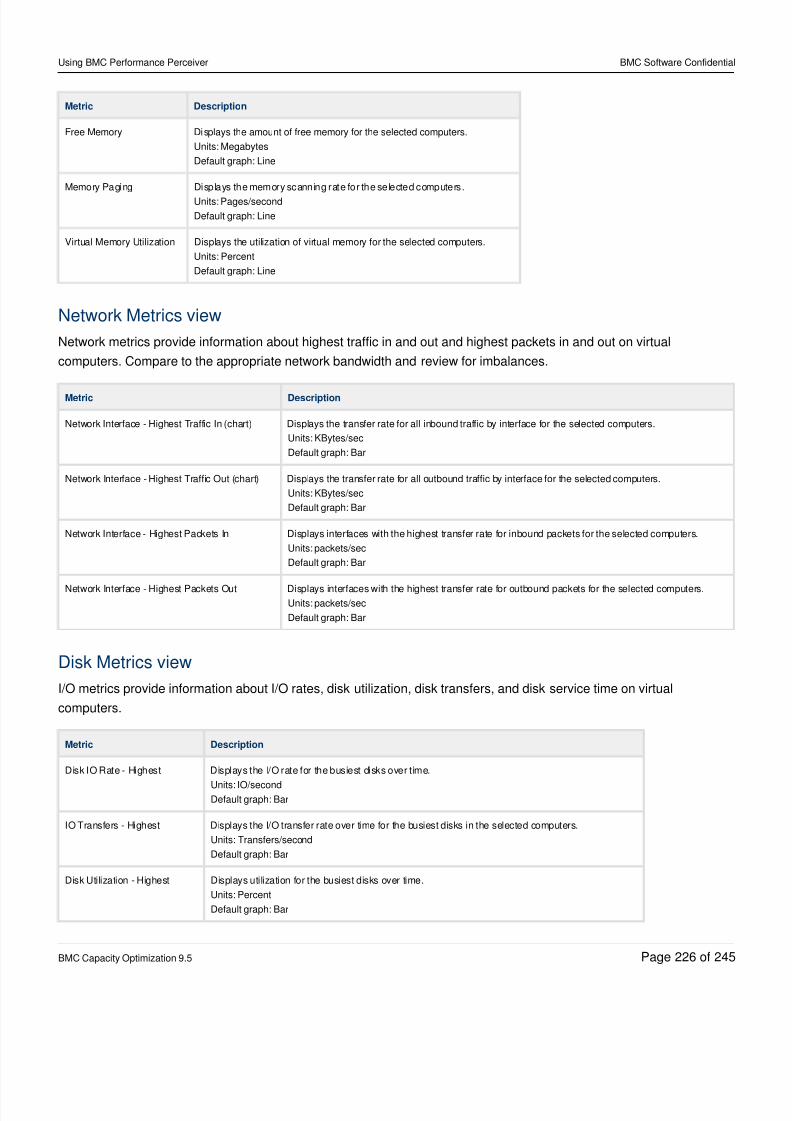
8/21/2019 Using BMC Performance Perceiver-V5-20141128_0503
http://slidepdf.com/reader/full/using-bmc-performance-perceiver-v5-201411280503 226/245
Using BMC Performance Perceiver BMC Software Confidential
BMC Capacity Optimization 9.5 Page of226 245
Metric Description
Free Memory Displays the amount of free memory for the selected computers.
Units: Megabytes
Default graph: Line
Memory Paging Displays the memory scanning rate for the selected computers.
Units: Pages/second
Default graph: Line
Virtual Memory Utilization Displays the utilization of virtual memory for the selected computers.
Units: Percent
Default graph: Line
Network Metrics view
Network metrics provide information about highest traffic in and out and highest packets in and out on virtual
computers. Compare to the appropriate network bandwidth and review for imbalances.
Metric Description
Network Interface - Highest Traffic In (chart) Displays the transfer rate for all inbound traffic by interface for the selected computers.
Units: KBytes/sec
Default graph: Bar
Network Interface - Highest Traffic Out (chart) Displays the transfer rate for all outbound traffic by interface for the selected computers.
Units: KBytes/sec
Default graph: Bar
Network Interface - Highest Packets In Displays interfaces with the highest transfer rate for inbound packets for the selected computers.
Units: packets/sec
Default graph: Bar
Network Interface - Highest Packets Out Displays interfaces with the highest transfer rate for outbound packets for the selected computers.Units: packets/sec
Default graph: Bar
Disk Metrics view
I/O metrics provide information about I/O rates, disk utilization, disk transfers, and disk service time on virtual
computers.
Metric Description
Disk IO Rate - Highest Displays the I/O rate for the busiest disks over time.
Units: IO/secondDefault graph: Bar
IO Transfers - Highest Displays the I/O transfer rate over time for the busiest disks in the selected computers.
Units: Transfers/second
Default graph: Bar
Disk Utilization - Highest Displays utilization for the busiest disks over time.
Units: Percent
Default graph: Bar
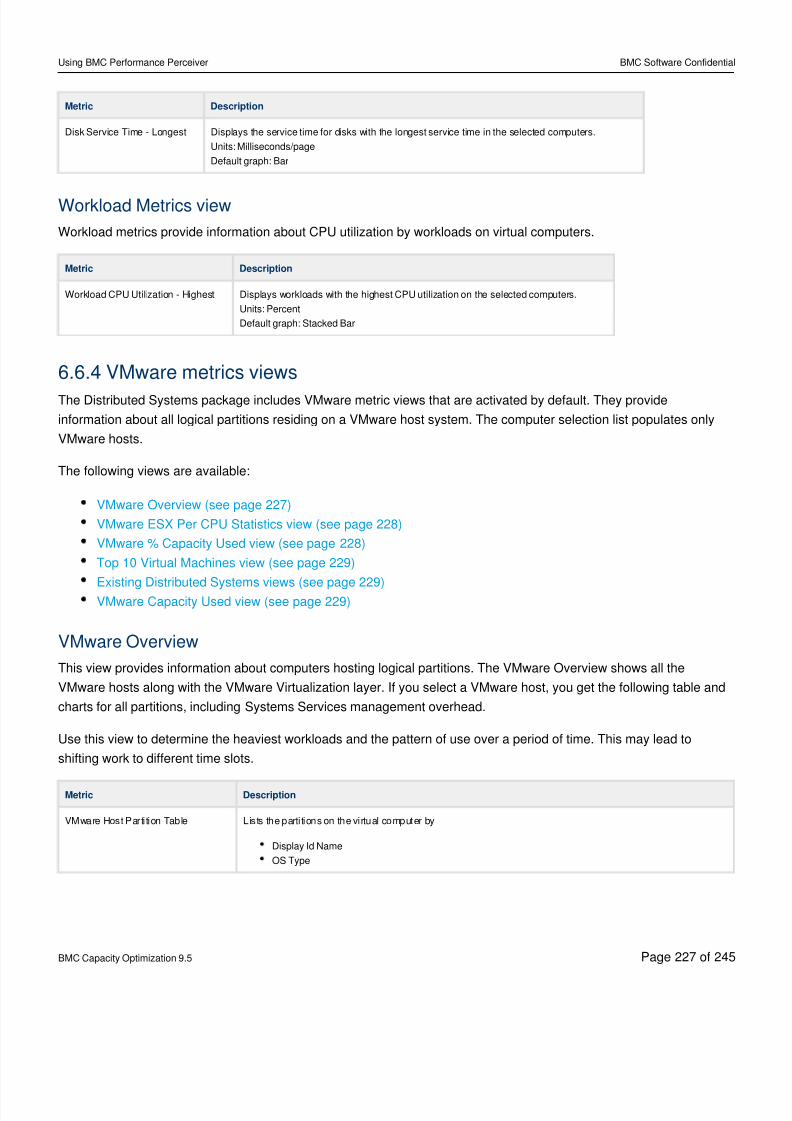
8/21/2019 Using BMC Performance Perceiver-V5-20141128_0503
http://slidepdf.com/reader/full/using-bmc-performance-perceiver-v5-201411280503 227/245
Using BMC Performance Perceiver BMC Software Confidential
BMC Capacity Optimization 9.5 Page of227 245
Metric Description
Disk Service Time - Longest Displays the service time for disks with the longest service time in the selected computers.
Units: Milliseconds/page
Default graph: Bar
Workload Metrics view
Workload metrics provide information about CPU utilization by workloads on virtual computers.
Metric Description
Workload CPU Utilization - Highest Displays workloads with the highest CPU utilization on the selected computers.
Units: Percent
Default graph: Stacked Bar
6.6.4 VMware metrics views
The Distributed Systems package includes VMware metric views that are activated by default. They provide
information about all logical partitions residing on a VMware host system. The computer selection list populates only
VMware hosts.
The following views are available:
VMware Overview (see page 227)
VMware ESX Per CPU Statistics view (see page 228)
VMware % Capacity Used view (see page 228)
Top 10 Virtual Machines view (see page 229)
Existing Distributed Systems views (see page 229)
VMware Capacity Used view (see page 229)
VMware Overview
This view provides information about computers hosting logical partitions. The VMware Overview shows all the
VMware hosts along with the VMware Virtualization layer. If you select a VMware host, you get the following table and
charts for all partitions, including Systems Services management overhead.
Use this view to determine the heaviest workloads and the pattern of use over a period of time. This may lead to
shifting work to different time slots.
Metric Description
VMware Host Partition Table Lists the partitions on the virtual computer by
Display Id Name
OS Type
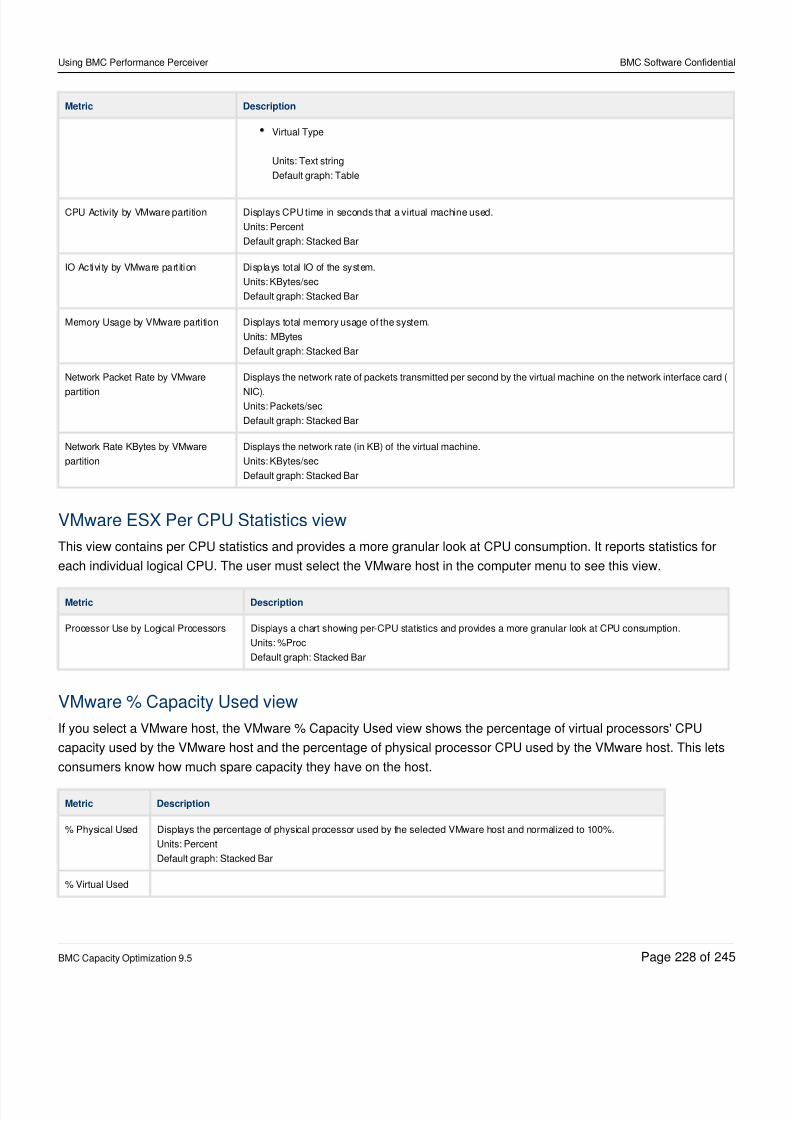
8/21/2019 Using BMC Performance Perceiver-V5-20141128_0503
http://slidepdf.com/reader/full/using-bmc-performance-perceiver-v5-201411280503 228/245
Using BMC Performance Perceiver BMC Software Confidential
BMC Capacity Optimization 9.5 Page of228 245
Metric Description
Virtual Type
Units: Text string
Default graph: Table
CPU Activity by VMware partition Displays CPU time in seconds that a virtual machine used.
Units: Percent
Default graph: Stacked Bar
IO Activity by VMware part ition Displays total IO of the system.
Units: KBytes/sec
Default graph: Stacked Bar
Memory Usage by VMware partition Displays total memory usage of the system.
Units: MBytes
Default graph: Stacked Bar
Network Packet Rate by VMware
partition
Displays the network rate of packets transmitted per second by the virtual machine on the network interface card (
NIC).Units: Packets/sec
Default graph: Stacked Bar
Network Rate KBytes by VMware
partition
Displays the network rate (in KB) of the virtual machine.
Units: KBytes/sec
Default graph: Stacked Bar
VMware ESX Per CPU Statistics view
This view contains per CPU statistics and provides a more granular look at CPU consumption. It reports statistics for
each individual logical CPU. The user must select the VMware host in the computer menu to see this view.
Metric Description
Processor Use by Logical Processors Displays a chart showing per-CPU statistics and provides a more granular look at CPU consumption.
Units: %Proc
Default graph: Stacked Bar
VMware % Capacity Used view
If you select a VMware host, the VMware % Capacity Used view shows the percentage of virtual processors' CPU
capacity used by the VMware host and the percentage of physical processor CPU used by the VMware host. This lets
consumers know how much spare capacity they have on the host.
Metric Description
% Physical Used Displays the percentage of physical processor used by the selected VMware host and normalized to 100%.
Units: Percent
Default graph: Stacked Bar
% Virtual Used
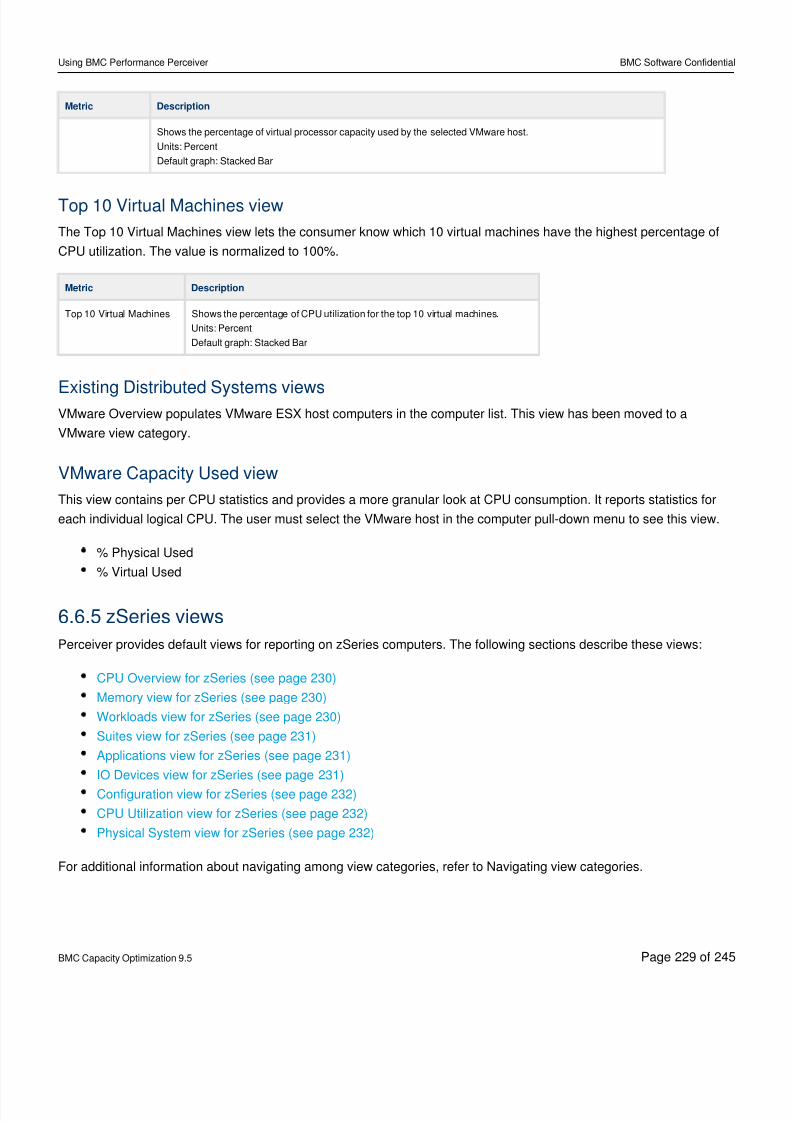
8/21/2019 Using BMC Performance Perceiver-V5-20141128_0503
http://slidepdf.com/reader/full/using-bmc-performance-perceiver-v5-201411280503 229/245
Using BMC Performance Perceiver BMC Software Confidential
BMC Capacity Optimization 9.5 Page of229 245
Metric Description
Shows the percentage of virtual processor capacity used by the selected VMware host.
Units: Percent
Default graph: Stacked Bar
Top 10 Virtual Machines view
The Top 10 Virtual Machines view lets the consumer know which 10 virtual machines have the highest percentage of
CPU utilization. The value is normalized to 100%.
Metric Description
Top 10 Virtual Machines Shows the percentage of CPU utilization for the top 10 virtual machines.
Units: Percent
Default graph: Stacked Bar
Existing Distributed Systems viewsVMware Overview populates VMware ESX host computers in the computer list. This view has been moved to a
VMware view category.
VMware Capacity Used view
This view contains per CPU statistics and provides a more granular look at CPU consumption. It reports statistics for
each individual logical CPU. The user must select the VMware host in the computer pull-down menu to see this view.
% Physical Used
% Virtual Used
6.6.5 zSeries views
Perceiver provides default views for reporting on zSeries computers. The following sections describe these views:
CPU Overview for zSeries (see page 230)
Memory view for zSeries (see page 230)
Workloads view for zSeries (see page 230)
Suites view for zSeries (see page 231)
Applications view for zSeries (see page 231)
IO Devices view for zSeries (see page 231)
Configuration view for zSeries (see page 232)
CPU Utilization view for zSeries (see page 232)
Physical System view for zSeries (see page 232)
For additional information about navigating among view categories, refer to Navigating view categories.
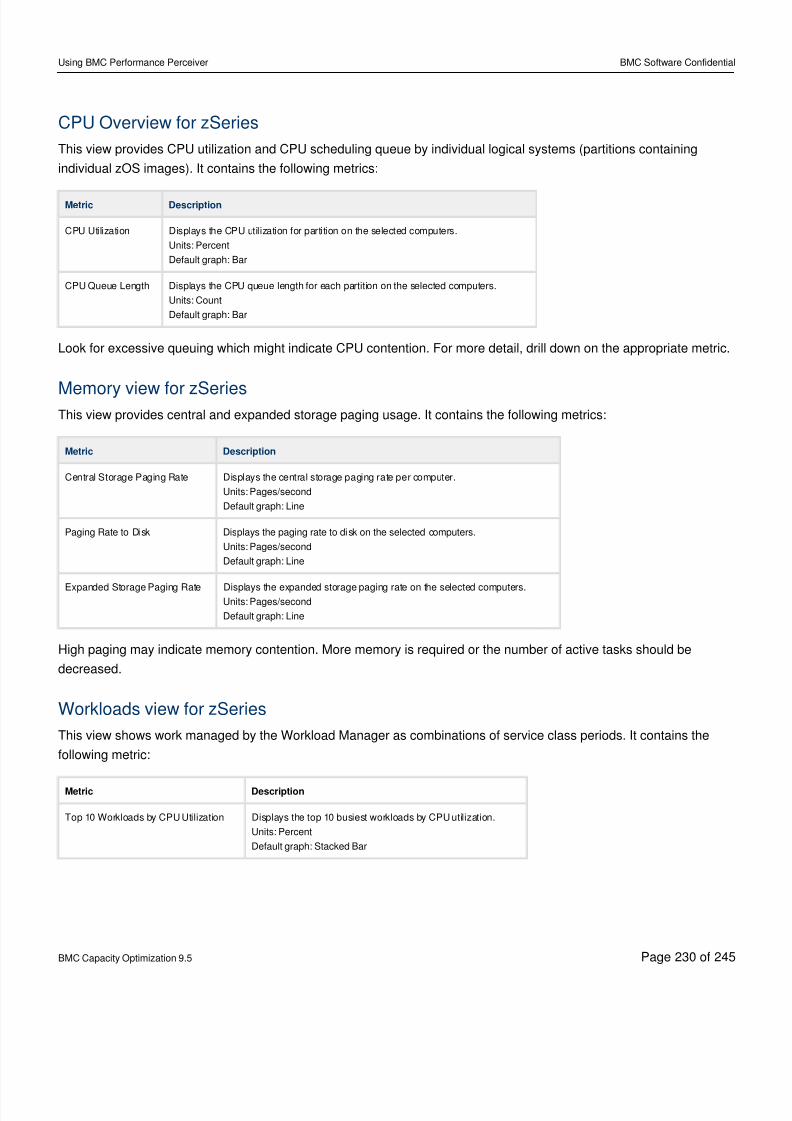
8/21/2019 Using BMC Performance Perceiver-V5-20141128_0503
http://slidepdf.com/reader/full/using-bmc-performance-perceiver-v5-201411280503 230/245
Using BMC Performance Perceiver BMC Software Confidential
BMC Capacity Optimization 9.5 Page of230 245
CPU Overview for zSeries
This view provides CPU utilization and CPU scheduling queue by individual logical systems (partitions containing
individual zOS images). It contains the following metrics:
Metric Description
CPU Utilization Displays the CPU utilization for partition on the selected computers.
Units: Percent
Default graph: Bar
CPU Queue Length Displays the CPU queue length for each partition on the selected computers.
Units: Count
Default graph: Bar
Look for excessive queuing which might indicate CPU contention. For more detail, drill down on the appropriate metric.
Memory view for zSeriesThis view provides central and expanded storage paging usage. It contains the following metrics:
Metric Description
Central Storage Paging Rate Displays the central storage paging rate per computer.
Units: Pages/second
Default graph: Line
Paging Rate to Disk Displays the paging rate to disk on the selected computers.
Units: Pages/second
Default graph: Line
Expanded Storage Paging Rate Displays the expanded storage paging rate on the selected computers.Units: Pages/second
Default graph: Line
High paging may indicate memory contention. More memory is required or the number of active tasks should be
decreased.
Workloads view for zSeries
This view shows work managed by the Workload Manager as combinations of service class periods. It contains the
following metric:
Metric Description
Top 10 Workloads by CPU Utilization Displays the top 10 busiest workloads by CPU utilization.
Units: Percent
Default graph: Stacked Bar
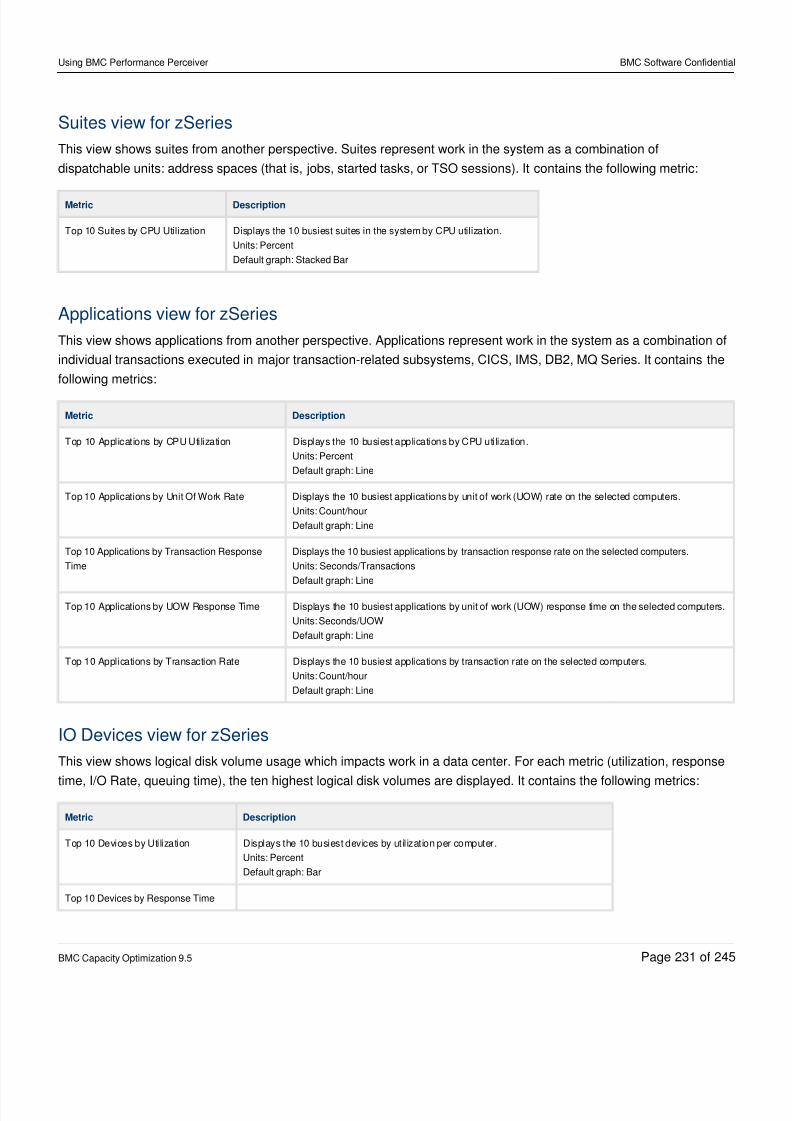
8/21/2019 Using BMC Performance Perceiver-V5-20141128_0503
http://slidepdf.com/reader/full/using-bmc-performance-perceiver-v5-201411280503 231/245
Using BMC Performance Perceiver BMC Software Confidential
BMC Capacity Optimization 9.5 Page of231 245
Suites view for zSeries
This view shows suites from another perspective. Suites represent work in the system as a combination of
dispatchable units: address spaces (that is, jobs, started tasks, or TSO sessions). It contains the following metric:
Metric Description
Top 10 Suites by CPU Utilization Displays the 10 busiest suites in the system by CPU utilization.
Units: Percent
Default graph: Stacked Bar
Applications view for zSeries
This view shows applications from another perspective. Applications represent work in the system as a combination of
individual transactions executed in major transaction-related subsystems, CICS, IMS, DB2, MQ Series. It contains the
following metrics:
Metric Description
Top 10 Applications by CPU Utilization Displays the 10 busiest applications by CPU utilization.
Units: Percent
Default graph: Line
Top 10 Applications by Unit Of Work Rate Displays the 10 busiest applications by unit of work (UOW) rate on the selected computers.
Units: Count/hour
Default graph: Line
Top 10 Applications by Transaction Response
Time
Displays the 10 busiest applications by transaction response rate on the selected computers.
Units: Seconds/Transactions
Default graph: Line
Top 10 Applications by UOW Response Time Displays the 10 busiest applications by unit of work (UOW) response time on the selected computers.
Units: Seconds/UOW
Default graph: Line
Top 10 Applications by Transaction Rate Displays the 10 busiest applications by transaction rate on the selected computers.
Units: Count/hour
Default graph: Line
IO Devices view for zSeries
This view shows logical disk volume usage which impacts work in a data center. For each metric (utilization, response
time, I/O Rate, queuing time), the ten highest logical disk volumes are displayed. It contains the following metrics:
Metric Description
Top 10 Devices by Utilization Displays the 10 busiest devices by utilization per computer.
Units: Percent
Default graph: Bar
Top 10 Devices by Response Time
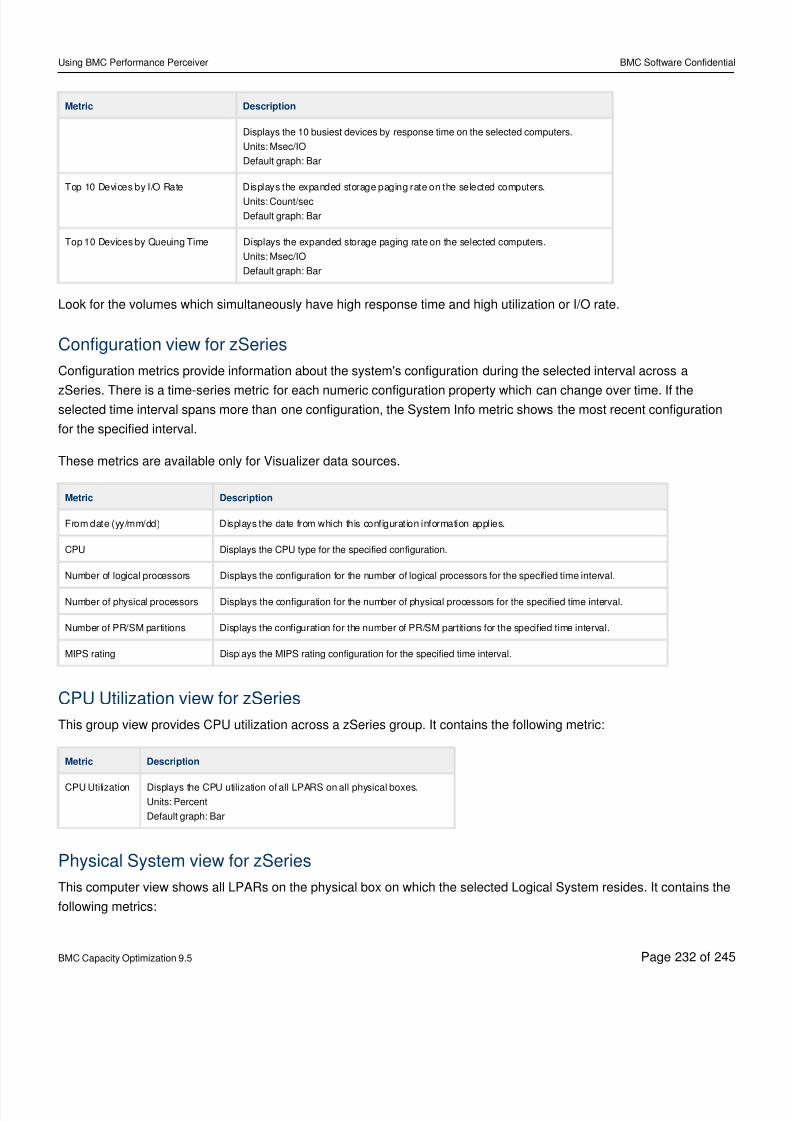
8/21/2019 Using BMC Performance Perceiver-V5-20141128_0503
http://slidepdf.com/reader/full/using-bmc-performance-perceiver-v5-201411280503 232/245
Using BMC Performance Perceiver BMC Software Confidential
BMC Capacity Optimization 9.5 Page of232 245
Metric Description
Displays the 10 busiest devices by response time on the selected computers.
Units: Msec/IO
Default graph: Bar
Top 10 Devices by I/O Rate Displays the expanded storage paging rate on the selected computers.
Units: Count/sec
Default graph: Bar
Top 10 Devices by Queuing Time Displays the expanded storage paging rate on the selected computers.
Units: Msec/IO
Default graph: Bar
Look for the volumes which simultaneously have high response time and high utilization or I/O rate.
Configuration view for zSeries
Configuration metrics provide information about the system's configuration during the selected interval across a
zSeries. There is a time-series metric for each numeric configuration property which can change over time. If theselected time interval spans more than one configuration, the System Info metric shows the most recent configuration
for the specified interval.
These metrics are available only for Visualizer data sources.
Metric Description
From date (yy/mm/dd) Displays the date from which this configuration information applies.
CPU Displays the CPU type for the specified configuration.
Number of logical processors Displays the configuration for the number of logical processors for the specified time interval.
Number of physical processors Displays the configuration for the number of physical processors for the specified time interval.
Number of PR/SM partitions Displays the configuration for the number of PR/SM partitions for the specified time interval.
MIPS rating Displays the MIPS rating configuration for the specified time interval.
CPU Utilization view for zSeries
This group view provides CPU utilization across a zSeries group. It contains the following metric:
Metric Description
CPU Utilization Displays the CPU utilization of all LPARS on all physical boxes.
Units: Percent
Default graph: Bar
Physical System view for zSeries
This computer view shows all LPARs on the physical box on which the selected Logical System resides. It contains the
following metrics:
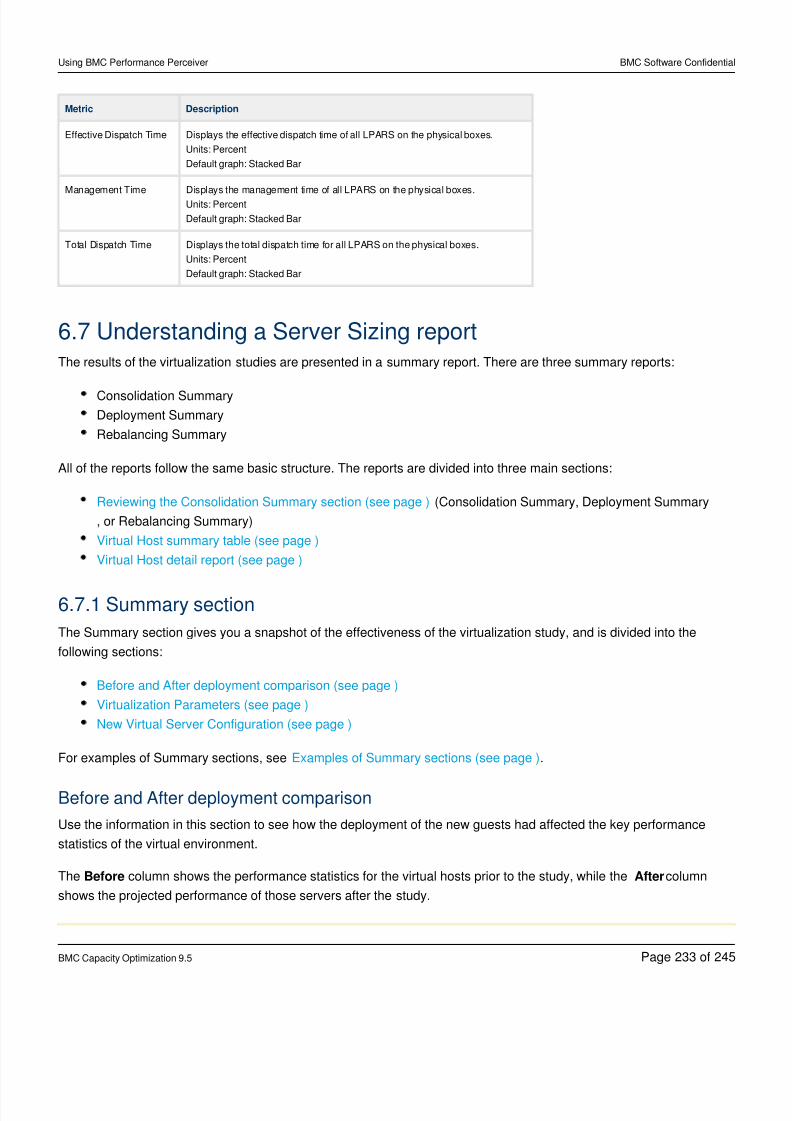
8/21/2019 Using BMC Performance Perceiver-V5-20141128_0503
http://slidepdf.com/reader/full/using-bmc-performance-perceiver-v5-201411280503 233/245
Using BMC Performance Perceiver BMC Software Confidential
BMC Capacity Optimization 9.5 Page of233 245
Metric Description
Effective Dispatch Time Displays the effective dispatch time of all LPARS on the physical boxes.
Units: Percent
Default graph: Stacked Bar
Management Time Displays the management time of all LPARS on the physical boxes.
Units: Percent
Default graph: Stacked Bar
Total Dispatch Time Displays the total dispatch time for all LPARS on the physical boxes.
Units: Percent
Default graph: Stacked Bar
6.7 Understanding a Server Sizing reportThe results of the virtualization studies are presented in a summary report. There are three summary reports:
Consolidation Summary
Deployment Summary
Rebalancing Summary
All of the reports follow the same basic structure. The reports are divided into three main sections:
Reviewing the Consolidation Summary section (see page ) (Consolidation Summary, Deployment Summary
, or Rebalancing Summary)
Virtual Host summary table (see page )
Virtual Host detail report (see page )
6.7.1 Summary section
The Summary section gives you a snapshot of the effectiveness of the virtualization study, and is divided into the
following sections:
Before and After deployment comparison (see page )
Virtualization Parameters (see page )
New Virtual Server Configuration (see page )
For examples of Summary sections, see .Examples of Summary sections (see page )
Before and After deployment comparison
Use the information in this section to see how the deployment of the new guests had affected the key performance
statistics of the virtual environment.
The column shows the performance statistics for the virtual hosts prior to the study, while the columnBefore After
shows the projected performance of those servers after the study.
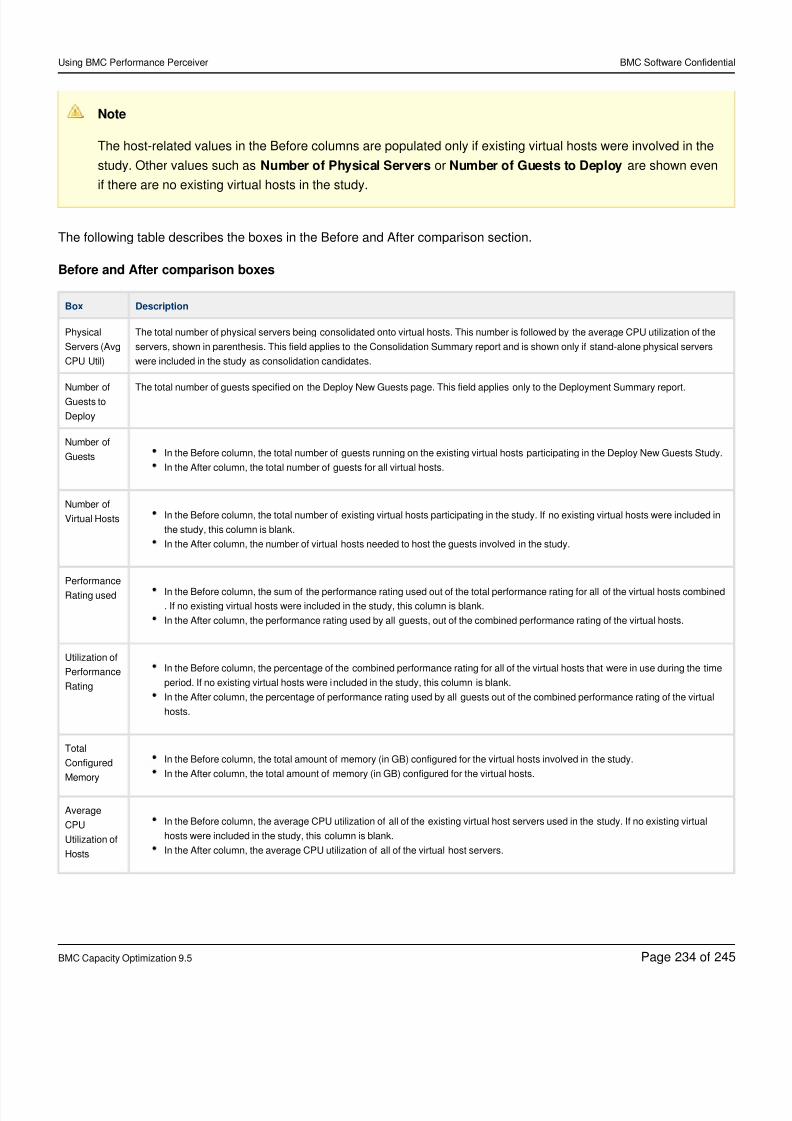
8/21/2019 Using BMC Performance Perceiver-V5-20141128_0503
http://slidepdf.com/reader/full/using-bmc-performance-perceiver-v5-201411280503 234/245
Using BMC Performance Perceiver BMC Software Confidential
BMC Capacity Optimization 9.5 Page of234 245
Note
The host-related values in the Before columns are populated only if existing virtual hosts were involved in the
study. Other values such as or are shown evenNumber of Physical Servers Number of Guests to Deploy
if there are no existing virtual hosts in the study.
The following table describes the boxes in the Before and After comparison section.
Before and After comparison boxes
Box Description
Physical
Servers (Avg
CPU Util)
The total number of physical servers being consolidated onto virtual hosts. This number is followed by the average CPU utilization of the
servers, shown in parenthesis. This field applies to the Consolidation Summary report and is shown only if stand-alone physical servers
were included in the study as consolidation candidates.
Number of
Guests to
Deploy
The total number of guests specified on the Deploy New Guests page. This field applies only to the Deployment Summary report.
Number of
Guests In the Before column, the total number of guests running on the existing virtual hosts participating in the Deploy New Guests Study.
In the After column, the total number of guests for all virtual hosts.
Number of
Virtual Hosts In the Before column, the total number of existing virtual hosts participating in the study. If no existing virtual hosts were included in
the study, this column is blank.
In the After column, the number of virtual hosts needed to host the guests involved in the study.
Performance
Rating used In the Before column, the sum of the performance rating used out of the total performance rating for all of the virtual hosts combined
. If no existing virtual hosts were included in the study, this column is blank.
In the After column, the performance rating used by all guests, out of the combined performance rating of the virtual hosts.
Utilization of
Performance
Rating
In the Before column, the percentage of the combined performance rating for all of the virtual hosts that were in use during the time
period. If no existing virtual hosts were included in the study, this column is blank.
In the After column, the percentage of performance rating used by all guests out of the combined performance rating of the virtual
hosts.
Total
Configured
Memory
In the Before column, the total amount of memory (in GB) configured for the virtual hosts involved in the study.
In the After column, the total amount of memory (in GB) configured for the virtual hosts.
Average
CPU
Utilization of
Hosts
In the Before column, the average CPU utilization of all of the existing virtual host servers used in the study. If no existing virtual
hosts were included in the study, this column is blank.
In the After column, the average CPU utilization of all of the virtual host servers.
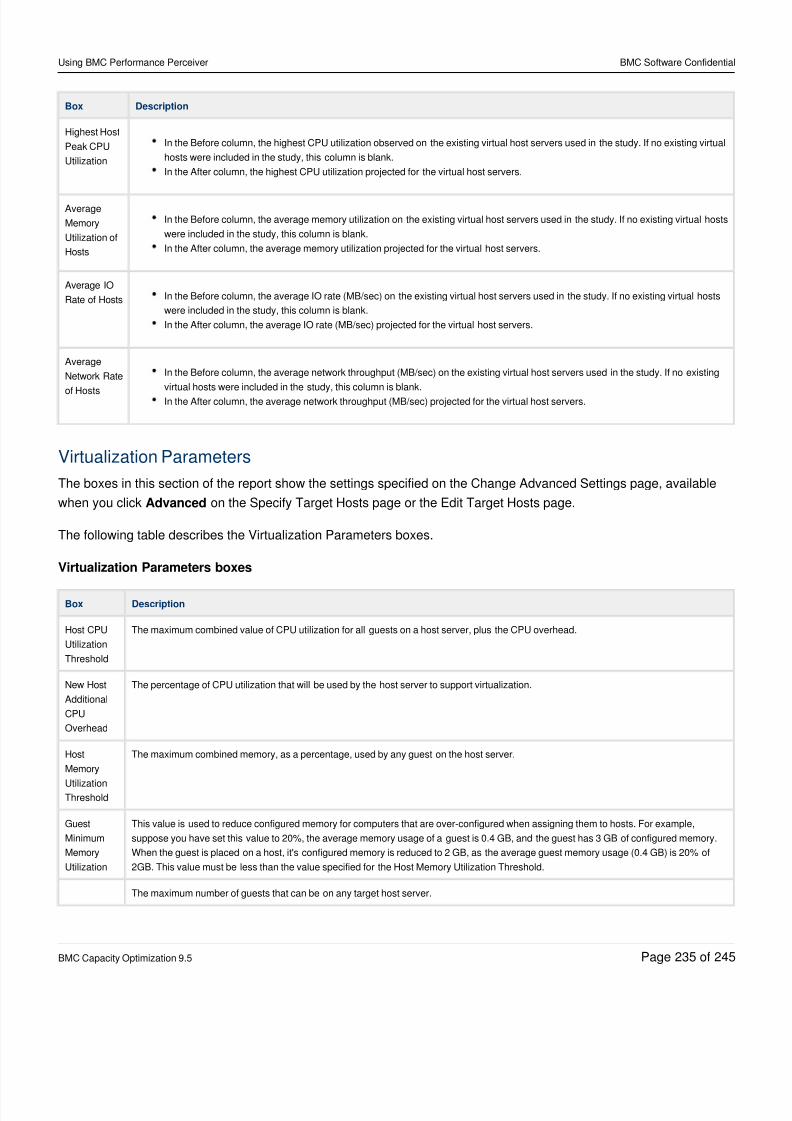
8/21/2019 Using BMC Performance Perceiver-V5-20141128_0503
http://slidepdf.com/reader/full/using-bmc-performance-perceiver-v5-201411280503 235/245
Using BMC Performance Perceiver BMC Software Confidential
BMC Capacity Optimization 9.5 Page of235 245
Box Description
Highest Host
Peak CPU
Utilization
In the Before column, the highest CPU utilization observed on the existing virtual host servers used in the study. If no existing virtual
hosts were included in the study, this column is blank.
In the After column, the highest CPU utilization projected for the virtual host servers.
Average
Memory
Utilization of
Hosts
In the Before column, the average memory utilization on the existing virtual host servers used in the study. If no existing virtual hosts
were included in the study, this column is blank.
In the After column, the average memory utilization projected for the virtual host servers.
Average IO
Rate of Hosts In the Before column, the average IO rate (MB/sec) on the existing virtual host servers used in the study. If no existing virtual hosts
were included in the study, this column is blank.
In the After column, the average IO rate (MB/sec) projected for the virtual host servers.
Average
Network Rate
of Hosts
In the Before column, the average network throughput (MB/sec) on the existing virtual host servers used in the study. If no existing
virtual hosts were included in the study, this column is blank.
In the After column, the average network throughput (MB/sec) projected for the virtual host servers.
Virtualization Parameters
The boxes in this section of the report show the settings specified on the Change Advanced Settings page, available
when you click on the Specify Target Hosts page or the Edit Target Hosts page.Advanced
The following table describes the Virtualization Parameters boxes.
Virtualization Parameters boxes
Box Description
Host CPU
Utilization
Threshold
The maximum combined value of CPU utilization for all guests on a host server, plus the CPU overhead.
New Host
Additional
CPU
Overhead
The percentage of CPU utilization that will be used by the host server to support virtualization.
Host
Memory
UtilizationThreshold
The maximum combined memory, as a percentage, used by any guest on the host server.
Guest
Minimum
Memory
Utilization
This value is used to reduce configured memory for computers that are over-configured when assigning them to hosts. For example,
suppose you have set this value to 20%, the average memory usage of a guest is 0.4 GB, and the guest has 3 GB of configured memory.
When the guest is placed on a host, it's configured memory is reduced to 2 GB, as the average guest memory usage (0.4 GB) is 20% of
2GB. This value must be less than the value specified for the Host Memory Utilization Threshold.
The maximum number of guests that can be on any target host server.
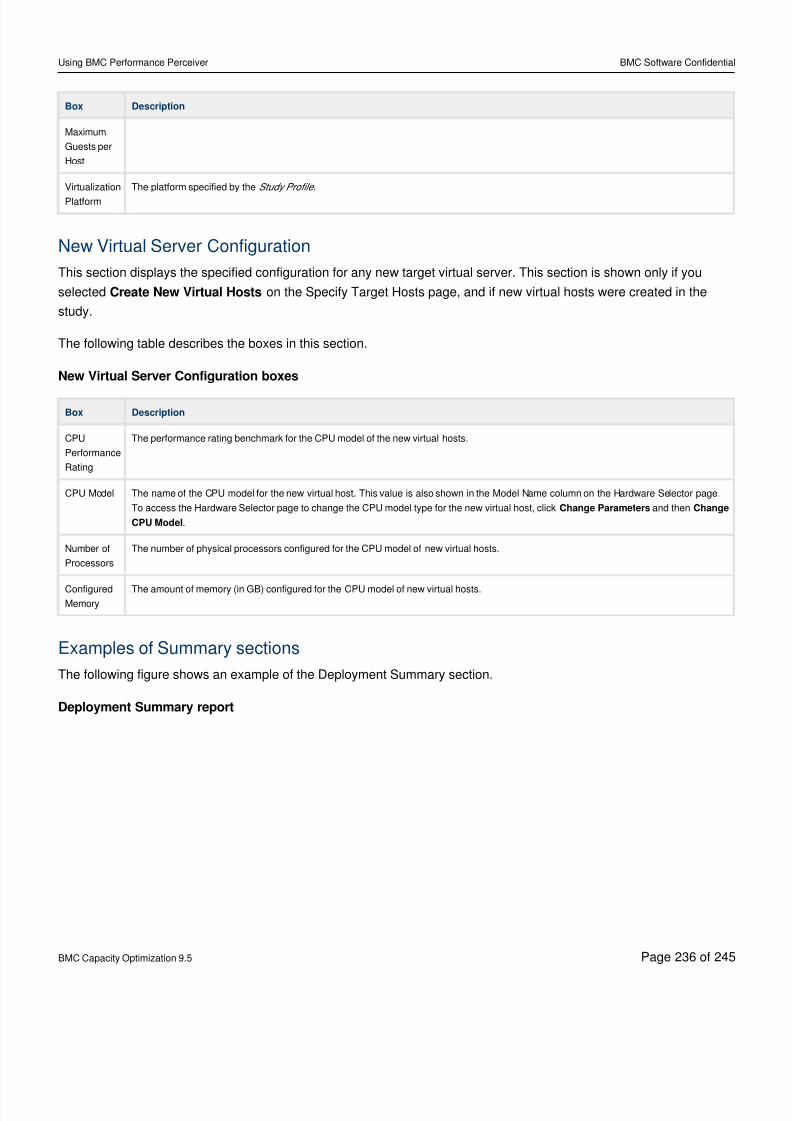
8/21/2019 Using BMC Performance Perceiver-V5-20141128_0503
http://slidepdf.com/reader/full/using-bmc-performance-perceiver-v5-201411280503 236/245
Using BMC Performance Perceiver BMC Software Confidential
BMC Capacity Optimization 9.5 Page of236 245
Box Description
Maximum
Guests per
Host
Virtualization
Platform
The platform specified by the .Study Profile
New Virtual Server Configuration
This section displays the specified configuration for any new target virtual server. This section is shown only if you
selected on the Specify Target Hosts page, and if new virtual hosts were created in theCreate New Virtual Hosts
study.
The following table describes the boxes in this section.
New Virtual Server Configuration boxes
Box Description
CPU
Performance
Rating
The performance rating benchmark for the CPU model of the new virtual hosts.
CPU Model The name of the CPU model for the new virtual host. This value is also shown in the Model Name column on the Hardware Selector page.
To access the Hardware Selector page to change the CPU model type for the new virtual host, click and thenChange Parameters Change
.CPU Model
Number of
Processors
The number of physical processors configured for the CPU model of new virtual hosts.
ConfiguredMemory
The amount of memory (in GB) configured for the CPU model of new virtual hosts.
Examples of Summary sections
The following figure shows an example of the Deployment Summary section.
Deployment Summary report
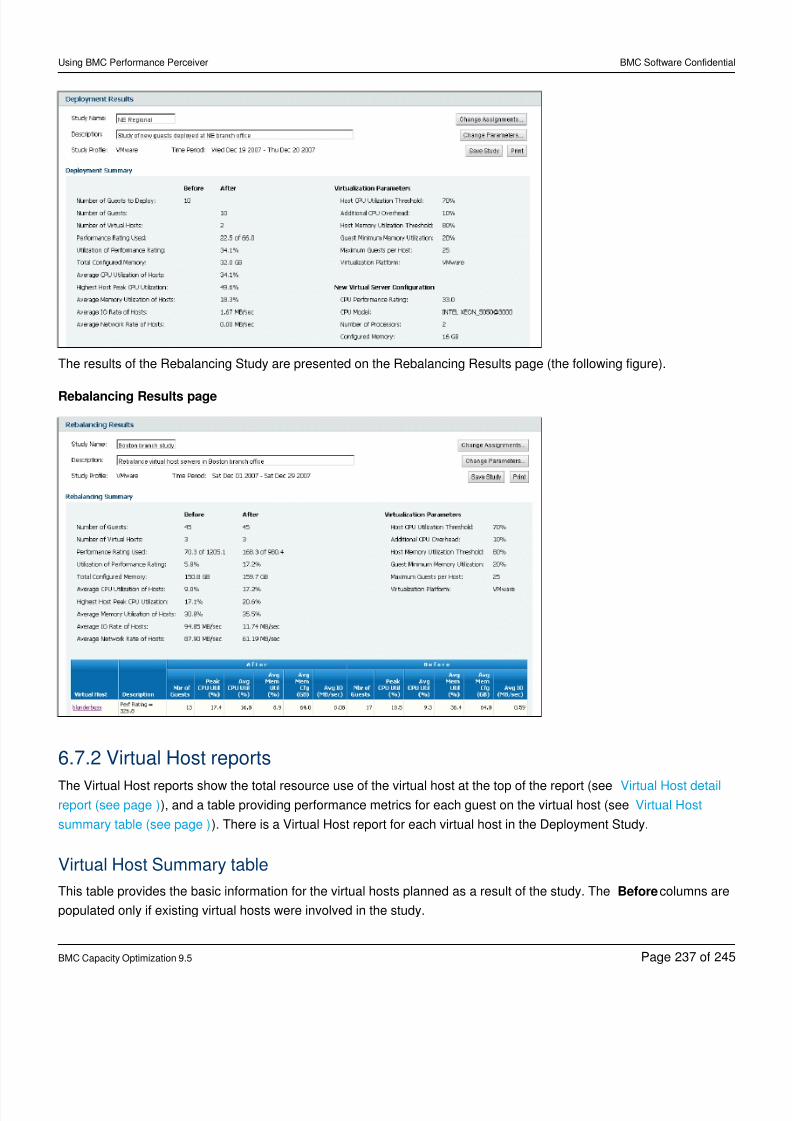
8/21/2019 Using BMC Performance Perceiver-V5-20141128_0503
http://slidepdf.com/reader/full/using-bmc-performance-perceiver-v5-201411280503 237/245
Using BMC Performance Perceiver BMC Software Confidential
BMC Capacity Optimization 9.5 Page of237 245
The results of the Rebalancing Study are presented on the Rebalancing Results page (the following figure).
Rebalancing Results page
6.7.2 Virtual Host reports
The Virtual Host reports show the total resource use of the virtual host at the top of the report (see Virtual Host detail), and a table providing performance metrics for each guest on the virtual host (seereport (see page ) Virtual Host
). There is a Virtual Host report for each virtual host in the Deployment Study.summary table (see page )
Virtual Host Summary table
This table provides the basic information for the virtual hosts planned as a result of the study. The columns areBefore
populated only if existing virtual hosts were involved in the study.
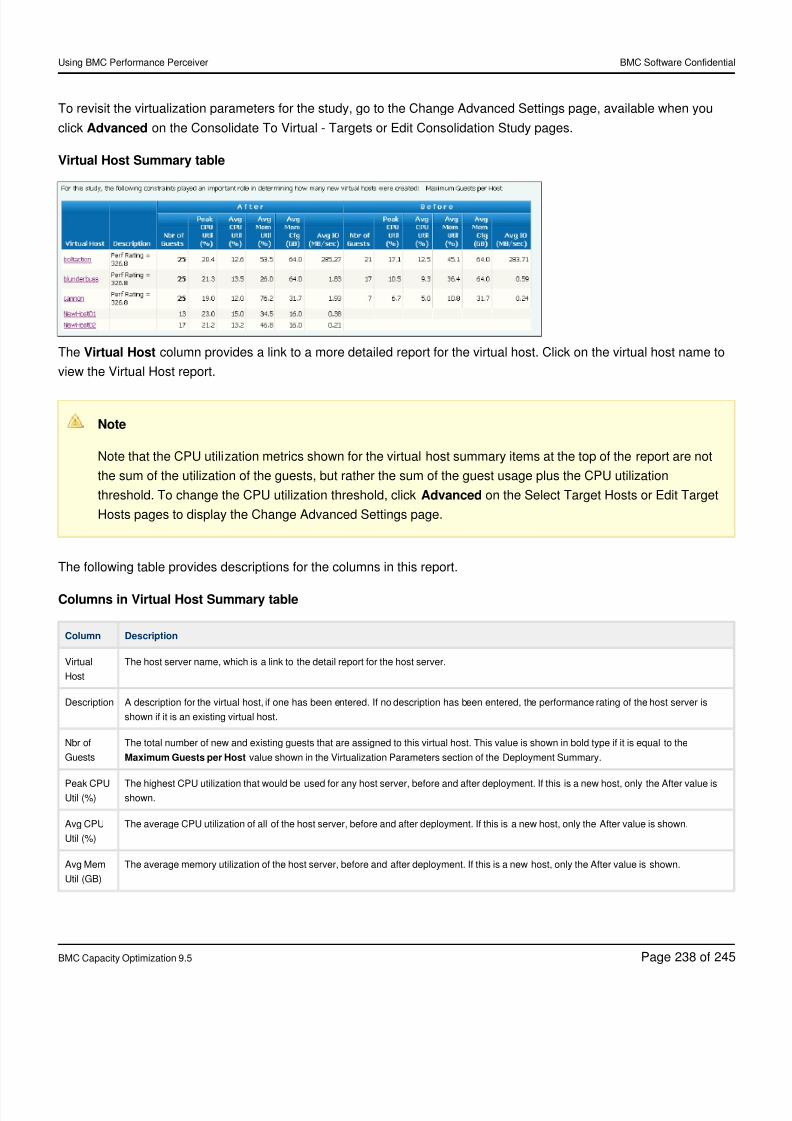
8/21/2019 Using BMC Performance Perceiver-V5-20141128_0503
http://slidepdf.com/reader/full/using-bmc-performance-perceiver-v5-201411280503 238/245
Using BMC Performance Perceiver BMC Software Confidential
BMC Capacity Optimization 9.5 Page of238 245
To revisit the virtualization parameters for the study, go to the Change Advanced Settings page, available when you
click on the Consolidate To Virtual - Targets or Edit Consolidation Study pages.Advanced
Virtual Host Summary table
The column provides a link to a more detailed report for the virtual host. Click on the virtual host name toVirtual Host
view the Virtual Host report.
Note
Note that the CPU utilization metrics shown for the virtual host summary items at the top of the report are not
the sum of the utilization of the guests, but rather the sum of the guest usage plus the CPU utilization
threshold. To change the CPU utilization threshold, click on the Select Target Hosts or Edit TargetAdvanced
Hosts pages to display the Change Advanced Settings page.
The following table provides descriptions for the columns in this report.
Columns in Virtual Host Summary table
Column Description
Virtual
Host
The host server name, which is a link to the detail report for the host server.
Description A description for the virtual host, if one has been entered. If no description has been entered, the performance rating of the host server is
shown if it is an existing virtual host.
Nbr of
Guests
The total number of new and existing guests that are assigned to this virtual host. This value is shown in bold type if it is equal to the
value shown in the Virtualization Parameters section of the Deployment Summary.Maximum Guests per Host
Peak CPUUtil (%)
The highest CPU utilization that would be used for any host server, before and after deployment. If this is a new host, only the After value isshown.
Avg CPU
Util (%)
The average CPU utilization of all of the host server, before and after deployment. If this is a new host, only the After value is shown.
Avg Mem
Util (GB)
The average memory utilization of the host server, before and after deployment. If this is a new host, only the After value is shown.
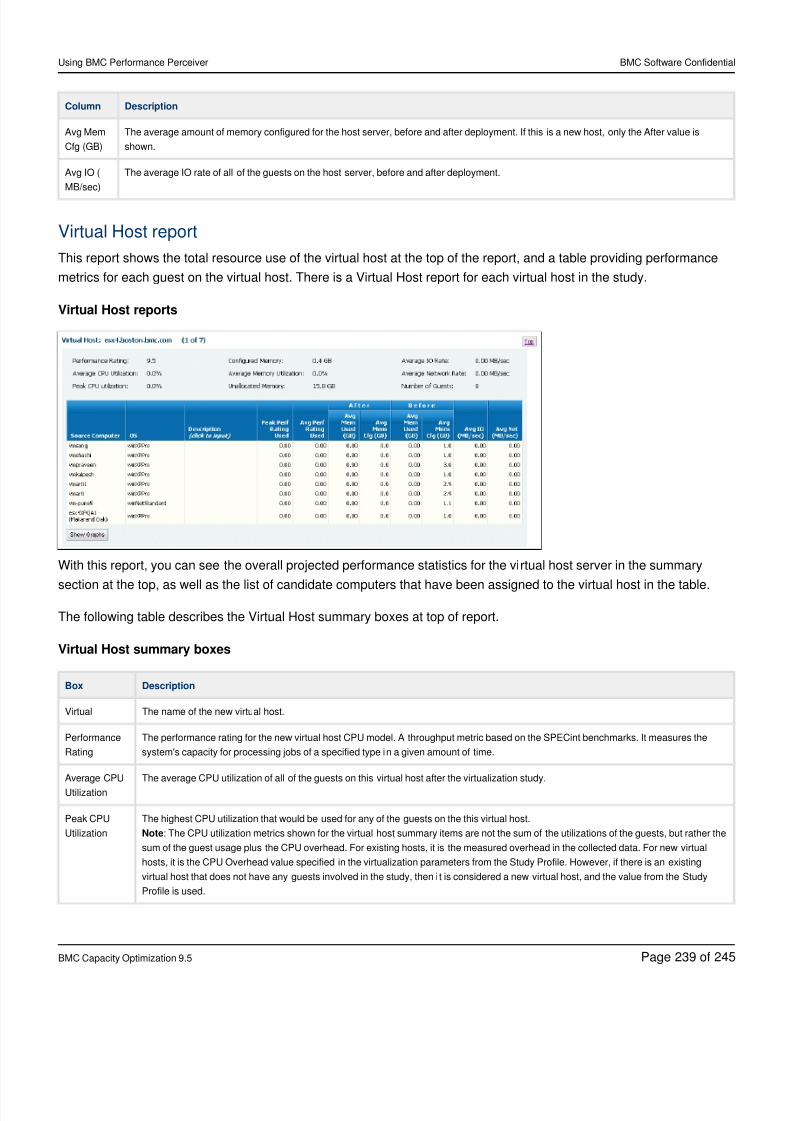
8/21/2019 Using BMC Performance Perceiver-V5-20141128_0503
http://slidepdf.com/reader/full/using-bmc-performance-perceiver-v5-201411280503 239/245
Using BMC Performance Perceiver BMC Software Confidential
BMC Capacity Optimization 9.5 Page of239 245
Column Description
Avg Mem
Cfg (GB)
The average amount of memory configured for the host server, before and after deployment. If this is a new host, only the After value is
shown.
Avg IO (
MB/sec)
The average IO rate of all of the guests on the host server, before and after deployment.
Virtual Host report
This report shows the total resource use of the virtual host at the top of the report, and a table providing performance
metrics for each guest on the virtual host. There is a Virtual Host report for each virtual host in the study.
Virtual Host reports
With this report, you can see the overall projected performance statistics for the virtual host server in the summary
section at the top, as well as the list of candidate computers that have been assigned to the virtual host in the table.
The following table describes the Virtual Host summary boxes at top of report.
Virtual Host summary boxes
Box Description
Virtual The name of the new virtual host.
Performance
Rating
The performance rating for the new virtual host CPU model. A throughput metric based on the SPECint benchmarks. It measures the
system's capacity for processing jobs of a specified type in a given amount of time.
Average CPU
Utilization
The average CPU utilization of all of the guests on this virtual host after the virtualization study.
Peak CPU
Utilization
The highest CPU utilization that would be used for any of the guests on the this virtual host.
: The CPU utilization metrics shown for the virtual host summary items are not the sum of the utilizations of the guests, but rather theNote
sum of the guest usage plus the CPU overhead. For existing hosts, it is the measured overhead in the collected data. For new virtual
hosts, it is the CPU Overhead value specified in the virtualization parameters from the Study Profile. However, if there is an existing
virtual host that does not have any guests involved in the study, then i t is considered a new virtual host, and the value from the Study
Profile is used.
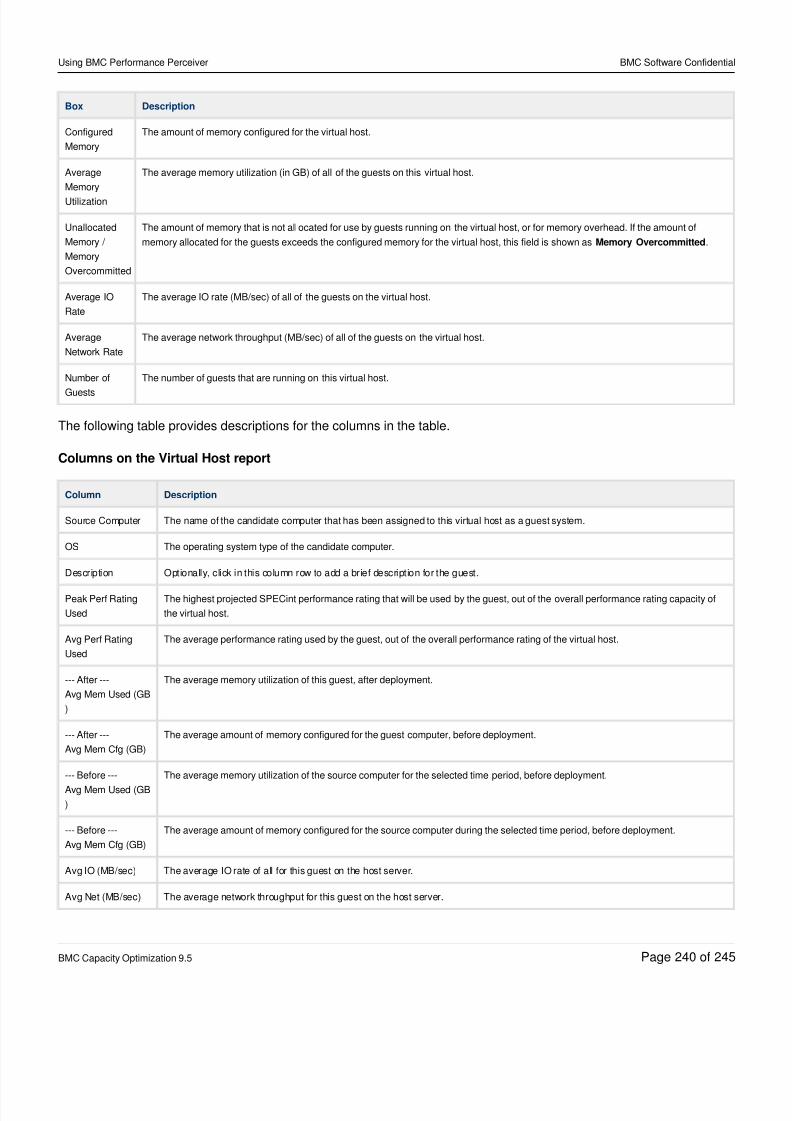
8/21/2019 Using BMC Performance Perceiver-V5-20141128_0503
http://slidepdf.com/reader/full/using-bmc-performance-perceiver-v5-201411280503 240/245
Using BMC Performance Perceiver BMC Software Confidential
BMC Capacity Optimization 9.5 Page of240 245
Box Description
Configured
Memory
The amount of memory configured for the virtual host.
Average
Memory
Utilization
The average memory utilization (in GB) of all of the guests on this virtual host.
Unallocated
Memory /
Memory
Overcommitted
The amount of memory that is not allocated for use by guests running on the virtual host, or for memory overhead. If the amount of
memory allocated for the guests exceeds the configured memory for the virtual host, this field is shown as .Memory Overcommitted
Average IO
Rate
The average IO rate (MB/sec) of all of the guests on the virtual host.
Average
Network Rate
The average network throughput (MB/sec) of all of the guests on the virtual host.
Number of
Guests
The number of guests that are running on this virtual host.
The following table provides descriptions for the columns in the table.
Columns on the Virtual Host report
Column Description
Source Computer The name of the candidate computer that has been assigned to this virtual host as a guest system.
OS The operating system type of the candidate computer.
Description Optionally, click in this column row to add a brief description for the guest.
Peak Perf Rating
Used
The highest projected SPECint performance rating that will be used by the guest, out of the overall performance rating capacity of
the virtual host.
Avg Perf Rating
Used
The average performance rating used by the guest, out of the overall performance rating of the virtual host.
--- After ---
Avg Mem Used (GB
)
The average memory utilization of this guest, after deployment.
--- After ---
Avg Mem Cfg (GB)
The average amount of memory configured for the guest computer, before deployment.
--- Before ---
Avg Mem Used (GB
)
The average memory utilization of the source computer for the selected time period, before deployment.
--- Before ---
Avg Mem Cfg (GB)
The average amount of memory configured for the source computer during the selected time period, before deployment.
Avg IO (MB/sec) The average IO rate of all for this guest on the host server.
Avg Net (MB/sec) The average network throughput for this guest on the host server.
8/21/2019 Using BMC Performance Perceiver-V5-20141128_0503
http://slidepdf.com/reader/full/using-bmc-performance-perceiver-v5-201411280503 241/245
Using BMC Performance Perceiver BMC Software Confidential
BMC Capacity Optimization 9.5 Page of241 245
Click to review charts of the key performance metrics for the virtual host, as shown in the followingShow Graphs
figure.
Performance charts for virtual hosts
8/21/2019 Using BMC Performance Perceiver-V5-20141128_0503
http://slidepdf.com/reader/full/using-bmc-performance-perceiver-v5-201411280503 242/245
Using BMC Performance Perceiver BMC Software Confidential
BMC Capacity Optimization 9.5 Page of242 245
Index
BBmc Atrium Cmdb , , , ,190 191 192 192 193
Bmc Performance Perceiver , , , , , , , , , , , , , , , , ,6 7 7 8 9 9 10 11 12 14 16 18 19 20 22 22 22 23
, , , , , , , , , , , , , , , , , , , , , , , ,23 24 24 25 25 28 28 29 30 31 33 35 36 36 38 39 39 39 40 41 43 43 44
, , , , , , , , , , , , , , , , , , , , , , ,47 48 48 49 50 51 52 52 53 54 55 55 56 57 57 57 58 59 60 84 86 86 87
, , , , , , , , , , , , , , , , , , , , , , ,89 91 92 93 95 97 98 101 101 103 104 104 105 105 108 109 109 111 112 113 114 115 116
, , , , , , , , , , , , , , , , , , , , , , ,118 128 128 131 132 132 133 135 138 139 140 142 144 145 146 148 150 150 153 154 155 155 158
, , , , , , , , , , , , , , , , , , , , , , ,159 161 161 162 164 168 172 178 182 184 185 190 190 191 192 192 193 193 194 199 199 201 203
, , , , , , , , , , , , , , , , , , , , , , ,206 206 208 208 209 209 209 211 212 214 214 214 215 215 216 217 217 218 218 219 219 220 220, , , , , , , , , , , , , , , , , , , , , , ,220 221 221 222 223 223 224 224 225 225 226 226 227 227 227 228 228 229 229 229 229 230 230
, , , , , , , , , , , , , , ,230 231 231 231 232 232 232 233 233 233 235 236 236 237 237 239
CCharts 209
Consolidating Servers , , , , , , , , , , , , , , ,22 28 28 29 30 31 33 35 36 36 38 39 39 39 40 41
Custom , , , , , , ,193 194 199 199 201 203 206 206
DDeploying New Guests , ,43 44 47
EEnvironment 9
HHp Ivm ,97 178
Hp Ux , , ,97 178 220 220
Hyper V ,92 164
8/21/2019 Using BMC Performance Perceiver-V5-20141128_0503
http://slidepdf.com/reader/full/using-bmc-performance-perceiver-v5-201411280503 243/245
Using BMC Performance Perceiver BMC Software Confidential
BMC Capacity Optimization 9.5 Page of243 245
IInterface ,7 7
KKvm , , , , , , , , , , ,91 145 146 148 150 150 153 154 155 155 158 159
MMetrics , , , , , , , , , , , , , , , , , , , , , ,105 105 108 109 109 111 112 113 114 115 116 118 128 128 131 132 132 133 135 138 139 140
, , , , , , , , , , , , , , , , , , , , , , ,142 144 145 146 148 150 150 153 154 155 155 158 159 161 161 162 164 168 172 178 182 184 185
, , , , , , , , , , , , , , , , , , , , , , ,190 190 191 192 192 193 208 209 209 211 212 214 214 214 215 215 216 217 217 218 218 219 219
, , , , , , , , , , , , , , , , , , , , , , ,220 220 220 221 221 222 223 224 225 225 226 226 227 227 227 228 228 229 229 229 230 230 230
, , , , ,231 231 231 232 232 232
Microsoft Virtual Server , , ,101 184 223 223
OOptions , , , , , , , , , ,53 54 55 55 56 57 57 57 58 59 60
PPerceiver 84
Power Vm , , , , , , , ,93 168 217 217 218 218 219 219 220
Predefined , , , , , , , , , , , , ,86 86 87 89 91 92 93 95 97 98 101 101 103 104
RRebalancing Guests 23
Rebalancing Hosts , ,48 48 49
Reports , , , , , , , , , ,43 84 233 233 233 235 236 236 237 237 239
SSaved Studies 50
Solaris , , , ,95 172 221 221 222
Starting 10
Study Profiles , ,51 52 52
8/21/2019 Using BMC Performance Perceiver-V5-20141128_0503
http://slidepdf.com/reader/full/using-bmc-performance-perceiver-v5-201411280503 244/245
Using BMC Performance Perceiver BMC Software Confidential
BMC Capacity Optimization 9.5 Page of244 245
UUnix 216
Using , , , , , , , , , , , , , , , , , , , , , ,6 7 7 8 9 9 10 11 12 14 16 18 19 20 22 22 22 23 23 24 24 25
, , , , , , , , , , , , , , , , , , , , , , ,25 28 28 29 30 31 33 35 36 36 38 39 39 39 40 41 43 43 44 47 48 48 49
, , , , , , , , , , , , , , , , , , , , , , ,50 51 52 52 53 54 55 55 56 57 57 57 58 59 60 84 86 86 87 89 91 92 93
, , , , , , , , , , , , , , , , , , , , , , ,95 97 98 101 101 103 104 104 105 105 108 109 109 111 112 113 114 115 116 118 128 128 131
, , , , , , , , , , , , , , , , , , , , , , ,132 132 133 135 138 139 140 142 144 145 146 148 150 150 153 154 155 155 158 159 161 161 162
, , , , , , , , , , , , , , , , , , , , , , ,164 168 172 178 182 184 185 190 190 191 192 192 193 193 194 199 199 201 203 206 206 208 208
, , , , , , , , , , , , , , , , , , , , , , ,209 209 209 211 212 214 214 214 215 215 216 217 217 218 218 219 219 220 220 220 221 221 222
, , , , , , , , , , , , , , , , , , , , , , ,223 223 224 224 225 225 226 226 227 227 227 228 228 229 229 229 230 230 230 231 231 231 232
, , , , , , , , , ,232 232 233 233 233 235 236 236 237 237 239
VViewing Results , , , , , , , , , , , , ,9 11 12 14 16 18 19 20 39 39 40 41 47 49
Views , , , , , , , , , , , , , , , , , , , , , ,84 86 86 87 89 91 92 93 95 97 98 101 101 103 104 104 105 105 108 109 109 111
, , , , , , , , , , , , , , , , , , , , , , ,112 113 114 115 116 118 128 128 131 132 132 133 135 138 139 140 142 144 145 146 148 150 150
, , , , , , , , , , , , , , , , , , , , , , ,153 154 155 155 158 159 161 161 162 164 168 172 178 182 184 185 190 190 191 192 192 193 193
, , , , , , , , , , , , , , , , , , , , , , ,194 199 199 201 203 206 206 208 217 218 218 219 219 220 220 221 222 223 224 224 225 225 226
, , , , , , , , , , , , , , , , , ,226 227 227 227 228 228 229 229 229 229 230 230 230 231 231 231 232 232 232
Virtualization Planning , , , , , , , , , , , , , , , , , , ,24 24 25 25 28 43 50 51 52 52 53 54 55 55 56 57 57 57 58
,59 60
Vmware , , , , , , , , , , , , , , , , , , , , ,89 128 128 131 132 132 133 135 138 139 140 142 144 161 161 162 227 227 228 228 229 229, 229
XXen ,98 182
ZZseries , , , , , , , , ,229 230 230 230 231 231 231 232 232 232
8/21/2019 Using BMC Performance Perceiver-V5-20141128_0503
http://slidepdf.com/reader/full/using-bmc-performance-perceiver-v5-201411280503 245/245
Using BMC Performance Perceiver BMC Software Confidential
© Copyright 2013-14 BMC Software, Inc.
BMC, BMC Software, and the BMC Software logo are the exclusive properties of BMC Software, Inc., are registered with the U.S. Patent and Trademark
Office, and may be registered or pending registration in other countries. All other BMC trademarks, service marks, and logos may be registered or pending
registration in the U.S. or in other countries. All other trademarks or registered trademarks are the property of their respective owners.
Linux is the registered trademark of Linus Torvalds.
Oracle and Java are registered trademarks of Oracle and/or its affiliates. Other names may be trademarks of their respective owners.
UNIX is the registered trademark of The Open Group in the US and other countries.


![[preprint] The Structure of Perceiver Effects...Abstract When judging others’ personalities, perceivers differ in their general judgment tendencies. These perceiver effects partly](https://img.pdfslide.net/doc/110x75/5f26d1ce06a3922f74531f04/preprint-the-structure-of-perceiver-effects-abstract-when-judging-othersa.jpg)