Embed Size (px)
Citation preview
NAIC Fall Meeting
November 4, 2011
Using Catastrophe Models and Other Tools to
Assess Hurricane Risk
Background
RMS V11 hurricane model was a wake-up call for the industry with respect to Over-reliance on the catastrophe models
Magnitude of the uncertainty underlying the models (if Florida can change by 200 percent, …)
Need for more transparent and robust information for catastrophe risk management
External stakeholders, such as rating agencies, have growing expectations with
respect to
Insurance company understanding of their catastrophe risk and ability to explain it
How companies evaluate the catastrophe models and determine which one(s) to use
Company “ownership” of their risk and their risk management strategies
Catastrophe losses increasing over time and now the largest driver of property
losses, particularly for residential lines of business
© 2011 Karen Clark & Company 2
Goals of the Presentation
Illustrate why the catastrophe models have so much inherent uncertainty and will
never be accurate or precise tools
Demonstrate how other important information and tools can be used to better
understand and manage the risk
Provide insights into how an insurance company can develop a risk
management framework that is Robust (providing consistent information from year to year)
Transparent (providing insight into the risk rather than a simple EP curve)
Operational
Efficient
Flexible
© 2011 Karen Clark & Company 3
Important Theme
“If you can’t explain it simply,
you don’t understand it well enough”
Albert Einstein
© 2011 Karen Clark & Company 4
© 2009 Karen Clark & Company
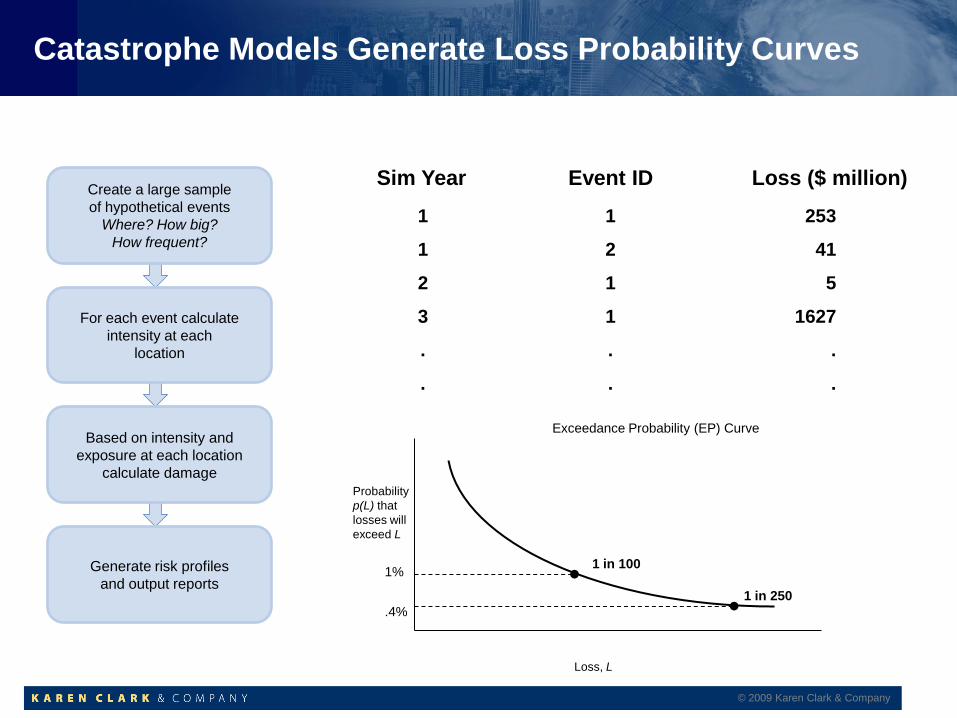
Catastrophe Models Generate Loss Probability Curves
Loss, L
Probability
p(L) that
losses will
exceed L
Exceedance Probability (EP) Curve
1 in 100
1 in 250 •
• .4%
1%
Sim Year
1
1
2
3
.
.
1
2
1
1
.
.
253
41
5
1627
.
.
Event ID Loss ($ million) Create a large sample
of hypothetical events
Where? How big?
How frequent?
For each event calculate
intensity at each
location
Based on intensity and
exposure at each location
calculate damage
Generate risk profiles
and output reports
© 2009 Karen Clark & Company
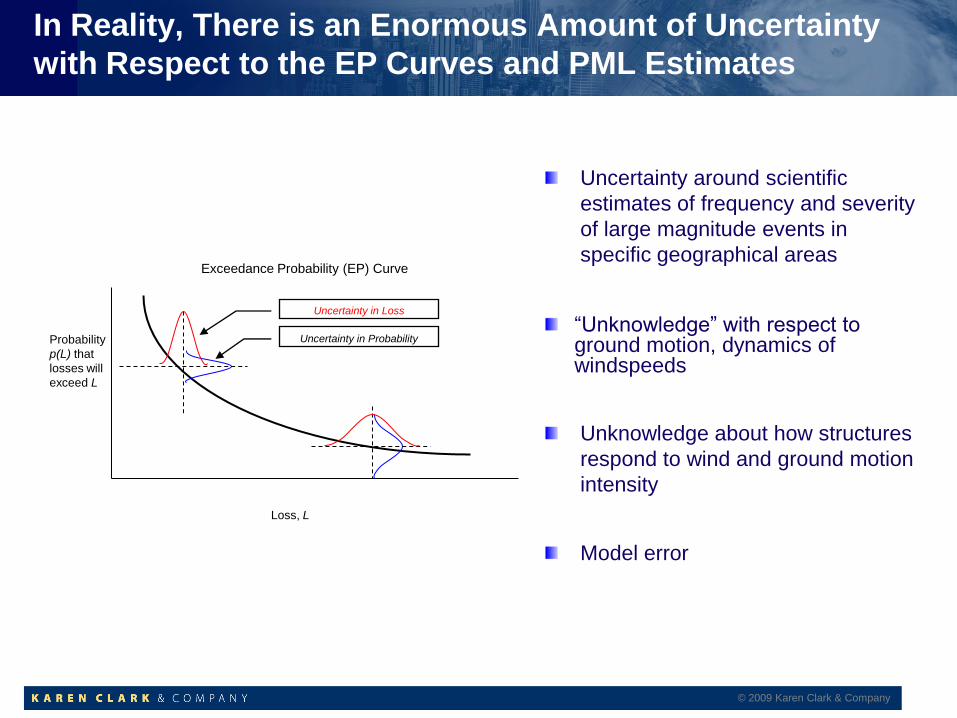
In Reality, There is an Enormous Amount of Uncertainty
with Respect to the EP Curves and PML Estimates
Loss, L
Probability
p(L) that
losses will
exceed L
Exceedance Probability (EP) Curve
Uncertainty in Loss
Uncertainty in Probability
Uncertainty around scientific
estimates of frequency and severity
of large magnitude events in
specific geographical areas
“Unknowledge” with respect to ground motion, dynamics of windspeeds
Unknowledge about how structures
respond to wind and ground motion
intensity
Model error
© 2011 Karen Clark & Company 7
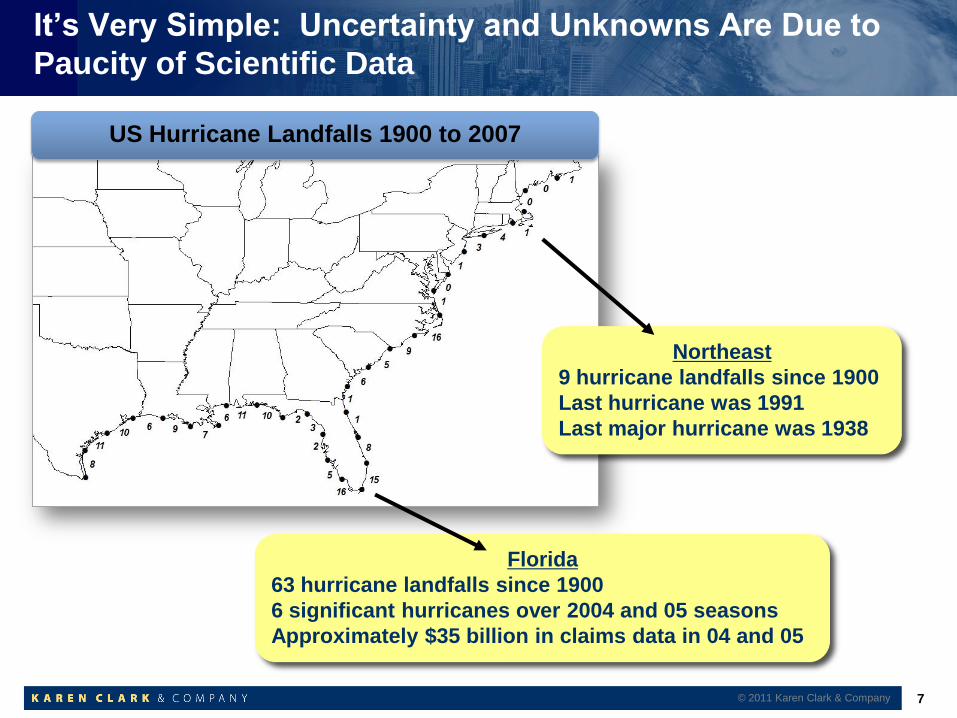
US Hurricane Landfalls 1900 to 2007
Northeast
9 hurricane landfalls since 1900
Last hurricane was 1991
Last major hurricane was 1938
Florida
63 hurricane landfalls since 1900
6 significant hurricanes over 2004 and 05 seasons
Approximately $35 billion in claims data in 04 and 05
It’s Very Simple: Uncertainty and Unknowns Are Due to
Paucity of Scientific Data
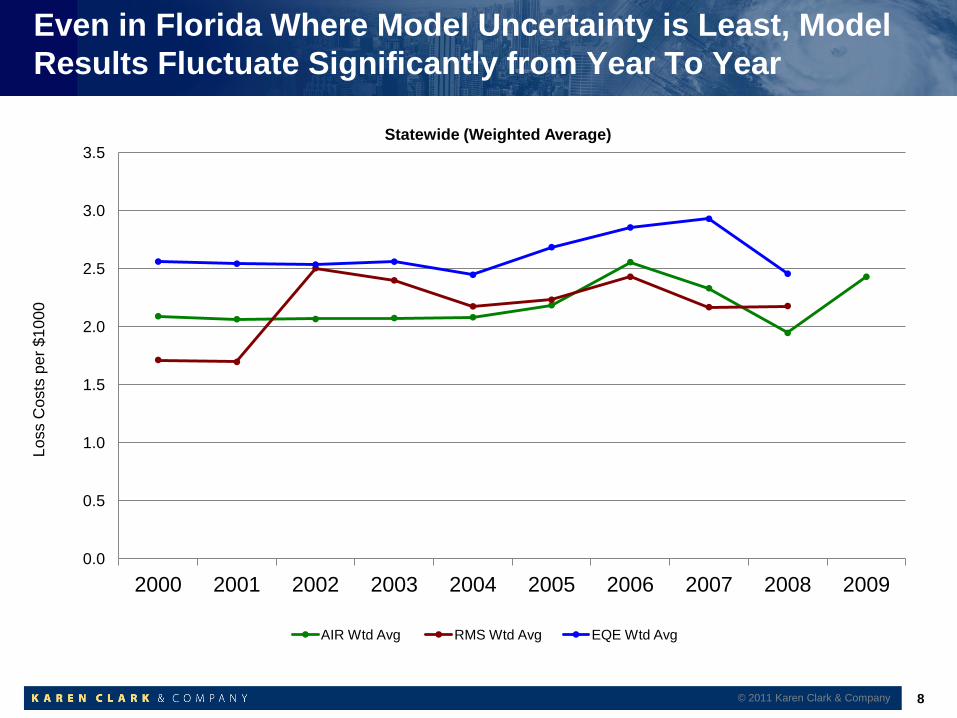
Even in Florida Where Model Uncertainty is Least, Model
Results Fluctuate Significantly from Year To Year
© 2011 Karen Clark & Company 8
0.0
0.5
1.0
1.5
2.0
2.5
3.0
3.5
2000 2001 2002 2003 2004 2005 2006 2007 2008 2009
AIR Wtd Avg RMS Wtd Avg EQE Wtd Avg
Lo
ss C
osts
pe
r $
10
00
Statewide (Weighted Average)
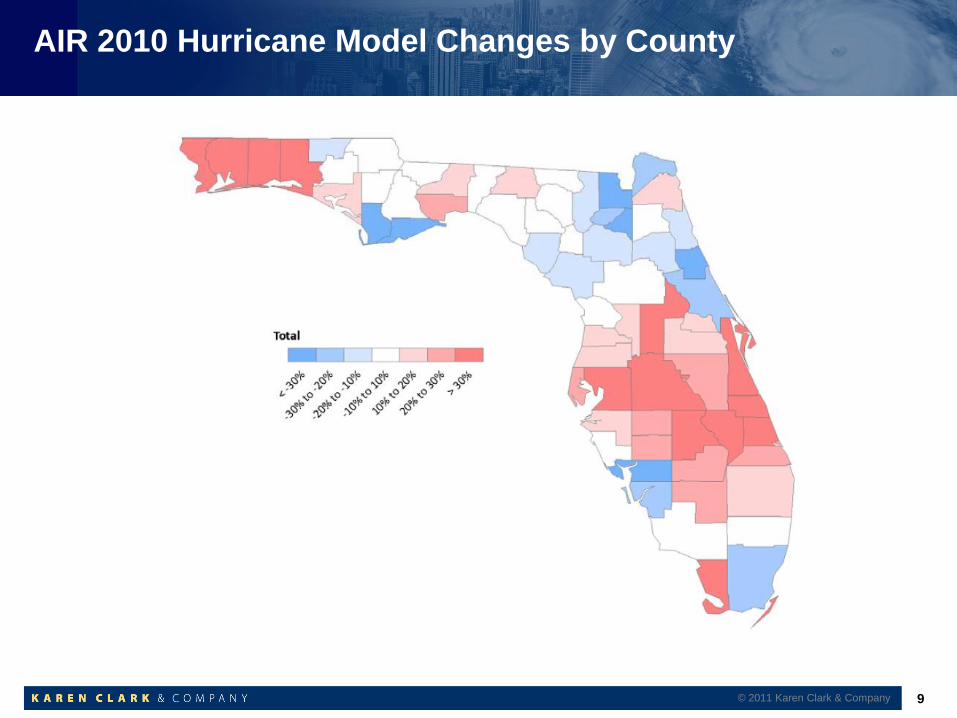
AIR 2010 Hurricane Model Changes by County
© 2011 Karen Clark & Company 9
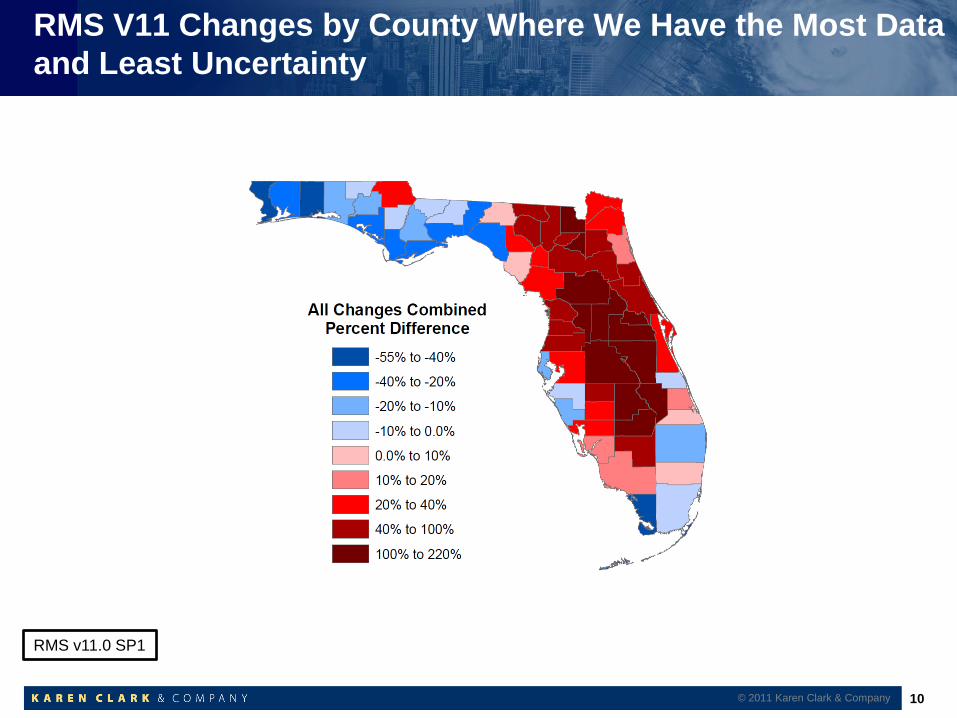
RMS V11 Changes by County Where We Have the Most Data
and Least Uncertainty
© 2011 Karen Clark & Company 10
RMS v11.0 SP1
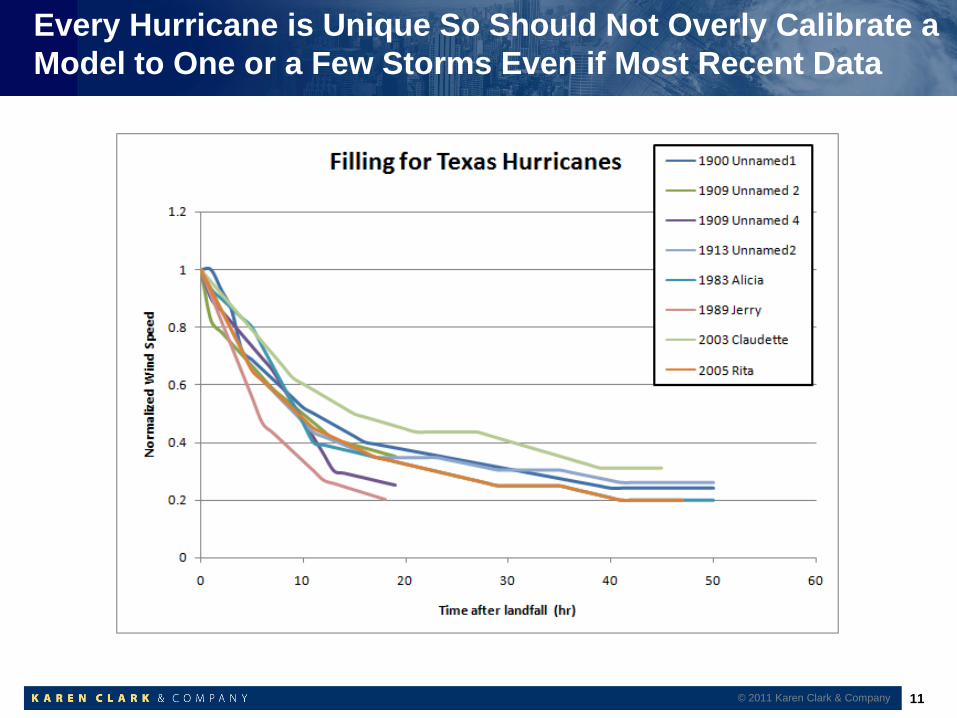
Every Hurricane is Unique So Should Not Overly Calibrate a
Model to One or a Few Storms Even if Most Recent Data
11 © 2011 Karen Clark & Company
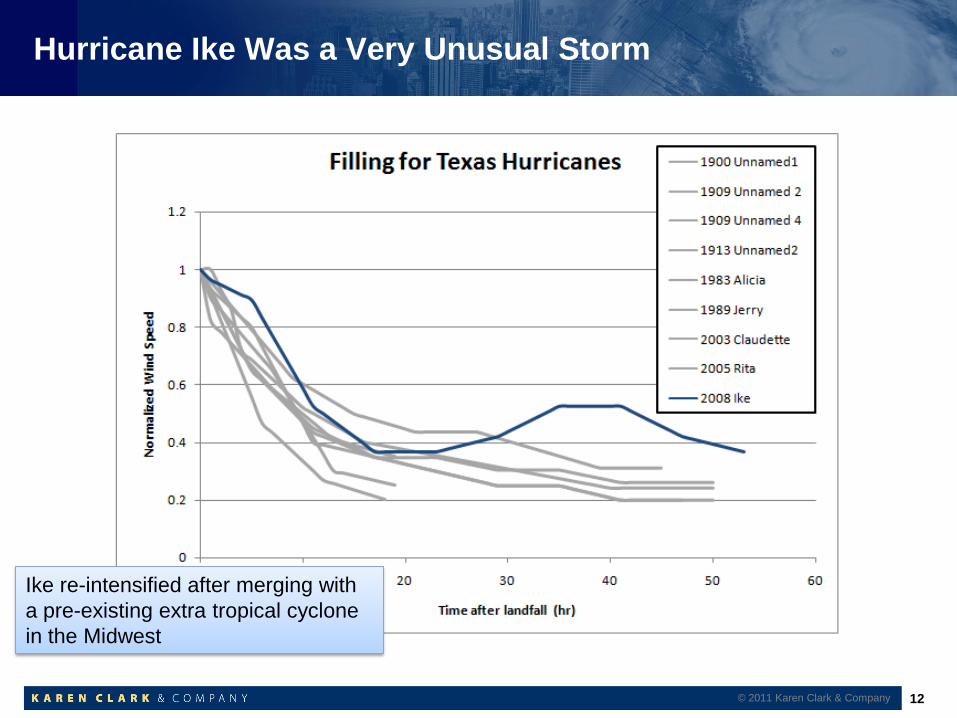
Hurricane Ike Was a Very Unusual Storm
12
Ike re-intensified after merging with
a pre-existing extra tropical cyclone
in the Midwest
© 2011 Karen Clark & Company
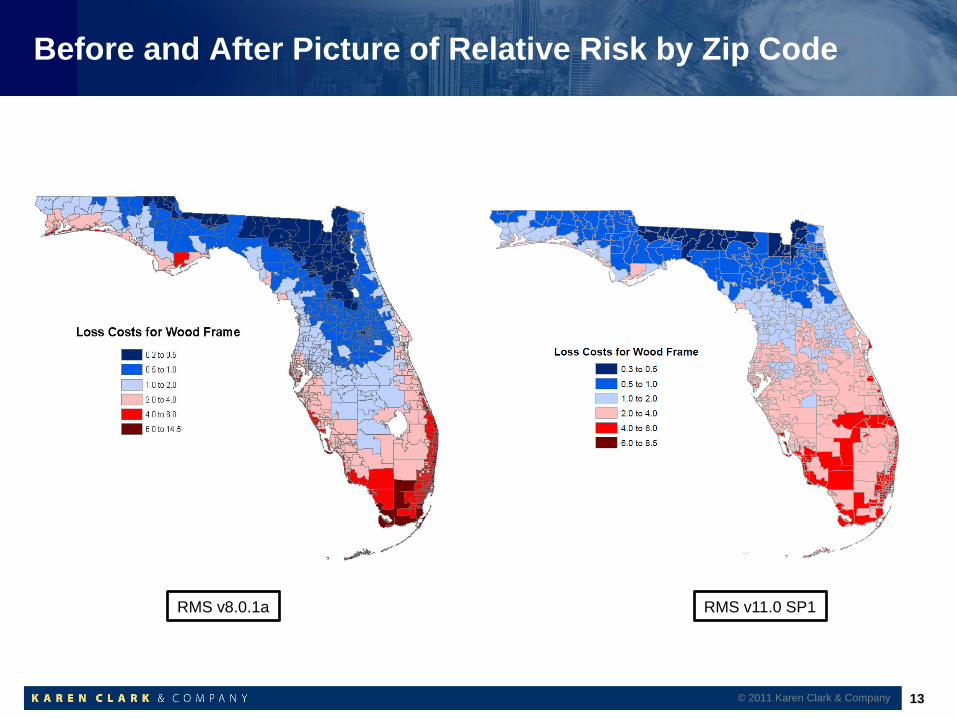
Before and After Picture of Relative Risk by Zip Code
13
RMS v8.0.1a RMS v11.0 SP1
© 2011 Karen Clark & Company
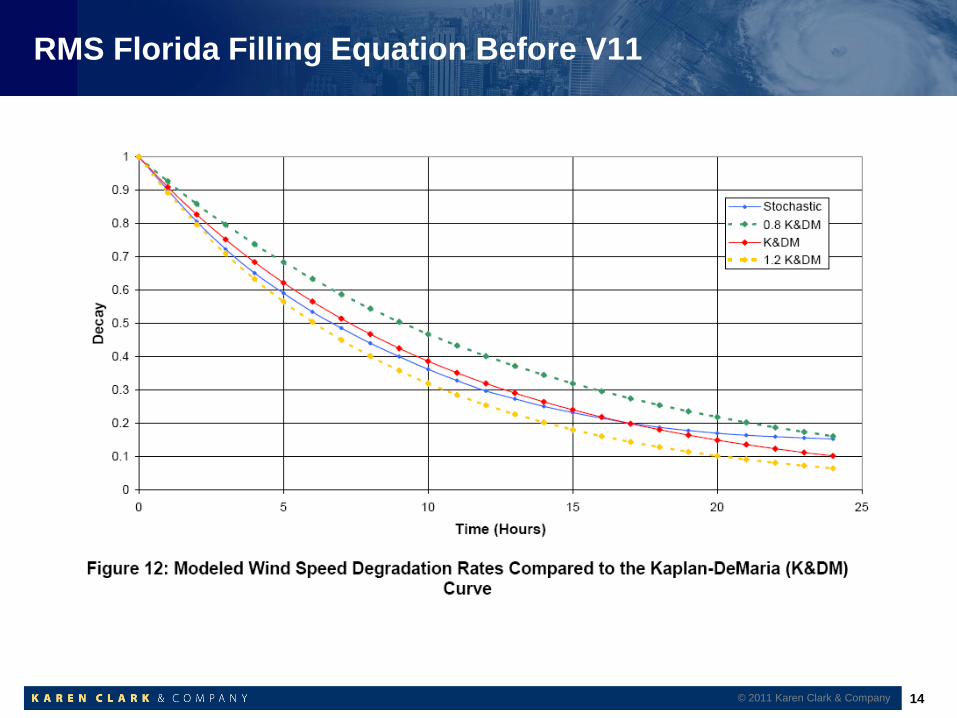
RMS Florida Filling Equation Before V11
14 © 2011 Karen Clark & Company
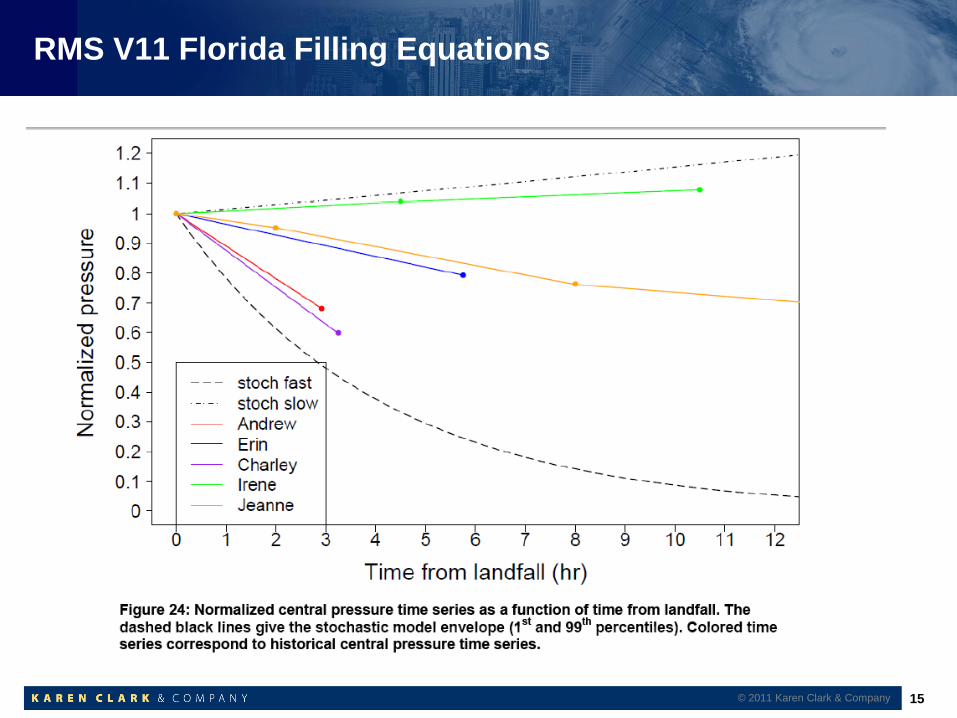
RMS V11 Florida Filling Equations
15 © 2011 Karen Clark & Company
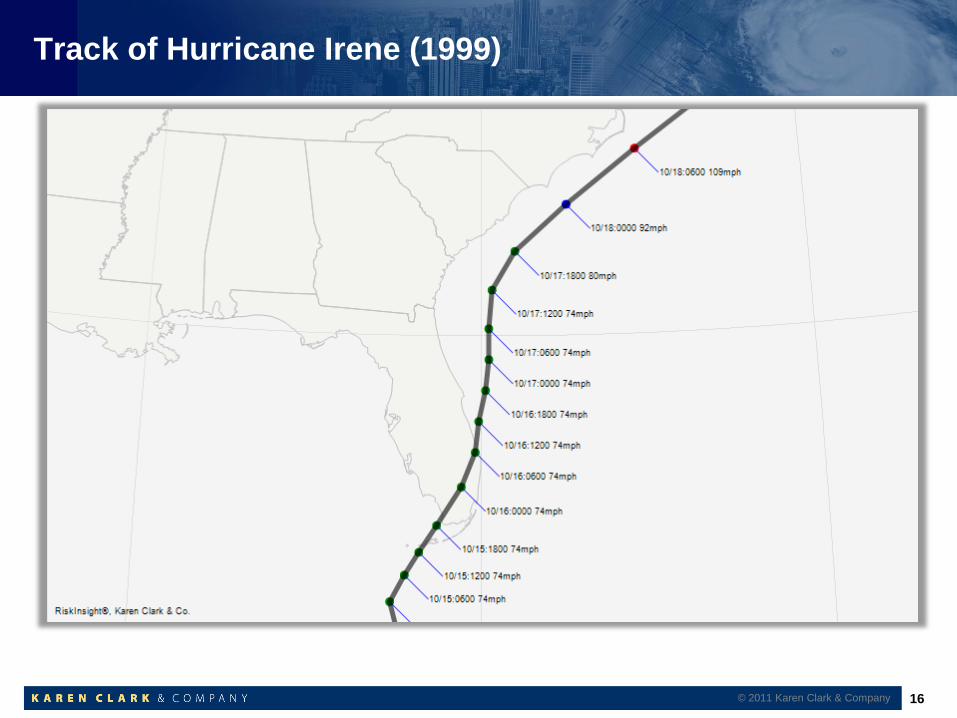
Track of Hurricane Irene (1999)
16 © 2011 Karen Clark & Company
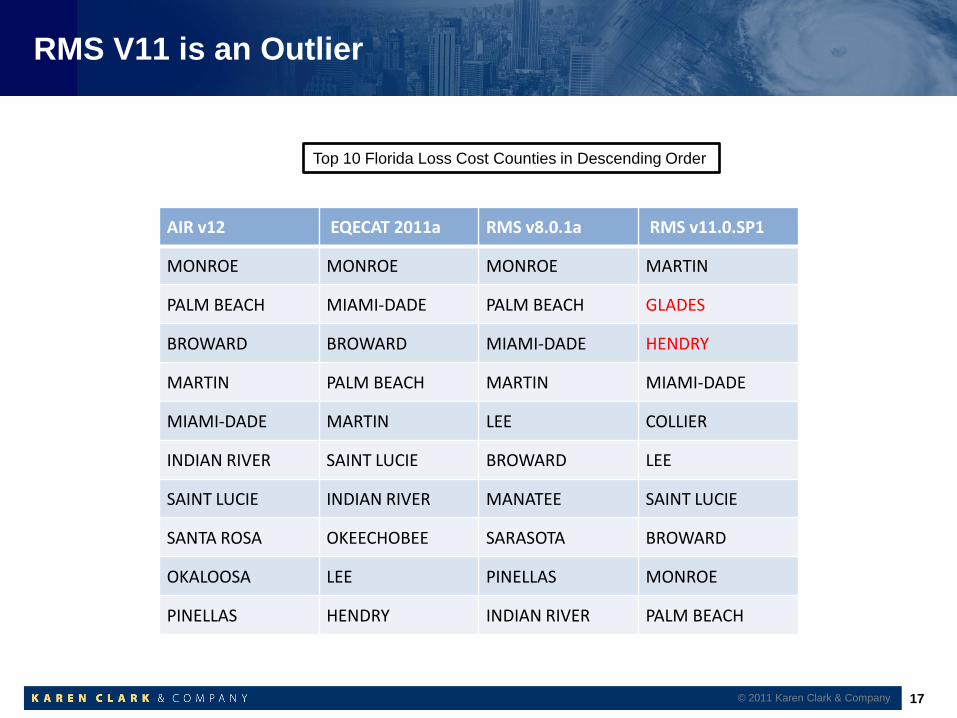
RMS V11 is an Outlier
AIR v12 EQECAT 2011a RMS v8.0.1a RMS v11.0.SP1
MONROE MONROE MONROE MARTIN
PALM BEACH MIAMI-DADE PALM BEACH GLADES
BROWARD BROWARD MIAMI-DADE HENDRY
MARTIN PALM BEACH MARTIN MIAMI-DADE
MIAMI-DADE MARTIN LEE COLLIER
INDIAN RIVER SAINT LUCIE BROWARD LEE
SAINT LUCIE INDIAN RIVER MANATEE SAINT LUCIE
SANTA ROSA OKEECHOBEE SARASOTA BROWARD
OKALOOSA LEE PINELLAS MONROE
PINELLAS HENDRY INDIAN RIVER PALM BEACH
Top 10 Florida Loss Cost Counties in Descending Order
17 © 2011 Karen Clark & Company
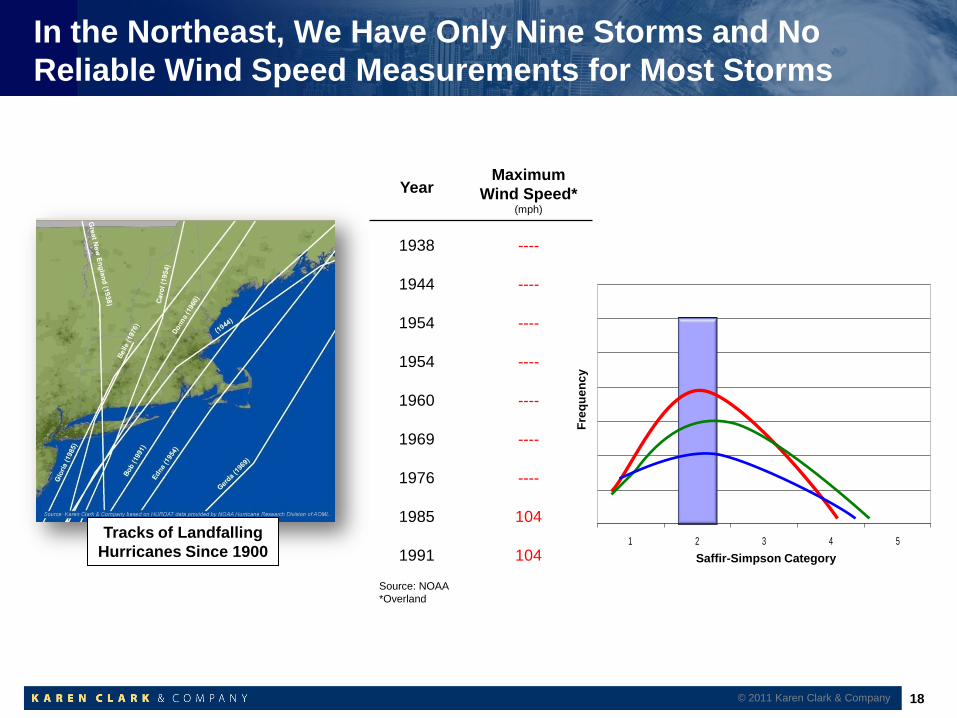
In the Northeast, We Have Only Nine Storms and No
Reliable Wind Speed Measurements for Most Storms
© 2011 Karen Clark & Company 18
Tracks of Landfalling
Hurricanes Since 1900
Year
Maximum
Wind Speed* (mph)
1938 ----
1944 ----
1954 ----
1954 ----
1960 ----
1969 ----
1976 ----
1985 104
1991 104
Source: NOAA
*Overland
1 2 3 4 5
Saffir-Simpson Category
Fre
qu
en
cy
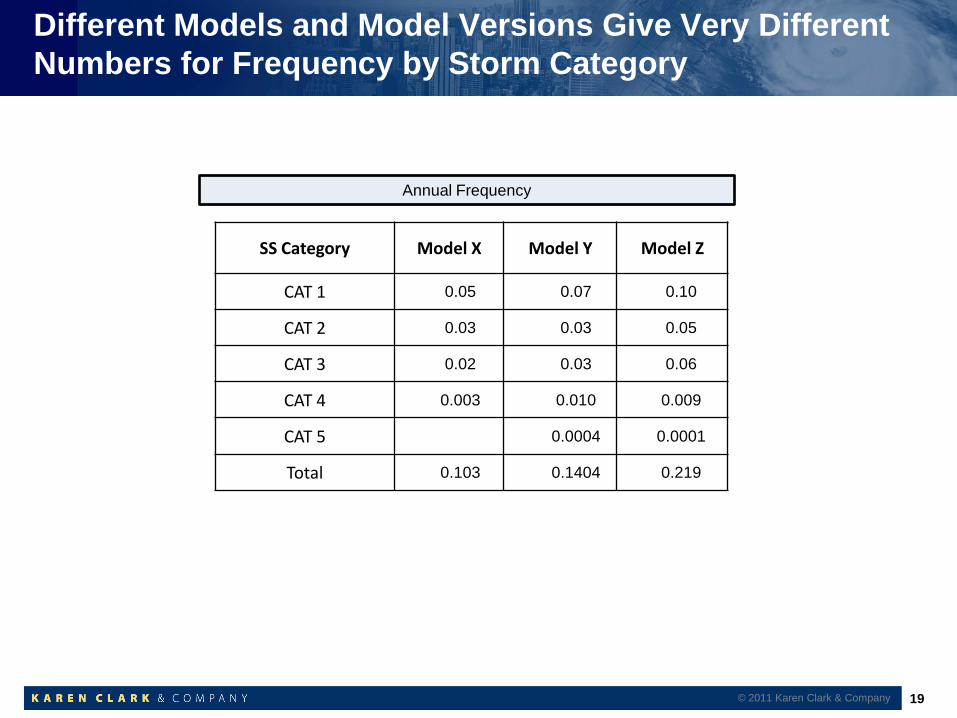
Different Models and Model Versions Give Very Different
Numbers for Frequency by Storm Category
© 2011 Karen Clark & Company 19
SS Category Model X Model Y Model Z
CAT 1 0.05 0.07 0.10
CAT 2 0.03 0.03 0.05
CAT 3 0.02 0.03 0.06
CAT 4 0.003 0.010 0.009
CAT 5 0.0004 0.0001
Total 0.103 0.1404 0.219
Annual Frequency
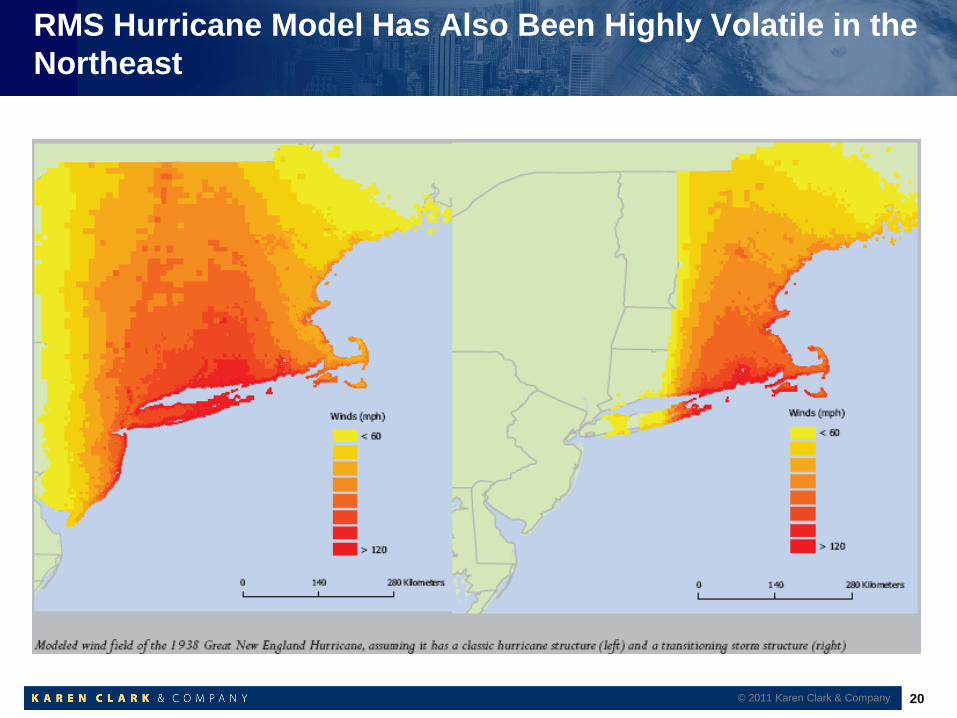
RMS Hurricane Model Has Also Been Highly Volatile in the
Northeast
© 2011 Karen Clark & Company 20
So Why Do We Keep Expecting the Models to Give Accurate
Numbers?
© 2011 Karen Clark & Company 21
Dispelling the Myths Surrounding Catastrophe Models
The models are not getting more accurate over time Not enough reliable data for any degree of accuracy
Much of the volatility in the loss estimates is due to scientific “unknowns” versus new scientific
knowledge
An updated model is not necessarily a better, more credible model Over specification combined with high sensitivity of loss estimates to small changes in model
assumptions
Over calibration to most recent event(s)
The catastrophe models are not objective tools Most model assumptions are based on the subjective judgments of scientists and engineers rather
than objective data
Different scientists have their own opinions and biases
Scientists can change their minds
© 2011 Karen Clark & Company 22
Developing an Effective and Robust Risk Management
Framework
There is no “best” or “right” model
Enlightenment will not come from A set of questions to ask the modelers
Reading hundreds of pages of model documentation
The best way to evaluate a model is to perform detailed tests of the model output How do the simulated frequencies by magnitude compare with the historical data?
How do the vulnerability relativities compare to actual claims experience and engineering
knowledge?
Do the normalized losses at high resolution follow a logical relation to risk?
The most thorough understanding comes from a model-independent view of the
risk in exposed peril regions based on multiple data sources and tools
An effective and robust risk management framework is informed by the models
but not based on the models
© 2011 Karen Clark & Company 23
CONFIDENTIAL
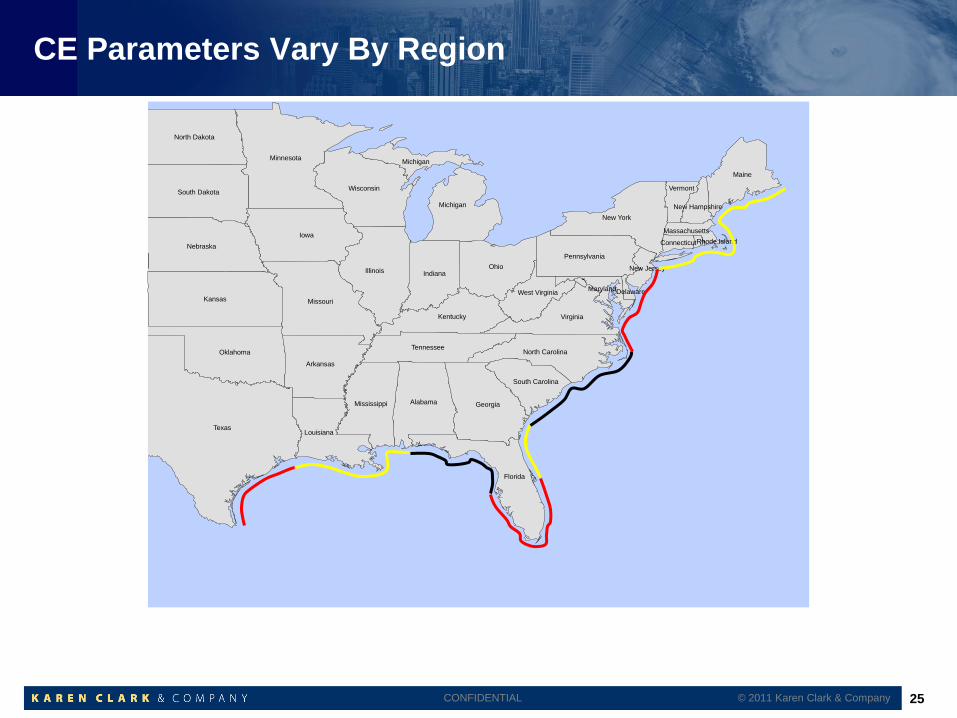
Scientifically-derived, Model-Independent Characteristic
Events (CEs) Provide an Additional Tool
CEs are defined-probability scenario events
CEs are defined for different regions for return periods of interest such as
100, 250, and 500 year
Wind footprints for the CEs are “floated” along the coast to estimate a range
of loss estimates for each return period
CEs are comparable to model-generated events and have additional benefits They are based on same scientific data but eliminate the fluctuations in loss estimates due to
noise in the hazard component of the models
They are transparent and easily peer-reviewed by independent, external experts
They provide a set of scenario losses that can be monitored at the corporate level and drilled
down to individual policies if desired
The average or median CE loss for each region can be compared to model-generated PMLs
24 © 2011 Karen Clark & Company
CONFIDENTIAL
CE Parameters Vary By Region
Texas
Iowa
Kansas
Minnesota
IllinoisOhio
Missouri
Florida
Nebraska
Georgia
Oklahoma
Wisconsin
Maine
Alabama
Arkansas
New York
Virginia
Indiana
Michigan
South Dakota
North Dakota
Louisiana
Kentucky
Mississippi
Tennessee
Pennsylvania
North Carolina
Michigan
South Carolina
West Virginia
Vermont
Maryland
New Jersey
New Hampshire
Massachusetts
Connecticut
Delaware
Rhode Island
25 © 2011 Karen Clark & Company
CONFIDENTIAL
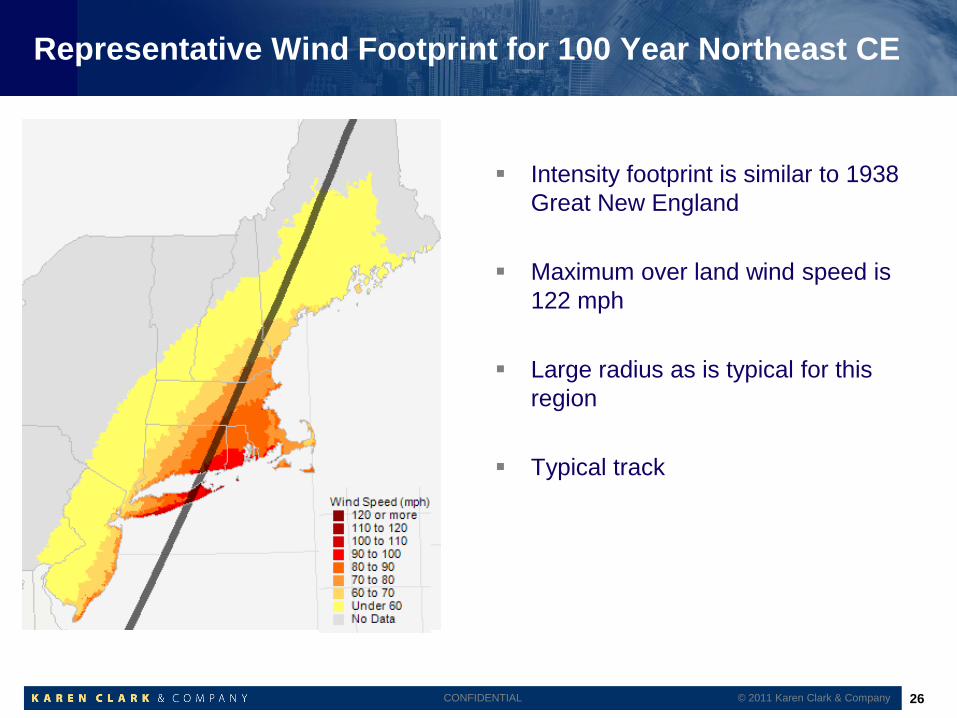
Representative Wind Footprint for 100 Year Northeast CE
Intensity footprint is similar to 1938
Great New England
Maximum over land wind speed is
122 mph
Large radius as is typical for this
region
Typical track
26 © 2011 Karen Clark & Company
CONFIDENTIAL
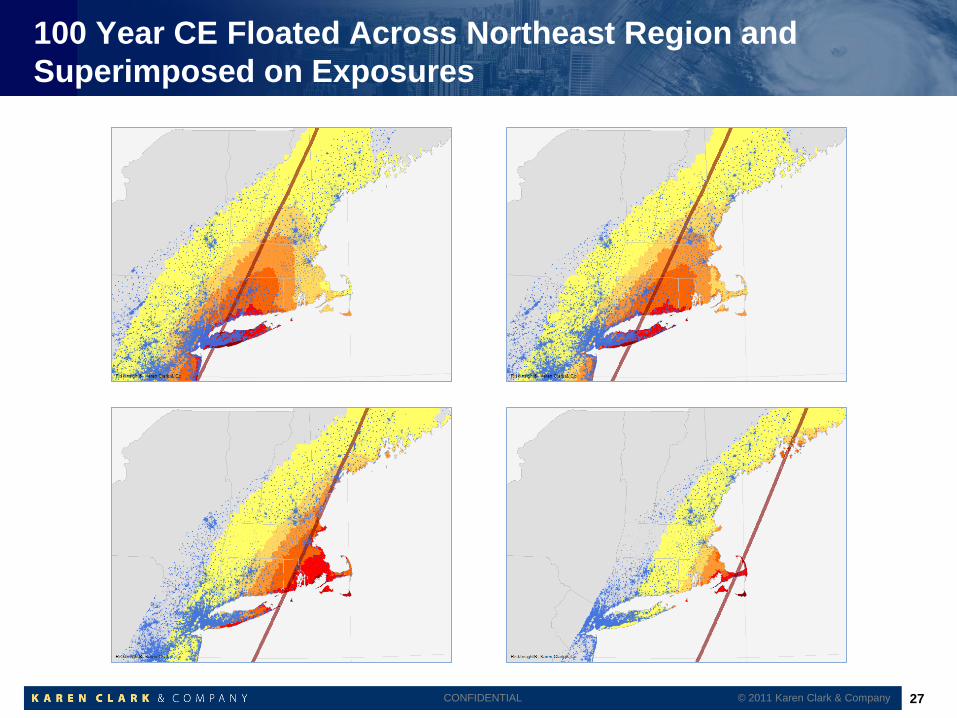
100 Year CE Floated Across Northeast Region and
Superimposed on Exposures
27 © 2011 Karen Clark & Company
CONFIDENTIAL
-
500
1,000
1,500
2,000
2,500
3,000
3,500
4,000
4,500
5,000
5520 5540 5560 5580 5600 5620 5640 5660 5680 5700 5720
Esti
mat
ed
Lo
ss (
$, m
illio
ns)
Landfall Location
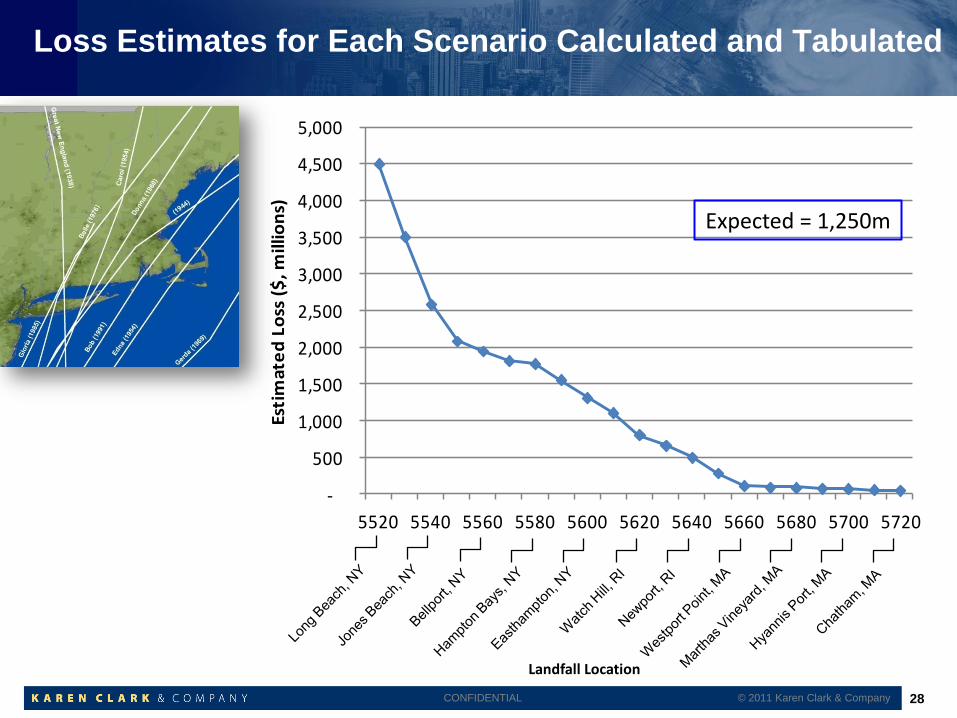
Loss Estimates for Each Scenario Calculated and Tabulated
© 2011 Karen Clark & Company 28
Expected = 1,250m
CONFIDENTIAL
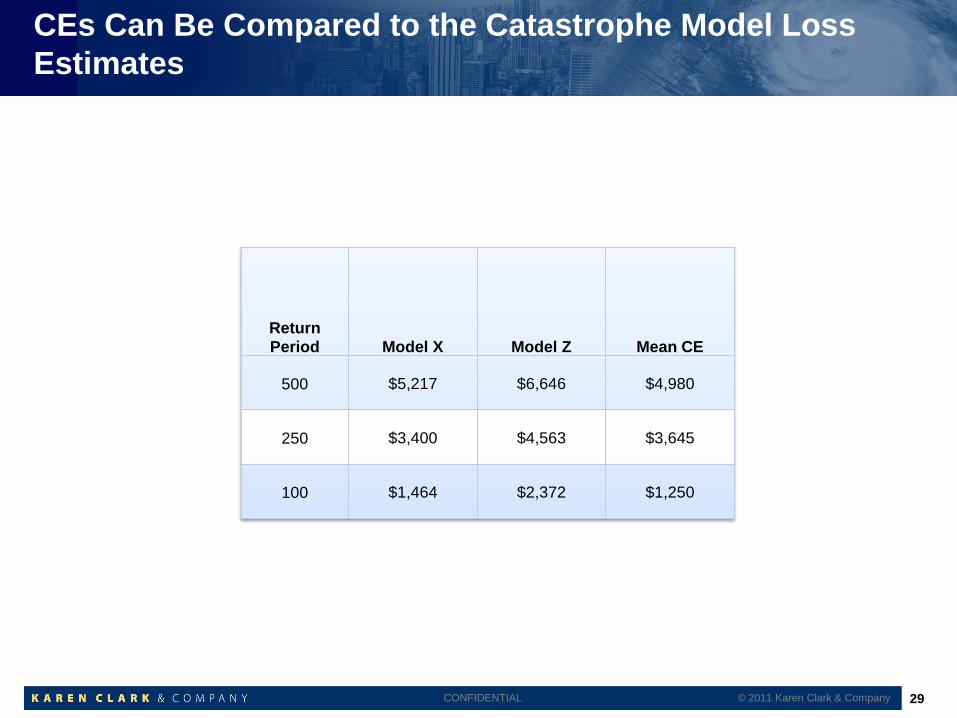
CEs Can Be Compared to the Catastrophe Model Loss
Estimates
© 2011 Karen Clark & Company 29
Return
Period Model X Model Z Mean CE
500 $5,217 $6,646 $4,980
250 $3,400 $4,563 $3,645
100 $1,464 $2,372 $1,250
CONFIDENTIAL
And Provide Additional Information for a Richer Dialog and
Understanding
A reasonable estimate for company’s 1 in 100 year loss is $1 to $1.5 billion
A reasonable estimate for company’s 1 in 250 year loss is $3 to $4 billion
However, company could have a loss in excess of $4 billion from a Cat 3 storm
tracking through NYC and western Long Island (black swan?)
Most scenario losses from 1 in 100 year CE are less than $2 billion
Reducing exposure concentrations and/or re-evaluating underwriting guidelines
can reduce the chances of “black swan” event
© 2011 Karen Clark & Company 30
CONFIDENTIAL
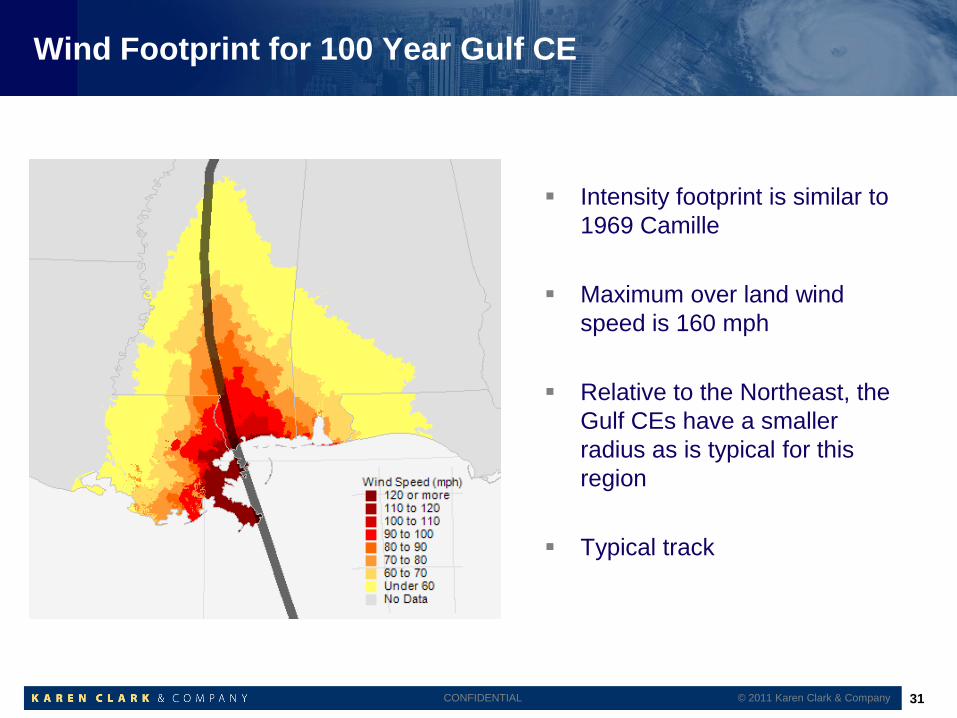
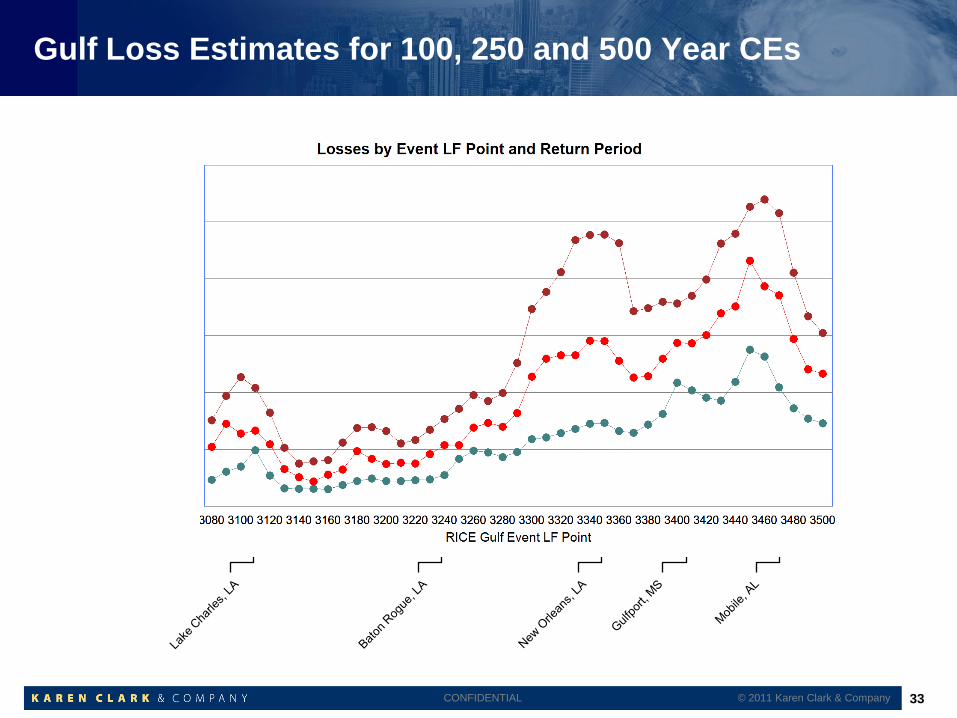
Wind Footprint for 100 Year Gulf CE
Intensity footprint is similar to
1969 Camille
Maximum over land wind
speed is 160 mph
Relative to the Northeast, the
Gulf CEs have a smaller
radius as is typical for this
region
Typical track
31 © 2011 Karen Clark & Company
CONFIDENTIAL
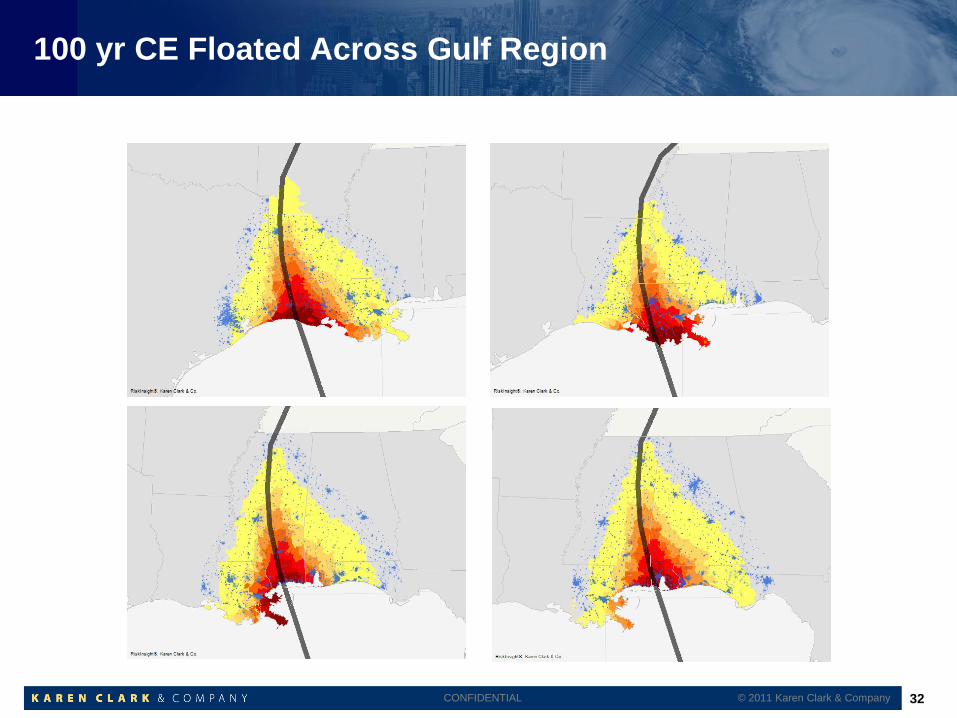
100 yr CE Floated Across Gulf Region
32 © 2011 Karen Clark & Company
CONFIDENTIAL
Gulf Loss Estimates for 100, 250 and 500 Year CEs
CE 500
CE 250
CE 100
33 © 2011 Karen Clark & Company
CONFIDENTIAL
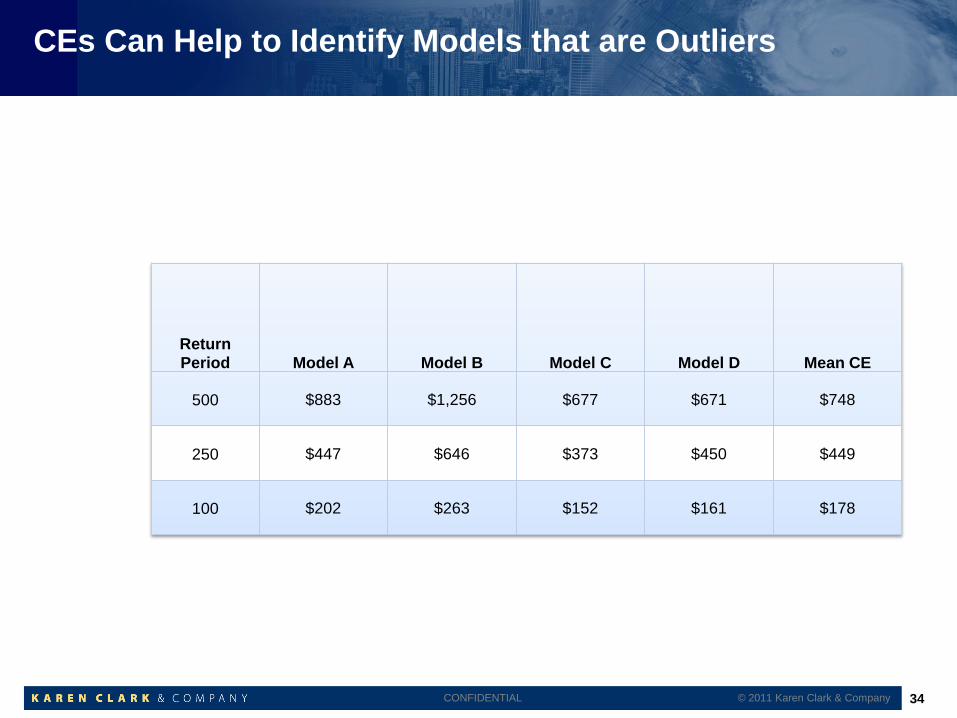
CEs Can Help to Identify Models that are Outliers
© 2011 Karen Clark & Company 34
Return
Period Model A Model B Model C Model D Mean CE
500 $883 $1,256 $677 $671 $748
250 $447 $646 $373 $450 $449
100 $202 $263 $152 $161 $178
CONFIDENTIAL
Benefits of CEs
CEs provide transparent sets of scenario losses for better understanding the risk
Characteristic Event (CE) sets are stable from year to year Will only change if something happens that significantly changes the hazard in a particular region
(e.g. there is a cat 5 hurricane in the Northeast)
Companies can effectively monitor the impacts of pure exposure changes
Companies can plan their risk management strategies and make consistent decisions thereby
serving their policyholders better
CEs are operational risk metrics
Because they provide a fixed set of events, they are fully additive across accounts, lines of
business, etc.
They can be monitored at the corporate level and drilled down to the resolution desired
Underwriters can clearly see the impacts of adding additional accounts
At high resolution, such as zip code, CEs provide a consistent and logical
relation to risk CEs can provide more events in the tail of the distribution
Because they are “floated” to cover all exposure areas, there is less noise at high resolution
© 2011 Karen Clark & Company 35
CONFIDENTIAL
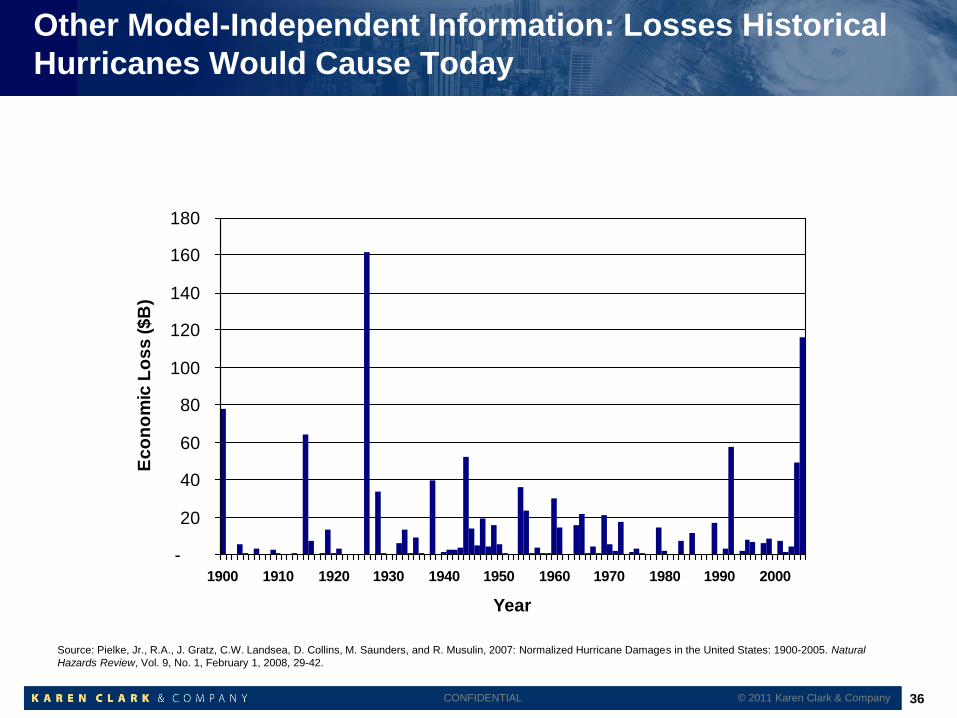
Other Model-Independent Information: Losses Historical
Hurricanes Would Cause Today
-
20
40
60
80
100
120
140
160
180
1900 1910 1920 1930 1940 1950 1960 1970 1980 1990 2000
Year
Ec
on
om
ic L
os
s (
$B
)
Source: Pielke, Jr., R.A., J. Gratz, C.W. Landsea, D. Collins, M. Saunders, and R. Musulin, 2007: Normalized Hurricane Damages in the United States: 1900-2005. Natural
Hazards Review, Vol. 9, No. 1, February 1, 2008, 29-42.
© 2011 Karen Clark & Company 36
CONFIDENTIAL
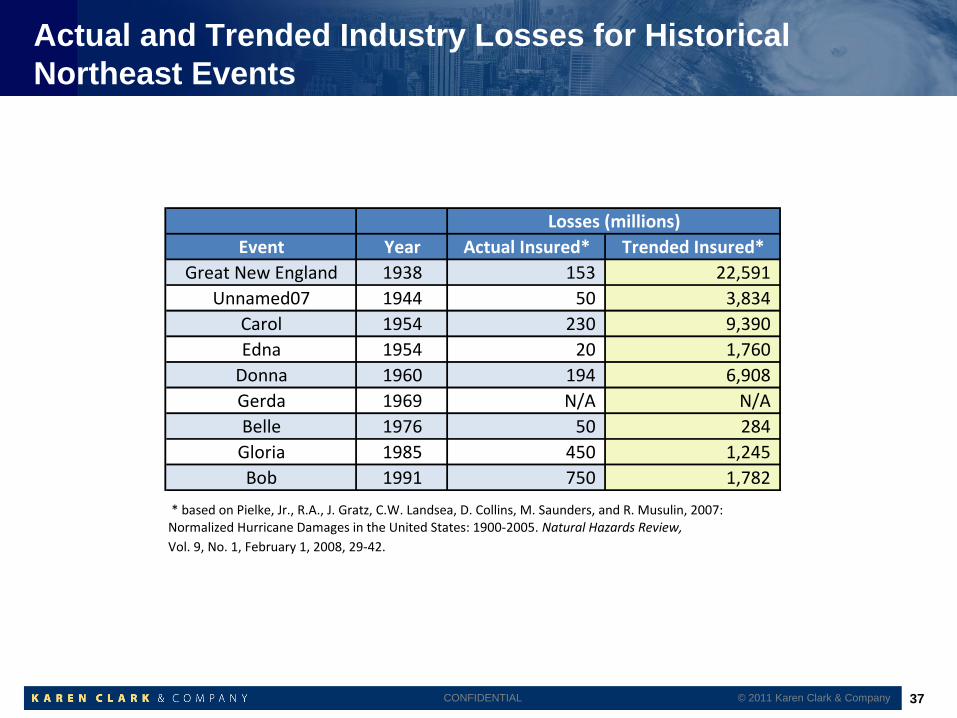
Actual and Trended Industry Losses for Historical
Northeast Events
© 2011 Karen Clark & Company 37
Event Year Actual Insured* Trended Insured*
Great New England 1938 153 22,591
Unnamed07 1944 50 3,834
Carol 1954 230 9,390
Edna 1954 20 1,760
Donna 1960 194 6,908
Gerda 1969 N/A N/A
Belle 1976 50 284
Gloria 1985 450 1,245
Bob 1991 750 1,782
* based on Pielke, Jr., R.A., J. Gratz, C.W. Landsea, D. Collins, M. Saunders, and R. Musulin, 2007:Normalized Hurricane Damages in the United States: 1900-2005. Natural Hazards Review,
Vol. 9, No. 1, February 1, 2008, 29-42.
Losses (millions)
CONFIDENTIAL
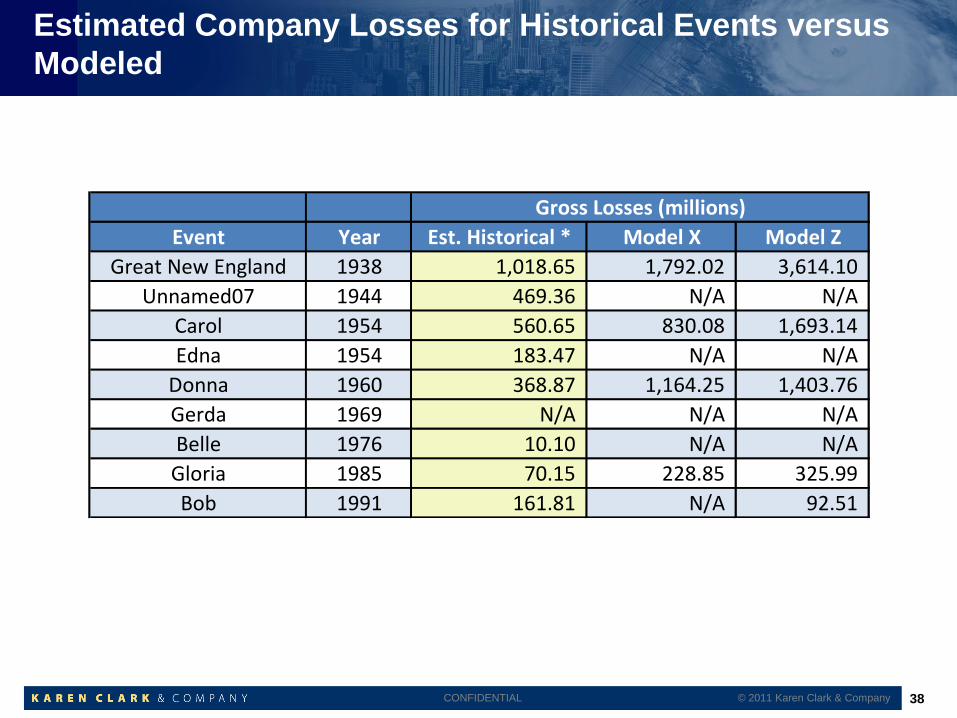
Estimated Company Losses for Historical Events versus
Modeled
© 2011 Karen Clark & Company 38
Event Year Est. Historical * Model X Model Z
Great New England 1938 1,018.65 1,792.02 3,614.10
Unnamed07 1944 469.36 N/A N/A
Carol 1954 560.65 830.08 1,693.14
Edna 1954 183.47 N/A N/A
Donna 1960 368.87 1,164.25 1,403.76
Gerda 1969 N/A N/A N/A
Belle 1976 10.10 N/A N/A
Gloria 1985 70.15 228.85 325.99
Bob 1991 161.81 N/A 92.51
Gross Losses (millions)
CONFIDENTIAL
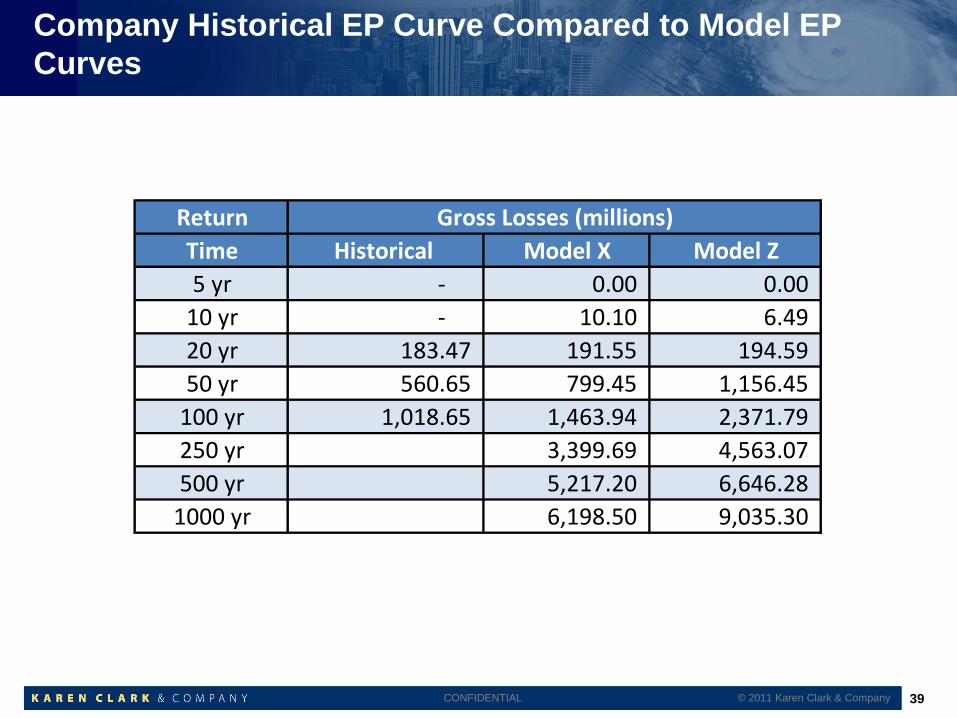
Company Historical EP Curve Compared to Model EP
Curves
© 2011 Karen Clark & Company 39
Return
Time Historical Model X Model Z
5 yr - 0.00 0.00
10 yr - 10.10 6.49
20 yr 183.47 191.55 194.59
50 yr 560.65 799.45 1,156.45
100 yr 1,018.65 1,463.94 2,371.79
250 yr 3,399.69 4,563.07
500 yr 5,217.20 6,646.28
1000 yr 6,198.50 9,035.30
Gross Losses (millions)
CONFIDENTIAL
Conclusions
While the catastrophe models are valuable tools the model-generated loss
estimates are highly volatile due to noise caused by lack of data Disruptive to underwriting and pricing strategies
Disruptive to consumers
Insurance companies and consumers will benefit from other risk metrics and
tools
A more complete toolkit improves the dialog with external stakeholders, such as
rating agencies, who expect companies to take “ownership” of the risk and to be
able to explain what they believe and why
Other sources of information, such as trended historical losses, analyses of
claims data, etc. are also very valuable for understanding the risk
© 2011 Karen Clark & Company 40