Embed Size (px)
Citation preview
ARTICLE IN PRESS
THE BREAST
0960-9776/$ - se
doi:10.1016/j.br
�CorrespondE-mail addr
The Breast 16 (2007) S98–S104
www.elsevier.com/locate/breast
Original article
Using clinical trial data to tailor adjuvant treatmentsfor individual patients
Meredith M. Regan�, Richard D. Gelber, for the International Breast CancerStudy Group (IBCSG) and the Breast International Group (BIG)
IBCSG Statistical Center, Department of Biostatistics and Computational Biology, Dana-Farber Cancer Institute, 44 Binney Street, Boston, MA 02115, USA
Abstract
The 2005 St. Gallen Consensus Panel provided recommendations for the treatment of early breast cancer which rely on target
identification first. The foremost advance since 2005—demonstration of trastuzumab efficacy for patients with HER2-positive disease—
was realized because an effective treatment was being evaluated and because the trial patients had the targeted disease as determined by
quality-controlled assessment prior to study entry. The BIG 1-98 trial provides a striking reminder of patients’ benefit from reliable
pathological tumor assessment so that targeted therapies are effectively utilized. Several statistical methods facilitate use of clinical trial
data for individualizing treatment. Subgroup analyses summarized using forest plots are essential for better understanding the disease
and its treatment. The HERA trial illustrates the interpretation of relative and absolute treatment effects and estimating hazard rates
over time as means to distinguish relevant differences across subgroups. Overview analyses, joint analyses, the STEPP (subpopulation
treatment effect pattern plot) method and recursive partitioning are valuable tools.
r 2007 Elsevier Ltd. All rights reserved.
Keywords: Breast cancer; Subgroup analysis; Estrogen receptors; Progesterone receptors; HER2; Adjuvant therapy; Chemotherapy; Endocrine therapy;
Trastuzumab; STEPP
1. Introduction
Phase III randomized clinical trials are designed tocompare two or more treatments in a large population ofeligible patients. Breast cancer is a heterogeneous disease1
and it is quite likely that different subpopulations willexperience different levels and patterns of recurrence riskand that treatment effect sizes will differ across subpopula-tions. Statistically, the dangers associated with misinter-pretation of subgroup analyses have forced clinical trialiststo rely primarily on the overall treatment effect obtainedfrom the entire trial population, avoiding any considera-tion of subgroups. While this ‘‘across the board’’ approachprovides reliable evidence on the question of whether anexperimental treatment works better than the controltherapy on average, it provides no insight concerningpotential variability of the magnitude of effect for
e front matter r 2007 Elsevier Ltd. All rights reserved.
east.2007.07.016
ing author. Tel.: +1617 632 2471; fax: +1 617 632 2444.
ess: [email protected] (M.M. Regan).
heterogeneous disease and patient cohorts. Furthermore,across the board results lead to establishing a ‘‘standard’’which may be applied to a broad spectrum of the patientpopulation, thus making it impossible to conduct futureresearch initiatives designed to tailor therapies for ‘‘niche’’cohorts.Several statistical techniques are useful for bringing
clinical trial data closer to the individual patient. Properlyconducted and interpreted subgroup analyses are encour-aged. Use of relative measures of treatment effect, absolutedifferences in the Kaplan–Meier estimates of disease-freesurvival, and hazard rates over time are illustrated.Additional approaches that help to stimulate researchand highlight patient cohort differences are presented.
2. Target identification
The 2005 St. Gallen Consensus Panel recognized theimportance of therapeutic targets to guide the selection ofadjuvant systemic therapies.2 The demonstration in 2005 of
ARTICLE IN PRESS
Years since randomization
Perc
ent aliv
e a
nd d
isease-f
ree
Years since randomization
Annual hazard
rate
s
0 1 2 3 4 5
0.0
0.05
0.10
0.15
0.20
0.25
0.30
0 1 2 3 4 5
0
20
40
60
80
100
Hormone receptor-positive, Letrozole
Hormone receptor-positive, Tamoxifen
Hormone receptor-negative, Letrozole
Hormone receptor-negative, Tamoxifen
Hormone receptor-positive by central assessment (n=6101)HR(L:T)=0.75 (95% CI, 0.63-0.87)
Hormone receptor-positive
Hormone receptor-negative
Hormone receptor-negative by central assessment (n=137)HR(L:T)=0.93 (95% CI, 0.53-1.63)
Fig. 1. Kaplan–Meier estimates (panel A) and annualized hazard rates
with 95% CI (panel B) for disease-free survival (%) comparing letrozole
versus tamoxifen among postmenopausal women in the BIG 1–98 trial,
according to central pathology assessment of steroid hormone receptor
status [positive ¼ ER and/or PgRX10% of cells immunoreactive;
negative ¼ ER and PgR both o10% of cells immunoreactive]. HR(L:T)
denotes hazard ratio of letrozole relative to tamoxifen and CI denotes
confidence interval. Presented with permission of the BIG 1-98 Steering
Committee.
M.M. Regan, R.D. Gelber / The Breast 16 (2007) S98–S104 S99
striking improvements in disease-free survival associatedwith the use of adjuvant trastuzumab3,4 among patientswhose tumors overexpressed HER2/neu further empha-sized the importance of proper target identification.5
In fact, the use of high volume, quality-controlled, reli-able and timely pathological assessment of estrogenreceptor (ER), progesterone receptor (PgR) and HER2/neustatus of early breast cancer could substantially improveresults from adjuvant systemic therapies by assuring thatproper targeted therapy is delivered to the patients whoneed it.
Data obtained from the Breast International Group(BIG) 1-98 study6,7 illustrate the importance of targetidentification. BIG 1-98 enrolled 8010 assessable postme-nopausal patients with ER- and/or PgR-positive tumors(defined according to local pathology assessment) between1998 and 2003. Tumor specimens (blocks or slides) wereavailable for central pathology review (conducted by Prof.Giuseppe Viale, European Institute of Oncology, Milan,Italy) for 6291 (79%) of these patients. Surprisingly, thecentral pathology review determined that 137 (2.2%) of theassessable cases had both ER and PgR expressed in lessthan 10% of cells.
Fig. 1A presents the Kaplan–Meier curves for disease-free survival for BIG 1-98 according to treatment groupand central pathology assessment of ER/PgR status. Thehormone receptor-positive cohort (ERX10% and/orPgRX10%) experiences the pattern of recurrence observedin endocrine-responsive disease—events occur at a rela-tively low rate over time but continue to occur with longerfollow-up—and demonstrates a meaningful differencefavoring letrozole compared with tamoxifen. By contrast,the small cohort of centrally assessed hormone receptor-negative cases (ERo10% and PgRo10%) experiencesthe pattern of recurrence associated with endocrine non-responsive cohorts—a high rate of early relapse witha reduced risk of relapse with longer follow-up—andbenefits less from letrozole compared with tamoxifen thanthe group that central pathology review confirmed to havethe therapeutic target. Failure of local pathology assess-ment to properly identify the therapeutic target led toimproper adjuvant therapy recommendations for somepatients who were incorrectly enrolled in BIG 1-98.Additional analyses of BIG 1-98 central pathology reviewfindings are forthcoming.8
Target identification is so fundamental to the success ofadjuvant therapies that the Adjuvant Lapatinib and/orTrastuzumab Treatment Optimisation (ALTTO) studyincludes central pathology review of tumors for HER2-positivity and for ER and PgR status prior to randomiza-tion. Only patients with HER2-positive tumors will beeligible to enroll in this 8000 patient randomized trialdesigned to assess the role of lapatinib alone, trastuzumabalone, their sequence and their combination. Centralreview of ER and PgR is intended to optimize theuse of endocrine therapies for the patients enrolled inALTTO.9
3. Subgroup analyses
The herceptin adjuvant (HERA) study clearly demon-strated a disease-free survival3 and an overall survival10
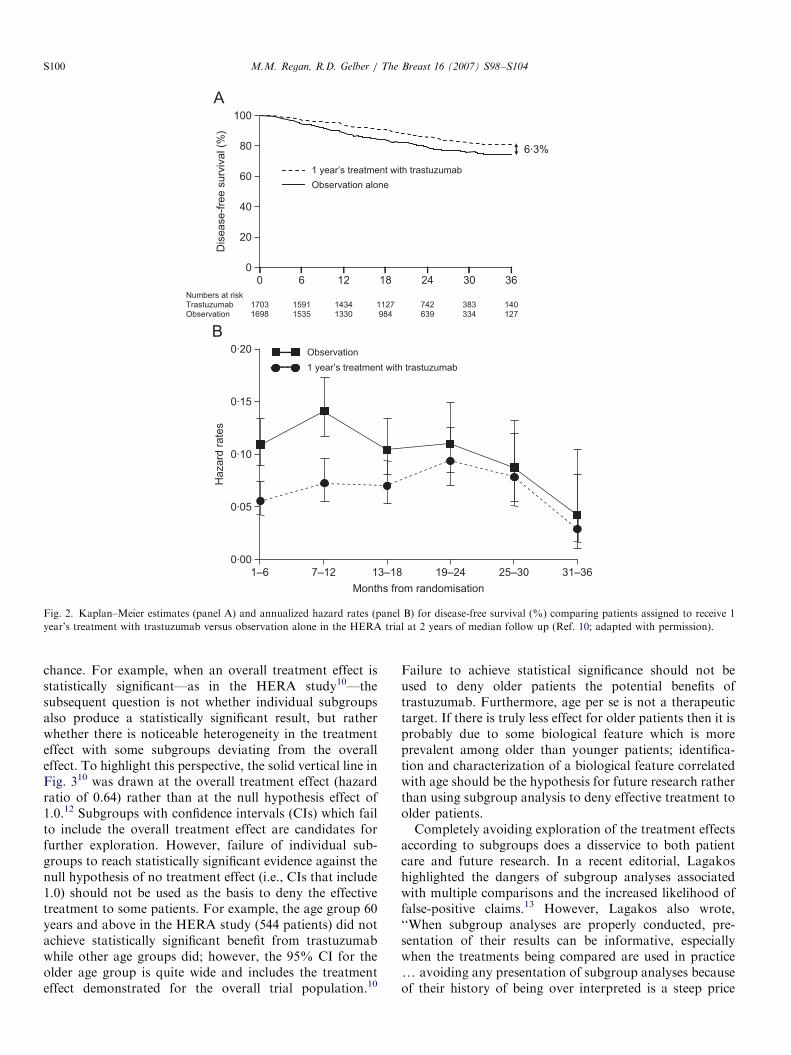
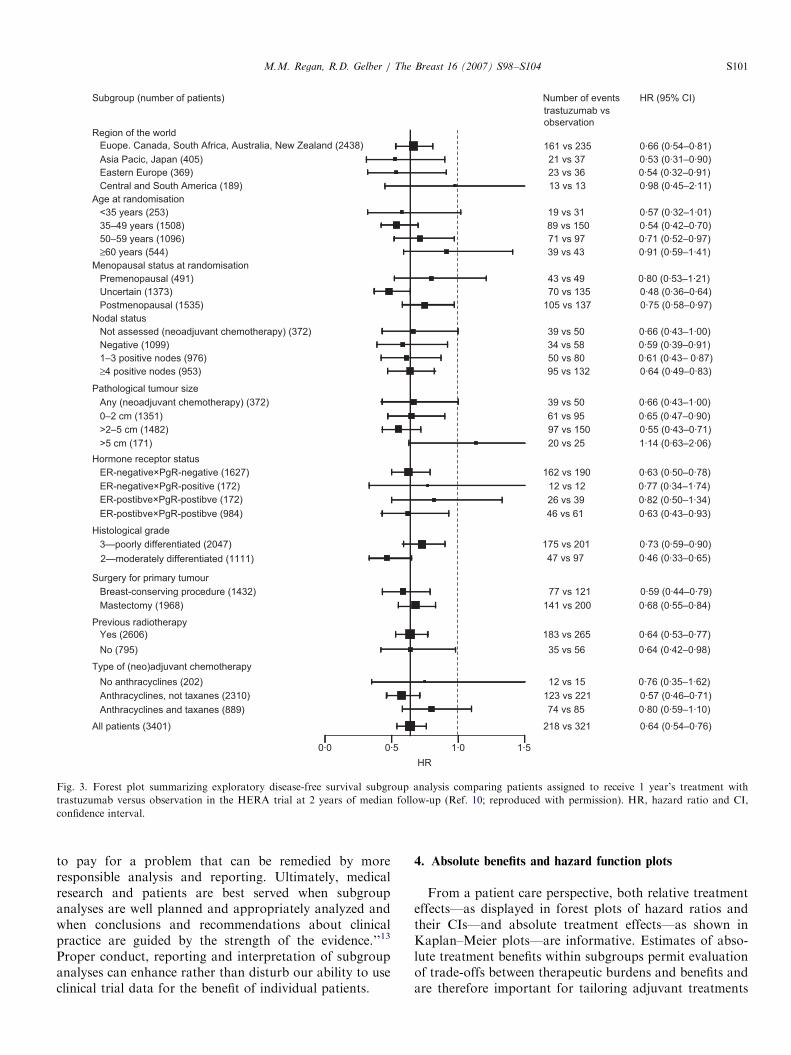
advantage for trastuzumab administered following com-pletion of all chemotherapy among patients with HER2-positive tumors. The overall results comparing 1703patients in the 1-year trastuzumab group with 1698patients in the observation group showed a 36% reductionin the relative risk of a disease-free survival event(Po0.0001) and a 6.3% increase in the absolute disease-free survival percentage at 3 years favoring the treatedgroup (Fig. 2A).10 A forest plot of the hazard ratiossummarizing exploratory subgroup analyses suggestedtreatment benefit for all evaluated subgroups (Fig. 3).10
Cautious interpretation of retrospective subgroup ana-lyses is required.11–13 This caution is justified given the highlikelihood that observed differences in treatment effectsaccording to subgroups could result from the play of
ARTICLE IN PRESS
17031698
15911535
14341330
1127984
742639
383334
140127
Dis
ease-f
ree s
urv
ival (%
)
Numbers at riskTrastuzumabObservation
1 year’s treatment with trastuzumab
Observation alone
100
80
60
40
20
0
6·3%
Observation
1 year’s treatment with trastuzumab
0·00
0·05
0·10
0·15
0·20
1–6 7–12 13–18 19–24 25–30 31–36
Ha
za
rd r
ate
s
Months from randomisation
0 302418126 36
Fig. 2. Kaplan–Meier estimates (panel A) and annualized hazard rates (panel B) for disease-free survival (%) comparing patients assigned to receive 1
year’s treatment with trastuzumab versus observation alone in the HERA trial at 2 years of median follow up (Ref. 10; adapted with permission).
M.M. Regan, R.D. Gelber / The Breast 16 (2007) S98–S104S100
chance. For example, when an overall treatment effect isstatistically significant—as in the HERA study10—thesubsequent question is not whether individual subgroupsalso produce a statistically significant result, but ratherwhether there is noticeable heterogeneity in the treatmenteffect with some subgroups deviating from the overalleffect. To highlight this perspective, the solid vertical line inFig. 310 was drawn at the overall treatment effect (hazardratio of 0.64) rather than at the null hypothesis effect of1.0.12 Subgroups with confidence intervals (CIs) which failto include the overall treatment effect are candidates forfurther exploration. However, failure of individual sub-groups to reach statistically significant evidence against thenull hypothesis of no treatment effect (i.e., CIs that include1.0) should not be used as the basis to deny the effectivetreatment to some patients. For example, the age group 60years and above in the HERA study (544 patients) did notachieve statistically significant benefit from trastuzumabwhile other age groups did; however, the 95% CI for theolder age group is quite wide and includes the treatmenteffect demonstrated for the overall trial population.10
Failure to achieve statistical significance should not beused to deny older patients the potential benefits oftrastuzumab. Furthermore, age per se is not a therapeutictarget. If there is truly less effect for older patients then it isprobably due to some biological feature which is moreprevalent among older than younger patients; identifica-tion and characterization of a biological feature correlatedwith age should be the hypothesis for future research ratherthan using subgroup analysis to deny effective treatment toolder patients.Completely avoiding exploration of the treatment effects
according to subgroups does a disservice to both patientcare and future research. In a recent editorial, Lagakoshighlighted the dangers of subgroup analyses associatedwith multiple comparisons and the increased likelihood offalse-positive claims.13 However, Lagakos also wrote,‘‘When subgroup analyses are properly conducted, pre-sentation of their results can be informative, especiallywhen the treatments being compared are used in practicey avoiding any presentation of subgroup analyses becauseof their history of being over interpreted is a steep price
ARTICLE IN PRESS
161 vs 235 0·66 (0·54–0·81)
Asia Paci c, Japan (405) 21 vs 37 0·53 (0·31–0·90)
Eastern Europe (369) 23 vs 36 0·54 (0·32–0·91)
Region of the world
<35 years (253) 19 vs 31 0·57 (0·32–1·01)
35–49 years (1508) 89 vs 150 0·54 (0·42–0·70)
50–59 years (1096) 71 vs 97 0·71 (0·52–0·97)
≥60 years (544) 39 vs 43 0·91 (0·59–1·41)
Premenopausal (491) 43 vs 49 0·80 (0·53–1·21)
Uncertain (1373) 70 vs 135 0·48 (0·36–0·64)
Postmenopausal (1535) 105 vs 137 0·75 (0·58–0·97)
39 vs 50Not assessed (neoadjuvant chemotherapy) (372) 0·66 (0·43–1·00)
Negative (1099) 34 vs 58 0·59 (0·39–0·91)
1–3 positive nodes (976) 50 vs 80 0·61 (0·43– 0·87)
Nodal status
Menopausal status at randomisation
Age at randomisation
Number of events
trastuzumab vs
observation
HR (95% CI)Subgroup (number of patients)
≥4 positive nodes (953) 95 vs 132 0·64 (0·49–0·83)
13 vs 13Central and South America (189) 0·98 (0·45–2·11)
162 vs 190ER-negative×PgR-negative (1627)
ER-postibve×PgR-postibve (172)
ER-postibve×PgR-postibve (984)
0·63 (0·50–0·78)
ER-negative×PgR-positive (172) 0·77 (0·34–1·74)12 vs 12
26 vs 39 0·82 (0·50–1·34)
Pathological tumour size
46 vs 61 0·63 (0·43–0·93)
175 vs 2013—poorly differentiated (2047)
2—moderately differentiated (1111)
0·73 (0·59–0·90)
47 vs 97 0·46 (0·33–0·65)
Mastectomy (1968) 141 vs 200 0·68 (0·55–0·84)
Yes (2606) 183 vs 265 0·64 (0·53–0·77)
No (795) 35 vs 56 0·64 (0·42–0·98)
123 vs 221Anthracyclines, not taxanes (2310)
Anthracyclines and taxanes (889)
0·57 (0·46–0·71)
All patients (3401) 218 vs 321 0·64 (0·54–0·76)
74 vs 85 0·80 (0·59–1·10)
Type of (neo)adjuvant chemotherapy
Previous radiotherapy
Surgery for primary tumour
No anthracyclines (202) 0·76 (0·35–1·62)12 vs 15
77 vs 121Breast-conserving procedure (1432) 0·59 (0·44–0·79)
Histological grade
>5 cm (171) 20 vs 25 1·14 (0·63–2·06)
Hormone receptor status
>2–5 cm (1482) 97 vs 150 0·55 (0·43–0·71)
0–2 cm (1351) 61 vs 95 0·65 (0·47–0·90)
39 vs 50Any (neoadjuvant chemotherapy) (372) 0·66 (0·43–1·00)
HR
0·0 1·0 1·5
Euope. Canada, South Africa, Australia, New Zealand (2438)
0·5
Fig. 3. Forest plot summarizing exploratory disease-free survival subgroup analysis comparing patients assigned to receive 1 year’s treatment with
trastuzumab versus observation in the HERA trial at 2 years of median follow-up (Ref. 10; reproduced with permission). HR, hazard ratio and CI,
confidence interval.
M.M. Regan, R.D. Gelber / The Breast 16 (2007) S98–S104 S101
to pay for a problem that can be remedied by moreresponsible analysis and reporting. Ultimately, medicalresearch and patients are best served when subgroupanalyses are well planned and appropriately analyzed andwhen conclusions and recommendations about clinicalpractice are guided by the strength of the evidence.’’13
Proper conduct, reporting and interpretation of subgroupanalyses can enhance rather than disturb our ability to useclinical trial data for the benefit of individual patients.
4. Absolute benefits and hazard function plots
From a patient care perspective, both relative treatmenteffects—as displayed in forest plots of hazard ratios andtheir CIs—and absolute treatment effects—as shown inKaplan–Meier plots—are informative. Estimates of abso-lute treatment benefits within subgroups permit evaluationof trade-offs between therapeutic burdens and benefits andare therefore important for tailoring adjuvant treatments
ARTICLE IN PRESSM.M. Regan, R.D. Gelber / The Breast 16 (2007) S98–S104S102
for individual patients. For example, the relative riskreductions associated with trastuzumab in the HERAstudy are virtually identical for patients with node-negative[tumors had to be greater than 1 cm in size (T41 cm)] andnode-positive disease (Fig. 3).10 A clinically relevantquestion is whether the absolute risk of relapse for patientswith HER2-positive, node-negative disease is high enoughfor the relative treatment benefit of trastuzumab to providesufficient absolute benefit. Assessment of the HERA datasuggests that the absolute benefit is substantial even for therelatively lower-risk cohort with node-negative disease(T41 cm), as a 15% risk of relapse within 3 years of studyentry was observed for this HER2-positive subgroup(RD Gelber, personnel communication).
An important but underutilized statistical technique isthe presentation of hazard rates over time.14 Fig. 1Bpresents the estimated annual hazard rates plotted over timefor the patients having centrally assessed hormone receptor-positive and hormone receptor-negative tumors regardlessof treatment arm in the BIG 1-98 trial. The plot portraysthe pattern of recurrence associated with hormone receptor-positive disease—events occur at a relatively low rate overtime but continue to occur with longer follow-up—and thatassociated with hormone receptor-negative cohorts—a highrate of early relapse with a reduced risk of relapse withlonger follow-up.15 Fig. 2B presents the estimated hazardrates plotted over time for the observation and 1-yeartrastuzumab treatment groups in the HERA study.10 Asubstantial trastuzumab treatment benefit is seen during theearly portion of follow-up with a reduction in the hazard ofa disease-free survival event, and less separation betweentrastuzumab and observation group hazard rates withincreasing follow-up.10 The relative hazard reductionsaccording to steroid hormone receptor status are similarat 2 years of median follow-up (Fig. 3).10 However, plots ofthe hazard functions separately for the endocrine responsive(ER-positive and/or PgR-positive) cohort and endocrinenon-responsive (ER-negative/PgR-negative) cohort in theHERA study reveal fundamentally different patterns ofrelapse (RD Gelber, personnel communication), as ob-served for the BIG 1-98 trial. The endocrine non-responsivecohort has a very high early relapse risk which declines overtime, and the trastuzumab effectiveness is seen during earlyfollow-up. By contrast the endocrine responsive cohort hasa lower overall risk of relapse which continues into the thirdyear; trastuzumab reduces the risk of relapse for this cohortduring all follow-up periods. Because the HERA study (asother trastuzumab trials) reached statistical significanceearly during follow-up, relatively few events and relativelyshort follow-up is available to assess the actual magnitudeof trastuzumab effectiveness within subgroup. Nevertheless,it is clear that patterns of event rates are different forcohorts defined by endocrine responsiveness. Futureassessments of clinical trial data should provide separateevaluations according to endocrine responsiveness andinclude hazard rate plots to highlight the time course ofevents.
5. Additional statistical methods
5.1. STEPP (subpopulation treatment effect pattern plot)
Subgroup analyses focusing on dichotomized groups toassess differential treatment effects are associated withincreased risk of false-positive findings. STEPP is anexploratory statistical method designed to assess whetherthe magnitude of the treatment effect observed in anoverall population is consistent across subpopulations ofpatients distinguished according to a continuously mea-sured covariate of interest. STEPP analyses have beendescribed previously and used to evaluate patterns oftreatment response for breast cancer therapies.16–18
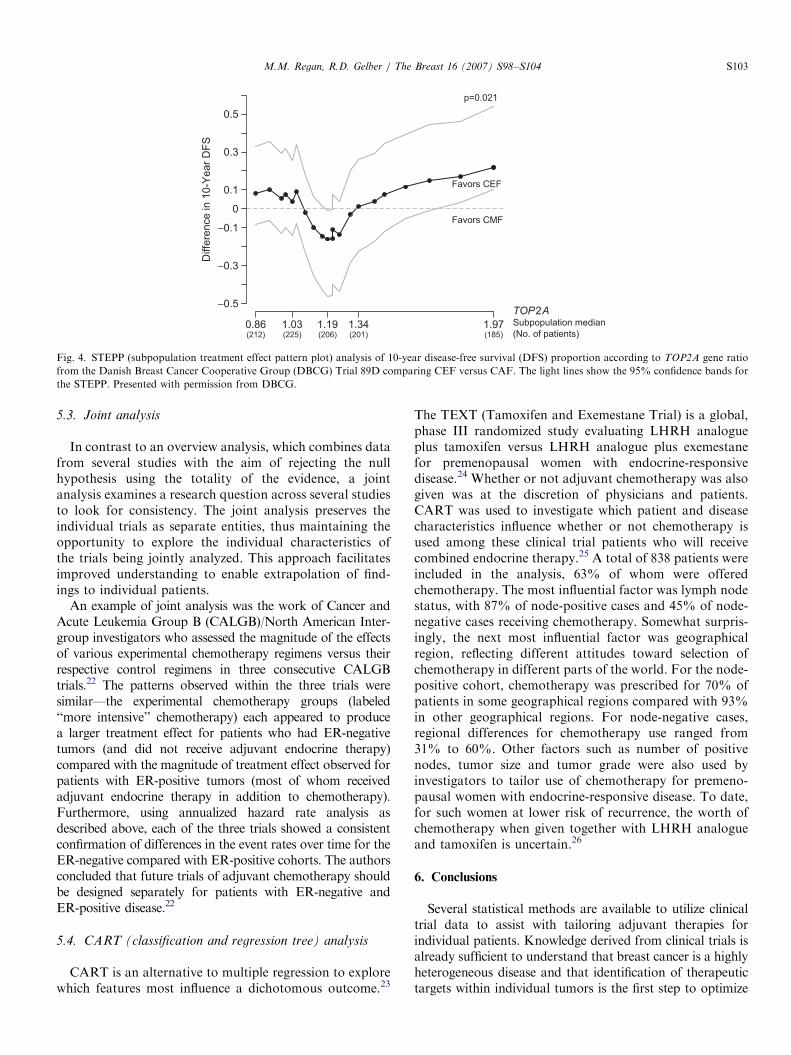
Fig. 4 illustrates a recent application of STEPP toinvestigate an issue relating to chemotherapy responsive-ness.19 Investigators from the Danish Breast Cancer Co-operative Group (DBCG) assessed TOP2A ratio determinedby FISH as the ratio between the number of gene probesignals and the number of signals for centromere 17. A totalof 718 patients randomized to either CEF (cyclophospha-mide, epirubicin, 5-fluorouracil) or CMF (cyclophosphamide,methotrexate, 5-fluorouracil) chemotherapy could be evalu-ated. The STEPP indicates a clear superiority in favor of CEFfor cohorts with low (deleted) or high (amplified) values ofTOP2A ratio. While this finding is consistent with resultsfrom other series, the STEPP analysis indicated that the cut-points ordinarily used to define deletion (o0.8) or amplifica-tion (42.0) may require adjustment for optimal selection ofcohorts which obtain the most benefit from receiving ananthracycline-based chemotherapy.19
5.2. Overview analysis
The Early Breast Cancer Trialists’ Collaborative Group(EBCTCG) has published results of meta-analyses con-ducted using all available randomized evidence to detect atreatment effect from chemotherapy, tamoxifen, ovarianablation/suppression and local therapies. The 2005 reporton systemic adjuvant therapies re-affirms the long-standingbeneficial effects of chemotherapy to reduce the risk ofrelapse, breast cancer mortality and overall mortality.20
The magnitude of the benefit of chemotherapy is clearlylarger for younger women (those less than 50 years of age)than it is for older women (especially for women in their60 s). As age is not a therapeutic target, a recent effort waslaunched by the EBCTCG to assess the effects ofchemotherapy among patients with tumors classified asER-poor. The analysis demonstrates substantial andsignificant effects of chemotherapy obtained for patientswith ER-poor tumors irrespective of patient age; themagnitude of the treatment effect for patients in their60 s was similar to that observed for women below 50 yearsof age.21 Exploration of biologically motivated subgroupscan provide information that is particularly relevant for thecare of individual patients.
ARTICLE IN PRESS
0.86(212)
1.03(225)
1.19(206)
1.34(201)
1.97(185)
−0.5
−0.3
−0.1
0
0.1
0.3
0.5
Diffe
rence in 1
0-Y
ear
DF
S
TOP2ASubpopulation median
(No. of patients)
Favors CMF
Favors CEF
p=0.021
Fig. 4. STEPP (subpopulation treatment effect pattern plot) analysis of 10-year disease-free survival (DFS) proportion according to TOP2A gene ratio
from the Danish Breast Cancer Cooperative Group (DBCG) Trial 89D comparing CEF versus CAF. The light lines show the 95% confidence bands for
the STEPP. Presented with permission from DBCG.
M.M. Regan, R.D. Gelber / The Breast 16 (2007) S98–S104 S103
5.3. Joint analysis
In contrast to an overview analysis, which combines datafrom several studies with the aim of rejecting the nullhypothesis using the totality of the evidence, a jointanalysis examines a research question across several studiesto look for consistency. The joint analysis preserves theindividual trials as separate entities, thus maintaining theopportunity to explore the individual characteristics ofthe trials being jointly analyzed. This approach facilitatesimproved understanding to enable extrapolation of find-ings to individual patients.
An example of joint analysis was the work of Cancer andAcute Leukemia Group B (CALGB)/North American Inter-group investigators who assessed the magnitude of the effectsof various experimental chemotherapy regimens versus theirrespective control regimens in three consecutive CALGBtrials.22 The patterns observed within the three trials weresimilar—the experimental chemotherapy groups (labeled‘‘more intensive’’ chemotherapy) each appeared to producea larger treatment effect for patients who had ER-negativetumors (and did not receive adjuvant endocrine therapy)compared with the magnitude of treatment effect observed forpatients with ER-positive tumors (most of whom receivedadjuvant endocrine therapy in addition to chemotherapy).Furthermore, using annualized hazard rate analysis asdescribed above, each of the three trials showed a consistentconfirmation of differences in the event rates over time for theER-negative compared with ER-positive cohorts. The authorsconcluded that future trials of adjuvant chemotherapy shouldbe designed separately for patients with ER-negative andER-positive disease.22
5.4. CART (classification and regression tree) analysis
CART is an alternative to multiple regression to explorewhich features most influence a dichotomous outcome.23
The TEXT (Tamoxifen and Exemestane Trial) is a global,phase III randomized study evaluating LHRH analogueplus tamoxifen versus LHRH analogue plus exemestanefor premenopausal women with endocrine-responsivedisease.24 Whether or not adjuvant chemotherapy was alsogiven was at the discretion of physicians and patients.CART was used to investigate which patient and diseasecharacteristics influence whether or not chemotherapy isused among these clinical trial patients who will receivecombined endocrine therapy.25 A total of 838 patients wereincluded in the analysis, 63% of whom were offeredchemotherapy. The most influential factor was lymph nodestatus, with 87% of node-positive cases and 45% of node-negative cases receiving chemotherapy. Somewhat surpris-ingly, the next most influential factor was geographicalregion, reflecting different attitudes toward selection ofchemotherapy in different parts of the world. For the node-positive cohort, chemotherapy was prescribed for 70% ofpatients in some geographical regions compared with 93%in other geographical regions. For node-negative cases,regional differences for chemotherapy use ranged from31% to 60%. Other factors such as number of positivenodes, tumor size and tumor grade were also used byinvestigators to tailor use of chemotherapy for premeno-pausal women with endocrine-responsive disease. To date,for such women at lower risk of recurrence, the worth ofchemotherapy when given together with LHRH analogueand tamoxifen is uncertain.26
6. Conclusions
Several statistical methods are available to utilize clinicaltrial data to assist with tailoring adjuvant therapies forindividual patients. Knowledge derived from clinical trials isalready sufficient to understand that breast cancer is a highlyheterogeneous disease and that identification of therapeutictargets within individual tumors is the first step to optimize
ARTICLE IN PRESSM.M. Regan, R.D. Gelber / The Breast 16 (2007) S98–S104S104
therapy. Subsequent tailoring requires information fromproperly conducted subgroup analyses and a considerationof both the underlying risk of disease recurrence and patientpreferences that influence treatment choice.
Conflict of Interest Statement
None declared.
Acknowledgments
We thank the patients, investigators, nurses, data man-agers and all others who participate in the InternationalBreast Cancer Study Group (IBCSG) trials. We specificallyacknowledge the contributions of Alan Coates, Shari Gelber,Aron Goldhirsch and Karen Price to the St. Gallenpresentation. Funding for IBCSG central coordination, datamanagement, and statistics provided by Swiss Group forClinical Cancer Research (SAKK), Frontier Science andTechnology Research Foundation (FSTRF), The CancerCouncil Australia, Australian New Zealand Breast CancerTrials Group (National Health Medical Research Council),National Cancer Institute (CA-75362), Swedish CancerSociety, and the Foundation for Clinical Cancer Researchof Eastern Switzerland (OSKK). We thank the HERA TrialStudy Team, the BIG 1-98 Collaborative Group, and theDanish Breast Cancer Cooperative Group for permission topresent data and figures.
References
1. Sorlie T, Perou CM, Tibshirani R, et al. Gene expression patterns of
breast carcinomas distinguish tumor subclasses with clinical implica-
tions. Proc Natl Acad Sci USA 2001;98:10869–74.
2. Goldhirsch A, Glick JH, Gelber RD, et al. Meeting highlights:
international expert consensus on the primary therapy of early breast
cancer 2005. Ann Oncol 2005;16:1569–83.
3. Piccart-Gebhart MJ, Procter M, Leyland-Jones B, et al. for the
HERA study team. Trastuzumab after adjuvant chemotherapy in
HER2-positive breast cancer. N Engl J Med 2005;353:1659–72.
4. Romond EH, Perez EA, Bryant J, et al. Trastuzumab plus adjuvant
chemotherapy for operable HER2-positive breast cancer. N Engl J
Med 2005;353:1673–84.
5. Goldhirsch A, Coates AS, Gelber RD, et al. First—select the target:
better choice of adjuvant treatments for breast cancer patients. Ann
Oncol 2006;17:1772–6.
6. BIG1-98 Collaborative Group. A comparison of letrozole and
tamoxifen in postmenopausal women with early breast cancer. N
Engl J Med 2005;353:2747–57.
7. Coates AS, Keshaviah A, Thurlimann B, for the BIG 1-98
Collaborative and International Breast Cancer Study Groups, et al.
Five years of letrozole compared with tamoxifen as initial adjuvant
therapy for postmenopausal women with endocrine-responsive early
breast cancer: update of study BIG 1-98. J Clin Oncol 2007;25:486–92.
8. Viale G, Regan MM, Maiorano E, et al., for the BIG 1-98
Collaborative and International Breast Cancer Study Groups.
Prognostic and predictive value of centrally reviewed expression of
estrogen and progesterone receptors in a randomized trial comparing
letrozole and tamoxifen adjuvant therapy for postmenopausal women
with early breast cancer: results from study BIG 1-98 J Clin Oncol, in
press, doi:10.1200/JCO.2007.11.9453.
9. Piccart-Gebhart MJ, Perez EA, Baselga J, et al. ALTTO (adjuvant
lapatinib and/or trastuzumab treatment optimization) study [BIG 2-
06/N063D/EGF 106708]: a phase III study for HER2-overexpressing
early breast cancer (BC). The Breast 2007;16(Suppl. 1):S33 [Abstract
P118].
10. Smith I, Procter M, Gelber RD, et al. for the HERA Study team.
2-year follow-up of trastuzumab after adjuvant chemotherapy in
HER2-positive breast cancer: a randomized controlled trial. Lancet
2007;369:29–36.
11. Peto R. Statistical aspects of cancer trials. In: Halnan K, editor. The
treatment of cancer. London: Chapman & Hall; 1982. p. 867–71.
12. Cuzick J. Forest plots and the interpretation of subgroups. Lancet
2005;365:1308.
13. Lagakos SW. The challenge of subgroup analyses—reporting without
distorting. N Engl J Med 2006;354:1667–9.
14. Simes RJ, Zelen M. Exploratory data analysis and the use of the
hazard function for interpreting survival data: an investigator’s
primer. J Clin Oncol 1985;3:1418–31.
15. Saphner T, Tormey DC, Gray R. Annual hazard rates of recurrence
for breast cancer after primary therapy. J Clin Oncol 1996;14:2738–46.
16. Bonetti M, Gelber RD. A graphical method to assess treatment—
covariate interactions using the Cox model on subsets of the data. Stat
Med 2000;19:2595–609.
17. Bonetti M, Gelber RD. Patterns of treatment effects in subsets of
patients in clinical trials. Biostatistics 2004;5:465–81.
18. Regan MM, Gelber RD, for the International Breast Cancer Study
Group. Predicting response to systemic treatments; learning from the
past to plan for the future. Breast 2006;14:582–93.
19. Gunnarsdottir K, Jensen M-B, Zahrieh D, et al. CEF is superior to
CMF for tumors with topoisomerase IIa gene alterations; a STEPP
(subpopulation treatment effect pattern plot) analysis on Danish
Breast Cancer Cooperative Group study 89D. Breast Cancer Res
Treat 2006;100(Suppl. 1):S46 [Abstract 1023].
20. Early Breast Cancer Trialists’ Collaborative Group. Effects of
chemotherapy and hormonal therapy for early breast cancer on
recurrence and 15-year survival: an overview of the randomized trials.
Lancet 2005;365:1678–717.
21. Early Breast Cancer Trialists’ Collaborative Group (EBCTCG).
Adjuvant polychemotherapy in oestrogen-receptor-poor breast can-
cer: meta-analysis of individual patient data from the randomized
trials [in preparation].
22. Berry DA, Cirrincione C, Henderson IC, et al. Estrogen-receptor
status and outcomes of modern chemotherapy for patients with node-
positive breast cancer. JAMA 2006;295:1658–67.
23. Venables WN, Ripley BD. Modern applied statistics with S, 4th ed.
New York: Springer; 2002. p. 251–69.
24. Price KN, Goldhirsch A. Clinical trial update: International Breast
Cancer Study Group. Breast Cancer Res 2005;7:252–4.
25. Regan MM, Pagani O, Walley B, et al. Premenopausal endocrine-
responsive breast cancer: For whom is chemotherapy chosen?
[manuscript in preparation].
26. International Breast Cancer Study Group. Randomized controlled
trial of ovarian function suppression plus tamoxifen versus the same
endocrine therapy plus chemotherapy: Is chemotherapy necessary for
premenopausal women with node-positive, endocrine responsive
breast cancer? First results of International Breast Cancer Study
Group Trial 11-93. The Breast 2001;10(Suppl 3):130–8.