Embed Size (px)
Citation preview

on August 23, 2018http://rsif.royalsocietypublishing.org/Downloaded from
rsif.royalsocietypublishing.org
ResearchCite this article: Brace NL, Hedrick TL,
Theriault DH, Fuller NW, Wu Z, Betke M,
Parrish JK, Grunbaum D, Morgansen KA. 2016
Using collision cones to assess biological
deconfliction methods. J. R. Soc. Interface 13:
20160502.
http://dx.doi.org/10.1098/rsif.2016.0502
Received: 23 June 2016
Accepted: 24 August 2016
Subject Category:Life Sciences – Engineering interface
Subject Areas:biomathematics
Keywords:collision avoidance algorithm, animal
behaviour, velocity obstacles, collision cones,
nonlinear control, multi-species comparison
Author for correspondence:Natalie L. Brace
e-mail: [email protected]
Electronic supplementary material is available
at http://dx.doi.org/10.6084/m9.figshare.c.
3464580.
& 2016 The Authors. Published by the Royal Society under the terms of the Creative Commons AttributionLicense http://creativecommons.org/licenses/by/4.0/, which permits unrestricted use, provided the originalauthor and source are credited.Using collision cones to assess biologicaldeconfliction methods
Natalie L. Brace1, Tyson L. Hedrick4, Diane H. Theriault5, Nathan W. Fuller5,Zheng Wu5, Margrit Betke5, Julia K. Parrish2, Daniel Grunbaum3
and Kristi A. Morgansen1
1William E. Boeing Department of Aeronautics and Astronautics, 2School of Aquatic and Fishery Sciences,and 3School of Oceanography, University of Washington, Seattle, WA, USA4Department of Biology, University of North Carolina, Chapel Hill, NC, USA5Department of Computer Science, Boston University, Boston, MA, USA
NLB, 0000-0001-7105-5445
Biological systems consistently outperform autonomous systems governed
by engineered algorithms in their ability to reactively avoid collisions.
To better understand this discrepancy, a collision avoidance algorithm was
applied to frames of digitized video trajectory data from bats, swallows and
fish (Myotis velifer, Petrochelidon pyrrhonota and Danio aequipinnatus). Infor-
mation available from visual cues, specifically relative position and velocity,
was provided to the algorithm which used this information to define collision
cones that allowed the algorithm to find a safe velocity requiring minimal devi-
ation from the original velocity. The subset of obstacles provided to the
algorithm was determined by the animal’s sensing range in terms of metric
and topological distance. The algorithmic calculated velocities showed good
agreement with observed biological velocities, indicating that the algorithm
was an informative basis for comparison with the three species and could
potentially be improved for engineered applications with further study.
1. IntroductionAn increasingly wide array of unmanned vehicles is becoming available with a
range of form factors and ever-expanding capabilities. Fully using the enhanced
control authority and sensing that comes with these improvements in order to
effectively and safely navigate the world requires improved control algorithms
and estimation strategies capable of real-time path planning through changing
conditions and unexpected obstacles. Many biological systems display a remark-
able ability to perform such tasks during natural behaviour [1], so we look to their
example to gain insight into the principles underlying the highly effective reactive
collision avoidance abilities developed through evolution.
The study of systems theory with respect to biological behaviour, and vice
versa, has been a popular topic for many years that has resulted in a number of
advances in the understanding of biological systems and capabilities for engineered
systems. Biological models have been developed to describe the emergence of self-
organization and other collective behaviour in large groups of animals, including
schooling and shoaling fish, flocking birds, swarming insects and herding land ani-
mals [2]. A particle model was used to produce realistic flocking animations by
basing the behaviour of boids (bird-oid objects) upon the requirements of collision
avoidance, velocity matching and flock cohesion [3]. Consensus decision-making of
social groups has been studied to investigate decision-making among a group [4,5].
Not limited to studies of collective behaviour, Karaman & Frazzoli [6] developed a
theoretical framework to investigate the collision avoidance problem solved by
birds when navigating a forest at high speed and found a critical speed below
which a conflict-free path could be flown indefinitely.

rsif.royalsocietypublishing.orgJ.R.Soc.Interface
13:20160502
2
on August 23, 2018http://rsif.royalsocietypublishing.org/Downloaded from
Certain models provide insight into animals’ sensing or
cognitive limitations, which clearly impact collision avoidance
capabilities. For example, animals in a large group appear to
only take into account some smaller number of nearby animals.
The membership of, and interactions within, these smaller
groups may be dependent on a metric distance, for example,
the zonal model of shoaling fish [7], or a topological distance,
as in the model of flocking starlings [8]. Models of perception
have also been developed to investigate the use of optic flow
in birds [9] and bats [10] and even visual tracking to aid col-
lision avoidance in insects [11].
Typically, these models begin with extensive observations of
the species and develop into theories that explain or reproduce
the behaviour—the study here takes the opposite approach,
by starting with an engineered algorithm and determining
how well it correlates to observed behaviour. Dynamic collision
avoidance for autonomous vehicles is challenging and is an
ongoing topic of research. Preventing vehicles from coming
too close to static objects in a cluttered environment can be
done, however, it becomes much more challenging when
dynamic obstacles are introduced since offline or global path
planning techniques can no longer be used. A wide array of
methods have been applied to the problem of conflict resolution,
i.e. the act of identifying and avoiding future collisions, with
varying degrees of centralization and safety and convergence
guarantees [12]. Centralization refers to the distribution (or
lack thereof) of information and processing; a distributed
system falls between the extremes of global and local infor-
mation and processing, with each agent processing global
information individually. Prescribed manoeuvres, e.g. always
turn left, and force field methods, in which goals and obstacles
are treated as oppositely and similarly charged particles, have
been shown to work, but can become prohibitively complex
for a large number of vehicles [13,14]. Optimization methods
seek to find the best collision-free path with respect to some
cost function. The optimal solution can be found for all coopera-
tive agents using a centralized approach [15] or for individual
agents using a decentralized [16] or distributed [17,18] approach.
Parallels in biology can be drawn to some conflict resolution
algorithms, including model predictive control, the so-called
bug-family algorithms and certain sensor-based techniques.
A model predictive control strategy plans a safe path based on
a goal for a limited time horizon, executes the first step of that
plan, collects new information, checks for differences between
planned and actual outcomes, and repeats the process [19]—
not unlike how biological species process information [20].
Bug algorithms use a strategy requiring minimal sensing infor-
mation: head towards the target until an obstacle is detected,
then follow its boundary until the path to the target is clear
again [21]. Sensor-based techniques rely on knowledge of
some region of space near the autonomous agent that can be
sensed and used for planning; velocity obstacles fall into this cat-
egory, using relative position and speed of other agents and
obstacles to discriminate safe and unsafe velocity vectors [22,23].
The Distributed Reactive Collision Avoidance (DRCA)
algorithm uses collision cones, a version of velocity obstacles,
to provide safe paths for an arbitrary number of agents [18].
The algorithm detects conflicts (future collisions) by checking
if the current velocity falls within a collision cone. If a conflict
is detected, a safe velocity nearest the original velocity is
found and implemented in a deconfliction manoeuvre. In bio-
logical terms, this implementation assumes an animal will
continue in one direction until something in its environment
forces it to change, and then it will deviate as little as possible
from its original path. The calculations are performed for each
agent individually and require only information that can be
obtained from visual cues: velocity, bearing and range of other
agents. Visual input is noted here as it is common to all species
under study; however, for the purposes of the following analysis
the relative velocity and/or position information could come
from any sensory input. The distributed nature, lack of compli-
cated cost function and limited sensing requirements of this
algorithm make it a good candidate for comparison with biologi-
cal species. Furthermore, both birds and bats are known to use
velocity cues in target tracking by applying a version of constant
bearing, decreasing range techniques [24,25].
In this work, we compare the collision avoidance trajectories
of bats (Myotis velifer), birds (Petrochelidon pyrrhonota) and fish
(Danio aequipinnatus) to those predicted by the DRCA algor-
ithm. This paper presents an extension of the original DRCA
algorithm from two to three dimensions and corrects a previous
study done by Boardman et al. [26], which performed a similar
analysis by flattening the trajectories to two dimensions and
applying the original DRCA algorithm. The three-dimensional
analysis provides the algorithm with spatial information that
corresponds more closely to the three-dimensional environ-
ments of the animals and eliminates ‘phantom conflicts’
created by two-dimensional conflict checking. We hypothesize
that all these species will approximately match the DRCA pre-
dictions due to the overlap between DRCA processing and
sensory requirements and those likely available to the animals.
We further hypothesize that the birds and bats will agree more
closely with the DRCA predictions than the fish because one of
the DRCA assumptions—the desirability of a future trajectory
close to the current trajectory—is more likely satisfied for fast
moving flying animals in a diffuse fluid than for slower animals
in a dense fluid.
2. Material and methods2.1. Biological speciesThe species used for comparison in this study were chosen due to
their agile manoeuvring capabilities and social nature.
2.1.1. Emerging cave batsMyotis velifer are bats that roost in colonies found in caves and
tunnels. Each night they emerge in small groups after sunset
[27]. They are insectivores and use echolocation as their primary
means of sensing, although vision may also play a role in naviga-
tion [10]. An average bat in this species is 0.1 m long with a
wingspan of 0.3 m, weighs 12 g, and has a cruising speed of
5.5–6.6 m s21 [27,28].
Trajectory data were collected for 9 s and 79 s at 131.5 frames
per second as groups of 20 and 86 bats, respectively, emerged
from their cave on the Bamberger Ranch in Texas. Each bat was
in view for approximately 1.7 s with a maximum of 10 bats in
view at any one time. In addition to other animals, there were
also two static objects in their flight path: a pole 1.6 m tall and a
vine 0.2 m wide extending from the ground to the forest canopy.
The bats’ trajectories and the static objects are depicted in figure 1.
The cave bats were filmed in low light using three mid-infrared
FLIR SC8000 cameras at a resolution of 1024 � 1024 pixels [26].
Camera calibration was performed for both bats and swallows
(see below) by passing a 1 m long reference object through the
shared field of view and applying a structure-from-motion algor-
ithm [29]. Correspondences between the views were made using
2
0m
mm
–25
0
–50
5
frame
1180
1
10
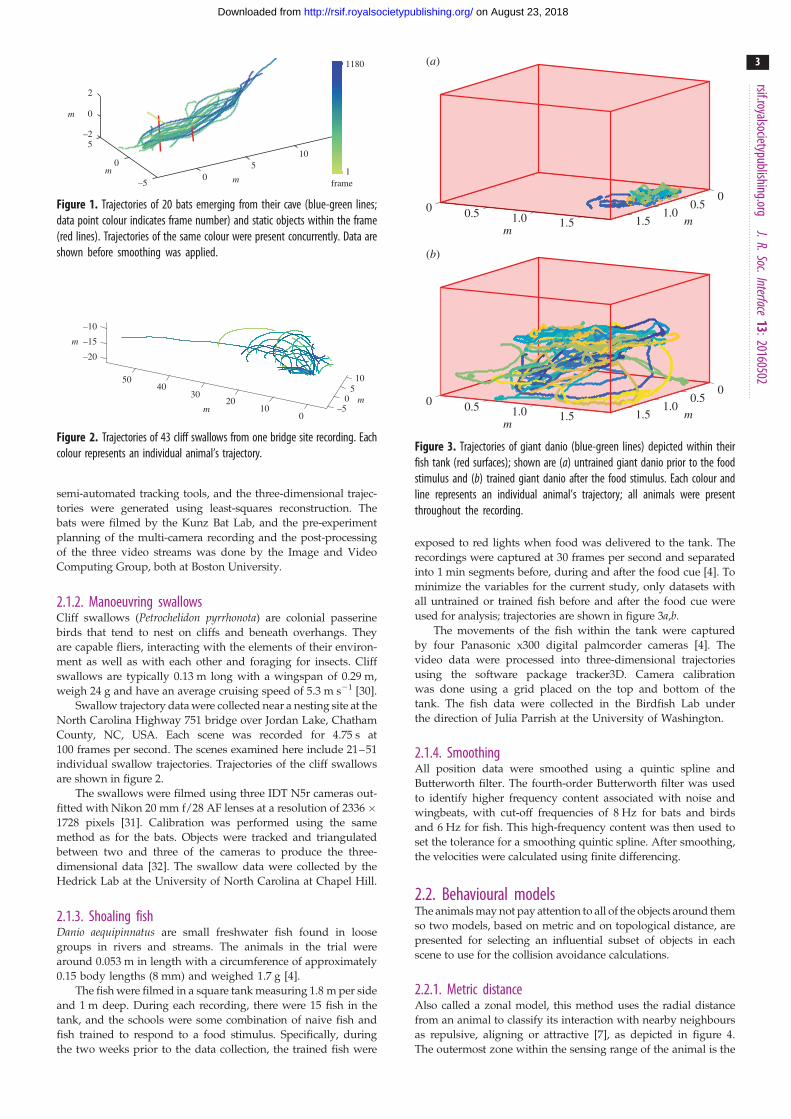
Figure 1. Trajectories of 20 bats emerging from their cave (blue-green lines;data point colour indicates frame number) and static objects within the frame(red lines). Trajectories of the same colour were present concurrently. Data areshown before smoothing was applied.
–10
–15m
mm
–20
5040
3020
100
105
0–5
Figure 2. Trajectories of 43 cliff swallows from one bridge site recording. Eachcolour represents an individual animal’s trajectory.
00.50
m1.00.5
m1.0 1.51.5
00.50
m1.00.5
m1.0 1.51.5
(a)
(b)
Figure 3. Trajectories of giant danio (blue-green lines) depicted within theirfish tank (red surfaces); shown are (a) untrained giant danio prior to the foodstimulus and (b) trained giant danio after the food stimulus. Each colour andline represents an individual animal’s trajectory; all animals were presentthroughout the recording.
rsif.royalsocietypublishing.orgJ.R.Soc.Interface
13:20160502
3
on August 23, 2018http://rsif.royalsocietypublishing.org/Downloaded from
semi-automated tracking tools, and the three-dimensional trajec-
tories were generated using least-squares reconstruction. The
bats were filmed by the Kunz Bat Lab, and the pre-experiment
planning of the multi-camera recording and the post-processing
of the three video streams was done by the Image and Video
Computing Group, both at Boston University.
2.1.2. Manoeuvring swallowsCliff swallows (Petrochelidon pyrrhonota) are colonial passerine
birds that tend to nest on cliffs and beneath overhangs. They
are capable fliers, interacting with the elements of their environ-
ment as well as with each other and foraging for insects. Cliff
swallows are typically 0.13 m long with a wingspan of 0.29 m,
weigh 24 g and have an average cruising speed of 5.3 m s21 [30].
Swallow trajectory data were collected near a nesting site at the
North Carolina Highway 751 bridge over Jordan Lake, Chatham
County, NC, USA. Each scene was recorded for 4.75 s at
100 frames per second. The scenes examined here include 21–51
individual swallow trajectories. Trajectories of the cliff swallows
are shown in figure 2.
The swallows were filmed using three IDT N5r cameras out-
fitted with Nikon 20 mm f/28 AF lenses at a resolution of 2336 �1728 pixels [31]. Calibration was performed using the same
method as for the bats. Objects were tracked and triangulated
between two and three of the cameras to produce the three-
dimensional data [32]. The swallow data were collected by the
Hedrick Lab at the University of North Carolina at Chapel Hill.
2.1.3. Shoaling fishDanio aequipinnatus are small freshwater fish found in loose
groups in rivers and streams. The animals in the trial were
around 0.053 m in length with a circumference of approximately
0.15 body lengths (8 mm) and weighed 1.7 g [4].
The fish were filmed in a square tank measuring 1.8 m per side
and 1 m deep. During each recording, there were 15 fish in the
tank, and the schools were some combination of naive fish and
fish trained to respond to a food stimulus. Specifically, during
the two weeks prior to the data collection, the trained fish were
exposed to red lights when food was delivered to the tank. The
recordings were captured at 30 frames per second and separated
into 1 min segments before, during and after the food cue [4]. To
minimize the variables for the current study, only datasets with
all untrained or trained fish before and after the food cue were
used for analysis; trajectories are shown in figure 3a,b.
The movements of the fish within the tank were captured
by four Panasonic x300 digital palmcorder cameras [4]. The
video data were processed into three-dimensional trajectories
using the software package tracker3D. Camera calibration
was done using a grid placed on the top and bottom of the
tank. The fish data were collected in the Birdfish Lab under
the direction of Julia Parrish at the University of Washington.
2.1.4. SmoothingAll position data were smoothed using a quintic spline and
Butterworth filter. The fourth-order Butterworth filter was used
to identify higher frequency content associated with noise and
wingbeats, with cut-off frequencies of 8 Hz for bats and birds
and 6 Hz for fish. This high-frequency content was then used to
set the tolerance for a smoothing quintic spline. After smoothing,
the velocities were calculated using finite differencing.
2.2. Behavioural modelsThe animals may not pay attention to all of the objects around them
so two models, based on metric and on topological distance, are
presented for selecting an influential subset of objects in each
scene to use for the collision avoidance calculations.
2.2.1. Metric distanceAlso called a zonal model, this method uses the radial distance
from an animal to classify its interaction with nearby neighbours
as repulsive, aligning or attractive [7], as depicted in figure 4.
The outermost zone within the sensing range of the animal is the
dr
dalign
da
Figure 4. In the zonal model, radii around the focus animal (black) definethe type of interaction with other animals: those within dr (red) are repulsive,those between dr and dalign (blue) are neutral or aligning, and those betweendalign and da (green) are attractive. Animals outside of da (grey) are notsensed or are ignored.
focalfish
influentialneighbours
Figure 5. In the topological distance model, a set of animals nearest thefocal animal (black) is considered to comprise influential neighbours(green). Animals outside this inner grouping (grey) are not considered bythe focal animal.
collisioncones ofagents inconflict
velocityconstraint
feasibleoptima
vi*
vj vi
vij
rijb
a
dsep,ij
dsep,ij
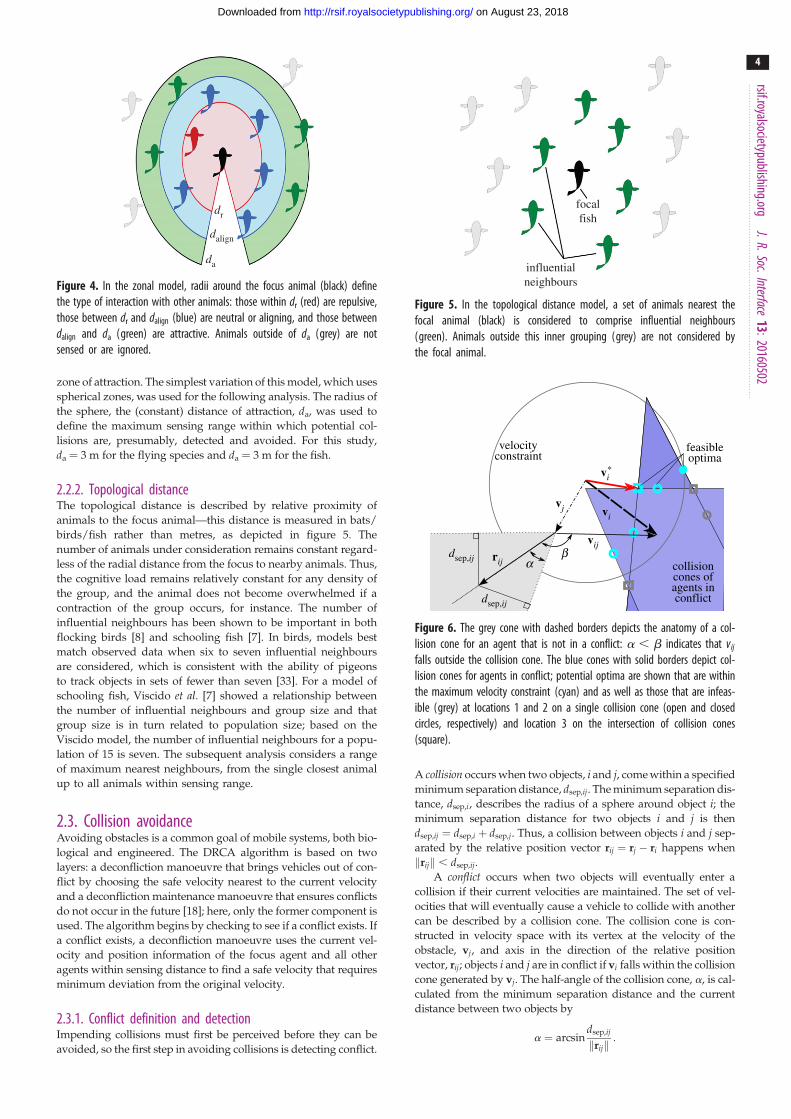
Figure 6. The grey cone with dashed borders depicts the anatomy of a col-lision cone for an agent that is not in a conflict: a , b indicates that vij
falls outside the collision cone. The blue cones with solid borders depict col-lision cones for agents in conflict; potential optima are shown that are withinthe maximum velocity constraint (cyan) and as well as those that are infeas-ible (grey) at locations 1 and 2 on a single collision cone (open and closedcircles, respectively) and location 3 on the intersection of collision cones(square).
rsif.royalsocietypublishing.orgJ.R.Soc.Interface
13:20160502
4
on August 23, 2018http://rsif.royalsocietypublishing.org/Downloaded from
zone of attraction. The simplest variation of this model, which uses
spherical zones, was used for the following analysis. The radius of
the sphere, the (constant) distance of attraction, da, was used to
define the maximum sensing range within which potential col-
lisions are, presumably, detected and avoided. For this study,
da ¼ 3 m for the flying species and da ¼ 3 m for the fish.
2.2.2. Topological distanceThe topological distance is described by relative proximity of
animals to the focus animal—this distance is measured in bats/
birds/fish rather than metres, as depicted in figure 5. The
number of animals under consideration remains constant regard-
less of the radial distance from the focus to nearby animals. Thus,
the cognitive load remains relatively constant for any density of
the group, and the animal does not become overwhelmed if a
contraction of the group occurs, for instance. The number of
influential neighbours has been shown to be important in both
flocking birds [8] and schooling fish [7]. In birds, models best
match observed data when six to seven influential neighbours
are considered, which is consistent with the ability of pigeons
to track objects in sets of fewer than seven [33]. For a model of
schooling fish, Viscido et al. [7] showed a relationship between
the number of influential neighbours and group size and that
group size is in turn related to population size; based on the
Viscido model, the number of influential neighbours for a popu-
lation of 15 is seven. The subsequent analysis considers a range
of maximum nearest neighbours, from the single closest animal
up to all animals within sensing range.
2.3. Collision avoidanceAvoiding obstacles is a common goal of mobile systems, both bio-
logical and engineered. The DRCA algorithm is based on two
layers: a deconfliction manoeuvre that brings vehicles out of con-
flict by choosing the safe velocity nearest to the current velocity
and a deconfliction maintenance manoeuvre that ensures conflicts
do not occur in the future [18]; here, only the former component is
used. The algorithm begins by checking to see if a conflict exists. If
a conflict exists, a deconfliction manoeuvre uses the current vel-
ocity and position information of the focus agent and all other
agents within sensing distance to find a safe velocity that requires
minimum deviation from the original velocity.
2.3.1. Conflict definition and detectionImpending collisions must first be perceived before they can be
avoided, so the first step in avoiding collisions is detecting conflict.
A collision occurs when two objects, i and j, come within a specified
minimum separation distance, dsep,ij. The minimum separation dis-
tance, dsep,i, describes the radius of a sphere around object i; the
minimum separation distance for two objects i and j is then
dsep,ij ¼ dsep,i þ dsep,j. Thus, a collision between objects i and j sep-
arated by the relative position vector rij ¼ rj � ri happens when
krijk , dsep,ij.
A conflict occurs when two objects will eventually enter a
collision if their current velocities are maintained. The set of vel-
ocities that will eventually cause a vehicle to collide with another
can be described by a collision cone. The collision cone is con-
structed in velocity space with its vertex at the velocity of the
obstacle, vj, and axis in the direction of the relative position
vector, rij; objects i and j are in conflict if vi falls within the collision
cone generated by vj. The half-angle of the collision cone, a, is cal-
culated from the minimum separation distance and the current
distance between two objects by
a ¼ arcsindsep,ij
krijk:

velo
city
spac
epo
sitio
nsp
ace
(a) conflict is initially detected (b) collision avoidance is applied (c) conflict has passed
(d) (e) ( f )
Figure 7. The sequence of figures ( progressing from left to right) shows the evolution of an encounter with one agent (blue, solid arrows) using the DRCAalgorithm to avoid conflict with another agent (red, open arrows). Figures (a – c) are in velocity space showing the collision cones for the scenarios depictedin position space in figures (d – f ). The circles shown in velocity space correspond to the momentary speed of the agent following DRCA; the green highlightedarcs indicate safe velocities while the regions within the collision cones correspond to unsafe velocities, denoted in position space by the hashed region.
rsif.royalsocietypublishing.orgJ.R.Soc.Interface
13:20160502
5
on August 23, 2018http://rsif.royalsocietypublishing.org/Downloaded from
Defining b as the angle between the relative position and rela-
tive velocity vectors, that isb ¼ /rij �/vij, where vij ¼ vi � vj, the
criterion for conflict is simply a , b [18]. The collision cone geo-
metry for objects in and out of conflict is shown figure 6, and
stages of conflict identification and resolution are shown in figure 7.
Note that the collision cone geometry also provides a method
of intercepting another agent: selecting the velocity at the intersec-
tion of the collision cone axis with the circle of constant speed is
equivalent to a constant bearing, decreasing range strategy.
2.3.2. Deconfliction algorithmWhen a conflict is detected, the optimal safe and feasible velocity
is found. This velocity is selected by the algorithm to be outside
of all collision cones (making it safe) and to require the smallest
deviation from the current velocity (making it optimal) while
satisfying certain speed constraints dependent on the manoeuvre
type (making it feasible). The variable speed manoeuvre requires
that the velocity remain below some maximum speed, allowing
for changes in both speed and direction. Once the potential
optima, v0 i, are found, they are put in order from smallest to lar-
gest deviation from the original velocity, vi, and then each v0 i is
checked for conflicts. By construction of the ordering, the first
conflict-free v0 i is optimal. The potential optima are found at cer-
tain locations defined by the geometry of the collision cone(s)
and velocity constraint, represented by the sphere of maximum
velocity including the nearest point to vi, on
(1) a single collision cone,
(2) the intersection of a collision cone and the spherical shell of
maximum speed,
(3) two collision cones or
(4) the intersection of two collision cones and the sphere of
maximum speed.
In figure 6, locations 1–3 are depicted in a two-dimensional
version of the algorithm. Methods for finding all optima, which
use a combination of closed-form solutions and optimization
equations for numerical methods, can be found in [34].
The evolution of a variable speed deconfliction manoeuvre for
a single agent using the DRCA algorithm is shown in figure 7. The
conflict begins with the red agent travelling horizontally moving
into the detection range of the blue agent which is travelling verti-
cally. The velocity of the blue agent lies within the collision cone
generated by the red agent, indicating a conflict (figure 7a,d). To
avoid collision, the blue agent chooses a new velocity at the edge
of the collision cone nearest the original velocity; in this case, the
blue agent both adjusts its heading clockwise and increases its
speed (figure 7b,e). Once the blue agent has passed the red
agent, potential conflicts are behind it, and it can return to its
original trajectory (figure 7c,f ).
2.4. Data analysis2.4.1. DRCA with trajectory dataTo generate the basis for comparison with the trajectory data, each
animal was in turn considered as the focus (agent i) with the other
animals within the sensing range considered as dynamic obstacles.
For each frame in which the focus animal was present, conflicts
were checked for the positions and velocities of all obstacles
within sensing range. The sensing distance was determined by a
combination of metric and topological distances, so only the near-
est N animals within da of the focus were considered. If a conflict
was present, the deconfliction algorithm was used to calculate
the optimal velocity, v�i . If animals were already closer than the
minimum separation distance and thus considered in a collision,
the frame was excluded from consideration. Also, to exclude any
swallows attempting to land, the DRCA was not applied to
frames where swallow velocity was less than 3 m s21.

3.0
3.3
3.6
z (m
)
–3 –2 –1 0y (m)
3.0
3.3
3.6
x (m
)
frame
29
53focus 5focus 14
Figure 8. Side and overhead view of two swallow trajectories (blue markersindicate positions, with colour indicating frame number) including a series ofconflicts (red circled points). The DRCA optimal velocities without accelerationbounds are shown as exaggerated lines for correlated (black) and uncorrelated(grey) frames.
80
100
n
rsif.royalsocietypublishing.orgJ.R.Soc.Interface
13:20160502
6
on August 23, 2018http://rsif.royalsocietypublishing.org/Downloaded from
The algorithmic parameters dsep and vmax were determined
based on the biological characteristics of each species. The mini-
mum required separation distance for each of the flying species
was approximately half of the wingspan, dsep,bats ¼ 0:15 m and
dsep,swallows ¼ 0:2 m, and for the fish it was half of a body
length, dsep,fish ¼ ½0:0025 m OR 25 mm�. The speed for the maxi-
mum velocity requirement was set higher than the typical
cruising speed found in the literature for the bats and swallows,
at 11 and 18 m s21, and based on the maximum used in
models of fish behaviour set at 0.6 m s21 (12 body lengths per
second [7]).
The analyses were performed with and without maximum
acceleration bounds on the DRCA velocity. Acceleration bounds
were applied by scaling the difference between the original vel-
ocity and DRCA optimal velocity, that is v�i � vi, to a maximum
acceptable change between frames and using the scaled value as
the optimal for comparison. This scaling was done to provide
more interpretable results in cases where DRCA called for a dra-
matic acceleration because accelerations in the algorithm are
not constrained and have no optimization cost, whereas accelera-
tions by animals are both constrained and costly. Maximum
accelerations for each species were set based on the observed
frame-to-frame accelerations. For the flying species, this value
was equivalent to maximum accelerations of three times gravity,
or 0.23 and 0.3 m s21 change in speed between frames for the
bats and swallows, respectively, and 0.05 m s21 change between
frames for the fish.
bats birds fish0
20
40
60
perc
ent c
orre
latio
Figure 9. The per cent correlation for each species with (darker bar withborder on the right) and without (lighter bar on the left) accelerationlimits applied to the DRCA optimal velocity. The error bars indicate one stan-dard deviation above and below the mean per cent correlation (error valuesabove 100% are not shown).
2.4.2. Comparison metricFor every conflict, each DRCA optimal velocity, v�i , was compared
to the observed velocity, voi , defined as the velocity required to get
to the focus animals’ position 50 ms later; this time lapse was
chosen to approximate the animal’s reaction times, as around
half of a locomotor cycle for the flying species [35,36] and one-
sixth of a tail beat cycle for the fish [37]. The metric used was the
normed difference between the velocity vectors in three dimen-
sions, Dv ¼ jjv�i � voi jj, and was calculated for each frame in
which the focus animal experienced a conflict. The correlation per-
centage was defined for each animal as the portion of Dv falling
below a threshold, Dvth, defined as 1 m s21, or half of 1 s.d. of vel-
ocities, for the flying species, and 0.4 m s21, or 1 s.d., for the fish.
The mean and standard deviation of the correlation percentage
for all animals that experienced at least one conflict was calculated
for each species. Interactions between animals typically lasted mul-
tiple frames, and each animal involved had a unique Dv; an
example encounter between two swallows is shown in figure 8.
3. ResultsIn general, avoidance manoeuvres in all three species agreed
with the DRCA optimal velocity. Following our basic stan-
dard for agreement (see §2.4.2), the swallows were in
agreement more than 90% of the time, fish greater than
80% of the time and bats greater than 70% of time (figure 9).
Agreement between DRCA and observed animal motion
was enhanced in all cases by limiting the maximum accelera-
tion used in the avoidance manoeuvre (figure 9), although in
most cases the improvement in agreement between model
and animal was slight.
As expected, increasing the stringency of the standard for
agreement between DRCA and animal motion reduced the
overall correlation between the two (figure 10). The swallows
showed the highest correlation at all levels; however, the rela-
tive order of the bats and fish changed around a single
standard deviation.
Increasing the topological distance from considering a
single animal to all nearby animals does lead to an increase
in correlation between DRCA and the biological data for up
to seven nearest neighbours in all species (figure 11). The size
of the improvement becomes small after considering five near-
est neighbours; however, there was a dearth of instances of
more than three nearest neighbours in the swallow data and
a lack of data points for more than five nearest neighbours in
the bat data when limited to the 3 m metric range.
4. DiscussionOur initial hypotheses that animal motion would agree with
DRCA optimal velocity was supported—we found marked
correlation between DRCA optimal velocity and animal
motion in three evolutionarily, physiologically and
biomechanically distinct vertebrate species.
Our further hypothesis that DRCA-like avoidance
manoeuvres would be most common in flying species (birds
and bats) versus swimming species (fish) was not supported.
The birds (Cliff swallows) did have the highest overall

0
20
2sD vth size
s 3s 4s
40
60
80
100
perc
ent c
orre
latio
n
batsbirdsfish
Figure 10. The per cent correlation as a function of Dvth for bats (bluedashed), birds (green dashed-dot) and fish (red solid) with (thin line) andwithout (thick line) acceleration limits applied to the DRCA optimal velocity;markers indicate values that appear in figures 9 and 11. The x-axis is scaledby the standard deviation for each species, which is 2 m s21 for the flyingspecies and 0.04 m s21 for the fish.
1 3 5 7 allmaximum nearest neighbours
70
75
80
85
90
95
100
perc
ent c
orre
latio
n
batsbirdsfish
Figure 11. The per cent correlation for bats (blue squares with dashed line),birds (green circles with dashed-dot line) and fish (red triangles with solidline) without acceleration limits applied to the DRCA optimal velocity foreach species for a range of maximum topological distances ranging fromone to all possible animals within the metric range (3 m for flying speciesand 0.3 m for fish).
rsif.royalsocietypublishing.orgJ.R.Soc.Interface
13:20160502
7
on August 23, 2018http://rsif.royalsocietypublishing.org/Downloaded from
agreement with DRCA, but bats (cave bats) had the lowest.
The factors that produced the discrepancy are not clear, but it
may relate to the different sensory systems employed by
birds versus bats (vision versus vision and sonar) or the differ-
ent behavioural contexts represented in the data. The swallows
were in a mixed flock with birds moving in all directions,
whereas the bats were in a directional flock with all animals
generally moving in the same direction; this overall flock
direction may add an additional constraint to behaviour that
reduces correlation with DRCA. Despite the algorithm pre-
venting group alignment or attraction behaviours to meet its
primary objective of avoiding collisions, the correlations are
still quite good.
Topological distance has been shown to be more important
in animal group behaviour, however, metric distance may be
important with regard to collision avoidance, and we exam-
ined fit to DRCA over a range of metric distance thresholds
(see the electronic supplementary material, figure). In general,
results parallel the topological analysis because the conditions
largely overlap, e.g. a small metric distance threshold is likely
to include only one or two topological neighbours, so increases
in the metric threshold correspond to increasing agree-
ment with DRCA in all species. One exception lies in bats,
which exhibit maximum agreement at a non-maximal metric
threshold, suggesting that metric information may play a role
in this species or behaviour; confirmation would require a
larger dataset with a greater range of discordant metric and
topological thresholds.
Although all three species correlated with DRCA, we do
not suggest that the animals are actually using this algorithm.
Instead, we believe that because DRCA operates from a single
agent perspective using limited sensory information, it natu-
rally matches many of the limitations under which animals
operate and therefore produces similar behaviour in many
cases. Thus, investigation of specific cases of agreement or
disagreement between DRCA optimal velocity and actual
animal motion is likely to reveal other trade-offs under which
animals operate. For example, flying animals may prefer avoid-
ance manoeuvres that preserve total (kinetic and potential)
energy, flying up when slowing and down when speeding
up, to avoid having to recreate that energy from metabolic
supplies later. The DRCA algorithm could potentially be
used to investigate ‘higher stakes’ cases of collision avoidance,
such as chases or predator–prey interactions, by comparing the
optimal velocity to that of the fleeing animal; specifically,
increasing the required dsep would simulate a greater desi-
red separation or higher risk scenario and generate larger
magnitude changes in velocity correspondingly.
From the engineering perspective, a similar, more detailed
study of individual conflicts could be used to identify cases
where there are smaller or larger deviations between the algor-
ithm and the observed behaviour in order to determine what
situations lead to more or less agreement. This investigation
could then inform an engineered system when to follow the
algorithm and when to employ more or less conservative
actions based on biological examples.
Ethics. The bat observation protocol was approved by Boston Univer-sity Institutional Animal Care and Use Committee (IACUC). Theswallow observation protocol was approved by the University ofNorth Carolina at Chapel Hill IACUC; no government permitswere required for field observation of the bats and birds. The fishexperimental protocol was approved by the University ofWashington IACUC protocol no. 2994-06.
Data accessibility. Data are available from the Dryad Digital Repositoryat: http://dx.doi.org/10.5061/dryad.533gf [38].
Authors’ contributions. N.B. developed the three-dimensional algorithm,carried out the data analysis and drafted the manuscript; T.H. providedthe swallow data, helped guide the data analysis and drafted the manu-script; D.T., N.F., Z.W. and M.B. provided the bat data and helped withanalysis and drafting of the manuscript; J.P. developed the schoolingfish experiments; D.G. developed the algorithms for tracking the fishfrom video camera data; K.M. developed the study, guided the dataanalysis and drafted the manuscript.
Competing interests. We have no competing interests.
Funding. This material is based upon work supported by the Office ofNaval Research MURI grant no. N00014-10-1-0952. N.B. and K.M.were also supported by the Air Force Office of Scientific Researchgrant no. FA9550-14-1-0398, and N.B. was supported by the NationalScience Foundation (NSF) Graduate Research Fellowship Program(DGE-1256082). D.T., N.F., Z.W. and M.B. were also supported byNSF grant no. 0910908 and J.P. and D.G. were supported by NSFgrant no. 0313250.
Acknowledgements. The authors would like to recognize Sarah Stienessenand Steven Viscido for collecting and processing the fish data.

8
on August 23, 2018http://rsif.royalsocietypublishing.org/Downloaded from
References
rsif.royalsocietypublishing.orgJ.R.Soc.Interface
13:20160502
1. Lin HT, Ros IG, Biewener AA. 2014 Through the eyesof a bird: modelling visually guided obstacle flight.J. R. Soc. Interface 11, 20140239. (doi:10.1098/rsif.2014.0239)
2. Giardina I. 2008 Collective behavior in animalgroups: theoretical models and empirical studies.HFSP J. 2, 205 – 219. (doi:10.2976/1.2961038)
3. Reynolds CW. 1987 Flocks, herds, and schools: adistributed behavioral model. SIGGRAPH Comput.Graph. 21, 25 – 34. (doi:10.1145/37402.37406)
4. Stienessen SC, Parrish JK. 2013 The effect ofdisparate information on individual fish movementsand emergent group behavior. Behav. Ecol. 24,1150 – 1160. (doi:10.1093/beheco/art042)
5. Kao AB, Miller N, Torney C, Hartnett A, Cousin ID.2014 Collective learning and optimal consensusdecisions in social animal groups. PLoS Comput. Biol.10, E1003762. (doi:10.1371/journal.pcbi.1003762)
6. Karaman S, Frazzoli E. 2012 High-speed flight in anergodic forest. In Proc. IEEE Int. Conf. Robot Autom.Saint Paul, MN, USA, pp. 2899 – 2906. Piscataway,NJ: IEEE.
7. Viscido SV, Parrish JK, Grunbaum D. 2005 The effectof population size and number of influentialneighbors on the emergent properties of fishschools. Ecol. Modell 183, 347 – 363. (doi:10.1016/j.ecolmodel.2004.08.019)
8. Hildenbrandt H, Carere C, Hemelrijk CK. 2010 Self-organized aerial displays of thousands of starlings: amodel. Behav. Ecol. 21, 1349 – 1359. (doi:10.1093/beheco/arq149)
9. Bhagavatula PS, Claudianos C, Ibbotson MR,Srinivasan MV. 2011 Optic flow cues guide flight inbirds. Curr. Biol. 21, 1794 – 1799. (doi:10.1016/j.cub.2011.09.009)
10. Zhaodan Kong MV, Ozcimder K, Fuller N, Greco A,Theriault D, Zheng Wu D, Kunz T, Betke M, BaillieulJ. 2013 Optical flow sensing and the inverseperception problem for flying bats. In Proc. IEEEConf. Decis Control, Firenze, Italy, pp. 1608 – 1615.Piscataway, NJ: IEEE.
11. Pant V, Higgins C. 2012 Tracking improvesperformance of biological collision avoidancemodels. Biol. Cybern. 106, 307 – 322. (doi:10.1007/s00422-012-0499-1)
12. Hoy M, Matveev AS, Savkin AV. 2015 Algorithms forcollision-free navigation of mobile robots incomplex cluttered environments: a survey.Robotica 33, 463 – 497. (doi:10.1017/S0263574714000289)
13. Manathara JG, Ghose D. 2011 Reactive collisionavoidance of multiple realistic UAVs. Aircraft Eng.Aerospace Technol. 83, 388 – 396. (doi:10.1108/00022661111173261)
14. Panyakeow P, Mesbahi M. 2014 Deconictionalgorithms for a pair of constant speed unmannedaerial vehicles. IEEE Trans. Aerosp. Electron. Syst. 50,456. (doi:10.1109/TAES.2013.110766)
15. Frazzoli E, Mao ZH, Oh JH, Feron E. 2001 Resolutionof conflicts involving many aircraft via semidefiniteprogramming. J. Guid. Control Dyn. 24, 79 – 86.(doi:10.2514/2.4678)
16. Kumar BA, Ghose D. 2001 Radar-assisted collisionavoidance/guidance strategy for planar flight. IEEETrans. Aerosp. Electron. Syst. 37, 77 – 90. (doi:10.1109/7.913669)
17. Guy SJ, Chhugani J, Kim C, Satish N, Lin M,Manocha D, Dubey P. 2009 ClearPath: highly parallelcollision avoidance for multi-agent simulation. InProc. of the 2009 ACM SIGGRAPH/EurographicsSymp. on Computer Animation - SCA ‘09,New Orleans, pp. 177 – 187. New York, NY: ACM.
18. Lalish E, Morgansen K. 2012 Distributed reactivecollision avoidance. Auton. Robot. 32, 207 – 226.(doi:10.1007/s10514-011-9267-7)
19. Park JM, Kim DW, Yoon YS, Kim HJ, Yi KS. 2009Obstacle avoidance of autonomous vehicles basedon model predictive control. Proc. Inst. Mech. Eng. DJ Automobile Eng. 223, 1499 – 1516. (doi:10.1243/09544070JAUTO1149)
20. Ahmadi-Pajouh MA, Towhidkhah F, Gharibzadeh S,Mashhadimalek M. 2007 Path planning in thehippocampo-prefrontal cortex pathway: an adaptivemodel based receding horizon planner. Med.Hypotheses 68, 1411 – 1415. (doi:10.1016/j.mehy.2006.06.060)
21. Mastrogiovanni F, Sgorbissa A, Zaccaria R. 2009Robust navigation in an unknown environment withminimal sensing and representation. IEEE Trans.Syst. Man. Cybern. A Syst. Hum. 39, 212 – 229.(doi:10.1109/TSMCB.2008.2004505)
22. Chakravarthy A, Ghose D. 1998 Obstacle avoidancein a dynamic environment: a collision coneapproach. IEEE Trans. Syst. Man. Cybern. A Syst.Hum. 28, 562 – 574. (doi:10.1109/3468.709600)
23. Fiorini P, Shiller Z. 1998 Motion planning indynamic environments using velocity obstacles.Int. J. Rob. Res. 17, 760 – 772. (doi:10.1177/027836499801700706)
24. Kane SA, Zamani M. 2014 Falcons pursue prey usingvisual motion cues: new perspectives from animal-borne cameras. J. Exp. Biol. 217, 225 – 234. (doi:10.1242/jeb.092403)
25. Ghose K, Horiuchi TK, Krishnaprasad PS,Moss CF. 2006 Echolocating bats use a nearlytime-optimal strategy to intercept prey. PLoSBiol. 4, e108. (doi:10.1371/journal.pbio.0040108)
26. Boardman BL, Hedrick TL, Thierault DM, Fuller NW,Betke M, Morgansen KA. 2013 Collision avoidance inbiological systems using collision cones. In Proc. ofthe American Control Conf., Washington DC,pp. 2964 – 2971. Piscataway, NJ: IEEE.
27. Fitch JH, Shump Jr KA, Shump AU. 1981 Myotis velifer.Mamm. Species 149, 1 – 5. (doi:10.2307/3504035)
28. Farney J, Fleharty ED. 1969 Aspect ratio, loading,wing span, and membrane areas of bats.J. Mammal. 50, 362 – 367. (doi:10.2307/1378361)
29. Theriault DH, Fuller NW, Jackson BE, Bluhm E,Evangelista D, Wu Z, Betke M, Hedrick TL. 2014A protocol and calibration method for accuratemulti-camera field videography. J. Exp. Biol. 217,1843 – 1848. (doi:10.1242/jeb.100529)
30. Pennycuick CJ, Hedenstrom A, Rosen M. 2000Horizontal flight of a swallow (Hirundo rustica)observed in a wind tunnel, with a new method fordirectly measuring mechanical power. J. Exp. Biol.203, 1755 – 1765. See http://jeb.biologists.org/content/203/11/1755.
31. Shelton RM, Jackson BE, Hedrick TL. 2014 Themechanics and behavior of cliff swallows duringtandem flights. J. Exp. Biol. 217, 2717 – 2725.(doi:10.1242/jeb.101329)
32. Hedrick TL. 2008 Software techniques for two- andthree-dimensional kinematic measurements ofbiological and biomimetic systems. Bioinspir. Biomim.3, 034001. (doi:10.1088/1748-3182/3/3/034001)
33. Ballerini M et al. 2008 Interaction ruling animalcollective behavior depends on topological ratherthan metric distance: evidence from a field study.Proc. Natl Acad. Sci. USA 105, 1232 – 1237. (doi:10.1073/pnas.0711437105)
34. Brace NL. 2014 Using collision cones to assessbiological deconiction methods. Seattle, WA:University of Washington. (http://hdl.handle.net/1773/27385).
35. Park KJ, Rosen M, Hedenstrom A. 2001 Flightkinematics of the barn swallow (Hirundo rustica)over a wide range of speeds in a wind tunnel.J. Exp. Biol. 204, 2741 – 2750.
36. Schnitzler HU. 1971 Fledermause im Windkanal.Z. Vergl Physiol. 73, 209 – 221. (doi:10.1007/BF00304133)
37. Bartolini T, Butail S, Porfiri M. 2015 Temperatureinfluences sociality and activity of freshwater fish.Environ. Biol. Fishes 98, 825 – 832. (doi:10.1007/s10641-014-0318-8)
38. Brace NL, Hedrick TL, Theriault DH, Fuller NW, Wu Z,Betke M, Parrish JK, Grunbaum D, Morgansen KA.2016 Data from: Using collision cones to assessbiological deconfliction methods. Dryad DigitalRepository. (http://dx.doi.org/10.5061/dryad.533gf )


![TOKYO YAKULT SWALLOWS YAKULT SWALLOWS 1279B JD-MY 1,000P1 ROUTE iNN NISAà NISA [iDeCo] "Waku It](https://img.pdfslide.net/doc/110x75/5cef534488c9937c458d29a3/tokyo-yakult-yakult-swallows-1279b-jd-my-1000p1-route-inn-nisaa-nisa-ideco-waku.jpg)