Embed Size (px)
Citation preview
LBNL- 53239
ERNEST ORLANDO LAWRENCE BERKELEY NATIONAL LABORATORY Using Contingent Valuation to Explore Willingness to Pay for Renewable Energy: A Comparison of Collective and Voluntary Payment Vehicles Ryan Wiser Lawrence Berkeley National Laboratory 1 Cyclotron Rd., MS 90-4000 Berkeley, California 94720 Environmental Energy Technologies Division August 2003
Download from: http://eetd.lbl.gov/ea/EMS/EMS_pubs.html#RE The work described in this study was funded by the Assistant Secretary of Energy Efficiency and Renewable Solar and Renewable Resource Technologies, U.S. Department of Energy under Contract No. DE-AC03-76SF00098.
ii
Disclaimer
This document was prepared as an account of work sponsored by the United States Government. While this document is believed to contain correct information, neither the United States Government nor any agency thereof, nor The Regents of the University of California, nor any of their employees, makes any warranty, express or implied, or assumes any legal responsibility for the accuracy, completeness, or usefulness of any information, apparatus, product, or process disclosed, or represents that its use would not infringe privately owned rights. Reference herein to any specific commercial product, process, or service by its trade name, trademark, manufacturer, or otherwise, does not necessarily constitute or imply its endorsement, recommendation, or favoring by the United States Government or any agency thereof, or The Regents of the University of California. The views and opinions of authors expressed herein do not necessarily state or reflect those of the United States Government or any agency thereof, or The Regents of the University of California.
iii
Acknowledgements Funding for this work was primarily provided by the Assistant Secretary for Energy Efficiency and Renewable Energy of the U.S. Department of Energy (DOE) under Contract No. D-ACO3-76SF0098. The support and encouragement of Larry Mansueti, Susan Holte, and Jack Cadogan, all of the U.S. DOE, is particularly acknowledged. For helping to guide the research, and for offering detailed review comments, deep thanks go to Richard Norgaard, Lee Friedman, and Christine Rosen, all with the University of California at Berkeley. I also acknowledge the critical contributions of Tim Beatty (University of British Columbia) in collaborating on the work contained in this report, and for providing much of the statistical genius contained herein. For assisting in fielding the survey, the findings of which are reported in this report, I thank Pam Rathbun and Kimberly Bakalars of PA Consulting. Finally, for kindly providing review comments on an earlier draft of this document, I acknowledge Mark Bolinger (Berkeley Lab). Of course, any remaining omissions or inaccuracies are my responsibility.
iv
Table of Contents
EXECUTIVE SUMMARY................................................................................................................V
1. INTRODUCTION ......................................................................................................................1
2. THE CONTINGENT VALUATION APPROACH.......................................................................3
2.1 THE BASICS OF CONTINGENT VALUATION............................................................................3 2.2 PROVISION AND PAYMENT EFFECTS IN CONTINGENT VALUATION .........................................3 2.3 THE PROVISION ARRANGEMENT: GOVERNMENT VS. PRIVATE DELIVERY...............................4 2.4 THE PAYMENT METHOD: COLLECTIVE VS. VOLUNTARY COLLECTION...................................4
3. THE ENVIRONMENTAL GOOD AND PAST RESEARCH: RENEWABLE ENERGY................9
4. DATA, METHODS, AND RESPONDENT CHARACTERISTICS .............................................10
4.1 RESEARCH DESIGN ...........................................................................................................10 4.2 SURVEY SAMPLE AND RESPONSE RATE..............................................................................11 4.3 SURVEY DESIGN AND PROTOCOL.......................................................................................12 4.4 THE SURVEY INSTRUMENT AND VALUATION SCENARIOS....................................................14 4.5 DESCRIPTIVE STATISTICS AND TESTS FOR NON-RESPONSE BIAS..........................................18
5. SURVEY RESULTS.................................................................................................................22
5.1 CV VALUATION SCENARIOS AND WTP DISTRIBUTIONS......................................................22 5.2 RESPONSE CERTAINTY BY CV VALUATION SCENARIO........................................................25 5.3 ANALYSIS OF “NO” RESPONSES .........................................................................................28 5.4 PARTICIPATION EXPECTATIONS: WILL OTHERS BE WILLING TO PAY?..................................30 5.5 MULTIVARIATE REGRESSION: SIMPLE PAIR WISE COMPARISON MODELS ............................33 5.6 MULTIVARIATE REGRESSION: A MORE COMPLEX MODEL ..................................................38 5.7 OPINION SURVEY RESULTS ...............................................................................................43
6. SUMMARY OF FINDINGS......................................................................................................51
7. IMPLICATIONS FOR CONTINGENT VALUATION...............................................................53
7.1 PROVISION APPROACH: GOVERNMENT VS. PRIVATE...........................................................53 7.2 PAYMENT METHOD: COLLECTIVE VS. VOLUNTARY ............................................................54
8. IMPLICATIONS OF THE “PARTICIPATION EXPECTATIONS” EFFECT..............................58
9. IMPLICATIONS FOR RENEWABLE ENERGY PROGRAMS..................................................61
9.1 PAYMENT PREFERENCES AND RENEWABLE ENERGY SUPPORT OPTIONS...............................61 9.2 THE LIMITS OF GREEN MARKETS.......................................................................................62 9.3 RESEARCH NEEDS AND NEXT STEPS ..................................................................................64
10. REFERENCES.........................................................................................................................66
APPENDIX A: CONTACT LETTERS FOR CV AND OPINION SURVEYS .....................................76
APPENDIX B: SAMPLE CONTINGENT VALUATION SURVEYS.................................................80
APPENDIX C: OPINION SURVEY................................................................................................ 124
APPENDIX D: TELEPHONE SCRIPT FOR CV AND OPINION SURVEYS................................... 137
APPENDIX E: FURTHER QUESTIONS AND RESULTS FROM CV SURVEYS............................ 144
v
Executive Summary Introduction and Purpose There are a variety of ways to support renewable electricity production. Common approaches currently in use include renewables portfolio standards, system-benefits charges, and voluntary customer demand for renewable energy through green power marketing. Support for renewable energy is often paid for through explicit or implicit increases in electricity rates. Historically, all electricity consumers have been required to pay these costs, though with green power marketing some of these costs are paid through voluntary customer contributions. An ongoing debate exists on how renewable energy might best be encouraged. Relying primarily on a national contingent valuation (CV) survey of U.S. households, but supplemented by an opinion survey, this report explores the preferences held by U.S. residents for different ways of supporting and paying for renewable energy generation. In particular, this study evaluates preferences for collective renewable energy policies relative to voluntary purchases of “green power” by individual customers, as well as preferences for the degree of government involvement in these programs. As summarized in the full report, several opinion surveys have been conducted over the last five years that also explore household preferences for supporting renewable power generation. This previous research provides some evidence that U.S. residents prefer collective, mandatory payments for renewable energy to voluntary ones. None of these opinion surveys have relied on the contingent valuation method, however, and the exploration of consumer payment preferences was not the principal purpose of study for any of this previous research. Results of the present study provide practical insight on the preferences of the U.S. populace towards various approaches to encouraging the development of renewable energy, and highlight possible limitations and barriers to voluntary green power demand. In addition to having tangible relevance to policymakers and green power marketers, results presented here also have important implications for a variety of academic areas of study: • Contingent Valuation: By evaluating stated willingness to pay (WTP) for renewable energy
under both voluntary and collective payment vehicles, our results shed light on strategic response and free-riding behavior and the incentive compatibility of different CV designs, as well as the appropriate interpretation of criterion validity studies in CV.
• Bandwagon Effects: The report also tests whether individuals who state a higher willingness to pay for renewable energy are more likely to think that others will also contribute, and explores the implications of this work for what is sometimes called the “bandwagon” or “reciprocity” effect.
• Discrepancy Between Environmental Attitudes and Behavior: More generally, this work helps one better understand the discrepancy between environmental attitudes (and purchase intentions) as expressed through consumer surveys and actual consumer behavior.
• Profiling the Environmentally Responsible Individual: Finally, by examining what types of individuals state a willingness to pay for renewable energy under different payment contexts,
vi
this report builds on an extensive literature in marketing, psychology, and economics that profiles the environmentally motivated customer.
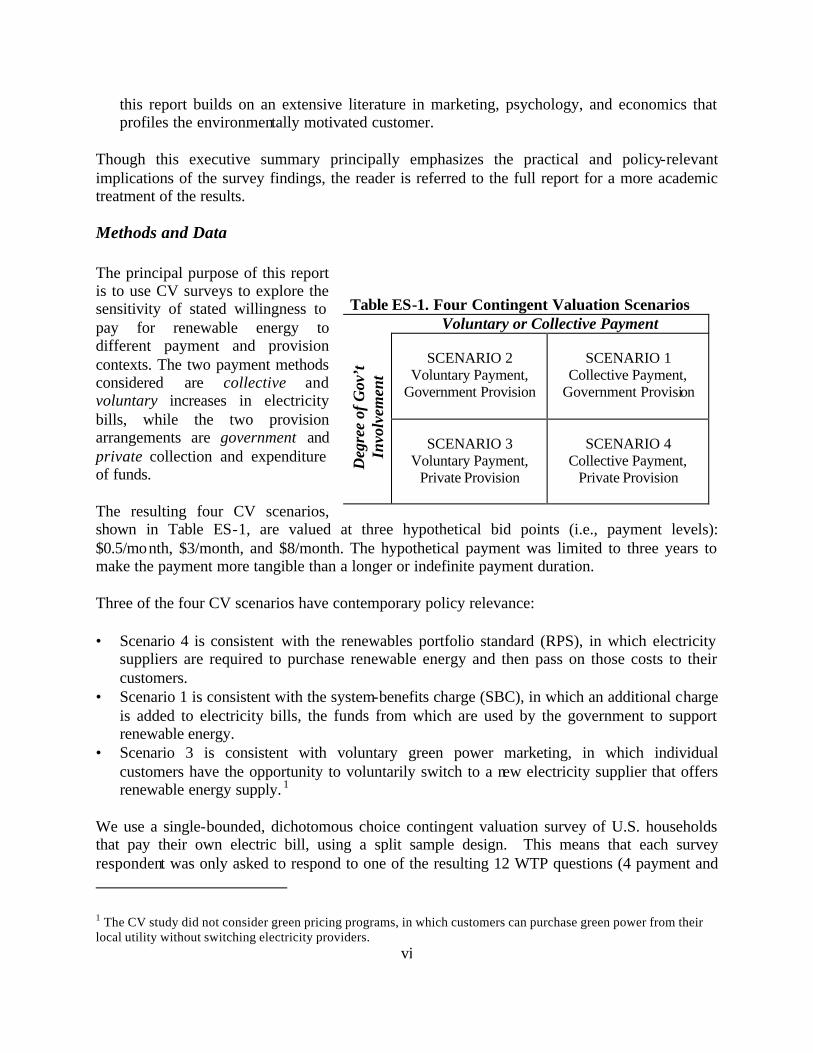
Though this executive summary principally emphasizes the practical and policy-relevant implications of the survey findings, the reader is referred to the full report for a more academic treatment of the results. Methods and Data The principal purpose of this report is to use CV surveys to explore the sensitivity of stated willingness to pay for renewable energy to different payment and provision contexts. The two payment methods considered are collective and voluntary increases in electricity bills, while the two provision arrangements are government and private collection and expenditure of funds. The resulting four CV scenarios, shown in Table ES-1, are valued at three hypothetical bid points (i.e., payment levels): $0.5/month, $3/month, and $8/month. The hypothetical payment was limited to three years to make the payment more tangible than a longer or indefinite payment duration. Three of the four CV scenarios have contemporary policy relevance: • Scenario 4 is consistent with the renewables portfolio standard (RPS), in which electricity
suppliers are required to purchase renewable energy and then pass on those costs to their customers.
• Scenario 1 is consistent with the system-benefits charge (SBC), in which an additional charge is added to electricity bills, the funds from which are used by the government to support renewable energy.
• Scenario 3 is consistent with voluntary green power marketing, in which individual customers have the opportunity to voluntarily switch to a new electricity supplier that offers renewable energy supply. 1
We use a single-bounded, dichotomous choice contingent valuation survey of U.S. households that pay their own electric bill, using a split sample design. This means that each survey respondent was only asked to respond to one of the resulting 12 WTP questions (4 payment and
1 The CV study did not consider green pricing programs, in which customers can purchase green power from their local utility without switching electricity providers.
Table ES-1. Four Contingent Valuation Scenarios Voluntary or Collective Payment
SCENARIO 2
Voluntary Payment, Government Provision
SCENARIO 1
Collective Payment, Government Provision
Deg
ree
of G
ov’t
Invo
lvem
ent
SCENARIO 3
Voluntary Payment, Private Provision
SCENARIO 4
Collective Payment, Private Provision
vii
provision scenarios crossed with 3 payment levels). The survey was conducted through the mail, with a national probability sample: 4,056 mail surveys were initially distributed, with 1,574 ultimately returned. Accounting for undeliverable surveys and ineligible participants, a 46% response rate was achieved after multiple contacts with each potential survey respondent. The CV survey was supplemented with a smaller, nationa l opinion survey: 544 opinion surveys were initially distributed, with 202 U.S. households ultimately responding. Accounting for undeliverable surveys and ineligible participants, a 45% response rate was achieved. Both the CV and opinion surveys were formatted and administered in a fashion designed to maximize response rates at reasonable cost; survey administration included an advance letter, a mailing of the survey packet, a thank you/reminder postcard, a follow-up mail packet, and a follow-up telephone call. The CV surveys were 12 pages in length, and included “warm-up” questions, the valuation exercise, attitudinal questions, and demographic and socioeconomic questions. The opinion survey, at 16 pages in length, was structured similarly but replaced the valuation exercise with more general questions on renewable energy payment preferences. Payment and Provision Preferences: Contingent Valuation Results Based on the CV results, we find that reported willingness to pay for renewable energy is somewhat sensitive to the payment method and provision arrangement. As shown in Table ES-2, however, the data do not show substantial variation across different payment and provision scenarios. Overall, U.S. residents that responded to the survey express a somewhat higher willingness to pay for collective policy efforts – and in particular Scenario 4, the renewables portfolio standard (RPS) – than for voluntary green power options. That said, variations in stated WTP based on payment method and provision context are not particularly sizable, and statistically significant differences are discovered in only a subset of the comparisons. • Collective vs. Voluntary Payment: Higher WTP is elicited under collective payment than
under voluntary payment, suggesting that collective payment measures are preferred to voluntary ones. Though the variation in stated willingness to pay is modest, there seems to be some recognition by survey respondents that collective, policy-based approaches to supporting renewable energy will be more effective than voluntary green power marketing efforts, perhaps due to concerns for “free-riding” in the voluntary case; free-riding refers to the incentive for individuals to avoid voluntary payments for public goods because such goods benefit everyone, regardless of whether any individual has paid their share.
• Private vs. Government Provision: Private provision elicits a somewhat higher WTP than does government provision, suggesting a relatively lower faith in the government as an effective direct provider of public goods. While the results are again not definitive, they suggest that programs to support renewable energy that involve the private sector (such as the renewables portfolio standard) are somewhat more highly favored than those that involve higher levels of government administration (such as the system-benefits charge).
viii
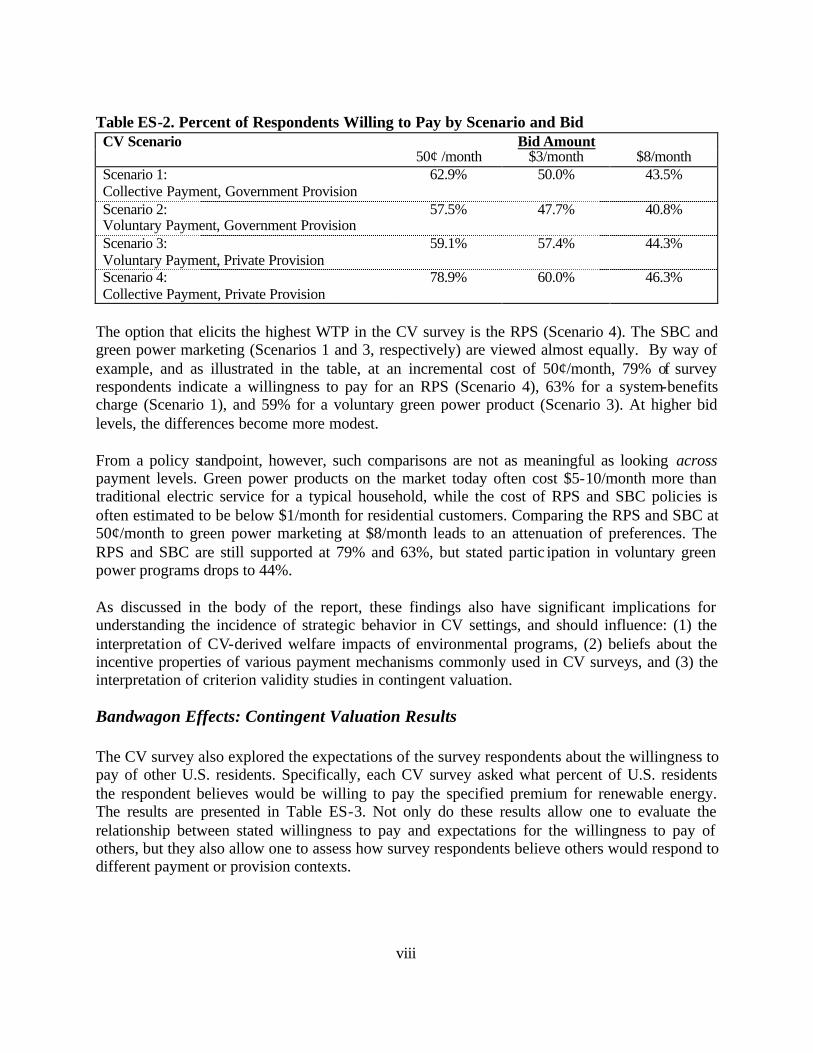
Table ES-2. Percent of Respondents Willing to Pay by Scenario and Bid
Bid Amount CV Scenario 50¢ /month $3/month $8/month
Scenario 1: Collective Payment, Government Provision
62.9% 50.0% 43.5%
Scenario 2: Voluntary Payment, Government Provision
57.5% 47.7% 40.8%
Scenario 3: Voluntary Payment, Private Provision
59.1% 57.4% 44.3%
Scenario 4: Collective Payment, Private Provision
78.9% 60.0% 46.3%
The option that elicits the highest WTP in the CV survey is the RPS (Scenario 4). The SBC and green power marketing (Scenarios 1 and 3, respectively) are viewed almost equally. By way of example, and as illustrated in the table, at an incremental cost of 50¢/month, 79% of survey respondents indicate a willingness to pay for an RPS (Scenario 4), 63% for a system-benefits charge (Scenario 1), and 59% for a voluntary green power product (Scenario 3). At higher bid levels, the differences become more modest. From a policy standpoint, however, such comparisons are not as meaningful as looking across payment levels. Green power products on the market today often cost $5-10/month more than traditional electric service for a typical household, while the cost of RPS and SBC policies is often estimated to be below $1/month for residential customers. Comparing the RPS and SBC at 50¢/month to green power marketing at $8/month leads to an attenuation of preferences. The RPS and SBC are still supported at 79% and 63%, but stated partic ipation in voluntary green power programs drops to 44%. As discussed in the body of the report, these findings also have significant implications for understanding the incidence of strategic behavior in CV settings, and should influence: (1) the interpretation of CV-derived welfare impacts of environmental programs, (2) beliefs about the incentive properties of various payment mechanisms commonly used in CV surveys, and (3) the interpretation of criterion validity studies in contingent valuation. Bandwagon Effects: Contingent Valuation Results The CV survey also explored the expectations of the survey respondents about the willingness to pay of other U.S. residents. Specifically, each CV survey asked what percent of U.S. residents the respondent believes would be willing to pay the specified premium for renewable energy. The results are presented in Table ES-3. Not only do these results allow one to evaluate the relationship between stated willingness to pay and expectations for the willingness to pay of others, but they also allow one to assess how survey respondents believe others would respond to different payment or provision contexts.
ix
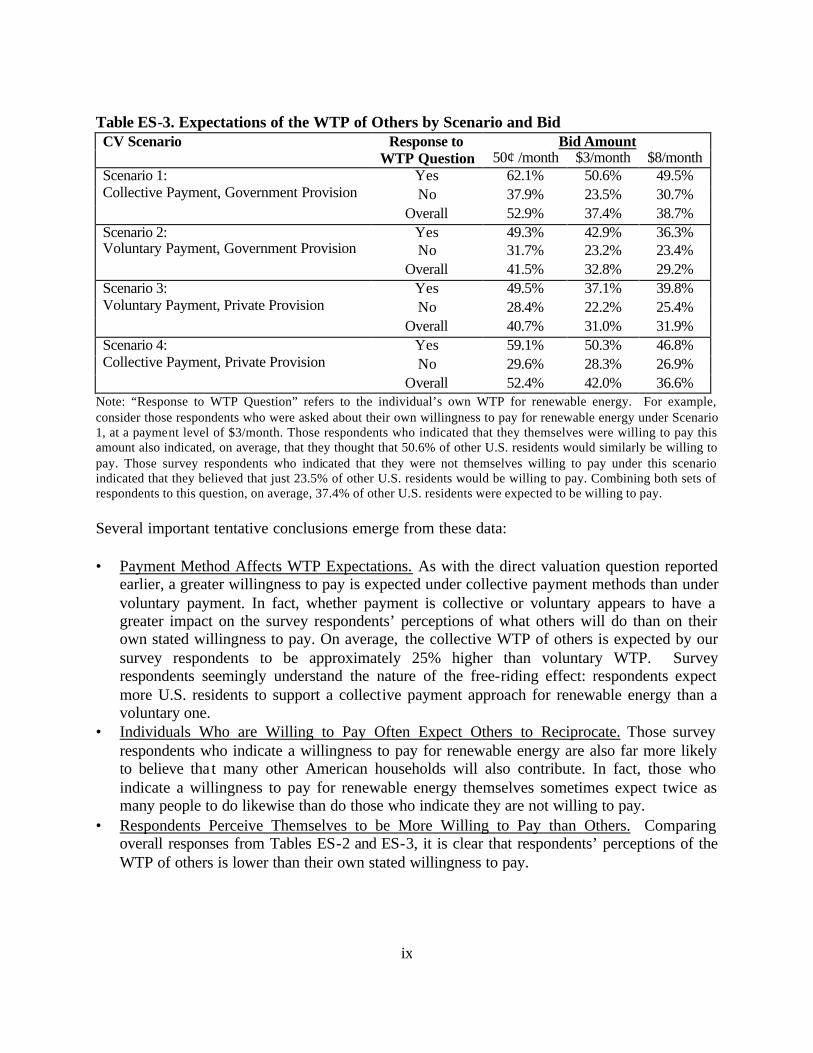
Table ES-3. Expectations of the WTP of Others by Scenario and Bid
Bid Amount CV Scenario Response to WTP Question 50¢ /month $3/month $8/month
Yes 62.1% 50.6% 49.5% No 37.9% 23.5% 30.7%
Scenario 1: Collective Payment, Government Provision
Overall 52.9% 37.4% 38.7% Yes 49.3% 42.9% 36.3% No 31.7% 23.2% 23.4%
Scenario 2: Voluntary Payment, Government Provision
Overall 41.5% 32.8% 29.2% Yes 49.5% 37.1% 39.8% No 28.4% 22.2% 25.4%
Scenario 3: Voluntary Payment, Private Provision
Overall 40.7% 31.0% 31.9% Yes 59.1% 50.3% 46.8% No 29.6% 28.3% 26.9%
Scenario 4: Collective Payment, Private Provision
Overall 52.4% 42.0% 36.6% Note: “Response to WTP Question” refers to the individual’s own WTP for renewable energy. For example, consider those respondents who were asked about their own willingness to pay for renewable energy under Scenario 1, at a payment level of $3/month. Those respondents who indicated that they themselves were willing to pay this amount also indicated, on average, that they thought that 50.6% of other U.S. residents would similarly be willing to pay. Those survey respondents who indicated that they were not themselves willing to pay under this scenario indicated that they believed that just 23.5% of other U.S. residents would be willing to pay. Combining both sets of respondents to this question, on average, 37.4% of other U.S. residents were expected to be willing to pay. Several important tentative conclusions emerge from these data:
• Payment Method Affects WTP Expectations. As with the direct valuation question reported
earlier, a greater willingness to pay is expected under collective payment methods than under voluntary payment. In fact, whether payment is collective or voluntary appears to have a greater impact on the survey respondents’ perceptions of what others will do than on their own stated willingness to pay. On average, the collective WTP of others is expected by our survey respondents to be approximately 25% higher than voluntary WTP. Survey respondents seemingly understand the nature of the free-riding effect: respondents expect more U.S. residents to support a collective payment approach for renewable energy than a voluntary one.
• Individuals Who are Willing to Pay Often Expect Others to Reciprocate. Those survey respondents who indicate a willingness to pay for renewable energy are also far more likely to believe tha t many other American households will also contribute. In fact, those who indicate a willingness to pay for renewable energy themselves sometimes expect twice as many people to do likewise than do those who indicate they are not willing to pay.
• Respondents Perceive Themselves to be More Willing to Pay than Others. Comparing overall responses from Tables ES-2 and ES-3, it is clear that respondents’ perceptions of the WTP of others is lower than their own stated willingness to pay.
x
These findings and other evidence discussed in the main report provide tentative support for a “bandwagon” or “reciprocity” effect in CV responses, though additional research will be needed to confirm and understand this result. Multivariate Regression Analysis: Contingent Valuation Results Statistical analysis using multivariate regression also confirms that stated WTP varies with socioeconomic, demographic, and attitudinal factors. This report therefore highlights the characteristics of respondents that are correlated with a positive willingness to pay for renewable energy. When attitudinal variables are excluded, we find that WTP is often higher among those respondents who have higher- incomes, are more liberal, are female, do not have children, and are more highly educated. When attitudinal variables are included, socioeconomic and demographic variables become less important and model accuracy improves greatly. In particular, socioeconomic and demographic variables still have some effect: we find that WTP is often higher among those respondents who are younger, do not rent their home, are female, and have higher education and income levels. More importantly, however, certain attitudinal variables are highly significant. For example, those survey respondents who believe that their family and friends would also support renewable energy are far more likely to be willing to pay themselves, while a belief that the government should require everyone to pay for environmental improvements is positively related to WTP for renewable energy in all of the payment and provision scenarios (though more so in the collective payment scenarios). Those who express a greater trust in the government are also more likely to state a willingness to pay for renewable energy; this is true in all four scenarios, but far less so under voluntary payment and private provision, as one would expect. Finally, those who indicate that they would only pay more for environmentally friendly products if they received a direct benefit from doing so are less likely to be willing to pay for renewable energy. Opinion Survey Results As shown in the body of the report, results of the companion opinion survey are found to be consistent with the basic results of the contingent valuation survey presented above. In particular, the opinion survey directly asked whether survey respondents would prefer that collective or voluntary payment methods be used to support renewable energy. A very narrow majority of U.S. households (53% to 47%) indicate a preference for collective payment vehicles. As expected, those U.S. residents who show a strong affinity for renewable energy generally prefer collective payment methods (70% prefer collective over voluntary), while those U.S. residents who do not believe renewable energy is a priority prefer voluntary payment (71% prefer voluntary over collective). Similarly, a small majority of opinion survey respondents prefer private provision mechanisms to government provision (54% vs. 46%). Perhaps surprisingly, just 55% of respondents believe that “renewable energy production should be increased, even if it costs more than other electricity production options.” Results from the opinion survey also provide a more detailed view of the green power market, and the respective roles of voluntary and policy-based approaches to supporting renewable energy. The Barriers to Voluntary Green Power Markets
xi
Though the research presented in this report shows that collective measures of policy support are generally viewed as somewhat more preferable to voluntary efforts, 44% of survey respondents still indicate a voluntary willingness to pay for a green power product priced at $8 per month. Moreover, respondents believe that 32% of other U.S. residents would be willing to pay this same level on a voluntary basis. Both of these WTP numbers are considerably above the 1-3% market penetration rate that is typical of voluntary green power offerings to date in the U.S. These results are typical: stated willingness to pay for renewable energy generally exceeds actua l participation in green power programs by a wide margin. Results from the contingent valuation and opinion surveys shed some light into possible explanations for this discrepancy. • Preferences for Collective Payment Vehicles and Free-Riding: Consumer preferences for
collective action rather than reliance on voluntary demand may be a stronger factor in an actual payment condition than under the hypothetical survey situation tested in this report. In fact, in the opinion survey, we asked respondents to tell us what concerns they might have about voluntarily purchasing a green power product; 38% of respondents identified the fact that “renewable energy benefits everyone, so everyone should be required to pay” as a key concern.
• Upwards Bias in CV WTP Questions: As discussed in the full repot, survey results offer some evidence of an upwards bias in responses to hypothetical CV questions – that is, survey respondents may be overstating their actual willingness to pay when confronted with hypothetical WTP questions. As shown above, when asked whether they would be willing to pay a $3-8 per month premium for renewable energy, 40-60% of U.S. residents say they would not pay this amount, regardless of whether payments are collective or voluntary. Given the possibility of upwards bias, the estimate that 40-60% of U.S. residents simply do not value renewable energy sufficiently to be willing to pay at the $3-8 level should be considered a lower bound.
• Bandwagon Effects, Critical Mass, and Reciprocity: Though the findings are tentative, the survey results suggest that anemic participation rates in actual green power programs may, in part, be a self- fulfilling prophecy. Without a critical mass of participants to create a “bandwagon” effect, households may become disillusioned and choose not to participate. The most difficult part of developing the green power market may therefore be to develop a stable base of contributors on which further contributions can grow.
• Lack of Knowledge of Green Power Availability: As with any new product on the market, heavy marketing is often needed to inform potential purchasers of the product and its benefits. Opinion survey results show that just 8% of respondents believe that a green power product is available for purchase in their region. With actual availability at approximately 40% nationwide, it is evident that a large number of potential green power buyers are simply unaware of the products that are available.
• Hesitancy in Switching Electricity Providers: Survey results show a high degree of hesitancy in switching electricity providers more generally. In the opinion survey, for example, utility provision of green power was preferred on a 67% to 33% basis over purchasing green power by switching to a new electricity supplier. In the CV survey, 24% of those respondents who
xii
indicated they were not willing to pay for renewable energy under Scenario 3 indicated that a key reason was that they would not want to switch electricity providers for other reasons.
• Distrust in the Product and Supplier: Survey results also suggest that a good fraction of potential green power customers may simply distrust electricity suppliers in effectively providing renewable energy. For example, 41% of respondents to the CV survey who indicated that they were not willing to pay for renewable energy under Scenario 3 (green power marketing) also indicated that they would not trust electricity suppliers to effectively provide renewable energy. Similarly, 42% of respondents to the opinion survey indicated that a key concern in voluntarily purchasing green power is lack of trust in electricity suppliers to effectively provide renewable energy.
Based on these findings, it is clear that one cannot reasonably label all those who do not voluntarily purchase green products as public-goods free riders; free riding incentives and preferences for collective payments do not appear to be the only explanations for the wide gulf between positive environmental attitudes and actual purchase decisions. Apparently, if voluntary demand for green power is to increase appreciably, not only will the standard economic barrier of free-riding stand in the way, but so too will a host of other barriers to volunteerism in the green market. Conclusions and Next Steps This report shows that households express a somewhat higher willingness to pay for collective over voluntary efforts to support renewable energy, and that similarly weak preferences exist for private over government provision. A payment and provision arrangement that is similar to an RPS received the highest reported willingness to pay. Interestingly, households’ own stated willingness to pay for renewable energy appears to be strongly related to what they perceive others to be doing. A number of socioeconomic, demographic, and attitudinal variables are also shown to impact stated WTP. Each of these findings derives principally from contingent valuation survey results, but many are also confirmed by a smaller opinion survey. We also find that a host of barriers to voluntary green power demand exist – “free-riding” or collective payment preferences may not be the dominant barrier. The apparent preference of U.S. residents for collective payment measures over voluntary ones is lower than one might expect for a good (renewable energy) that provides public benefits. Moreover, past research in this area has found a stronger preference for collective payment vehicles. At least in the survey setting presented in this report, however, U.S. residents do not appear to recognize the need for collective action for renewable energy to the same degree found in past research. These findings may be somewhat puzzling to those who believe that free-riding incentives and basic fairness dictate that collective payment measures should be preferred when public goods are involved. Three possible rationales for this finding are noted in the full report. First, survey respondents express a belief that voluntary green power programs will elicit a much higher level of positive response than actual experience shows, perhaps indicating a belief that voluntary payments really can be an effective means of supporting renewable energy. Second, general support for renewable energy as expressed in the survey results reported here appears more tepid than one might expect based on past surveys. Third, the survey uncovered some distrust for the government’s ability to provide renewable energy effectively; people may

xiii
therefore believe that “governmental failure” is just as significant under collective payments as “market failure” is under voluntary payments. Additional research is needed to explore the relative influence of these various factors.
1
1. Introduction Some of the most basic questions about the organization and functioning of society involve issues raised by the existence of public goods. With respect to environmental public goods, how should funds used to support environmental improvement be collected and used? In particular, are collective, mandatory payments superior to voluntary, charitable payments due to the possibility of free riding? And to what degree should the government be involved in spending these funds: should the government directly fund environmental improvement projects or should the private sector be used to collect funds and determine funding priorities? This report explores these questions from the perspective of renewable energy: wind, geothermal, biomass, hydropower, and solar. In particular, this report analyzes the payment preferences of U.S. households through the implementation of a large-scale contingent valuation (CV) survey of willingness to pay (WTP) for renewable energy. Renewable energy can be supported through a mandatory “tax” on electric bills or through voluntary payments via green power marketing; the government may or may not be heavily involved in the collection and expenditure of such funds. The question of how households prefer to pay for renewable energy is therefore highly relevant. The primary objective of this study is to explore variations in stated WTP for renewable energy under the following four payment and provision contexts: 1. A mandatory increase in the electricity bills of all customers, the funds from which are
collected and spent by the government on renewable energy projects. 2. A voluntary increase in the electricity bills of those customers who choose to pay, the funds
from which are collected and spent by the government on renewable energy projects. 3. A voluntary increase in the electricity bills of those customers who choose to pay, the funds
from which are collected and spent by electricity suppliers on renewable energy projects. 4. A mandatory increase in the electricity bills of all customers, the funds from which are
collected and spent by electricity suppliers on renewable energy projects. These payment and provision scenarios are consistent with contemporary forms of support for renewable energy. The first scenario – mandatory payments and government provision – is consistent with a system-benefits charge policy, a policy that has been adopted in 15 U.S. states. The third scenario – voluntary payments to an electricity supplier – is consistent with competitive green power marketing. The fourth scenario – mandatory payments through electricity suppliers – is consistent with a renewables portfolio standard, a policy adopted in thirteen U.S. states as of mid 2003. The second scenario – voluntary payments and government provision – has only been used in a limited fashion in the United States. In addition to having contemporary policy relevance, these four contingent valuation scenarios allow one to distinguish differences in stated WTP based on: (1) the payment method – is WTP affected by whether payments are to be made collectively or voluntarily? and (2) the provision arrangement – does the manner in which a good is provided, in this case through the government or the private sector, affect stated WTP? A split-sample, dichotomous choice contingent
2
valuation survey of 1,574 U.S. residents was developed and implemented to test the sensitivity of stated WTP to these variables at three different payment levels, or bid points. Three secondary objectives also influenced research design, and are discussed in this report. First, this study indirectly and tentatively evaluates the importance of “participation expectations” in contingent valuation surveys: specifically, are individuals who state a WTP for renewable energy more likely to think that others will also contribute? Such relationships are commonly discussed in the sociology, social psychology, and marketing literatures, and are also frequently referenced in the collective action literature, but have yet to be tested thoroughly in a contingent valuation context. Second, this report assesses the effects of socioeconomic, demographic, and attitudinal variables on willingness to pay for renewable energy through regression analysis. This analysis helps test the construct validity of the contingent valuation method, and informs our understanding of who is and is not willing to pay for renewable energy under different payment and provision contexts. Finally, through the implementation of a concurrent opinion survey with 202 respondents, this study compares the results of the CV surveys to a more direct approach of eliciting individuals’ payment preferences. Responses to the opinion survey also allow a deeper exploration of other issues related to payment preferences. Because the payment and provision scenarios considered in this study are consistent with contemporary renewable energy programs, results provide practical insight on the preferences of the U.S. populace towards various approaches to encouraging renewable energy supply. In addition to having practical relevance to policymakers and green power marketers, results presented here also have important implications for the methodology and practice of contingent valuation. In particular, the results shed light on strategic response behavior and the incentive compatibility of different CV designs, as well as the appropriate interpretation of criterion validity studies in CV. This work also helps one better understand the discrepancy between environmental attitudes (and purchase intentions) as expressed through consumer surveys and actual consumer behavior, and sheds light on the collective action literature more broadly. This report begins in Section 2 with an overview of the contingent valuation method and a summary of previous CV research that relates to the issues covered in the following pages. The good valued in the present CV application – renewable energy – is then described in Section 3, as are past survey results about payment preferences and willingness to pay for renewable energy. A summary of the survey questionnaire and the methods used to perform the survey, as well as the demographic and socioeconomic characteristics of the survey respondents, is provided in Section 4. Results and analysis are then presented in Section 5. The report concludes in Section 6 through 9 with a summary of findings, and a discussion of the implications of this study for the practice of contingent valuation, for understanding the relationship between stated WTP and one’s expectations for the participation of others, and for policymakers and marketers interested in supporting renewable energy.
3
2. The Contingent Valuation Approach 2.1 The Basics of Contingent Valuation Contingent valuation surveys are claimed by their proponents to provide a methodologically rigorous way to ask willingness to pay questions and value public goods. Since its conception by Ciriacy-Wantrup in 1947, contingent valuation has become one of the most popular methods used by environmental and resource economists to value environmental goods (Mitchell and Carson 1989, Bjornstad and Kahn 1996, Bateman and Willis 1999). Contingent valuation uses a questionnaire or interview to create a realistic but still hypothetical market or policy referendum. The survey (1) conveys the description of the good to be valued, (2) describes the payment method and amount to be paid, and then (3) allows respondents to indicate their willingness to pay for the good in question. During the development of the method, and especially since the 1970s, contingent valuation has undergone numerous methodological tests to assess the reliability and accuracy of the approach. Question wording and ordering, differences between willingness to pay and willingness to accept, treatment of “don’t know” responses, scope and embedding effects, elicitation effects, statistical issues, survey mode effects, criterion validity studies, temporal reliability, and starting point bias are among the types of considerations evaluated in the CV literature to date. Despite growing acceptance by some of the usefulness and meaningfulness of CV responses, however, the technique remains controversial (Cummings and Harrison 1994, Hausman 1993). To help fill important gaps in the CV literature, Bjornstad and Kahn (1996) identify several research areas that require attention, including the role of CV context in the formation of preferences, and the impact of payment methods on elicited WTP. These are the topics of this report, and below we discuss relevant CV literature that addresses the principal payment and context effects that are explored in this study: the provision arrangement (government vs. private), and the payment method (collective vs. voluntary). 2.2 Provision and Payment Effects in Contingent Valuation That the approach taken to collecting and spending funds for environmental projects may influence the willingness of individuals to provide those funds should come as little surprise. As succinctly stated by Johnson et al. (1999), “Whereas contingent valuation method surveys generally address the payment mechanism as a simple means to assess realistic monetary tradeoffs and measure dollar-denominated welfare impacts, characteristics of the payment mechanism itself may have important impacts on respondents’ perceptions of specified dollar amounts and their willingness to pay for multidimensional policy packages.” A number of CV researchers have sought to understand the impacts of provision and payment methods on responses to CV questions. Such tests have explored the impacts of payment vehicle (e.g., sales taxes vs. water fees),2 payment timing (e.g., lump sum payment versus monthly
2 See, e.g., Greenley et al. (1981), Randall et al. (1974), Brookshire et al. (1980), Rowe et al. (1980), Blamey (1998).
4
payments),3 and faith in the payment method as an efficient and guaranteed funding source.4 Differences in response among these treatments are viewed by some as evidence of the unreliability of the CV method, and CV researchers once referred to such differences as payment vehicle bias (Diamond and Hausman 1994, Rowe and Chestnut 1983). Most economists and CV researchers, however, now acknowledge that such subtle changes to the CV scenario can and in some cases should elicit different willingness to pay responses, and can do so without damaging the reliability of the CV method (Hanemann 1994, Mitchell and Carson 1989, Fischhoff and Furby 1988). As one example, while the typical CV survey does not allow for the fact that respondents may assume some inefficiency in fund collection and expenditure, as a practical matter it should be clear that respondents’ views of policy inefficiency may vary by the approach taken to the provision of the good.
2.3 The Provision Arrangement: Government vs. Private Delivery Building on previous CV research, in the present study we consider two ways in which the good – renewable energy – could be provided. One approach is for the government to collect and distribute funds for renewable energy; the other is for a private electricity supplier to collect and spend the funds. We know of no other CV study that has looked at the relative WTP of respondents for government or private delivery of a public good. A priori, economic theory can do little to predict how or if WTP will differ based on this variation in the CV scenario. One might expect, however, that any difference in WTP across the two provision arrangements will be driven by the relative trust respondents place in the government and the private sector in effectively delivering renewable energy programs. 2.4 The Payment Method: Collective vs. Voluntary Collection We also evaluate two possible payment methods. The first is a collective payment approach in which all households and businesses are required to pay for the provision of the good; in the case of renewable energy, this takes the form of a required surcharge on electricity bills. The second payment method is a voluntary one in which each household has the option, but not the obligation, to support the provision of the good; in the case of renewable energy, this is envisioned as a voluntary supplemental charge on electricity bills, consistent with voluntary green power marketing. There have been relatively few efforts within the CV literature to systematically test the sensitivity of willingness to pay to whether payments are to be made collectively or voluntarily. It is here that this study contributes to a better understanding and critique of the CV methodology, and to broader literatures related to the collective action dilemma and the gap between general environmental attitudes and specific behaviors. Though some critics of contingent valuation have argued that any difference in WTP under voluntary and collective payment methods would demonstrate bias in CV (Green et al. 1994), such statements are simply false. Instead, a review of the CV, collective action, experimental
3 See, e.g., Brookshire et al. (1981), Stevens et al. (1997). 4 See, e.g., Johnson et al. (1999).
5
economics and related literatures leads to two conflicting theories of behavioral response when individuals are faced with these payment options, discussed below under the headings “free riding and truth telling” and “strategic behavior and incentive compatibility.” Free Riding and Truth Telling One behavioral theory relies on the traditional economic concept of “free riding.” As is well known, when payment is voluntary, economic theory predicts that few individuals will be willing to pay to help provide public goods. While collective payments may be supported as a way of providing important public benefits, those same people would take a “free ride” and not contribute in the case of voluntary efforts. The free riding concept has been used to explain the large discrepancy between the stated environmental attitudes of the general populace and the weak actions of that same group in voluntarily engaging in environmental behaviors (Foster et al. 1997). The theory has also been tested in experimental economic research. While complete free riding is not generally found, the evidence for a significant degree of such behavior is clear (Ledyard 1995). Finally, within CV research, this theory has been used to explain why actual contributions to public causes are often well below what CV studies would seem to predict (Carson 1997, Taylor 1998, Hanemann 1996). If survey respondents are assumed to answer CV questions “truthfully” (i.e., as if they are being faced with a true economic choice to voluntarily contribute), free riding might be used to predict that stated WTP under voluntary payment will be lower than elicited WTP when payments are to be made collectively. This is the hypothesis that Champ et al. (2002) use in their recent study of payment vehicle effects in contingent valuation responses.5 Strategic Behavior and Incentive Compatibility While few would doubt the powerful incentive to free ride when real economic commitments are involved, CV studies rely on hypothetical survey questions, not real commitments. For free riding, as defined above, to dominate behavior in a CV context, one would have to assume that respondents answer CV questions – whether payment is collective or voluntary – as if they involved real economic commitments. The hypothetical nature of CV research leads to another possible behavioral response that economic theorists will be more amenable to than “truth telling”: strategic behavior and overbidding. Understanding the strategic incentives of CV respondents has been of concern throughout the development of the contingent valuation method. Concerns over strategic bias in public goods valuation are often attributed to Samuelson (1954), with perhaps the first test of these effects in a CV context by Bohm (1972).6 Even now, however, the concept of strategic behavior and the related concept of “incentive compatibility” have only begun to be fully integrated into CV design.
5 It deserves note, however, that Champ et al. (2002) do not appear to fully appreciate the fact that free-riding incentives in a hypothetical payment environment may differ from such incentives in an actual payment case. 6 For other attempts to explore this subject, see Lunander (1998), Cronin and Herzeg (1982), Rowe et al. (1980), and Posavac (1998).
6
Incentive compatibility refers to whether respondents to a CV survey (or in any other setting) have an incentive to reveal their true valuation – or willingness to pay – for the good. Perhaps the most significant recent contribution to the incentive compatibility literature as it relates to CV studies and different payment methods comes from Carson (1997) and Carson et al. (1999). These studies conclude that for a survey to elicit true preferences, it needs to be consequential; that is, the survey results must be viewed by the respondent as possibly influencing actual outcomes that the respondent cares about. Following Hoehn and Randall (1987), these authors also make a persuasive case that a single, binary dichotomous choice survey question (i.e., a yes/no valuation question) with a collective payment rule is an essential element of an incentive compatible survey design. In effect, such a design mimics the administration of a policy referendum, and the incentive compatibility of this approach is one of the primary reasons for the NOAA panel recommendation to use dichotomous choice elicitation methods (Arrow et al. 1993). This is also the design that we use in the collective payment cases. In the case of voluntary contributions to the provision of public goods, however, Carson (1997) and Carson et al. (1999) identify an important possible cause of strategic behavior: option value. Specifically, these authors argue that respondents may overstate their WTP for a good when presented with a hypothetical, voluntary payment mechanism. In fact, as long as the good is potentially desirable, it is always optimal to say “yes” to a survey valuation question that poses a voluntary payment. This is because the only influence of a “yes” response to a hypothetical CV question is to encourage the actual fund-raising effort, and many respondents may want the good to be provided by others or may want the option of actually volunteering to pay for the good at a later time. Thus, the “optimal” strategy for many respondents when faced with a voluntary payment for a public good is to say “yes” to the hypothetical CV question and to then free ride and say “no” to the actual fund raising effort. Importantly, this is true for both public and private goods; in the private good case, a “yes” response in the survey encourages the production of the good while the respondent gets to decide later whether to actually purchase or contribute to the good. Consequently, in a hypothetical survey context, a conniving respondent may overstate their WTP in a voluntary payment setting in order to ensure that the option to actually pay for the good is available at a later time. The result is that voluntary payment methods in contingent valuation are not incentive compatible. Related CV Research These two theories of behavioral response suggest opposite effects. Free riding and truth telling argue that WTP under the voluntary payment method will be lower than under collective payment. Strategic behavior suggests the opposite effect, with voluntary WTP exceeding collective WTP in a survey context. This study attempts to mimic an incentive compatible design in the collective payment context by using a single, dichotomous choice WTP question for each survey respondent. At the same time, the voluntary payment mechanism used in this study is not incentive compatible because hypothetical voluntary payments, by their nature, fail the incentive compatibility test. With the design used in the research reported here, we are able to assess the combined impact of the two possible response effects: (1) free riding and truth telling, and (2) strategic behavior and incentive compatibility. In so doing, this study contributes to the limited CV research in this area.
7
Many early CV studies used voluntary payment methods to elicit WTP. Recognizing that such an approach fails the test of incentive compatibility, however, most contemporary CV research uses collective payment vehicles. Surprisingly, however, only a limited amount of empirical work has been undertaken to explore the differences between vo luntary and collective WTP, and much of the work that does exist suffers from serious methodological shortcomings. We review some of this existing literature below. A number of studies have found no difference in collective and voluntary WTP. Milon (1989), using an approach somewhat similar to the one used in this paper, evaluates collective and voluntary WTP for an artificial reef using a dichotomous choice elicitation format. No significant differences in WTP are found. Ajzen et al. (1996) also evaluate WTP for a public (movie theater) and private (noise filter) good under voluntary and compulsory payment vehicles. Using a within-sample approach and open-ended response format, they also find that the payment method has little impact.7 An earlier study by Babb and Sherr (1975) similarly found little evidence of strategic behavior when respondents are faced with a voluntary payment mechanism. Other studies do find some evidence for different response effects when individuals are confronted with collective and voluntary payment vehicles. Some of these studies attribute these differences to possible incentive effects, while others emphasize possible credibility differences among the payment vehicles. Champ et al. (2002) use an approach that is nearly identical to our own, and find that a voluntary payment mechanism for preserving open space results in a somewhat lower stated WTP than a mandatory tax. Green et al. (1994), using an open-ended elicitation format, find limited evidence for higher WTP estimates under a taxation arrangement than under voluntary contributions. Hanley and Milne (1996) evaluate whether respondents would be willing to exchange lower “personal” or “community” income to improve environmental quality; while these authors find some difference in response based on personal or community income, they do not define for the respondent what they mean by these terms, making meaningful interpretation of their results impossible. In a pilot study with an open-ended elicitation format, Bateman et al. (1995) found that a voluntary payment vehicle suffered disproportionately from zero WTP bids compared to a taxation vehicle, and also generated lower mean WTP estimates. Jakobsson and Dragun (1996) find that, under both discrete and continuous response formats, mean WTP for possum protection under a donation mechanisms was 35% lower than under a tax mechanism. Stevens et al. (1991), meanwhile, find that, when confronted with a voluntary payment method for protecting wildlife, 40% of respondents who indicated they were not willing to pay stated that wildlife should be preserved through taxes or license fees. Similarly, Harris and Brown (1992) present survey respondents with a choice of four payment methods for a reduction in wildlife impacts; the majority of respondents preferred collective payment methods. Guagnano et al. (1994) assess WTP under collective and voluntary payment regimes for rainforest protection and water cleanup. Using an open-ended format, a nonstandard WTP question in the collective case, and a collective tax vehicle whose duration is unclear, they find that WTP under collective payment is lower than under voluntary payment.8
7 It should be noted that the authors do not emphasize this point and provide limited evidence for this conclusion. 8 There have also been loosely related efforts to value private and collective protection of risks (Crocker et al. 1998).
8
The study presented here more comprehensively explores WTP under collective and voluntary payment mechanisms. It makes advances relative to much of the previous research by: (1) undertaking a complete CV study rather than a pilot study, (2) carefully designing the valuation questions to distinguish between voluntary and collective willingness to pay, (3) implementing the survey through standard CV procedures, including dichotomous choice elicitation and a split sample design, (4) including other questions in the CV survey to better understand responses received, and (5) undertaking an opinion survey with which to compare CV response. By so doing, we are able to explore individuals’ payment preferences for renewable energy and test for the offsetting influences of strategic bidding and truth telling/free riding in a particular CV application. This approach is most similar to Champ et al. (2002).
9
3. The Environmental Good and Past Research: Renewable Energy Our exploration of payment preferences and behavioral response in CV surveys is based on a study of willingness to pay for renewable energy. Renewable energy sources include wind, biomass, solar, geothermal, and hydropower. With the exception of hydropower, renewable electricity has historically been more costly than traditional natural gas and coal generation. Nonetheless, use of these resources can provide public environmental, fuel source diversity, and economic development benefits by offsetting traditional forms of electric production. Renewable energy has historically been supported in the U.S. and worldwide through a number of public policy efforts: tax incentives, favorable power purchase contracts, set asides, grant programs, etc. Under each of these policies, the extra cost of renewable energy is recovered collectively through mandatory increases in electric bills or taxes. More recently, however, the introduction of customer choice in electricity markets has given end-use customers the ability to voluntarily support renewable energy through extra payments on their electricity bills. Several opinion surveys have been conducted over the last five years to explore individual preferences for supporting renewable power generation. There is some evidence that U.S. residents prefer collective, mandatory payments for renewable energy to voluntary ones. Sloan and Taddune (1999) report that four “deliberative polling” exercises in Texas found that 47-71% of customers prefer to spread at least some of the costs of renewable energy over all customers, while 17-45% of customers prefer that all payments be made voluntarily. ECAP (1998) similarly finds that 58% of respondents express a preference for spreading the cost of renewable energy over all customers, while 37% prefer voluntary payments. Other surveys (Ferguson 1999) and focus groups (Decision Research 1992, Farhar and Coburn 1999, Farhar 1999) have found similar results. None of these opinion surveys have relied on the contingent valuation method. Moreover, while numerous studies have asked consumers’ WTP for renewable energy, only three such studies have formally used the contingent valuation approach. In each of these cases, the primary purpose of using CV was to test for criterion validity; that is, the difference between stated willingness to pay in a hypothetical CV context and actual WTP as demonstrated through market transactions. Champ and Bishop (1998), for example, explore WTP for wind power under different elicitation methods (dichotomous choice and payment card) and based on hypothetical and actual payments. They find that a hypothetical, dichotomous-choice contingent valuation survey substantially overestimates response compared to either a dichotomous choice or payment card approach that solicits actual contributions. A second major study of a similar kind is reported in Ethier et al. (2000), Poe et al. (1997), and Rose et al. (1997). Using a provision point mechanism, they find that a dichotomous choice CV survey overestimates actual response by approximately 30%, while the results from an open-ended elicitation format approximates actual response. Finally, Byrnes et al. (1999) find that response to a hypothetical green power offer greatly exceeds that for an actual offer.
10
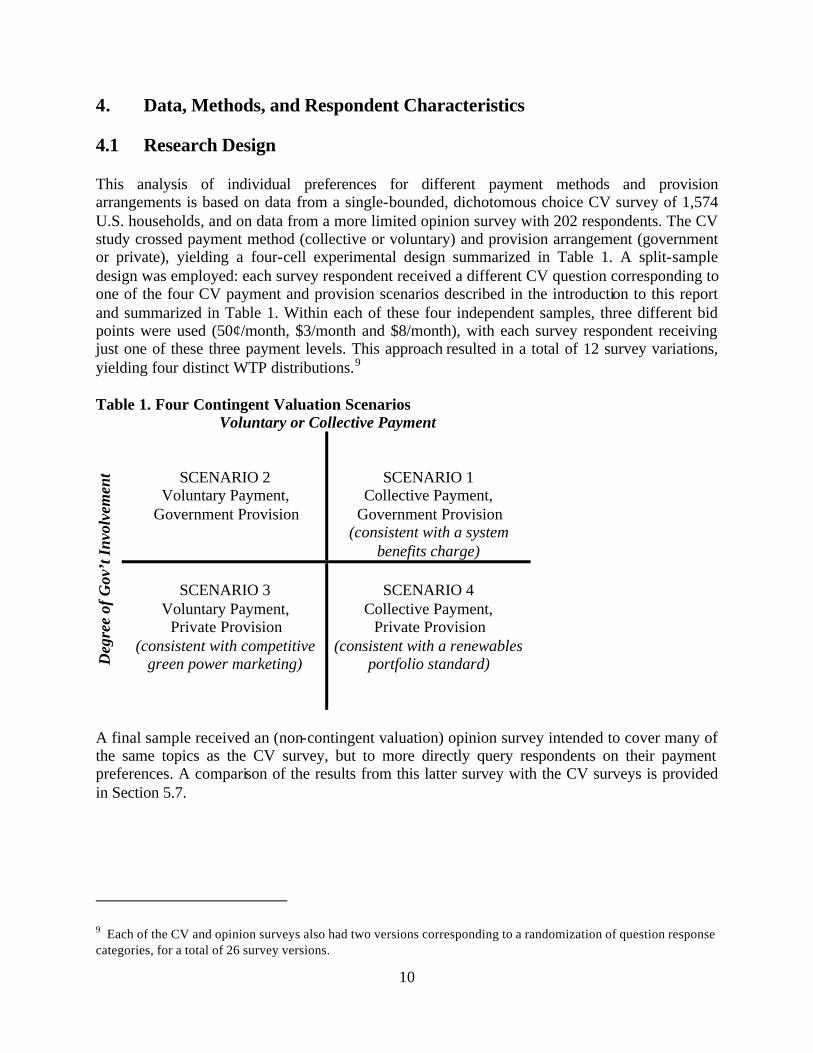
4. Data, Methods, and Respondent Characteristics 4.1 Research Design This analysis of individual preferences for different payment methods and provision arrangements is based on data from a single-bounded, dichotomous choice CV survey of 1,574 U.S. households, and on data from a more limited opinion survey with 202 respondents. The CV study crossed payment method (collective or voluntary) and provision arrangement (government or private), yielding a four-cell experimental design summarized in Table 1. A split-sample design was employed: each survey respondent received a different CV question corresponding to one of the four CV payment and provision scenarios described in the introduction to this report and summarized in Table 1. Within each of these four independent samples, three different bid points were used (50¢/month, $3/month and $8/month), with each survey respondent receiving just one of these three payment levels. This approach resulted in a total of 12 survey variations, yielding four distinct WTP distributions.9 Table 1. Four Contingent Valuation Scenarios
Voluntary or Collective Payment
SCENARIO 2 Voluntary Payment,
Government Provision
SCENARIO 1 Collective Payment,
Government Provision (consistent with a system
benefits charge)
Deg
ree
of G
ov’t
Inv
olve
men
t
SCENARIO 3
Voluntary Payment, Private Provision
(consistent with competitive green power marketing)
SCENARIO 4
Collective Payment, Private Provision
(consistent with a renewables portfolio standard)
A final sample received an (non-contingent valuation) opinion survey intended to cover many of the same topics as the CV survey, but to more directly query respondents on their payment preferences. A comparison of the results from this latter survey with the CV surveys is provided in Section 5.7.
9 Each of the CV and opinion surveys also had two versions corresponding to a randomization of question response categories, for a total of 26 survey versions.
11
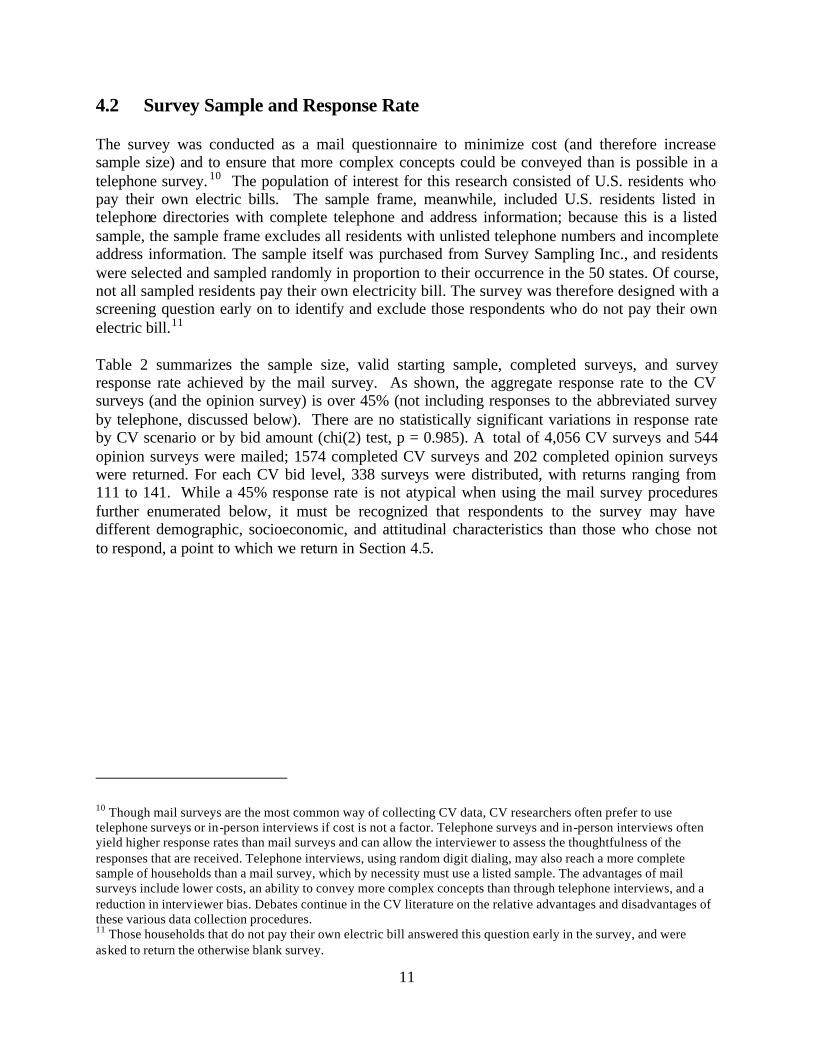
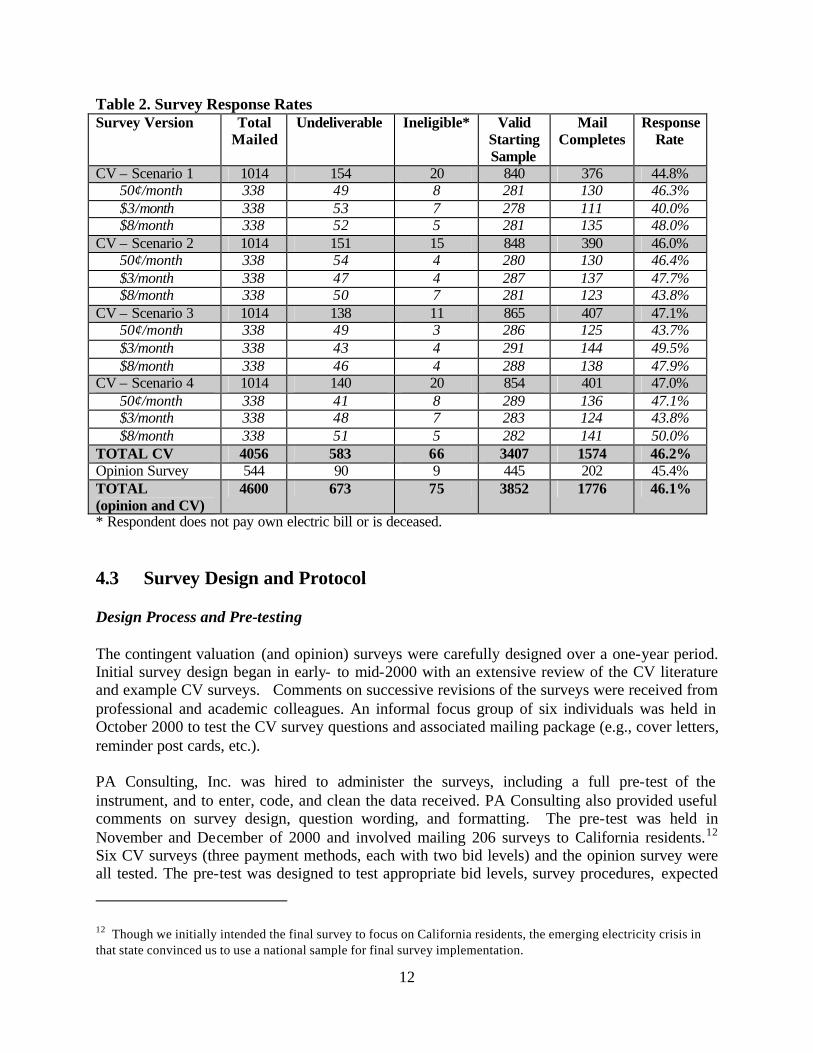
4.2 Survey Sample and Response Rate The survey was conducted as a mail questionnaire to minimize cost (and therefore increase sample size) and to ensure that more complex concepts could be conveyed than is possible in a telephone survey. 10 The population of interest for this research consisted of U.S. residents who pay their own electric bills. The sample frame, meanwhile, included U.S. residents listed in telephone directories with complete telephone and address information; because this is a listed sample, the sample frame excludes all residents with unlisted telephone numbers and incomplete address information. The sample itself was purchased from Survey Sampling Inc., and residents were selected and sampled randomly in proportion to their occurrence in the 50 states. Of course, not all sampled residents pay their own electricity bill. The survey was therefore designed with a screening question early on to identify and exclude those respondents who do not pay their own electric bill.11 Table 2 summarizes the sample size, valid starting sample, completed surveys, and survey response rate achieved by the mail survey. As shown, the aggregate response rate to the CV surveys (and the opinion survey) is over 45% (not including responses to the abbreviated survey by telephone, discussed below). There are no statistically significant variations in response rate by CV scenario or by bid amount (chi(2) test, p = 0.985). A total of 4,056 CV surveys and 544 opinion surveys were mailed; 1574 completed CV surveys and 202 completed opinion surveys were returned. For each CV bid level, 338 surveys were distributed, with returns ranging from 111 to 141. While a 45% response rate is not atypical when using the mail survey procedures further enumerated below, it must be recognized that respondents to the survey may have different demographic, socioeconomic, and attitudinal characteristics than those who chose not to respond, a point to which we return in Section 4.5.
10 Though mail surveys are the most common way of collecting CV data, CV researchers often prefer to use telephone surveys or in-person interviews if cost is not a factor. Telephone surveys and in-person interviews often yield higher response rates than mail surveys and can allow the interviewer to assess the thoughtfulness of the responses that are received. Telephone interviews, using random digit dialing, may also reach a more complete sample of households than a mail survey, which by necessity must use a listed sample. The advantages of mail surveys include lower costs, an ability to convey more complex concepts than through telephone interviews, and a reduction in interviewer bias. Debates continue in the CV literature on the relative advantages and disadvantages of these various data collection procedures. 11 Those households that do not pay their own electric bill answered this question early in the survey, and were asked to return the otherwise blank survey.
12
Table 2. Survey Response Rates Survey Version Total
Mailed Undeliverable Ineligible* Valid
Starting Sample
Mail Completes
Response Rate
CV – Scenario 1 1014 154 20 840 376 44.8% 50¢/month 338 49 8 281 130 46.3% $3/month 338 53 7 278 111 40.0% $8/month 338 52 5 281 135 48.0%
CV – Scenario 2 1014 151 15 848 390 46.0% 50¢/month 338 54 4 280 130 46.4% $3/month 338 47 4 287 137 47.7% $8/month 338 50 7 281 123 43.8%
CV – Scenario 3 1014 138 11 865 407 47.1% 50¢/month 338 49 3 286 125 43.7% $3/month 338 43 4 291 144 49.5% $8/month 338 46 4 288 138 47.9%
CV – Scenario 4 1014 140 20 854 401 47.0% 50¢/month 338 41 8 289 136 47.1% $3/month 338 48 7 283 124 43.8% $8/month 338 51 5 282 141 50.0%
TOTAL CV 4056 583 66 3407 1574 46.2% Opinion Survey 544 90 9 445 202 45.4% TOTAL (opinion and CV)
4600 673 75 3852 1776 46.1%
* Respondent does not pay own electric bill or is deceased. 4.3 Survey Design and Protocol Design Process and Pre-testing The contingent valuation (and opinion) surveys were carefully designed over a one-year period. Initial survey design began in early- to mid-2000 with an extensive review of the CV literature and example CV surveys. Comments on successive revisions of the surveys were received from professional and academic colleagues. An informal focus group of six individuals was held in October 2000 to test the CV survey questions and associated mailing package (e.g., cover letters, reminder post cards, etc.). PA Consulting, Inc. was hired to administer the surveys, including a full pre-test of the instrument, and to enter, code, and clean the data received. PA Consulting also provided useful comments on survey design, question wording, and formatting. The pre-test was held in November and December of 2000 and involved mailing 206 surveys to California residents.12 Six CV surveys (three payment methods, each with two bid levels) and the opinion survey were all tested. The pre-test was designed to test appropriate bid levels, survey procedures, expected
12 Though we initially intended the final survey to focus on California residents, the emerging electricity crisis in that state convinced us to use a national sample for final survey implementation.
13
response rate, and (to some extent) question wording. The survey protocol for the pre-test included: an advance letter, the survey mailing, a reminder postcard, a second survey mailing, and a reminder phone call (3 tries). During the reminder phone call, an abbreviated version of the full survey was also administered. In aggregate, after deleting undeliverable surveys and those respondents who do not pay their own electric bill, a response rate of 55% was achieved. If responses to the abbreviated telephone survey are included, the response rate for the pre-test jumps to 65%. Findings from the focus group and pre-test resulted in changes to certain survey questions and to its overall design.
Survey Protocol Based on successive changes to the survey questions, formatting, and procedures, the final survey was administered from 15 February to 21 May 2001. The survey was formatted and administered in a fashion largely consistent with that recommended by Dillman (2000) in order to maximize response rates at reasonable cost. The following data collection procedures (largely mirroring those used for the pre-test) were used: • Advance Letter: This letter, mailed on University of California at Berkeley letterhead,
informed sampled residents that they had been selected to participate in the study, told them of the study’s purpose, and indicated to them that they would be receiving a survey in the mail within the next couple days (see Appendix A for copies of all of the contact letters).
• Initial Mail Survey Package: The advance letter was followed several days later by a package consisting of a cover letter from the University of California explaining the study, one 12 page CV or 16 page opinion survey booklet, a $1 cash incentive to encourage response, and a postage-paid return envelope.
• Thank You/Reminder Postcard: All sampled residents were mailed a postcard nine days after the initial mail survey was sent. The postcard thanked those who had responded and reminded those who had not yet responded to please do so.
• Follow-up Mail Survey Package: Those residents who had not yet responded to the survey after approximately 3 weeks of receiving the first survey were sent a second copy of the survey booklet, a reminder letter, and a postage-paid envelope.
• Follow-up Telephone Calls: Finally, telephone calls to all non-responders (at least 3 attempts, 2,253 households) were conducted from 2-4 weeks after the follow-up survey mailing. As part of the telephone calls, sampled residents were asked whether they had received the survey and whether they had returned it. Those who had not returned the survey were asked to please complete the survey as soon as possible and return it. If needed, another copy of the survey was mailed the day after the telephone call. Telephone respondents were also asked to answer an abbreviated version of the CV and opinion surveys: 335 CV and 61 opinion surveys were completed in this fashion. Because these were abbreviated versions of the surveys, however, answers to the telephone surveys are no t reported in detail in this report.13
13 It should be noted that any comparison of the telephone survey responses with the mail responses is confounded by a number of factors. First, the number of telephone responses does not allow for a reliable comparison of answers to the CV valuation question across survey modes. Second, the telephone survey was conducted after several attempts at eliciting a mail response, and respondents may therefore have different characteristics than those who
14
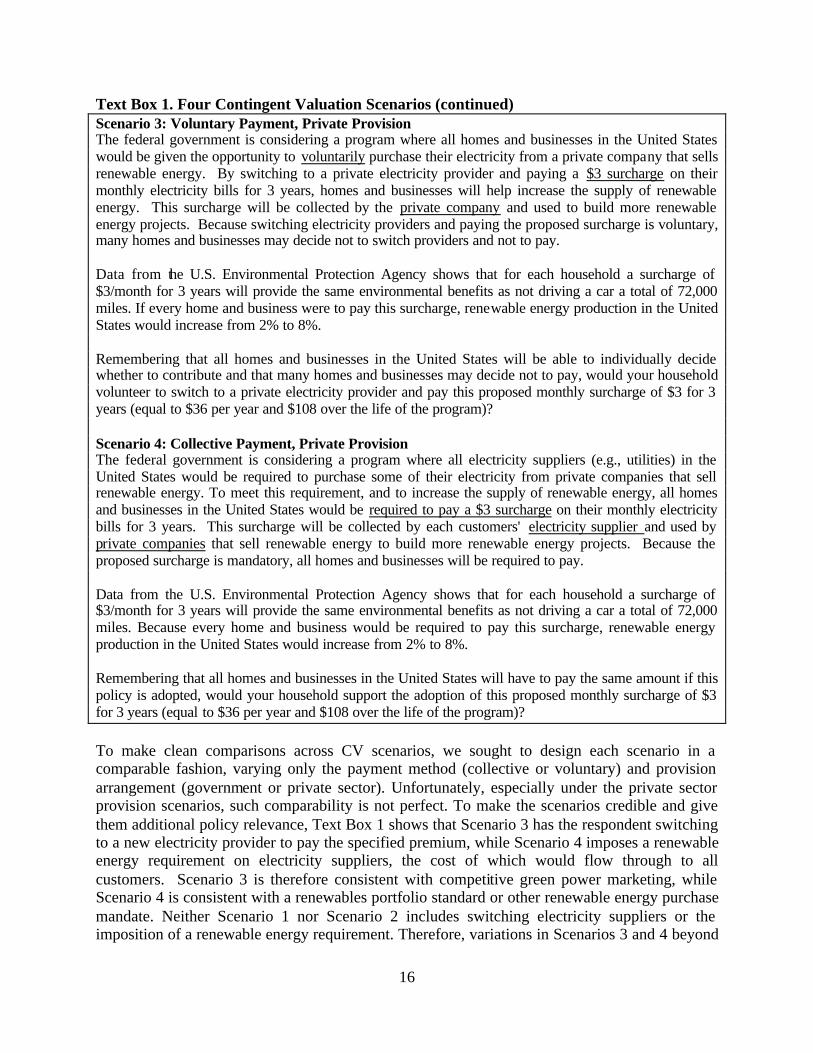
Example copies of the contingent valuation and opinion mail surveys are provided in Appendix B and C, respectively. An example of the telephone script is reproduced in Appendix D. 4.4 The Survey Instrument and Valuation Scenarios The CV survey questionnaire is 12 pages long and is divided into four sections. As is typical in contingent valuation, the first section of the survey contains “warm up” questions to get the respondent thinking about energy in general and renewable energy in particular, and to do so in a neutral fashion. Several of the questions are also designed to define terms used later in the survey. Five point, Likert-scale questions are used to provide respondents information on the possible benefits and costs of renewable energy. The questions included in this section of the survey, and their responses, are not highlighted in this report because they are unrelated to the primary purpose of the study. Responses to these questions are included in Appendix E for the interested reader (responses from the same questions in the opinion survey are omitted). The second section of the CV survey contains the valuation exercise. This section begins with background information to (1) impress upon the respondent the policy relevance of their response, and (2) encourage respondents to think carefully about their response in the context of their household budget. The actual language can be seen in Appendix B. The valuation question follows. As noted earlier, each respondent received one of four CV valuation scenarios, which vary based on whether payment is voluntary or collective, and whether the funds are collected and spent by the government or by electricity retailers. Each respondent was presented with information on the valuation scenario, and the potential environmental impacts of the scenario were described. Finally, respondents were asked a yes/no question on whether they would be willing to pay or support a specified premium on their electric bill for three years to increase the supply of renewable energy. The hypothetical payment was limited to three years to make the payment more tangible than a longer or indefinite payment duration. Different surveys contained different proposed premiums. In particular, three bid points, or payment levels, were used: 50¢/month, $3/month and $8/month. 14 The number of bid points and their spacing was chosen based on research design considerations and on pre-test results. Rather than seeking an accurate estimate of the mean WTP, our interest was in comparing WTP responses across payment and provision contexts at each bid level. This resulted in a bid design with many observations at a small number of bid points as we sought to narrow the confidence interval around WTP at each bid point. Each of the four specific valuation scenarios is reproduced in Text Box 1 for the $3 bid level.
responded to the mail survey. Third, the telephone survey was an abbreviated version of the mail survey. And finally, the telephone survey clearly used a different survey mode than the mail survey. That said, to test for possible non-response effects, the telephone survey is somewhat helpful, and Section 4.5 of this report provides a limited comparison of responses to the two survey modes. 14 We should note that this is not a standard contingent valuation study in which a single environmental good is being valued. In particular, in this survey higher bid levels correspond to more renewable energy being supplied and increased environmental improvements. This is consistent with the approach taken in several other CV studies (see, e.g., Berrens et al. 1998, Champ et al. 1997), but may be better classified as “contingent choice” than “contingent valuation.”
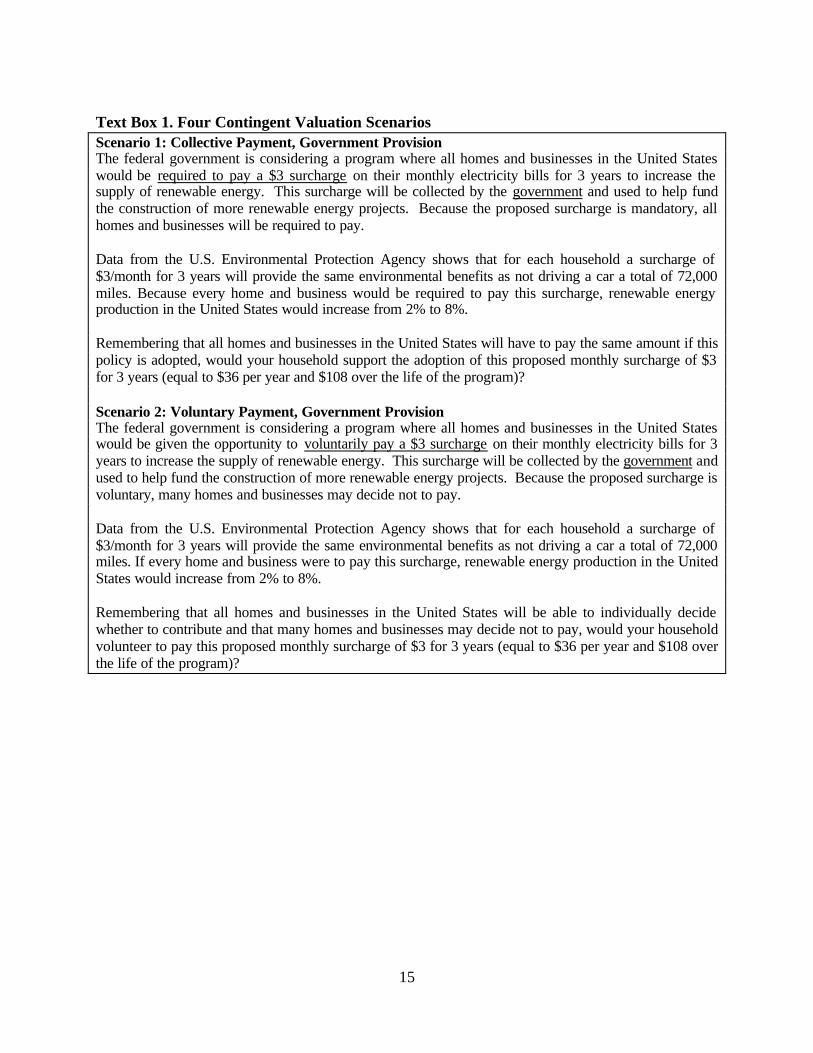
15
Text Box 1. Four Contingent Valuation Scenarios Scenario 1: Collective Payment, Government Provision The federal government is considering a program where all homes and businesses in the United States would be required to pay a $3 surcharge on their monthly electricity bills for 3 years to increase the supply of renewable energy. This surcharge will be collected by the government and used to help fund the construction of more renewable energy projects. Because the proposed surcharge is mandatory, all homes and businesses will be required to pay. Data from the U.S. Environmental Protection Agency shows that for each household a surcharge of $3/month for 3 years will provide the same environmental benefits as not driving a car a total of 72,000 miles. Because every home and business would be required to pay this surcharge, renewable energy production in the United States would increase from 2% to 8%. Remembering that all homes and businesses in the United States will have to pay the same amount if this policy is adopted, would your household support the adoption of this proposed monthly surcharge of $3 for 3 years (equal to $36 per year and $108 over the life of the program)? Scenario 2: Voluntary Payment, Government Provision The federal government is considering a program where all homes and businesses in the United States would be given the opportunity to voluntarily pay a $3 surcharge on their monthly electricity bills for 3 years to increase the supply of renewable energy. This surcharge will be collected by the government and used to help fund the construction of more renewable energy projects. Because the proposed surcharge is voluntary, many homes and businesses may decide not to pay. Data from the U.S. Environmental Protection Agency shows that for each household a surcharge of $3/month for 3 years will provide the same environmental benefits as not driving a car a total of 72,000 miles. If every home and business were to pay this surcharge, renewable energy production in the United States would increase from 2% to 8%. Remembering that all homes and businesses in the United States will be able to individually decide whether to contribute and that many homes and businesses may decide not to pay, would your household volunteer to pay this proposed monthly surcharge of $3 for 3 years (equal to $36 per year and $108 over the life of the program)?
16
Text Box 1. Four Contingent Valuation Scenarios (continued) Scenario 3: Voluntary Payment, Private Provision The federal government is considering a program where all homes and businesses in the United States would be given the opportunity to voluntarily purchase their electricity from a private company that sells renewable energy. By switching to a private electricity provider and paying a $3 surcharge on their monthly electricity bills for 3 years, homes and businesses will help increase the supply of renewable energy. This surcharge will be collected by the private company and used to build more renewable energy projects. Because switching electricity providers and paying the proposed surcharge is voluntary, many homes and businesses may decide not to switch providers and not to pay. Data from the U.S. Environmental Protection Agency shows that for each household a surcharge of $3/month for 3 years will provide the same environmental benefits as not driving a car a total of 72,000 miles. If every home and business were to pay this surcharge, renewable energy production in the United States would increase from 2% to 8%. Remembering that all homes and businesses in the United States will be able to individually decide whether to contribute and that many homes and businesses may decide not to pay, would your household volunteer to switch to a private electricity provider and pay this proposed monthly surcharge of $3 for 3 years (equal to $36 per year and $108 over the life of the program)? Scenario 4: Collective Payment, Private Provision The federal government is considering a program where all electricity suppliers (e.g., utilities) in the United States would be required to purchase some of their electricity from private companies that sell renewable energy. To meet this requirement, and to increase the supply of renewable energy, all homes and businesses in the United States would be required to pay a $3 surcharge on their monthly electricity bills for 3 years. This surcharge will be collected by each customers' electricity supplier and used by private companies that sell renewable energy to build more renewable energy projects. Because the proposed surcharge is mandatory, all homes and businesses will be required to pay. Data from the U.S. Environmental Protection Agency shows that for each household a surcharge of $3/month for 3 years will provide the same environmental benefits as not driving a car a total of 72,000 miles. Because every home and business would be required to pay this surcharge, renewable energy production in the United States would increase from 2% to 8%. Remembering that all homes and businesses in the United States will have to pay the same amount if this policy is adopted, would your household support the adoption of this proposed monthly surcharge of $3 for 3 years (equal to $36 per year and $108 over the life of the program)?
To make clean comparisons across CV scenarios, we sought to design each scenario in a comparable fashion, varying only the payment method (collective or voluntary) and provision arrangement (government or private sector). Unfortunately, especially under the private sector provision scenarios, such comparability is not perfect. To make the scenarios credible and give them additional policy relevance, Text Box 1 shows that Scenario 3 has the respondent switching to a new electricity provider to pay the specified premium, while Scenario 4 imposes a renewable energy requirement on electricity suppliers, the cost of which would flow through to all customers. Scenario 3 is therefore consistent with competitive green power marketing, while Scenario 4 is consistent with a renewables portfolio standard or other renewable energy purchase mandate. Neither Scenario 1 nor Scenario 2 includes switching electricity suppliers or the imposition of a renewable energy requirement. Therefore, variations in Scenarios 3 and 4 beyond
17
the specific treatment effects of payment method and provision arrangement must be considered when interpreting survey results. While this makes it more difficult to derive definitive conclusions on the impact of payment and provision arrangements, it also makes the scenarios consistent with current renewable energy support programs, offering a degree of social relevancy that would not have been possible if the scenarios had been designed differently. For those respondents who said they were not willing to pay the specified premium, the next question queried them on their reasons. Meanwhile, respondents who indicated they were willing to pay were asked how certain they were about their response on a 5-point scale. Finally, all survey participants were asked what percent of U.S. residents they believe would support the mandatory or voluntary payment for the specific CV scenario they received. Responses to this last question are used later in this report to test for relationships between the stated WTP of survey respondents and the expectations of those same respondents for the WTP of other U.S. residents. The third section of the CV survey includes a series of questions with Likert-scale response categories. The questions include 10 agree/disagree statements that might be correlated with responses to the valuation question, including statements that relate to free-riding, bandwagon effects and participation expectations, trust in the government and the private marketplace, and early adoption. These statements, and a summary of the responses to the statements on a 5-point scale, are provided in Appendix E (again, we omit similar responses to the opinion survey here). Also included in this section of the survey is a question that asks which of a number of “environmental” activities the respondent does on a regular basis. Two questions that assess the degree to which respondents believe that individuals and the government can help solve a number of environmental problems are also included. Responses to these questions are also summarized in Appendix E, but are not highlighted in this report. The final section of the survey collects demographic and socioeconomic information: age, sex, children, education, political leaning, and income. The 16-page opinion survey is, in many respects, similar to the CV survey. The same warm up questions are used, and the same demographic and socioeconomic information is collected. Instead of a CV valuation scenario, however, respondents are simply asked several questions about how they believe renewable energy should be supported, if at all. The opinion survey also asks a number of questions about voluntarily purchasing renewable energy that are not included in the CV survey. These questions were included to assess the respondents’ interest in voluntarily supporting renewable energy under a variety of conditions. The specific questions and their responses are reported later. Appendices A through D present examples of all survey materials. Customer contact letters are presented in Appendix A. Appendix B provides illustrative examples of the contingent valuation surveys: Scenario 1 at the 50¢/month bid level, Scenario 2 at the $3/month bid level, Scenario 3 at the $8/month bid level, and Scenario 4 at the 50¢/month bid level. An example of the opinion survey is reproduced in Appendix C. Appendix D provides example telephone survey scripts for the “follow-up” contingent valuation and opinion surveys that were conducted via telephone.
18
4.5 Descriptive Statistics and Tests for Non-Response Bias Table 3 summarizes responses to the demographic and socioeconomic questions, as well as the location of the respondent’s household and whether the respondent owns or rents their residence for both the CV and opinion surveys. Importantly, there appear to be no systematic differences in the respondents by survey type or version. Therefore, one can assume that any differences that occur in WTP across the various survey versions are related to treatment effects, not differences in demographic or socioeconomic characteristics. Two standard concerns in survey research are those of non-response and coverage bias. Non-response bias relates to whether individuals who fail to respond to a survey have different characteristics and attitudes than those who do respond, whereas coverage bias deals with whether the sample frame adequately covers the target population. The best way to control for these effects is to achieve a high response rate to the survey and to carefully design one’s sample frame. Even after taking exhaustive steps to improve the response rate, however, the majority of individuals in our sample (55%) failed to respond. And, by using a listed sample, our sample frame excludes individua ls who are in the target population but who have unlisted telephone numbers or incomplete address information. Results from our survey offer two ways of (imperfectly) testing for these effects. The first approach is to compare the demographic and socioeconomic characteristics of the respondents to the survey with U.S. Census data on the characteristics of the U.S. population as a whole. In so doing, some differences become apparent. Specifically, compared to 2000 Census estimates, respondents to this survey appear better educated (92% completed high school compared to 82% in the census, and 38% have a bachelor’s degree or higher compared to 25% in the census), have higher incomes ($67,000 mean household income compared to $55,000 in the census), are more likely to be male (62% male compared to 49% among the larger population), and are more likely to own their own household (82% compared to 66% in the census) than the general population. These differences may be caused by either coverage or non-response bias, and should therefore be considered when interpreting the results of this survey. It is important to acknowledge, however, that these differences may also simply reflect differences in target populations: the Census targets all U.S. residents while our survey targeted only those residents who pay their own electric bill. This makes strong conclusions about non-response and coverage bias on this basis impossible.
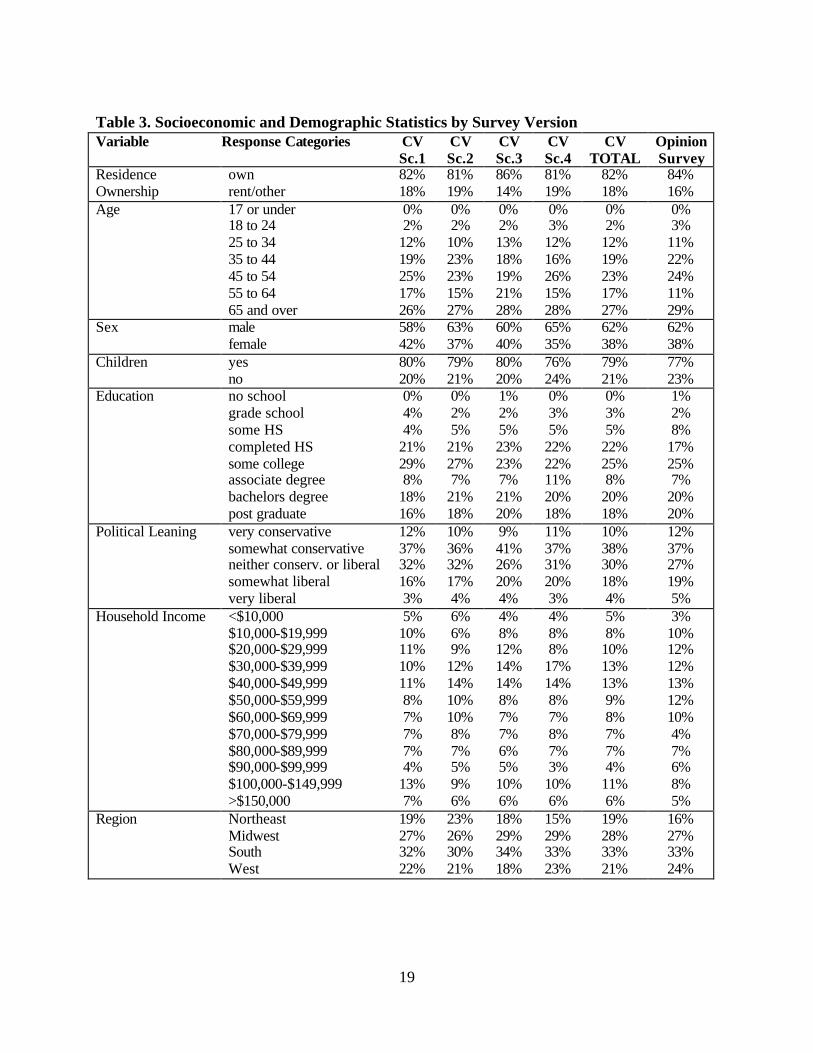
19
Table 3. Socioeconomic and Demographic Statistics by Survey Version Variable Response Categories CV
Sc.1 CV Sc.2
CV Sc.3
CV Sc.4
CV TOTAL
Opinion Survey
Residence Ownership
own rent/other
82% 18%
81% 19%
86% 14%
81% 19%
82% 18%
84% 16%
Age 17 or under 18 to 24 25 to 34 35 to 44 45 to 54 55 to 64 65 and over
0% 2%
12% 19% 25% 17% 26%
0% 2%
10% 23% 23% 15% 27%
0% 2% 13% 18% 19% 21% 28%
0% 3%
12% 16% 26% 15% 28%
0% 2%
12% 19% 23% 17% 27%
0% 3%
11% 22% 24% 11% 29%
Sex male female
58% 42%
63% 37%
60% 40%
65% 35%
62% 38%
62% 38%
Children yes no
80% 20%
79% 21%
80% 20%
76% 24%
79% 21%
77% 23%
Education no school grade school some HS completed HS some college associate degree bachelors degree post graduate
0% 4% 4%
21% 29% 8%
18% 16%
0% 2% 5%
21% 27% 7%
21% 18%
1% 2% 5% 23% 23% 7% 21% 20%
0% 3% 5%
22% 22% 11% 20% 18%
0% 3% 5%
22% 25% 8%
20% 18%
1% 2% 8%
17% 25% 7%
20% 20%
Political Leaning very conservative somewhat conservative neither conserv. or liberal somewhat liberal very liberal
12% 37% 32% 16% 3%
10% 36% 32% 17% 4%
9% 41% 26% 20% 4%
11% 37% 31% 20% 3%
10% 38% 30% 18% 4%
12% 37% 27% 19% 5%
Household Income <$10,000 $10,000-$19,999 $20,000-$29,999 $30,000-$39,999 $40,000-$49,999 $50,000-$59,999 $60,000-$69,999 $70,000-$79,999 $80,000-$89,999 $90,000-$99,999 $100,000-$149,999 >$150,000
5% 10% 11% 10% 11% 8% 7% 7% 7% 4%
13% 7%
6% 6% 9%
12% 14% 10% 10% 8% 7% 5% 9% 6%
4% 8% 12% 14% 14% 8% 7% 7% 6% 5% 10% 6%
4% 8% 8%
17% 14% 8% 7% 8% 7% 3%
10% 6%
5% 8%
10% 13% 13% 9% 8% 7% 7% 4%
11% 6%
3% 10% 12% 12% 13% 12% 10% 4% 7% 6% 8% 5%
Region Northeast Midwest South West
19% 27% 32% 22%
23% 26% 30% 21%
18% 29% 34% 18%
15% 29% 33% 23%
19% 28% 33% 21%
16% 27% 33% 24%
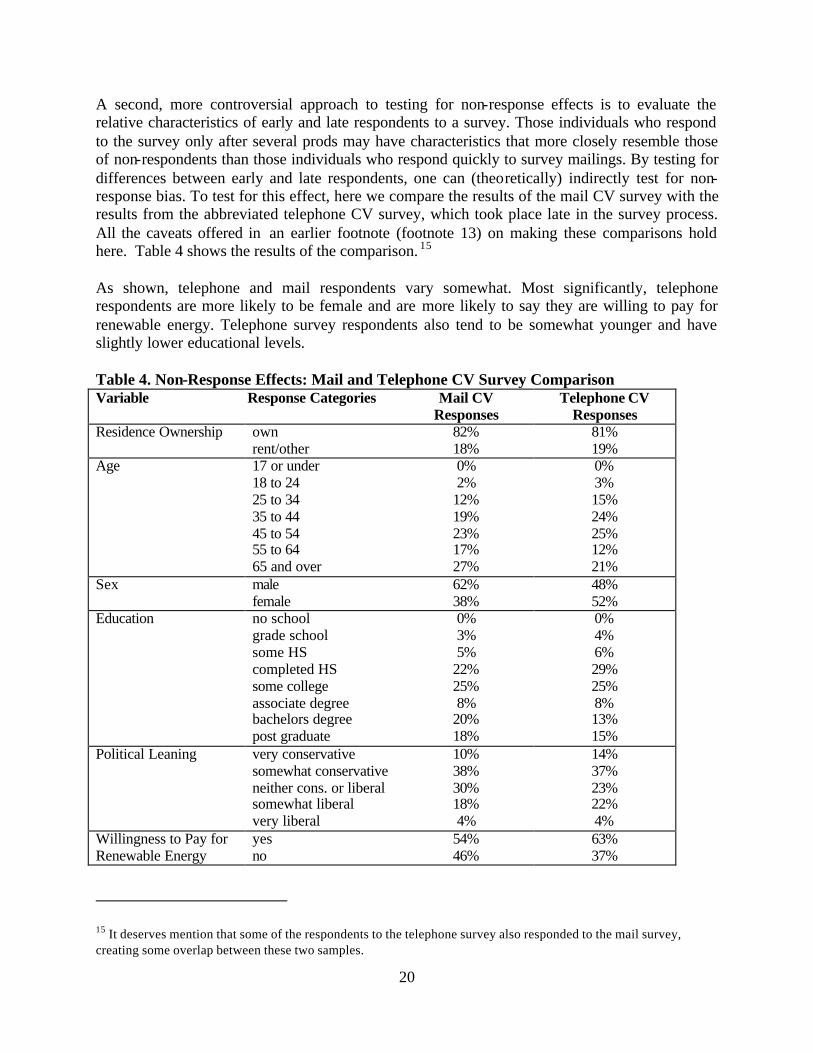
20
A second, more controversial approach to testing for non-response effects is to evaluate the relative characteristics of early and late respondents to a survey. Those individuals who respond to the survey only after several prods may have characteristics that more closely resemble those of non-respondents than those individuals who respond quickly to survey mailings. By testing for differences between early and late respondents, one can (theoretically) indirectly test for non-response bias. To test for this effect, here we compare the results of the mail CV survey with the results from the abbreviated telephone CV survey, which took place late in the survey process. All the caveats offered in an earlier footnote (footnote 13) on making these comparisons hold here. Table 4 shows the results of the comparison. 15 As shown, telephone and mail respondents vary somewhat. Most significantly, telephone respondents are more likely to be female and are more likely to say they are willing to pay for renewable energy. Telephone survey respondents also tend to be somewhat younger and have slightly lower educational levels.
Table 4. Non-Response Effects: Mail and Telephone CV Survey Comparison Variable Response Categories Mail CV
Responses Telephone CV
Responses Residence Ownership own
rent/other 82% 18%
81% 19%
Age 17 or under 18 to 24 25 to 34 35 to 44 45 to 54 55 to 64 65 and over
0% 2%
12% 19% 23% 17% 27%
0% 3% 15% 24% 25% 12% 21%
Sex male female
62% 38%
48% 52%
Education no school grade school some HS completed HS some college associate degree bachelors degree post graduate
0% 3% 5%
22% 25% 8%
20% 18%
0% 4% 6% 29% 25% 8% 13% 15%
Political Leaning very conservative somewhat conservative neither cons. or liberal somewhat liberal very liberal
10% 38% 30% 18% 4%
14% 37% 23% 22% 4%
Willingness to Pay for Renewable Energy
yes no
54% 46%
63% 37%
15 It deserves mention that some of the respondents to the telephone survey also responded to the mail survey, creating some overlap between these two samples.
21
Overall, these results suggest that some level of non-response and coverage bias exists, but assessing the magnitude or importance of the bias with these results alone is difficult. Comparing survey results with Census data is imperfect given different target populations, while comparisons between telephone and mail survey responses confound non-response bias with survey mode and other effects. Overall, a comparison with Census data suggests a non-respondent population that may be less interested in supporting renewable energy (lower education and income, and more renters), while a comparison to telephone survey responses appears to support the opposite conclusion (those responding later to the survey appear more willing to pay for renewable energy). The impacts of non-response and coverage effects on the survey results presented in this report are therefore ambiguous.
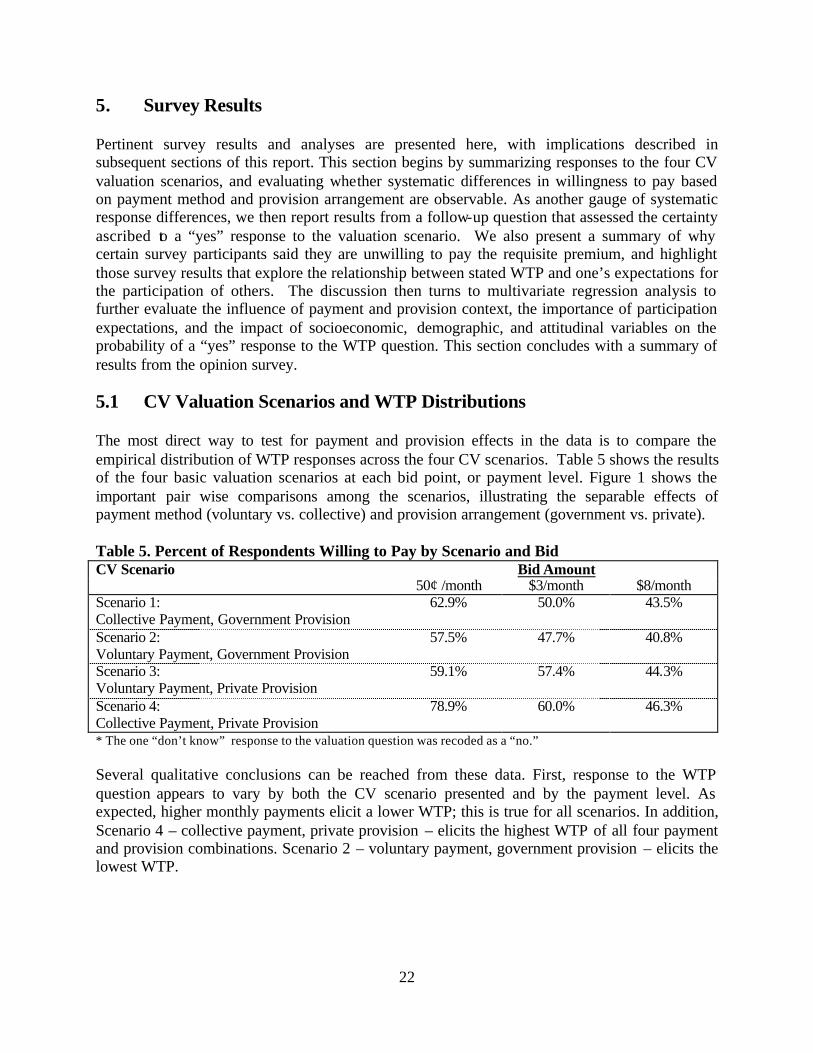
22
5. Survey Results Pertinent survey results and analyses are presented here, with implications described in subsequent sections of this report. This section begins by summarizing responses to the four CV valuation scenarios, and evaluating whether systematic differences in willingness to pay based on payment method and provision arrangement are observable. As another gauge of systematic response differences, we then report results from a follow-up question that assessed the certainty ascribed to a “yes” response to the valuation scenario. We also present a summary of why certain survey participants said they are unwilling to pay the requisite premium, and highlight those survey results that explore the relationship between stated WTP and one’s expectations for the participation of others. The discussion then turns to multivariate regression analysis to further evaluate the influence of payment and provision context, the importance of participation expectations, and the impact of socioeconomic, demographic, and attitudinal variables on the probability of a “yes” response to the WTP question. This section concludes with a summary of results from the opinion survey.
5.1 CV Valuation Scenarios and WTP Distributions The most direct way to test for payment and provision effects in the data is to compare the empirical distribution of WTP responses across the four CV scenarios. Table 5 shows the results of the four basic valuation scenarios at each bid point, or payment level. Figure 1 shows the important pair wise comparisons among the scenarios, illustrating the separable effects of payment method (voluntary vs. collective) and provision arrangement (government vs. private). Table 5. Percent of Respondents Willing to Pay by Scenario and Bid
Bid Amount CV Scenario 50¢ /month $3/month $8/month
Scenario 1: Collective Payment, Government Provision
62.9% 50.0% 43.5%
Scenario 2: Voluntary Payment, Government Provision
57.5% 47.7% 40.8%
Scenario 3: Voluntary Payment, Private Provision
59.1% 57.4% 44.3%
Scenario 4: Collective Payment, Private Provision
78.9% 60.0% 46.3%
* The one “don’t know” response to the valuation question was recoded as a “no.”
Several qualitative conclusions can be reached from these data. First, response to the WTP question appears to vary by both the CV scenario presented and by the payment level. As expected, higher monthly payments elicit a lower WTP; this is true for all scenarios. In addition, Scenario 4 – collective payment, private provision – elicits the highest WTP of all four payment and provision combinations. Scenario 2 – voluntary payment, government provision – elicits the lowest WTP.
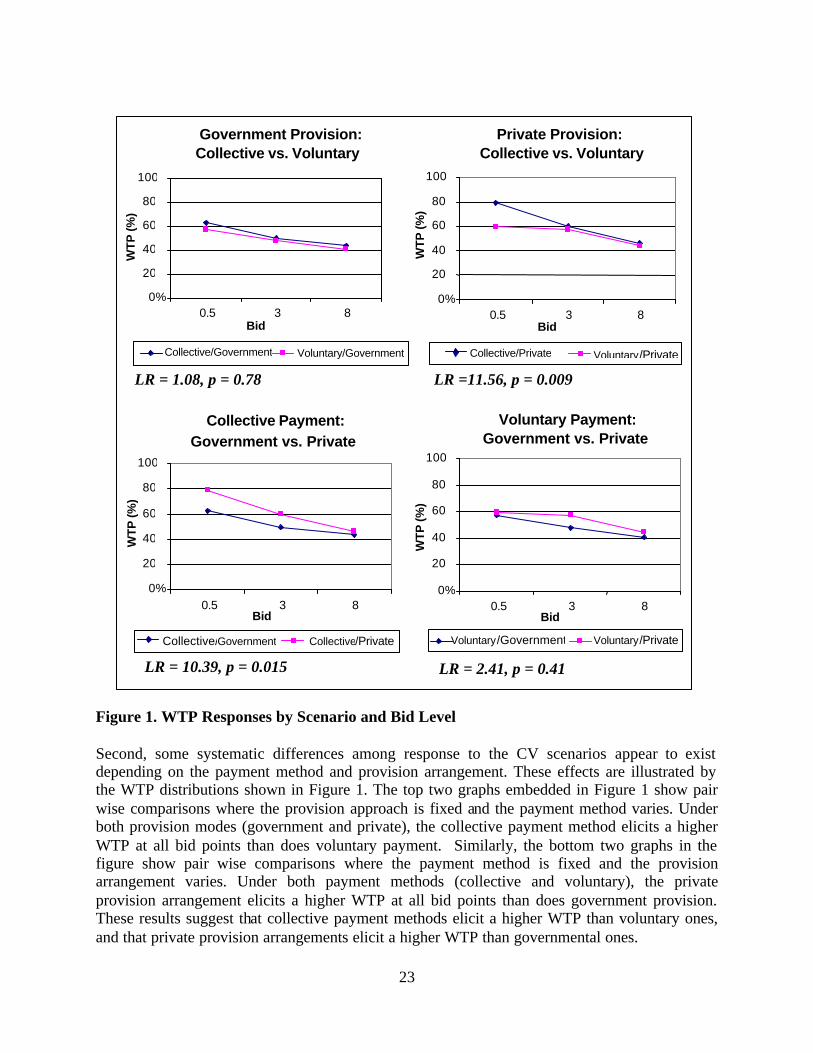
23
Figure 1. WTP Responses by Scenario and Bid Level Second, some systematic differences among response to the CV scenarios appear to exist depending on the payment method and provision arrangement. These effects are illustrated by the WTP distributions shown in Figure 1. The top two graphs embedded in Figure 1 show pair wise comparisons where the provision approach is fixed and the payment method varies. Under both provision modes (government and private), the collective payment method elicits a higher WTP at all bid points than does voluntary payment. Similarly, the bottom two graphs in the figure show pair wise comparisons where the payment method is fixed and the provision arrangement varies. Under both payment methods (collective and voluntary), the private provision arrangement elicits a higher WTP at all bid points than does government provision. These results suggest that collective payment methods elicit a higher WTP than voluntary ones, and that private provision arrangements elicit a higher WTP than governmental ones.
Government Provision: Collective vs. Voluntary
0%
20
40
60
80
100
0.5 3 8 Bid
WT
P (%
)
Collective/Government Voluntary/Government
Private Provision: Collective vs. Voluntary
0%
20
40
60
80
100
0.5 3 8 Bid
WT
P (%
)
Collective/Private Voluntary/Private
Collective Payment: Government vs. Private
0%
20
40
60
80
100
0.5 3 8 Bid
WT
P (%
)
Collective/Government Collective/Private
Voluntary Payment: Government vs. Private
0%
20
40
60
80
100
0.5 3 8 Bid
WT
P (%
)
Voluntary/Government Voluntary/Private
LR = 1.08, p = 0.78 LR =11.56, p = 0.009
LR = 10.39, p = 0.015 LR = 2.41, p = 0.41
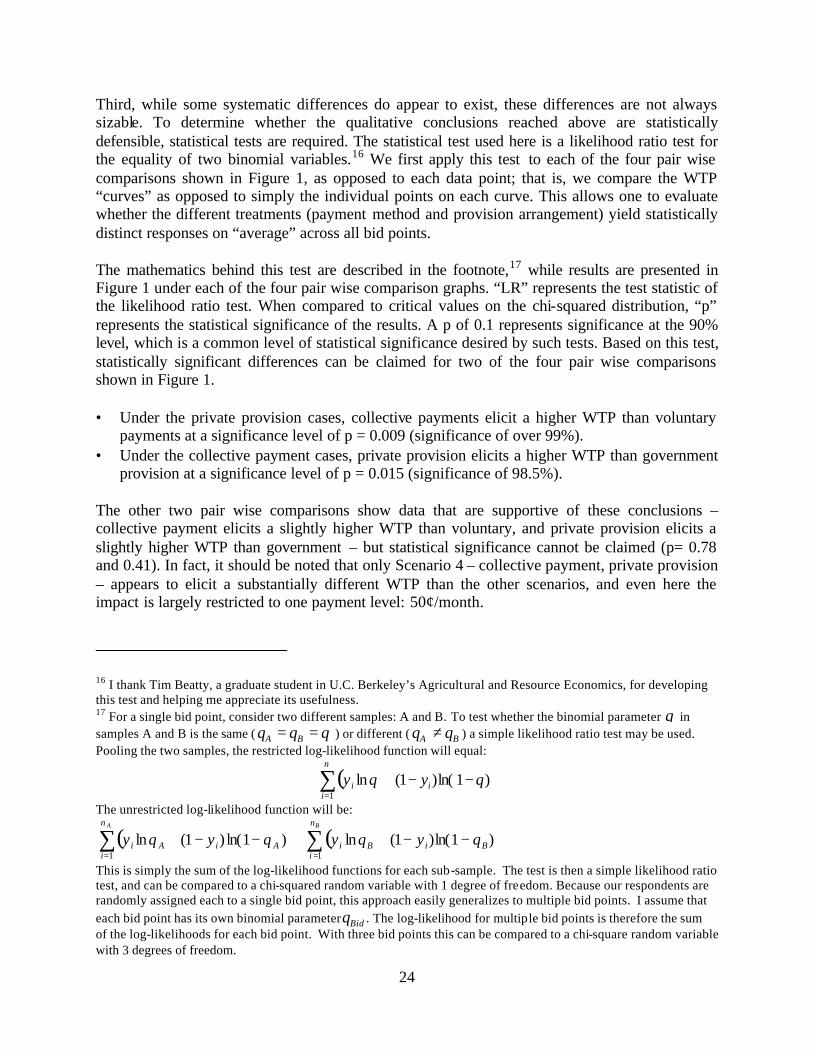
24
Third, while some systematic differences do appear to exist, these differences are not always sizable. To determine whether the qualitative conclusions reached above are statistically defensible, statistical tests are required. The statistical test used here is a likelihood ratio test for the equality of two binomial variables.16 We first apply this test to each of the four pair wise comparisons shown in Figure 1, as opposed to each data point; that is, we compare the WTP “curves” as opposed to simply the individual points on each curve. This allows one to evaluate whether the different treatments (payment method and provision arrangement) yield statistically distinct responses on “average” across all bid points. The mathematics behind this test are described in the footnote,17 while results are presented in Figure 1 under each of the four pair wise comparison graphs. “LR” represents the test statistic of the likelihood ratio test. When compared to critical values on the chi-squared distribution, “p” represents the statistical significance of the results. A p of 0.1 represents significance at the 90% level, which is a common level of statistical significance desired by such tests. Based on this test, statistically significant differences can be claimed for two of the four pair wise comparisons shown in Figure 1. • Under the private provision cases, collective payments elicit a higher WTP than voluntary
payments at a significance level of p = 0.009 (significance of over 99%). • Under the collective payment cases, private provision elicits a higher WTP than government
provision at a significance level of p = 0.015 (significance of 98.5%). The other two pair wise comparisons show data that are supportive of these conclusions – collective payment elicits a slightly higher WTP than voluntary, and private provision elicits a slightly higher WTP than government – but statistical significance cannot be claimed (p= 0.78 and 0.41). In fact, it should be noted that only Scenario 4 – collective payment, private provision – appears to elicit a substantially different WTP than the other scenarios, and even here the impact is largely restricted to one payment level: 50¢/month.
16 I thank Tim Beatty, a graduate student in U.C. Berkeley’s Agricultural and Resource Economics, for developing this test and helping me appreciate its usefulness. 17 For a single bid point, consider two different samples: A and B. To test whether the binomial parameter θ in samples A and B is the same ( θA = θB = θ ) or different ( θA ≠ θB ) a simple likelihood ratio test may be used. Pooling the two samples, the restricted log-likelihood function will equal:
y i lnθ + (1− yi)ln( 1− θ)( )i=1
n
∑
The unrestricted log-likelihood function will be:
y i lnθ A + (1 − y i) ln(1− θ A )( )i=1
n A
∑ + y i lnθB + (1− y i)ln(1 − θB)( )i =1
nB
∑
This is simply the sum of the log-likelihood functions for each sub-sample. The test is then a simple likelihood ratio test, and can be compared to a chi-squared random variable with 1 degree of freedom. Because our respondents are randomly assigned each to a single bid point, this approach easily generalizes to multiple bid points. I assume that each bid point has its own binomial parameterθBid . The log-likelihood for multiple bid points is therefore the sum of the log-likelihoods for each bid point. With three bid points this can be compared to a chi-square random variable with 3 degrees of freedom.
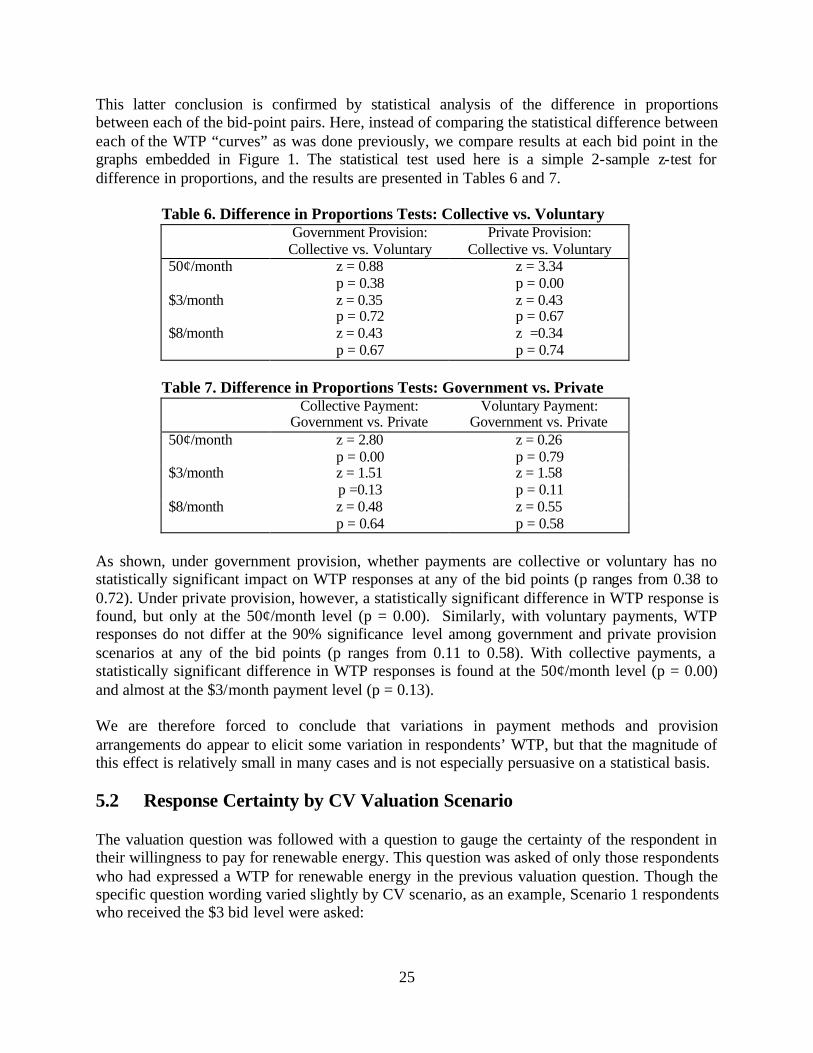
25
This latter conclusion is confirmed by statistical analysis of the difference in proportions between each of the bid-point pairs. Here, instead of comparing the statistical difference between each of the WTP “curves” as was done previously, we compare results at each bid point in the graphs embedded in Figure 1. The statistical test used here is a simple 2-sample z-test for difference in proportions, and the results are presented in Tables 6 and 7.
Table 6. Difference in Proportions Tests: Collective vs. Voluntary Government Provision:
Collective vs. Voluntary Private Provision:
Collective vs. Voluntary 50¢/month z = 0.88
p = 0.38 z = 3.34 p = 0.00
$3/month z = 0.35 p = 0.72
z = 0.43 p = 0.67
$8/month z = 0.43 p = 0.67
z =0.34 p = 0.74
Table 7. Difference in Proportions Tests: Government vs. Private Collective Payment:
Government vs. Private Voluntary Payment:
Government vs. Private 50¢/month z = 2.80
p = 0.00 z = 0.26 p = 0.79
$3/month z = 1.51 p =0.13
z = 1.58 p = 0.11
$8/month z = 0.48 p = 0.64
z = 0.55 p = 0.58
As shown, under government provision, whether payments are collective or voluntary has no statistically significant impact on WTP responses at any of the bid points (p ranges from 0.38 to 0.72). Under private provision, however, a statistically significant difference in WTP response is found, but only at the 50¢/month level (p = 0.00). Similarly, with voluntary payments, WTP responses do not differ at the 90% significance level among government and private provision scenarios at any of the bid points (p ranges from 0.11 to 0.58). With collective payments, a statistically significant difference in WTP responses is found at the 50¢/month level (p = 0.00) and almost at the $3/month payment level (p = 0.13). We are therefore forced to conclude that variations in payment methods and provision arrangements do appear to elicit some variation in respondents’ WTP, but that the magnitude of this effect is relatively small in many cases and is not especially persuasive on a statistical basis.
5.2 Response Certainty by CV Valuation Scenario The valuation question was followed with a question to gauge the certainty of the respondent in their willingness to pay for renewable energy. This question was asked of only those respondents who had expressed a WTP for renewable energy in the previous valuation question. Though the specific question wording varied slightly by CV scenario, as an example, Scenario 1 respondents who received the $3 bid level were asked:
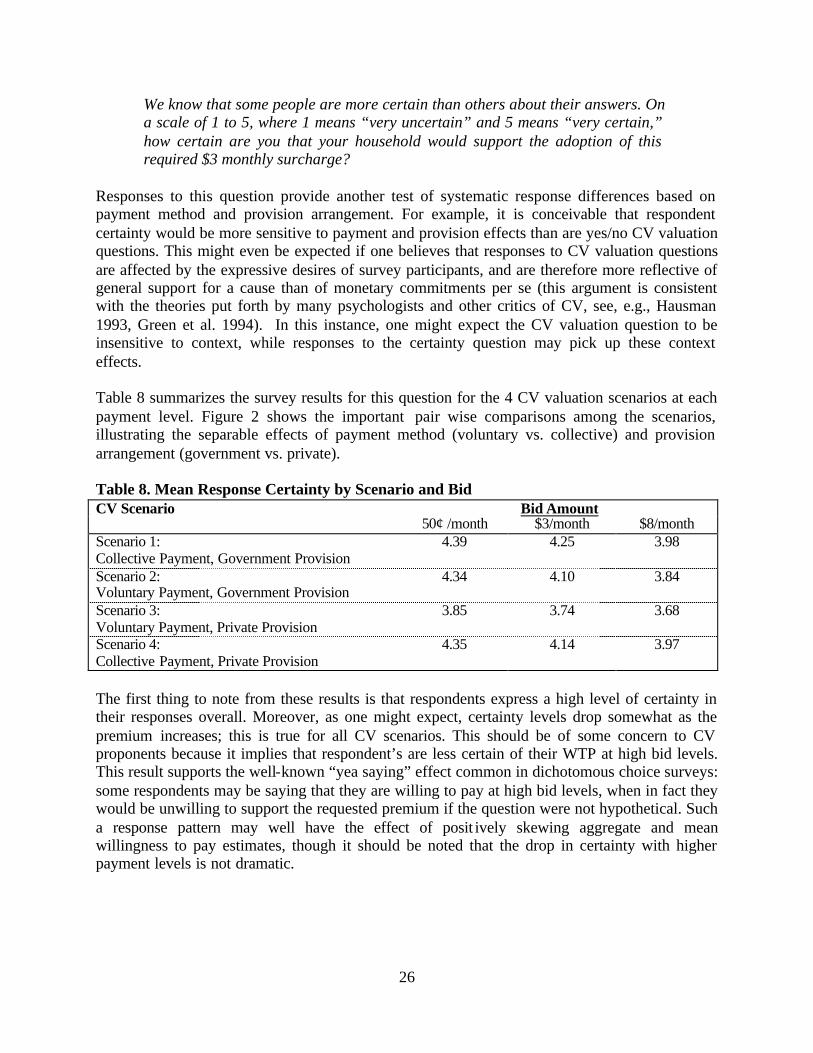
26
We know that some people are more certain than others about their answers. On a scale of 1 to 5, where 1 means “very uncertain” and 5 means “very certain,” how certain are you that your household would support the adoption of this required $3 monthly surcharge?
Responses to this question provide another test of systematic response differences based on payment method and provision arrangement. For example, it is conceivable that respondent certainty would be more sensitive to payment and provision effects than are yes/no CV valuation questions. This might even be expected if one believes that responses to CV valuation questions are affected by the expressive desires of survey participants, and are therefore more reflective of general support for a cause than of monetary commitments per se (this argument is consistent with the theories put forth by many psychologists and other critics of CV, see, e.g., Hausman 1993, Green et al. 1994). In this instance, one might expect the CV valuation question to be insensitive to context, while responses to the certainty question may pick up these context effects. Table 8 summarizes the survey results for this question for the 4 CV valuation scenarios at each payment level. Figure 2 shows the important pair wise comparisons among the scenarios, illustrating the separable effects of payment method (voluntary vs. collective) and provision arrangement (government vs. private).
Table 8. Mean Response Certainty by Scenario and Bid
Bid Amount CV Scenario 50¢ /month $3/month $8/month
Scenario 1: Collective Payment, Government Provision
4.39 4.25 3.98
Scenario 2: Voluntary Payment, Government Provision
4.34 4.10 3.84
Scenario 3: Voluntary Payment, Private Provision
3.85 3.74 3.68
Scenario 4: Collective Payment, Private Provision
4.35 4.14 3.97
The first thing to note from these results is that respondents express a high level of certainty in their responses overall. Moreover, as one might expect, certainty levels drop somewhat as the premium increases; this is true for all CV scenarios. This should be of some concern to CV proponents because it implies that respondent’s are less certain of their WTP at high bid levels. This result supports the well-known “yea saying” effect common in dichotomous choice surveys: some respondents may be saying that they are willing to pay at high bid levels, when in fact they would be unwilling to support the requested premium if the question were not hypothetical. Such a response pattern may well have the effect of posit ively skewing aggregate and mean willingness to pay estimates, though it should be noted that the drop in certainty with higher payment levels is not dramatic.
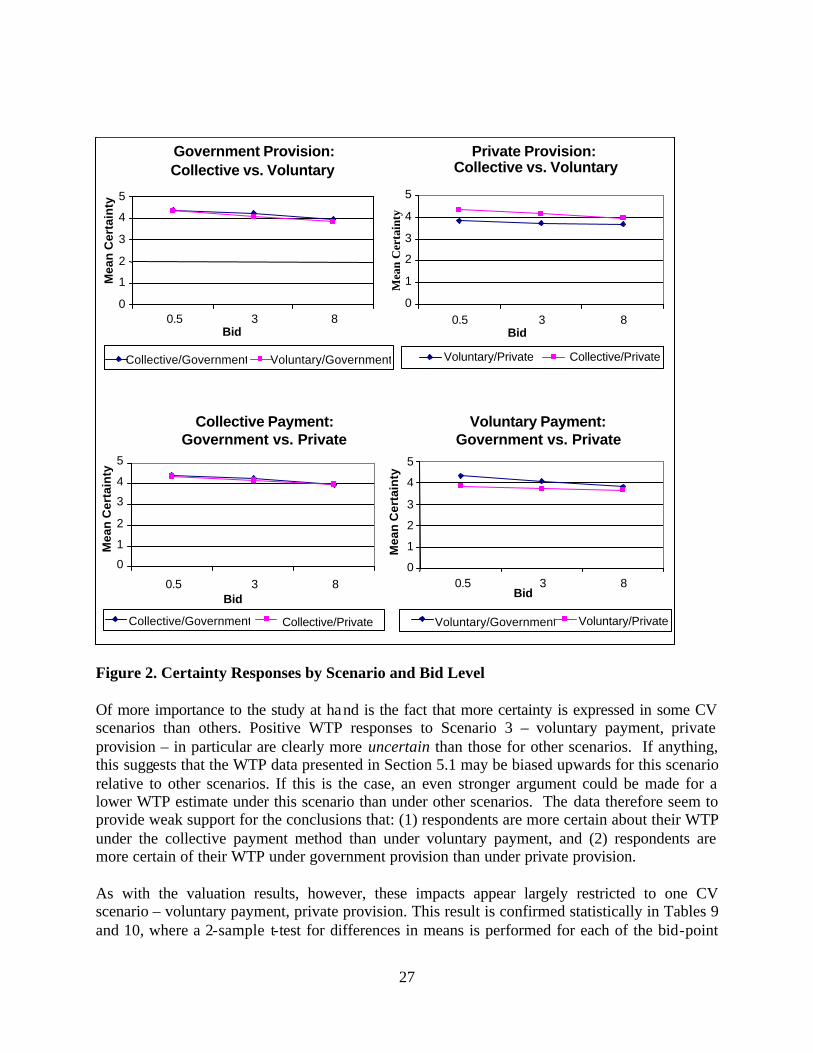
27
Government Provision: Collective vs. Voluntary
0 1 2 3 4 5
0.5 3 8 Bid
Mea
n C
erta
inty
Collective/Government Voluntary/Government
Private Provision: Collective vs. Voluntary
0
1
2
3
4
5
0.5 3 8 Bid
Mea
n C
erta
inty
Voluntary/Private Collective/Private
Collective Payment: Government vs. Private
0 1 2 3 4 5
0.5 3 8 Bid
Mea
n C
erta
inty
Collective/Government Collective/Private
Voluntary Payment: Government vs. Private
0 1 2 3 4 5
0.5 3 8 Bid
Mea
n C
erta
inty
Voluntary/Government Voluntary/Private
Figure 2. Certainty Responses by Scenario and Bid Level Of more importance to the study at hand is the fact that more certainty is expressed in some CV scenarios than others. Positive WTP responses to Scenario 3 – voluntary payment, private provision – in particular are clearly more uncertain than those for other scenarios. If anything, this suggests that the WTP data presented in Section 5.1 may be biased upwards for this scenario relative to other scenarios. If this is the case, an even stronger argument could be made for a lower WTP estimate under this scenario than under other scenarios. The data therefore seem to provide weak support for the conclusions that: (1) respondents are more certain about their WTP under the collective payment method than under voluntary payment, and (2) respondents are more certain of their WTP under government provision than under private provision. As with the valuation results, however, these impacts appear largely restricted to one CV scenario – voluntary payment, private provision. This result is confirmed statistically in Tables 9 and 10, where a 2-sample t-test for differences in means is performed for each of the bid-point
28
pairs in Figure 2 (this analysis follows the same basic structure as that presented in Tables 6 and 7 earlier, and assumes equal variances). As shown below, statistical differences in mean certainty levels are only found when Scenarios 2 (voluntary payment, government provision) and 4 (collective payment, private provision) are compared to Scenario 3 (voluntary payment, private provision); this can be seen in the low “p” values in the rightmost column in Tables 9 and 10, and the high “p” values in the left columns.
Table 9. Difference in Means Tests: Collective vs. Voluntary Certainty Government Provision:
Collective vs. Voluntary Private Provision:
Collective vs. Voluntary 50¢/month t = 0.30
p = 0.77 t = 3.08 p = 0.00
$3/month t = 0.88 p = 0.39
t = 2.47 p = 0.01
$8/month t = 0.78 p = 0.44
t = 1.64 p = 0.10
Table 10. Difference in Means Tests: Government vs. Private Certainty Collective Payment:
Government vs. Private Voluntary Payment:
Government vs. Private 50¢/month t = 0.29
p = 0.77 t = 2.78 p = 0.01
$3/month t = 0.61 p =0.54
t = 2.18 p = 0.03
$8/month t = 0.07 p = 0.94
t = 0.95 p = 0.35
Moreover, the fact that Scenario 3 (unlike all other scenarios) involves customer switching to a new electricity provider confounds interpretation of these results; it may be that the inclusion of customer switching in this scenario fully explains the differential certainty responses. Strong conclusions are therefore not possible. In fact, it should be noted that response sensitivity to payment and provision context appears as significant in the CV valuation question as in the certainty question; this latter finding is somewhat supportive of the CV method and is at odds with the tentative “psychological” theory for CV responses discussed earlier. 5.3 Analysis of “No” Responses As is common in CV surveys, after the valuation question those respondents who indicated they were unwilling to pay for renewable energy at the specified premium were asked to identify why. The detailed wording of the question varies slightly by CV scenario; as an example, Scenario 1 respondents received the following question:
There are many reasons why households may not be willing to support the adoption of this required surcharge. Of the possible reasons listed below, please circle all that apply to you and your household.
29
The possible response categories also differ slightly by CV scenario. Table 11 lists the response categories by scenario and summarizes the responses received.
Table 11. Reasons for Not Being Willing to Pay the Specified Premium
Possible Reasons for a “No” Response Coll./Gov’t
Vol./Gov’t
Vol./Pvt.
Coll./Pvt.
My household can’t afford to pay this much for renewable energy 31.8% 28.0% 27.0% 37.4% The benefits of renewable energy aren’t great enough to warrant the surcharge
46.8% 42.0% 12.9% 41.5%
Renewable energy should be supported, but I think households should be able to voluntarily pay for renewable energy and that it shouldn’t be required [SCENARIOS 1 AND 4]
39.9% na na 44.9%
Renewable energy should be supported, but I think all households should be required to pay and that it shouldn’t be voluntary [SCENARIOS 2 AND 3]
na 32.6% 31.5% na
Renewable energy should be supported, but I wouldn’t trust the government to effectively spend the funds collected by the surcharge [SCENARIOS 1 AND 2]
35.8% 39.4% na na
Renewable energy should be supported, but I wouldn’t trust the private company to effectively spend the funds collected by the surcharge [SCENARIO 3]
na na 40.5% na
Renewable energy should be supported, but I wouldn’t trust electricity suppliers and/or private companies to effectively spend the funds collected by the surcharge [SCENARIO 4]
na na na 27.2%
I am opposed to all new government programs 21.4% 21.2% 32.0% 24.5% I object to these types of questions 13.3% 14.0% 7.3% 19.1%
I would need more information before making a decision 26.0% 23.9% 61.2% 29.3% I wouldn’t want to switch electricity providers for other reasons [SCENARIO 3]
na na 24.3% na
Other 16.8% 10.9% 8.4% 19.1%
Some of the most common reasons for a “no” response are very reasonable, for example, that the benefits are not great enough to warrant the surcharge and that the household cannot afford to pay the premium. Also significant is that, in the two voluntary payment scenarios, 32.6% and 31.5% of respondents say that all households should be required to pay. Similarly, in the two collective payment scenarios, 39.9% and 44.9% of respondents indicated that payments should be voluntary. A certain amount of distrust in the provision approach – whether government or private – was also identified as a reason for saying “no” to the valuation question. For those receiving a CV scenario with government provision, 35.8% and 39.4% indicated that they would not trust the government to effectively spend the funds. At the same time, for those receiving the private provision scenarios, 40.5% and 27.2% said that they would not trust the private company. Notice, however, that distrust in the private company is greater under the voluntary payment approach than the collective payment approach. Other common responses include a need for more information before making a decision, an opposition to all new governmental programs,
30
and concern over switching electricity providers in Scenario 3 – voluntary payment, private provision. Less common responses include outright objection to CV questions or “other” write-in comments. Only one aspect of the response to this question is particularly puzzling. Under Scenario 3 – voluntary payment, private provision – a disproportionately large number of respondents indicate that they would need more information before making a decision, while a disproportionately small number indicate that the benefits of renewable energy are not worth the premium. Why responses to Scenario 3 vary so much compared to the other scenarios is unknown. One possible explanation is that Scenario 3 was the only one to involve switching electricity suppliers. This may explain the heightened need for more information, but it does little to explain the relative lack of concern in Scenario 3 about the benefits of renewable energy not being worth the premium. 5.4 Participation Expectations: Will Others be Willing to Pay? The survey also explored the expectations of the survey respondents about the willingness to pay of other U.S. residents. That is, do respondents who state a WTP for renewable energy themselves predict that more people will join them in being willing to pay than do those respondents who say they are unwilling to pay the premium? And is this relationship stronger among some payment and provision contexts than others? Such an effect has been found in numerous other academic disciplines. Some of the relevant literature, which spans the sociology, marketing, economics, and collective action fields, is reviewed in Section 8. Related concepts described in this literature include interpersonal influence, reciprocity, trust in others, and bandwagon effects. One underlying conclusion from much of this work is that human decision-making is often far more complex and socially determined than economic analysis assumes. Of perhaps the most direct relevance to the approach taken in this report are the conclusions of Dawes, McTavish and Shaklee (1977) and Orbell and Dawes (1991). These authors find that, in experimental settings, contributors to public goods expect significantly more cooperation than do defectors. That is, contributors to public goods expect a greater number of other individuals to also contribute than do those who are unwilling to contribute themselves. A related study by Pieters et al. (1998) shows that the expected pro-environmental behavior of other households is directly correlated with individuals’ own environmental behaviors. In the present study, we test for these effects in a hypothetical contingent valuation setting. While discussion of “participation expectations” and “interpersonal influence” is common in other disciplines, these effects have not been thoroughly tested in CV research, where a narrow focus on economic motivations that assume rational maximizing behavior and independent choices often pervades research agendas. Specifically, each CV survey asked what percent of U.S. residents the respondent believes would support and be willing to pay the specified premium for renewable energy. Though the exact question wording varies somewhat by CV scenario, for Scenario 1 the question reads:
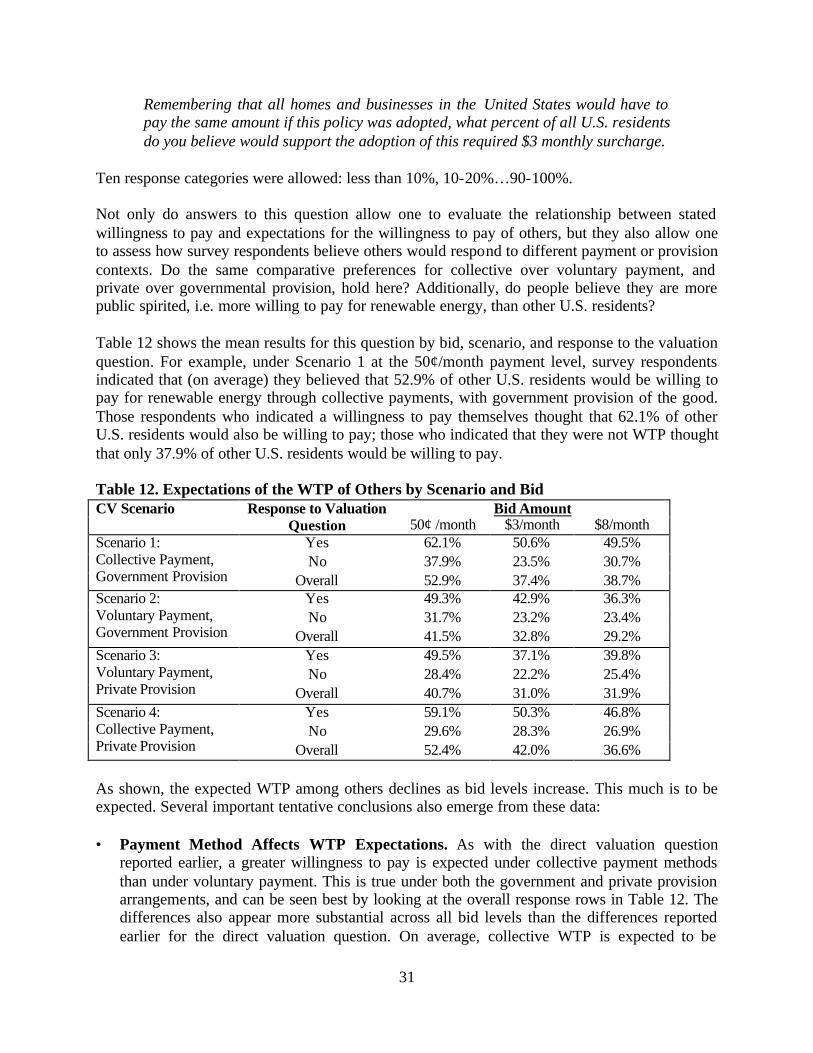
31
Remembering that all homes and businesses in the United States would have to pay the same amount if this policy was adopted, what percent of all U.S. residents do you believe would support the adoption of this required $3 monthly surcharge.
Ten response categories were allowed: less than 10%, 10-20%…90-100%. Not only do answers to this question allow one to evaluate the relationship between stated willingness to pay and expectations for the willingness to pay of others, but they also allow one to assess how survey respondents believe others would respond to different payment or provision contexts. Do the same comparative preferences for collective over voluntary payment, and private over governmental provision, hold here? Additionally, do people believe they are more public spirited, i.e. more willing to pay for renewable energy, than other U.S. residents? Table 12 shows the mean results for this question by bid, scenario, and response to the valuation question. For example, under Scenario 1 at the 50¢/month payment level, survey respondents indicated that (on average) they believed that 52.9% of other U.S. residents would be willing to pay for renewable energy through collective payments, with government provision of the good. Those respondents who indicated a willingness to pay themselves thought that 62.1% of other U.S. residents would also be willing to pay; those who indicated that they were not WTP thought that only 37.9% of other U.S. residents would be willing to pay. Table 12. Expectations of the WTP of Others by Scenario and Bid
Bid Amount CV Scenario Response to Valuation Question 50¢ /month $3/month $8/month
Yes 62.1% 50.6% 49.5% No 37.9% 23.5% 30.7%
Scenario 1: Collective Payment, Government Provision Overall 52.9% 37.4% 38.7%
Yes 49.3% 42.9% 36.3% No 31.7% 23.2% 23.4%
Scenario 2: Voluntary Payment, Government Provision Overall 41.5% 32.8% 29.2%
Yes 49.5% 37.1% 39.8% No 28.4% 22.2% 25.4%
Scenario 3: Voluntary Payment, Private Provision Overall 40.7% 31.0% 31.9%
Yes 59.1% 50.3% 46.8% No 29.6% 28.3% 26.9%
Scenario 4: Collective Payment, Private Provision Overall 52.4% 42.0% 36.6%
As shown, the expected WTP among others declines as bid levels increase. This much is to be expected. Several important tentative conclusions also emerge from these data:
• Payment Method Affects WTP Expectations. As with the direct valuation question
reported earlier, a greater willingness to pay is expected under collective payment methods than under voluntary payment. This is true under both the government and private provision arrangements, and can be seen best by looking at the overall response rows in Table 12. The differences also appear more substantial across all bid levels than the differences reported earlier for the direct valuation question. On average, collective WTP is expected to be
32
approximately 25% higher than voluntary WTP. On the other hand, unlike the CV valuation question, no significant differences can be seen in response based on the provision arrangement. Overall, these results show that the WTP expectations of others are sensitive to payment method, with a higher WTP expected under collective than under voluntary payment, but that a similar sensitivity is not detected for provision arrangement effects. Survey respondents seemingly understand the nature of the free-riding effect: respondents expect more U.S. residents to support a collective payment approach for renewable energy than a voluntary one.
• Individuals Who are Willing to Pay Often Expect Others to Reciprocate. The WTP expectations for others is far lower among those who are not willing to pay for renewable energy themselves than it is for those who are willing to pay. The differences are striking. Those who indicate a willingness to pay for renewable energy often expect twice as many people to do likewise than do those who indicate they are not willing to pay. For example, under collective payment and private provision at the 50¢/month payment level, those who state a WTP also indicate that they believe 59.1% of other U.S. residents would be willing to pay; this percentage drops to 29.6% for those who state that they themselves would not be willing to pay. Moreover, this basic result is true in all four payment and provision scenarios. Apparently, regardless of the payment and provision method, those who indicate a willingness to pay for renewable energy also believe that many others will reciprocate and be willing to pay. This finding is consistent with the conclusions reported earlier by Dawes, McTavish and Shaklee (1977), Orbell and Dawes (1991), and Pieters et al. (1998). It is also important to note what this finding does not directly tell us. Specifically, a number of academic disciplines (briefly reviewed in Section 8) have reported on a “bandwagon” or “reciprocity” effect: that is, the participation of others in an activity directly increases the probability that still more individuals will participate. Contributions are matched with more contributions, while defection is matched with defection. In this way, initial contributions can trigger a chain reaction of additional contributions when a “critical mass” of participants is achieved. Among several possible reasons for this effect is that individuals will only contribute towards public goods themselves if they believe that others are doing their fair share. The results presented here are suggestive of such an effect, and are consistent with much of the extant literature in this area, but tell us little about causality. Specifically, results presented so far show a positive correlation between “participation expectations” and stated WTP, but cannot directly tell us whether (1) it is because others are expected to contribute that survey respondents also indicate a WTP (the “bandwagon” or “reciprocity” effect), or (2) whether respondents who say they are WTP simply “defend” their choice by saying that they believe that others would make a similar one. Results also tell us little about the cause of the effect. These issues are addressed in more detail in Section 8, a section that also highlights the need for additional research to more fully understand the findings reported here.
• Respondents Perceive Themselves to be More Willing to Pay than Others. How do these responses compare to actual stated WTP as expressed in the earlier valuation question? Using overall responses from Table 12, it is clear that respondents’ perceptions of the WTP of
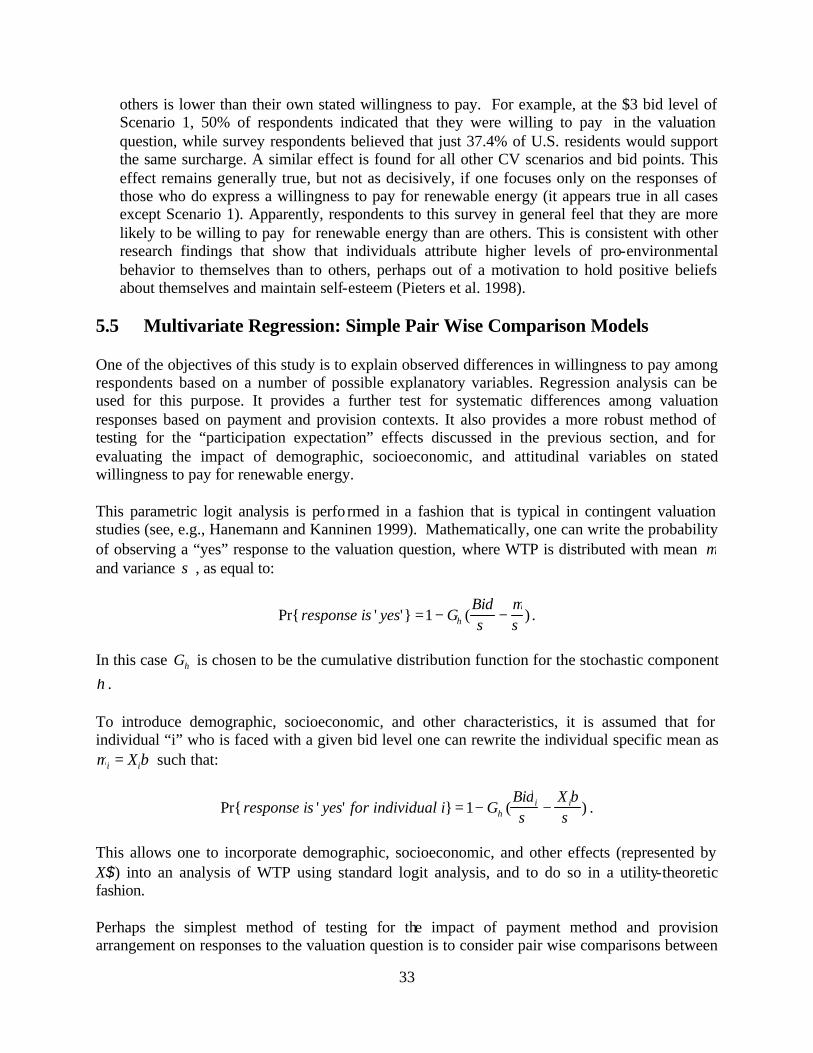
33
others is lower than their own stated willingness to pay. For example, at the $3 bid level of Scenario 1, 50% of respondents indicated that they were willing to pay in the valuation question, while survey respondents believed that just 37.4% of U.S. residents would support the same surcharge. A similar effect is found for all other CV scenarios and bid points. This effect remains generally true, but not as decisively, if one focuses only on the responses of those who do express a willingness to pay for renewable energy (it appears true in all cases except Scenario 1). Apparently, respondents to this survey in general feel that they are more likely to be willing to pay for renewable energy than are others. This is consistent with other research findings that show that individuals attribute higher levels of pro-environmental behavior to themselves than to others, perhaps out of a motivation to hold positive beliefs about themselves and maintain self-esteem (Pieters et al. 1998).
5.5 Multivariate Regression: Simple Pair Wise Comparison Models One of the objectives of this study is to explain observed differences in willingness to pay among respondents based on a number of possible explanatory variables. Regression analysis can be used for this purpose. It provides a further test for systematic differences among valuation responses based on payment and provision contexts. It also provides a more robust method of testing for the “participation expectation” effects discussed in the previous section, and for evaluating the impact of demographic, socioeconomic, and attitudinal variables on stated willingness to pay for renewable energy. This parametric logit analysis is perfo rmed in a fashion that is typical in contingent valuation studies (see, e.g., Hanemann and Kanninen 1999). Mathematically, one can write the probability of observing a “yes” response to the valuation question, where WTP is distributed with mean µ and variance σ , as equal to:
Pr{response is ' yes'} =1 − Gη (Bidσ
−µσ
) .
In this case Gη is chosen to be the cumulative distribution function for the stochastic component η. To introduce demographic, socioeconomic, and other characteristics, it is assumed that for individual “i” who is faced with a given bid level one can rewrite the individual specific mean as µi = Xiβ such that:
Pr{response is ' yes' for individual i} = 1− Gη (Bidi
σ−
X iβσ
) .
This allows one to incorporate demographic, socioeconomic, and other effects (represented by X$) into an analysis of WTP using standard logit analysis, and to do so in a utility-theoretic fashion. Perhaps the simplest method of testing for the impact of payment method and provision arrangement on responses to the valuation question is to consider pair wise comparisons between
34
the different valuation scenarios, much as was done earlier with summary statistics. Using this approach, the dependent variable in the logit equation is whether or not the respondent said “yes” to the valuation question (1=yes; 0=no). Including a dummy “treatment” variable (which indicates whether payment was voluntary or collective, or whether provision was through the government or the private sector) as an independent explanatory variable allows one to test whether the treatment has a significant positive or negative effect on the probability of being willing to pay for renewable energy. Other socioeconomic and demographic variables are also included as independent explanatory variables. Here we keep the model simple, and do not include attitudinal or “participation expectation” variables; that is done in the subsequent section. Table 13 shows the independent variables used in the simple logit analysis that follows and the more comprehensive model presented later.
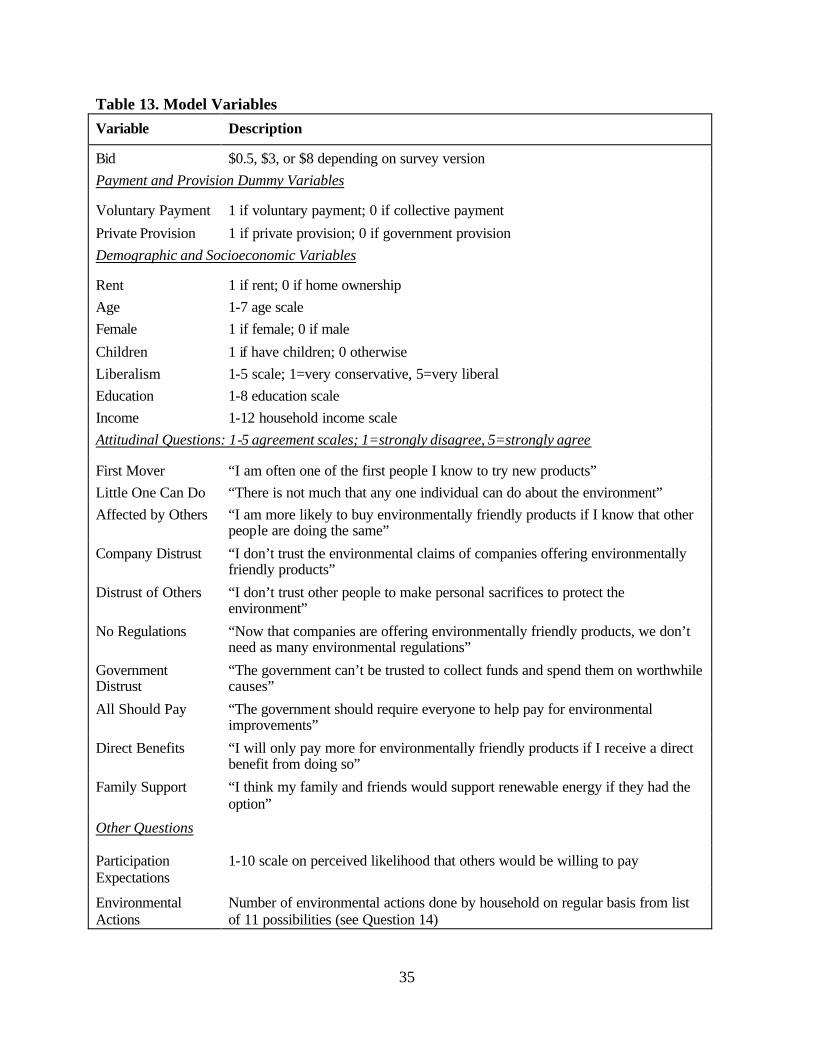
35
Table 13. Model Variables Variable Description
Bid $0.5, $3, or $8 depending on survey version Payment and Provision Dummy Variables
Voluntary Payment 1 if voluntary payment; 0 if collective payment
Private Provision 1 if private provision; 0 if government provision Demographic and Socioeconomic Variables
Rent 1 if rent; 0 if home ownership Age 1-7 age scale Female 1 if female; 0 if male
Children 1 if have children; 0 otherwise Liberalism 1-5 scale; 1=very conservative, 5=very liberal Education 1-8 education scale Income 1-12 household income scale Attitudinal Questions: 1-5 agreement scales; 1=strongly disagree, 5=strongly agree
First Mover “I am often one of the first people I know to try new products” Little One Can Do “There is not much that any one individual can do about the environment” Affected by Others “I am more likely to buy environmentally friendly products if I know that other
people are doing the same”
Company Distrust “I don’t trust the environmental claims of companies offering environmentally friendly products”
Distrust of Others “I don’t trust other people to make personal sacrifices to protect the environment”
No Regulations “Now that companies are offering environmentally friendly products, we don’t need as many environmental regulations”
Government Distrust
“The government can’t be trusted to collect funds and spend them on worthwhile causes”
All Should Pay “The government should require everyone to help pay for environmental improvements”
Direct Benefits “I will only pay more for environmentally friendly products if I receive a direct benefit from doing so”
Family Support “I think my family and friends would support renewable energy if they had the option”
Other Questions
Participation Expectations
1-10 scale on perceived likelihood that others would be willing to pay
Environmental Actions
Number of environmental actions done by household on regular basis from list of 11 possibilities (see Question 14)
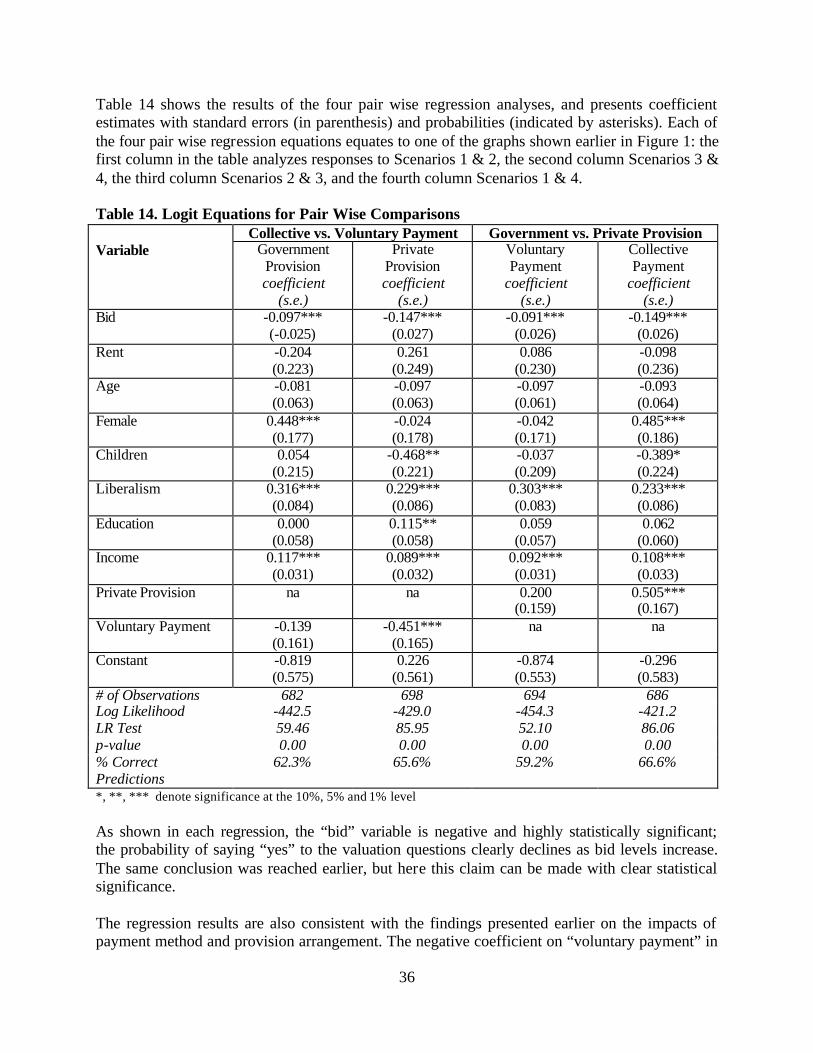
36
Table 14 shows the results of the four pair wise regression analyses, and presents coefficient estimates with standard errors (in parenthesis) and probabilities (indicated by asterisks). Each of the four pair wise regression equations equates to one of the graphs shown earlier in Figure 1: the first column in the table analyzes responses to Scenarios 1 & 2, the second column Scenarios 3 & 4, the third column Scenarios 2 & 3, and the fourth column Scenarios 1 & 4.
Table 14. Logit Equations for Pair Wise Comparisons
Collective vs. Voluntary Payment Government vs. Private Provision Variable Government
Provision coefficient
(s.e.)
Private Provision coefficient
(s.e.)
Voluntary Payment
coefficient (s.e.)
Collective Payment
coefficient (s.e.)
Bid -0.097*** (-0.025)
-0.147*** (0.027)
-0.091*** (0.026)
-0.149*** (0.026)
Rent -0.204 (0.223)
0.261 (0.249)
0.086 (0.230)
-0.098 (0.236)
Age -0.081 (0.063)
-0.097 (0.063)
-0.097 (0.061)
-0.093 (0.064)
Female 0.448*** (0.177)
-0.024 (0.178)
-0.042 (0.171)
0.485*** (0.186)
Children 0.054 (0.215)
-0.468** (0.221)
-0.037 (0.209)
-0.389* (0.224)
Liberalism 0.316*** (0.084)
0.229*** (0.086)
0.303*** (0.083)
0.233*** (0.086)
Education 0.000 (0.058)
0.115** (0.058)
0.059 (0.057)
0.062 (0.060)
Income 0.117*** (0.031)
0.089*** (0.032)
0.092*** (0.031)
0.108*** (0.033)
Private Provision
na na 0.200 (0.159)
0.505*** (0.167)
Voluntary Payment
-0.139 (0.161)
-0.451*** (0.165)
na na
Constant -0.819 (0.575)
0.226 (0.561)
-0.874 (0.553)
-0.296 (0.583)
# of Observations 682 698 694 686 Log Likelihood -442.5 -429.0 -454.3 -421.2 LR Test 59.46 85.95 52.10 86.06 p-value 0.00 0.00 0.00 0.00 % Correct Predictions
62.3% 65.6% 59.2% 66.6%
*, **, *** denote significance at the 10%, 5% and 1% level As shown in each regression, the “bid” variable is negative and highly statistically significant; the probability of saying “yes” to the valuation questions clearly declines as bid levels increase. The same conclusion was reached earlier, but here this claim can be made with clear statistical significance. The regression results are also consistent with the findings presented earlier on the impacts of payment method and provision arrangement. The negative coefficient on “voluntary payment” in
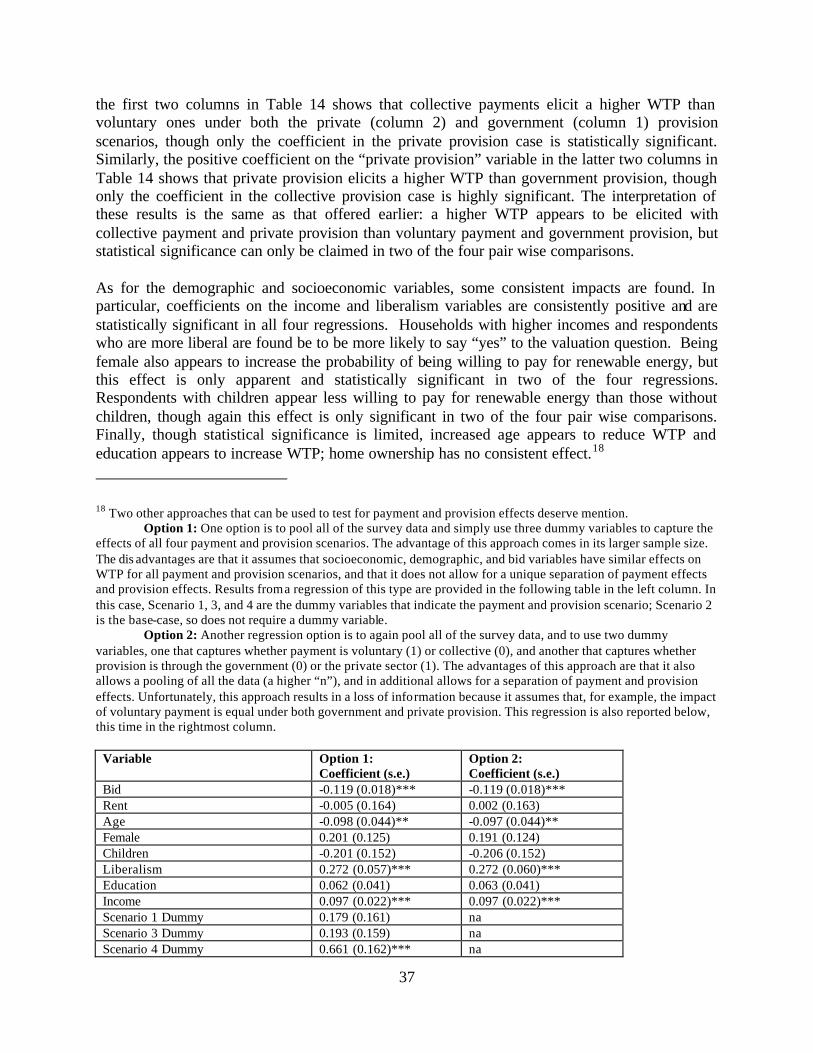
37
the first two columns in Table 14 shows that collective payments elicit a higher WTP than voluntary ones under both the private (column 2) and government (column 1) provision scenarios, though only the coefficient in the private provision case is statistically significant. Similarly, the positive coefficient on the “private provision” variable in the latter two columns in Table 14 shows that private provision elicits a higher WTP than government provision, though only the coefficient in the collective provision case is highly significant. The interpretation of these results is the same as that offered earlier: a higher WTP appears to be elicited with collective payment and private provision than voluntary payment and government provision, but statistical significance can only be claimed in two of the four pair wise comparisons. As for the demographic and socioeconomic variables, some consistent impacts are found. In particular, coefficients on the income and liberalism variables are consistently positive and are statistically significant in all four regressions. Households with higher incomes and respondents who are more liberal are found be to be more likely to say “yes” to the valuation question. Being female also appears to increase the probability of being willing to pay for renewable energy, but this effect is only apparent and statistically significant in two of the four regressions. Respondents with children appear less willing to pay for renewable energy than those without children, though again this effect is only significant in two of the four pair wise comparisons. Finally, though statistical significance is limited, increased age appears to reduce WTP and education appears to increase WTP; home ownership has no consistent effect.18
18 Two other approaches that can be used to test for payment and provision effects deserve mention. Option 1: One option is to pool all of the survey data and simply use three dummy variables to capture the
effects of all four payment and provision scenarios. The advantage of this approach comes in its larger sample size. The dis advantages are that it assumes that socioeconomic, demographic, and bid variables have similar effects on WTP for all payment and provision scenarios, and that it does not allow for a unique separation of payment effects and provision effects. Results from a regression of this type are provided in the following table in the left column. In this case, Scenario 1, 3, and 4 are the dummy variables that indicate the payment and provision scenario; Scenario 2 is the base-case, so does not require a dummy variable.
Option 2: Another regression option is to again pool all of the survey data, and to use two dummy variables, one that captures whether payment is voluntary (1) or collective (0), and another that captures whether provision is through the government (0) or the private sector (1). The advantages of this approach are that it also allows a pooling of all the data (a higher “n”), and in additional allows for a separation of payment and provision effects. Unfortunately, this approach results in a loss of information because it assumes that, for example, the impact of voluntary payment is equal under both government and private provision. This regression is also reported below, this time in the rightmost column.
Variable Option 1: Coefficient (s.e.)
Option 2: Coefficient (s.e.)
Bid -0.119 (0.018)*** -0.119 (0.018)*** Rent -0.005 (0.164) 0.002 (0.163) Age -0.098 (0.044)** -0.097 (0.044)** Female 0.201 (0.125) 0.191 (0.124) Children -0.201 (0.152) -0.206 (0.152) Liberalism 0.272 (0.057)*** 0.272 (0.060)*** Education 0.062 (0.041) 0.063 (0.041) Income 0.097 (0.022)*** 0.097 (0.022)*** Scenario 1 Dummy 0.179 (0.161) na Scenario 3 Dummy 0.193 (0.159) na Scenario 4 Dummy 0.661 (0.162)*** na
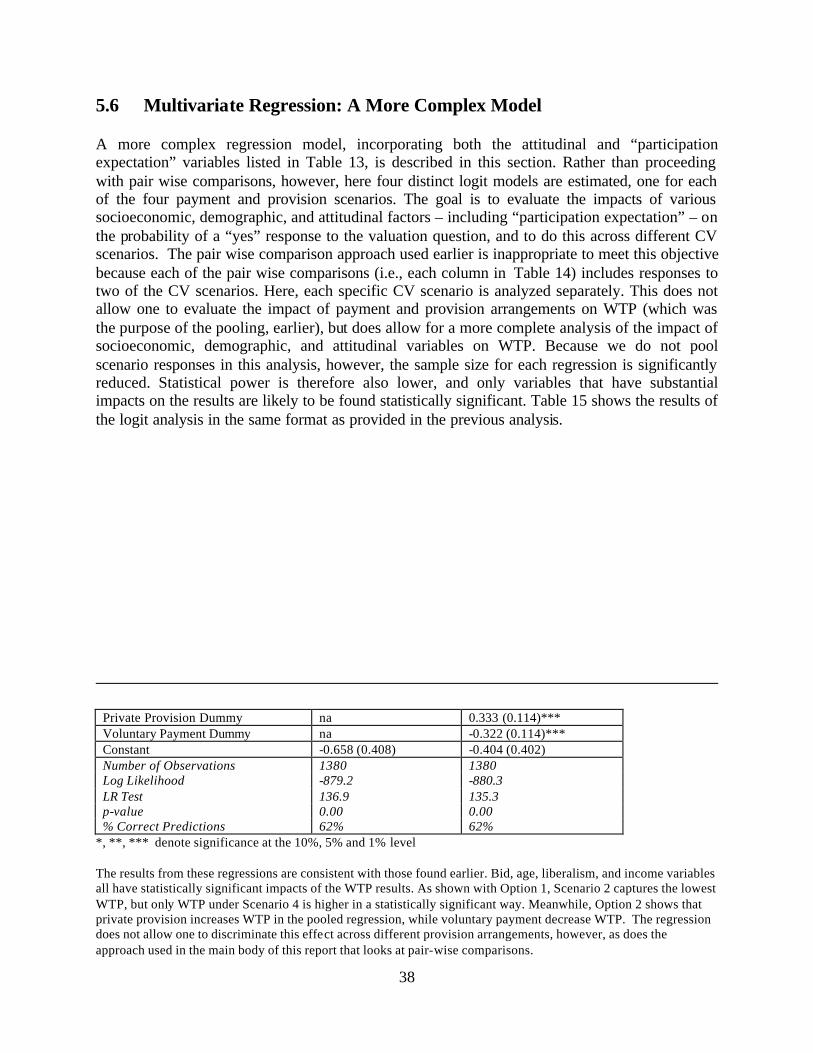
38
5.6 Multivariate Regression: A More Complex Model A more complex regression model, incorporating both the attitudinal and “participation expectation” variables listed in Table 13, is described in this section. Rather than proceeding with pair wise comparisons, however, here four distinct logit models are estimated, one for each of the four payment and provision scenarios. The goal is to evaluate the impacts of various socioeconomic, demographic, and attitudinal factors – including “participation expectation” – on the probability of a “yes” response to the valuation question, and to do this across different CV scenarios. The pair wise comparison approach used earlier is inappropriate to meet this objective because each of the pair wise comparisons (i.e., each column in Table 14) includes responses to two of the CV scenarios. Here, each specific CV scenario is analyzed separately. This does not allow one to evaluate the impact of payment and provision arrangements on WTP (which was the purpose of the pooling, earlier), but does allow for a more complete analysis of the impact of socioeconomic, demographic, and attitudinal variables on WTP. Because we do not pool scenario responses in this analysis, however, the sample size for each regression is significantly reduced. Statistical power is therefore also lower, and only variables that have substantial impacts on the results are likely to be found statistically significant. Table 15 shows the results of the logit analysis in the same format as provided in the previous analysis.
Private Provision Dummy na 0.333 (0.114)*** Voluntary Payment Dummy na -0.322 (0.114)*** Constant -0.658 (0.408) -0.404 (0.402) Number of Observations 1380 1380 Log Likelihood -879.2 -880.3 LR Test 136.9 135.3 p-value 0.00 0.00 % Correct Predictions 62% 62%
*, **, *** denote significance at the 10%, 5% and 1% level The results from these regressions are consistent with those found earlier. Bid, age, liberalism, and income variables all have statistically significant impacts of the WTP results. As shown with Option 1, Scenario 2 captures the lowest WTP, but only WTP under Scenario 4 is higher in a statistically significant way. Meanwhile, Option 2 shows that private provision increases WTP in the pooled regression, while voluntary payment decrease WTP. The regression does not allow one to discriminate this effect across different provision arrangements, however, as does the approach used in the main body of this report that looks at pair-wise comparisons.
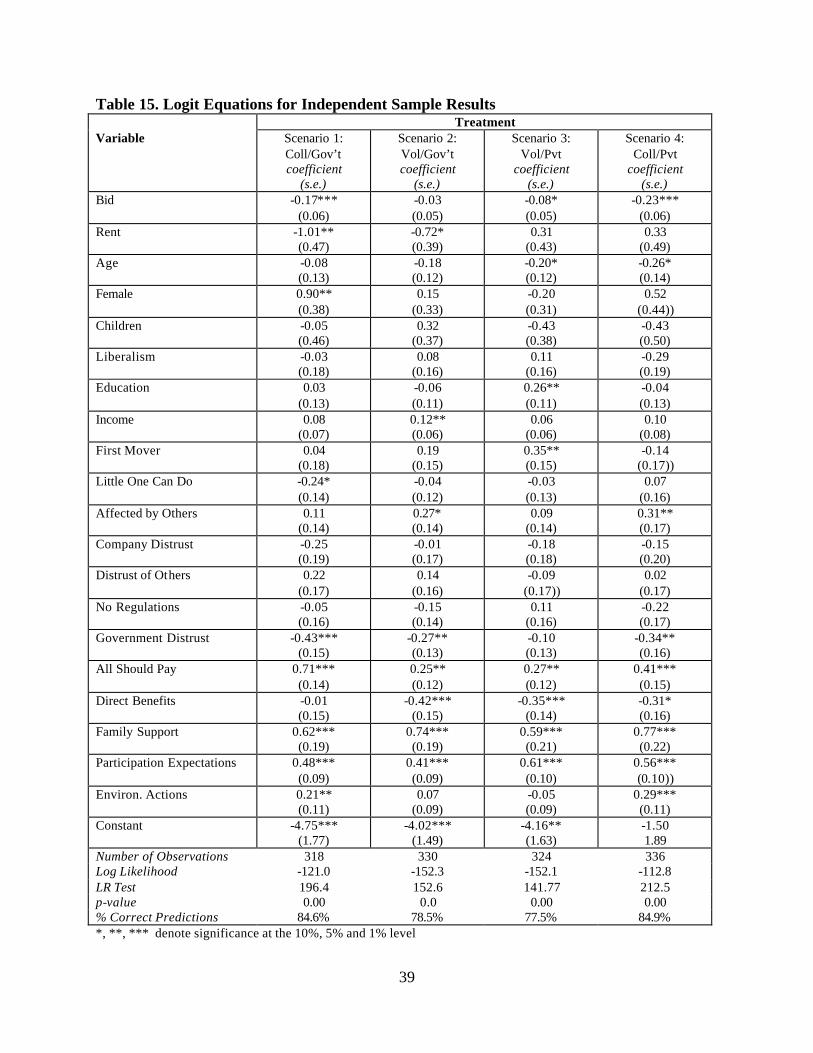
39
Table 15. Logit Equations for Independent Sample Results Treatment
Variable Scenario 1: Coll/Gov’t coefficient
(s.e.)
Scenario 2: Vol/Gov’t coefficient
(s.e.)
Scenario 3: Vol/Pvt
coefficient (s.e.)
Scenario 4: Coll/Pvt
coefficient (s.e.)
Bid -0.17*** (0.06)
-0.03 (0.05)
-0.08* (0.05)
-0.23*** (0.06)
Rent -1.01** (0.47)
-0.72* (0.39)
0.31 (0.43)
0.33 (0.49)
Age -0.08 (0.13)
-0.18 (0.12)
-0.20* (0.12)
-0.26* (0.14)
Female 0.90** (0.38)
0.15 (0.33)
-0.20 (0.31)
0.52 (0.44))
Children -0.05 (0.46)
0.32 (0.37)
-0.43 (0.38)
-0.43 (0.50)
Liberalism -0.03 (0.18)
0.08 (0.16)
0.11 (0.16)
-0.29 (0.19)
Education 0.03 (0.13)
-0.06 (0.11)
0.26** (0.11)
-0.04 (0.13)
Income 0.08 (0.07)
0.12** (0.06)
0.06 (0.06)
0.10 (0.08)
First Mover 0.04 (0.18)
0.19 (0.15)
0.35** (0.15)
-0.14 (0.17))
Little One Can Do -0.24* (0.14)
-0.04 (0.12)
-0.03 (0.13)
0.07 (0.16)
Affected by Others 0.11 (0.14)
0.27* (0.14)
0.09 (0.14)
0.31** (0.17)
Company Distrust -0.25 (0.19)
-0.01 (0.17)
-0.18 (0.18)
-0.15 (0.20)
Distrust of Others 0.22 (0.17)
0.14 (0.16)
-0.09 (0.17))
0.02 (0.17)
No Regulations -0.05 (0.16)
-0.15 (0.14)
0.11 (0.16)
-0.22 (0.17)
Government Distrust -0.43*** (0.15)
-0.27** (0.13)
-0.10 (0.13)
-0.34** (0.16)
All Should Pay 0.71*** (0.14)
0.25** (0.12)
0.27** (0.12)
0.41*** (0.15)
Direct Benefits -0.01 (0.15)
-0.42*** (0.15)
-0.35*** (0.14)
-0.31* (0.16)
Family Support 0.62*** (0.19)
0.74*** (0.19)
0.59*** (0.21)
0.77*** (0.22)
Participation Expectations 0.48*** (0.09)
0.41*** (0.09)
0.61*** (0.10)
0.56*** (0.10))
Environ. Actions 0.21** (0.11)
0.07 (0.09)
-0.05 (0.09)
0.29*** (0.11)
Constant -4.75*** (1.77)
-4.02*** (1.49)
-4.16** (1.63)
-1.50 1.89
Number of Observations 318 330 324 336 Log Likelihood -121.0 -152.3 -152.1 -112.8 LR Test 196.4 152.6 141.77 212.5 p-value 0.00 0.0 0.00 0.00 % Correct Predictions 84.6% 78.5% 77.5% 84.9% *, **, *** denote significance at the 10%, 5% and 1% level
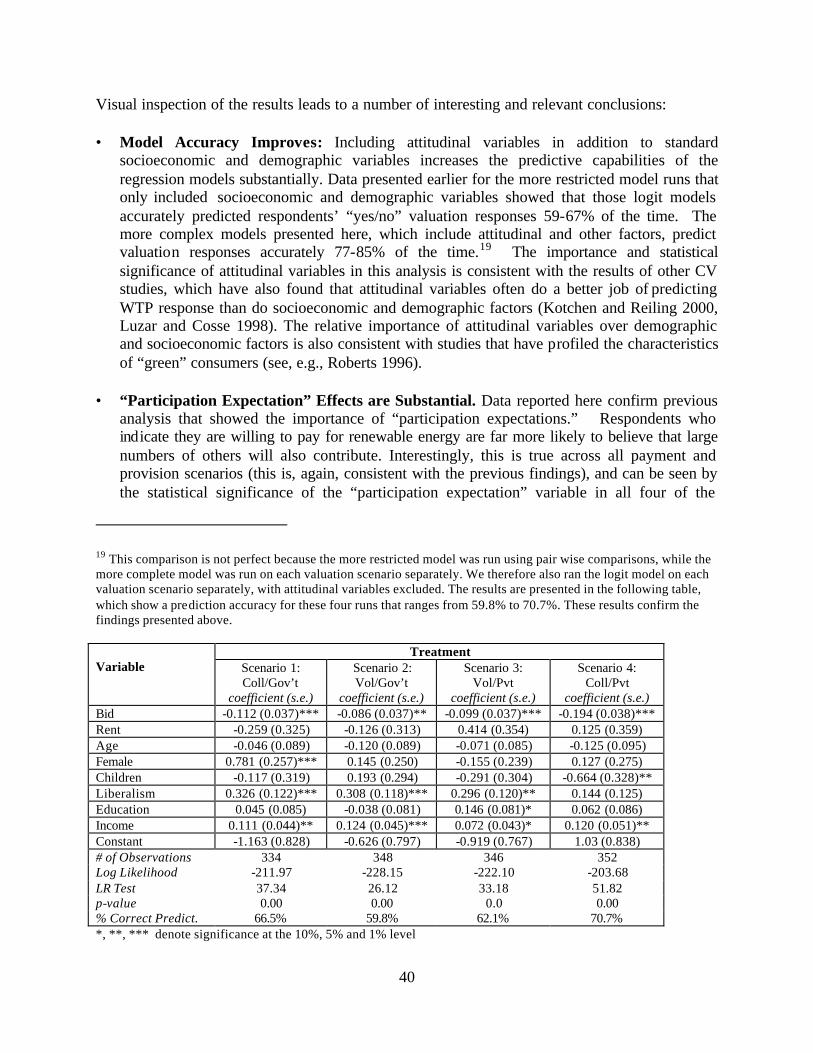
40
Visual inspection of the results leads to a number of interesting and relevant conclusions: • Model Accuracy Improves: Including attitudinal variables in addition to standard
socioeconomic and demographic variables increases the predictive capabilities of the regression models substantially. Data presented earlier for the more restricted model runs that only included socioeconomic and demographic variables showed that those logit models accurately predicted respondents’ “yes/no” valuation responses 59-67% of the time. The more complex models presented here, which include attitudinal and other factors, predict valuation responses accurately 77-85% of the time.19 The importance and statistical significance of attitudinal variables in this analysis is consistent with the results of other CV studies, which have also found that attitudinal variables often do a better job of predicting WTP response than do socioeconomic and demographic factors (Kotchen and Reiling 2000, Luzar and Cosse 1998). The relative importance of attitudinal variables over demographic and socioeconomic factors is also consistent with studies that have profiled the characteristics of “green” consumers (see, e.g., Roberts 1996).
• “Participation Expectation” Effects are Substantial. Data reported here confirm previous analysis that showed the importance of “participation expectations.” Respondents who indicate they are willing to pay for renewable energy are far more likely to believe that large numbers of others will also contribute. Interestingly, this is true across all payment and provision scenarios (this is, again, consistent with the previous findings), and can be seen by the statistical significance of the “participation expectation” variable in all four of the
19 This comparison is not perfect because the more restricted model was run using pair wise comparisons, while the more complete model was run on each valuation scenario separately. We therefore also ran the logit model on each valuation scenario separately, with attitudinal variables excluded. The results are presented in the following table, which show a prediction accuracy for these four runs that ranges from 59.8% to 70.7%. These results confirm the findings presented above.
Treatment Variable Scenario 1:
Coll/Gov’t coefficient (s.e.)
Scenario 2: Vol/Gov’t
coefficient (s.e.)
Scenario 3: Vol/Pvt
coefficient (s.e.)
Scenario 4: Coll/Pvt
coefficient (s.e.) Bid -0.112 (0.037)*** -0.086 (0.037)** -0.099 (0.037)*** -0.194 (0.038)*** Rent -0.259 (0.325) -0.126 (0.313) 0.414 (0.354) 0.125 (0.359) Age -0.046 (0.089) -0.120 (0.089) -0.071 (0.085) -0.125 (0.095) Female 0.781 (0.257)*** 0.145 (0.250) -0.155 (0.239) 0.127 (0.275) Children -0.117 (0.319) 0.193 (0.294) -0.291 (0.304) -0.664 (0.328)** Liberalism 0.326 (0.122)*** 0.308 (0.118)*** 0.296 (0.120)** 0.144 (0.125) Education 0.045 (0.085) -0.038 (0.081) 0.146 (0.081)* 0.062 (0.086) Income 0.111 (0.044)** 0.124 (0.045)*** 0.072 (0.043)* 0.120 (0.051)** Constant -1.163 (0.828) -0.626 (0.797) -0.919 (0.767) 1.03 (0.838) # of Observations 334 348 346 352 Log Likelihood -211.97 -228.15 -222.10 -203.68 LR Test 37.34 26.12 33.18 51.82 p-value 0.00 0.00 0.0 0.00 % Correct Predict. 66.5% 59.8% 62.1% 70.7% *, **, *** denote significance at the 10%, 5% and 1% level
41
regressions presented in Table 15. The phenomenon is, again, substantial. As with the previous results, however, statistical techniques can test only for associations between variables, not for causation. Accordingly, the findings reported so far do not directly tell us whether (1) it is because others are expected to contribute that survey respondents also indicate a WTP (the “bandwagon” or “reciprocity” effect), or (2) whether respondents who say they are WTP simply defend their choice by saying that they believe that others would make a similar one. The results are therefore suggestive of the bandwagon/reciprocity effect, but are certainly not definitive.
• Socioeconomic and Demographic Variables have a Modest Effect. Once attitudinal variables are included in the model, the statistical significance of the socioeconomic and demographic variables decreases. Income remains positively related to a “yes” response to the valuation question, but statistical significance is only achieved in one of four model runs. Liberalism has no consistent or significant effect on the results, unlike in the previous models, presumably because other attitudinal factors are now capturing that impact. Home rental reduces WTP in two cases in a statistically significant fashion, but fails to do so in the other two scenarios. Age again appears to reduce the probability of a “yes” response to the valuation question, while being female increases that probability in three of four cases. The bid variable has a negative coefficient, as one would expect, an effect that is statistically significant in three of four cases.
• Several Attitudinal Variables Have Significant Effects. We find that some attitudinal variables have statistically significant effects on the probability of a “yes” response to the valuation question, while others do not. As noted by the NOAA panel report on the reliability and accuracy of CV (Arrow et al. 1993), including such attitudinal variables in a contingent valuation context can help test the construct validity of the CV method – that is, the degree to which stated WTP varies with other attitudinal measures in ways that are consistent with theory or common sense. The results of our regression runs do show a number of effects that appear consistent with construct validity. These results also shed additional light on why and when individuals might be willing to support renewable energy. For example:
o Those who believe that their family and friends would also support renewable energy
(“family support”) are more likely to be willing to pay themselves. This finding is highly significant across all four CV scenarios. This result is supportive of the “participation expectations” finding discussed earlier, and suggests that the influence of near peers (family and friends) is separate from the more general “participation expectations” result. Similarly, those who more strongly agreed with the statement “I am more likely to buy environmentally friendly products if I know that other people are doing the same” (“affected by others”) were also more likely to be willing to pay for renewable energy, though this effect rises to statistical significance in only two of the four cases. While many questions about these results remain unanswered (see Section 8), these findings further illustrate the possible importance of the actions of others in one’s own decision making.
o A belief that government should require everyone to pay for environmental
improvements (“all should pay”) is positively related to willingness to pay for
42
renewable energy in all four scenarios, including those with collective and voluntary payments. Apparently, those who are willing to pay for renewable energy, regardless of the payment method, are also inclined to believe that everyone should be required to pay for environmental improvements. This finding is, however, more significant in the collective payment cases than in the voluntary cases, as one would expect (this can be seen by the magnitude of the coefficient in Scenarios 1 and 4 versus 2 and 3).
o Distrust of the government to effectively collect and spend funds (“government distrust”) is negatively related to WTP in all four CV scenarios, and is statistically significant in three; those with a greater trust in the government are also more likely to say they would pay a premium for renewable energy. Also consistent with what one might expect, this effect is least significant in the scenario that involves the least amount of government intervention: voluntary payments and private provision.
o Survey participants who strongly agreed with the statement “I will only pay more for environmentally friendly products if I receive a direct benefit from doing so” (“direct benefits”) were also less willing to pay for renewables than those who disagreed with this statement. This effect is statistically significant in three of four cases.
o Those respondents who strongly agreed with the statement “I am one of the first people I know to try new products” (“first mover”) were significantly more likely to state a willingness to pay for renewable energy in the voluntary payment scenario with private provision. This effect is not significant in the other scenarios. This result is plausible because the voluntary payment/private provision scenario, which also involves switching to a new electricity supplier, is the closest of all scenarios to a new product purchase.
o A lack of trust in the claims of companies offering environmental products (“company distrust”) reduces the probability of a “yes” response to the valuation question in all four scenarios, but is not statistically significant in any. A distrust of others to make personal sacrifices for the environment (“distrust of others”) and a belief that environmental regulations will no longer be required with the advent of environmental marketing (“no regulations”) have no discernable impacts on the WTP results. Meanwhile, a belief that there is little that any one individual can do about the environment (“little one can do”) appears to have a limited but negative effect on WTP.20
o Finally, those respondents who indicated that their household undertakes a large number of environmental actions on a regular basis (e.g., recycling, purchasing organic foods, etc.) also appear more willing to pay for renewable energy, especially in the collective payment scenarios.
20 This last result is at odds with research that has found a substantial relationship between “perceived consumer effectiveness” and environmental intentions and behaviors (see, e.g., Ellen et al. 1991, Berger and Corbin 1992, Roberts 1996).
43
5.7 Opinion Survey Results As an adjunct to the CV surveys, an opinion survey was fielded to a more limited sample of U.S. residents. An important goal of this survey was to provide a measuring stick for the CV results. A number of the warm-up, demographic, and socioeconomic questions in the opinion survey were the same as those in the CV surveys; results from these questions are not reported here. Instead, here we focus on the questions included in the opinion survey that relate to the specific objectives of this report and that can be compared to the results of the CV study. As will be shown, responses to the opinion survey are largely consistent with the CV results, reported earlier. We also summarize answers to other questions that relate to the barriers, motivations, and preferences of individuals who might voluntarily purchase green power.
Support for Renewable Energy After the same warm-up questions included in the CV survey, an initial question (Question 9) in the opinion survey asked simply:
Do you believe that renewable energy production should be increased, even if it costs more than other electricity production options?
55% answered affirmatively, with the remaining 45% saying no (n = 199). This finding is somewhat surprising in that a relatively modest majority of individuals indicated support for renewable energy. While the somewhat tepid response may in part be caused by uncertainty as to the level of the cost impact, it is reasonable to conclude that support for renewable energy is not unqualified among the American populace.
Payment Preferences To evaluate individual preferences for different payment methods – whether collective or voluntary - Question 10 continued:
If renewable energy is to be supported, the extra money needed to increase the supply of renewable energy could be collected in a number of ways. Of the two possible approached listed below, which one would you most prefer? 1. Option 1: The extra money could be raised through a required surcharge on
the electricity bills of all homes and businesses in the United States. 2. Option 2: The extra money could be raised through a voluntary surcharge on
the electricity bills of only those homes and businesses in the United States that volunteer to support renewable energy.
Table 16 summarizes the overall response to this question and the response segmented by initial response to Question 9, above.
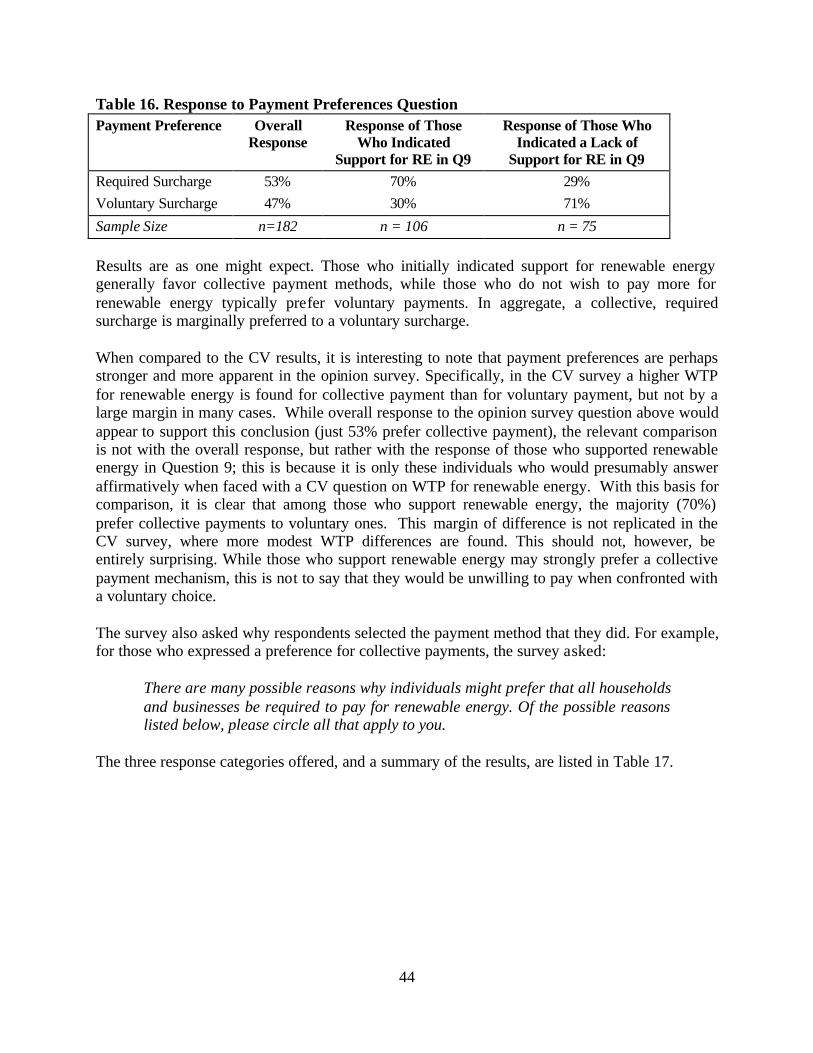
44
Table 16. Response to Payment Preferences Question Payment Preference Overall
Response Response of Those
Who Indicated Support for RE in Q9
Response of Those Who Indicated a Lack of
Support for RE in Q9 Required Surcharge 53% 70% 29% Voluntary Surcharge 47% 30% 71%
Sample Size n=182 n = 106 n = 75
Results are as one might expect. Those who initially indicated support for renewable energy generally favor collective payment methods, while those who do not wish to pay more for renewable energy typically prefer voluntary payments. In aggregate, a collective, required surcharge is marginally preferred to a voluntary surcharge. When compared to the CV results, it is interesting to note that payment preferences are perhaps stronger and more apparent in the opinion survey. Specifically, in the CV survey a higher WTP for renewable energy is found for collective payment than for voluntary payment, but not by a large margin in many cases. While overall response to the opinion survey question above would appear to support this conclusion (just 53% prefer collective payment), the relevant comparison is not with the overall response, but rather with the response of those who supported renewable energy in Question 9; this is because it is only these individuals who would presumably answer affirmatively when faced with a CV question on WTP for renewable energy. With this basis for comparison, it is clear that among those who support renewable energy, the majority (70%) prefer collective payments to voluntary ones. This margin of difference is not replicated in the CV survey, where more modest WTP differences are found. This should not, however, be entirely surprising. While those who support renewable energy may strongly prefer a collective payment mechanism, this is not to say that they would be unwilling to pay when confronted with a voluntary choice. The survey also asked why respondents selected the payment method that they did. For example, for those who expressed a preference for collective payments, the survey asked:
There are many possible reasons why individuals might prefer that all households and businesses be required to pay for renewable energy. Of the possible reasons listed below, please circle all that apply to you.
The three response categories offered, and a summary of the results, are listed in Table 17.
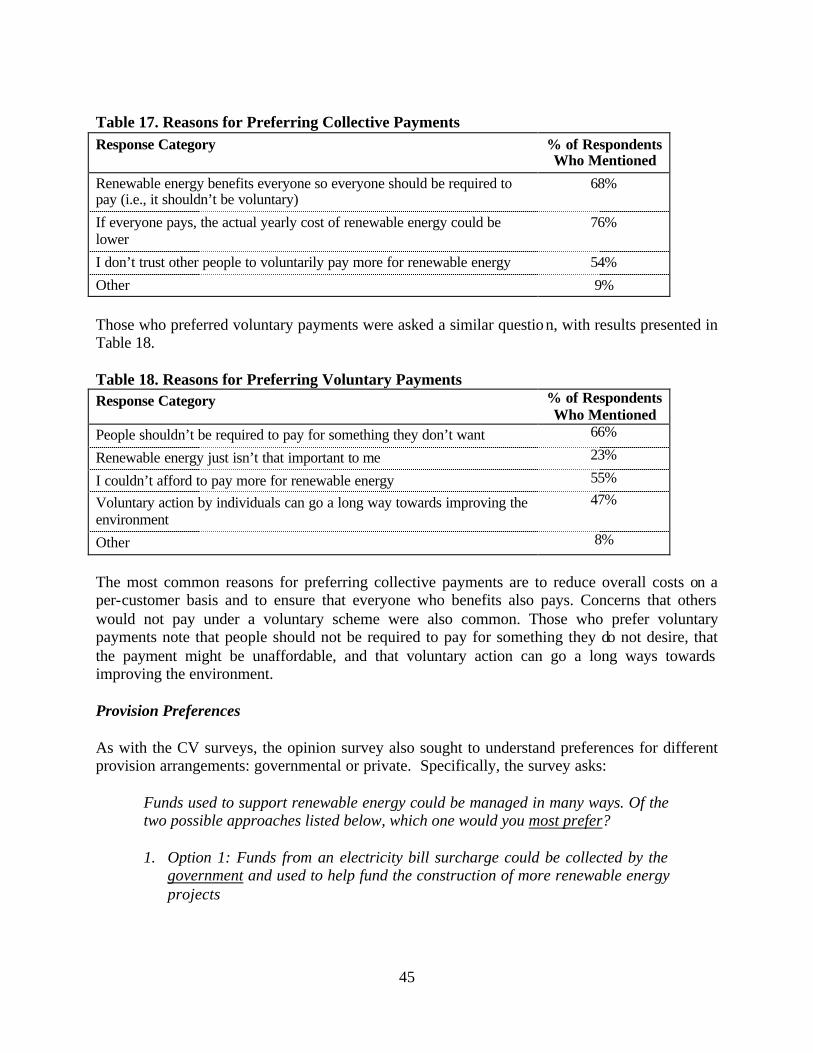
45
Table 17. Reasons for Preferring Collective Payments Response Category % of Respondents
Who Mentioned
Renewable energy benefits everyone so everyone should be required to pay (i.e., it shouldn’t be voluntary)
68%
If everyone pays, the actual yearly cost of renewable energy could be lower
76%
I don’t trust other people to voluntarily pay more for renewable energy 54%
Other 9% Those who preferred voluntary payments were asked a similar question, with results presented in Table 18. Table 18. Reasons for Preferring Voluntary Payments Response Category % of Respondents
Who Mentioned People shouldn’t be required to pay for something they don’t want 66%
Renewable energy just isn’t that important to me 23%
I couldn’t afford to pay more for renewable energy 55%
Voluntary action by individuals can go a long way towards improving the environment
47%
Other 8%
The most common reasons for preferring collective payments are to reduce overall costs on a per-customer basis and to ensure that everyone who benefits also pays. Concerns that others would not pay under a voluntary scheme were also common. Those who prefer voluntary payments note that people should not be required to pay for something they do not desire, that the payment might be unaffordable, and that voluntary action can go a long ways towards improving the environment. Provision Preferences As with the CV surveys, the opinion survey also sought to understand preferences for different provision arrangements: governmental or private. Specifically, the survey asks:
Funds used to support renewable energy could be managed in many ways. Of the two possible approaches listed below, which one would you most prefer? 1. Option 1: Funds from an electricity bill surcharge could be collected by the
government and used to help fund the construction of more renewable energy projects
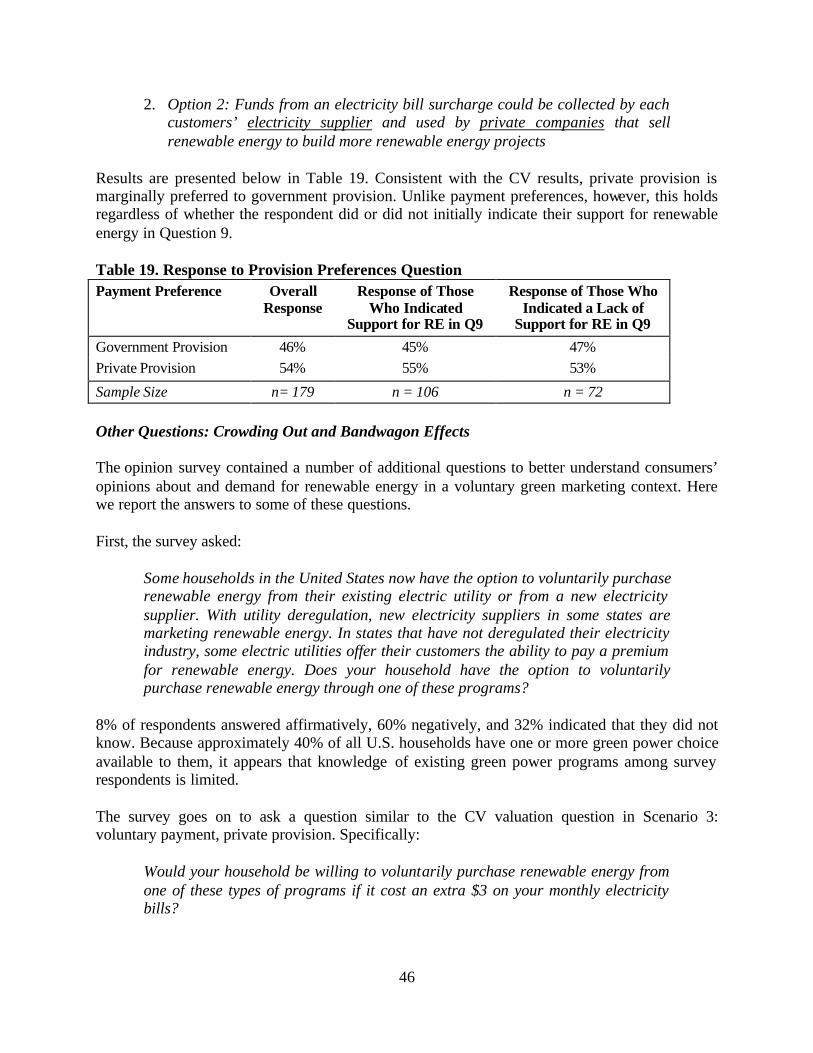
46
2. Option 2: Funds from an electricity bill surcharge could be collected by each customers’ electricity supplier and used by private companies that sell renewable energy to build more renewable energy projects
Results are presented below in Table 19. Consistent with the CV results, private provision is marginally preferred to government provision. Unlike payment preferences, however, this holds regardless of whether the respondent did or did not initially indicate their support for renewable energy in Question 9.
Table 19. Response to Provision Preferences Question Payment Preference Overall
Response Response of Those
Who Indicated Support for RE in Q9
Response of Those Who Indicated a Lack of
Support for RE in Q9
Government Provision 46% 45% 47% Private Provision 54% 55% 53%
Sample Size n= 179 n = 106 n = 72 Other Questions: Crowding Out and Bandwagon Effects The opinion survey contained a number of additional questions to better understand consumers’ opinions about and demand for renewable energy in a voluntary green marketing context. Here we report the answers to some of these questions. First, the survey asked:
Some households in the United States now have the option to voluntarily purchase renewable energy from their existing electric utility or from a new electricity supplier. With utility deregulation, new electricity suppliers in some states are marketing renewable energy. In states that have not deregulated their electricity industry, some electric utilities offer their customers the ability to pay a premium for renewable energy. Does your household have the option to voluntarily purchase renewable energy through one of these programs?
8% of respondents answered affirmatively, 60% negatively, and 32% indicated that they did not know. Because approximately 40% of all U.S. households have one or more green power choice available to them, it appears that knowledge of existing green power programs among survey respondents is limited. The survey goes on to ask a question similar to the CV valuation question in Scenario 3: voluntary payment, private provision. Specifically:
Would your household be willing to voluntarily purchase renewable energy from one of these types of programs if it cost an extra $3 on your monthly electricity bills?
47
61% of respondents answered that they would be willing to pay, while 39% indicated that they would not. This compares favorably to the 57% who indicated they would be willing to pay under CV Scenario 3 at the $3/month bid level. For those who indicated a willingness to pay, we sought to understand whether “crowding out” could be a concern. Crowding-out refers to the possibility that increased funding for social causes by the government will reduce private, voluntary contributions to those same causes. Public goods theory predicts that this will be the case (Steinberg 1987, Cornes and Sandler 1986), and there is some empirical evidence to support the crowding out effect in other contexts (Brooks 2000); other empirical evidence shows the opposite effect (Richer 1995). To question this hypothesis with respect to renewable energy, the survey asks:
Now assume that the government placed a required $2 surcharge on the monthly electricity bills of all homes and businesses in the United States, including yours, to raise funds for renewable energy. In this case, would your household still be willing to voluntarily purchase renewable energy for an extra $3 per month in addition to the required $2 charge?
To this question, 59% said yes, while 41% said no (n = 115). Concerns over crowding-out are not entirely unfounded: the survey results suggest that public policy support for renewable energy may have a negative influence on voluntary consumer demand for green power, but that 100% crowding out is not likely. The survey also sought to understand consumer preferences for utility-administered green power programs versus those in restructured markets that require a customer to switch electricity providers. Specifically, for those respondents who previously indicated a WTP for renewable energy, the survey asked:
These voluntary renewable energy programs can be designed in many ways. As noted earlier, in some states households have the option of choosing which company will provide their electricity and can choose a new electricity supplier that sells renewable energy. In other states, households can only purchase renewable energy from their existing electric utility. If you could choose, which of these two options would be more appealing to you?
A large majority of survey respondents – 67% – preferred a program offered by their existing electric utility, while just 33% preferred a program offered by a new electricity supplier (n = 108). The next question asked what concerns respondents have about voluntarily purchasing renewable energy:
There are many possible concerns that people might have about voluntarily purchasing renewable energy from one of these programs. Of the possible concerns listed below, please circle all that apply to you and your household.
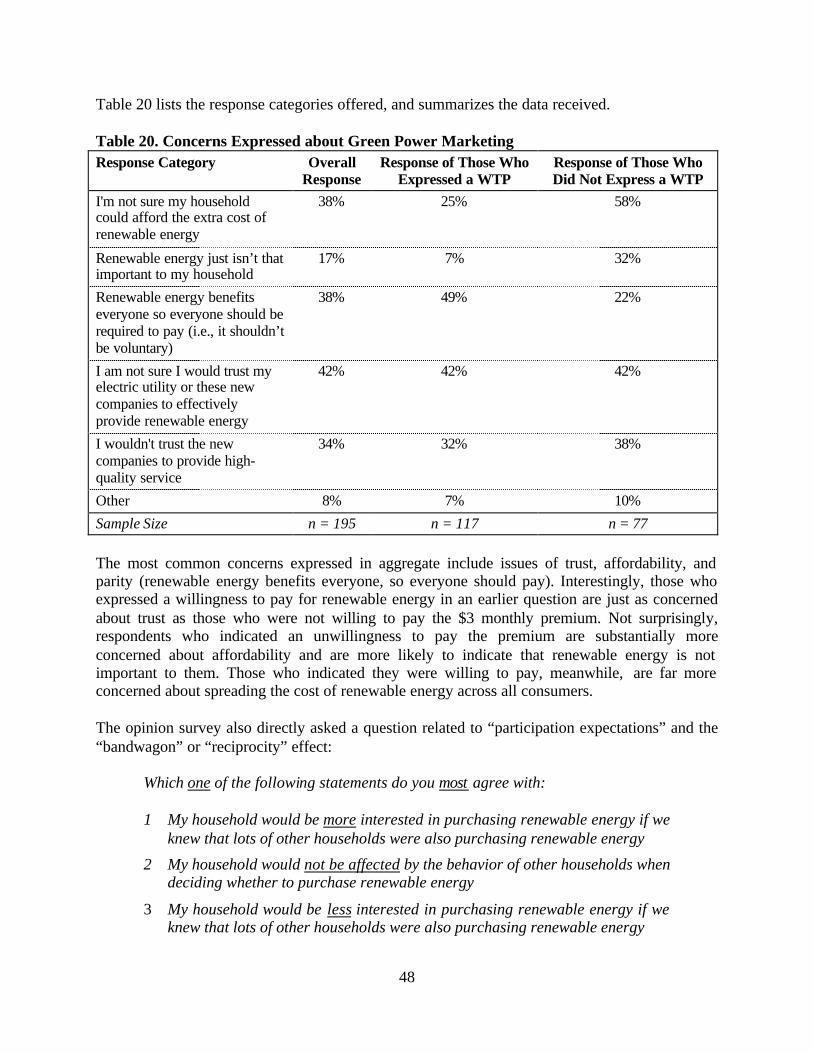
48
Table 20 lists the response categories offered, and summarizes the data received. Table 20. Concerns Expressed about Green Power Marketing Response Category Overall
Response Response of Those Who
Expressed a WTP Response of Those Who Did Not Express a WTP
I'm not sure my household could afford the extra cost of renewable energy
38% 25% 58%
Renewable energy just isn’t that important to my household
17% 7% 32%
Renewable energy benefits everyone so everyone should be required to pay (i.e., it shouldn’t be voluntary)
38% 49% 22%
I am not sure I would trust my electric utility or these new companies to effectively provide renewable energy
42% 42% 42%
I wouldn't trust the new companies to provide high-quality service
34% 32% 38%
Other 8% 7% 10%
Sample Size n = 195 n = 117 n = 77
The most common concerns expressed in aggregate include issues of trust, affordability, and parity (renewable energy benefits everyone, so everyone should pay). Interestingly, those who expressed a willingness to pay for renewable energy in an earlier question are just as concerned about trust as those who were not willing to pay the $3 monthly premium. Not surprisingly, respondents who indicated an unwillingness to pay the premium are substantially more concerned about affordability and are more likely to indicate that renewable energy is not important to them. Those who indicated they were willing to pay, meanwhile, are far more concerned about spreading the cost of renewable energy across all consumers. The opinion survey also directly asked a question related to “participation expectations” and the “bandwagon” or “reciprocity” effect:
Which one of the following statements do you most agree with:
1 My household would be more interested in purchasing renewable energy if we
knew that lots of other households were also purchasing renewable energy
2 My household would not be affected by the behavior of other households when deciding whether to purchase renewable energy
3 My household would be less interested in purchasing renewable energy if we knew that lots of other households were also purchasing renewable energy
49
Previous findings on “participation expectations” were only able to identify a positive correlation between one’s own WTP and the expectations of the willingness to pay of others. The meaning or cause of this result was left undetermined. Results from the opinion survey, however, are not only supportive of the earlier “participation expectations” result, but also directly indicate a “bandwagon” or “reciprocity” effect. That is, opinion survey results support causation between WTP expectations and one’s own willingness to pay. There is therefore some evidence that it is because lots of others are expected to pay that some of the survey respondents indicate a willingness to pay themselves. In particular, opinion survey results show that 46% of respondents say they would be more interested in purchasing renewable energy if they knew that others were doing so, while just 5% say they would be less interested. Another 49% say they would be unaffected by the behavior of others. This “bandwagon” or “reciprocity” effect also appears more pronounced for those who indicated they would be willing to pay for renewable energy than for those who indicated otherwise. Specifically, of those who do express a willingness to pay, 53% would be more interested in they knew lots of others were also purchasing renewable energy, 3% would be less interested, and 44% would not be affected. Of those not willing to pay for renewable energy, the percentages are 36%, 8%, and 57%. This finding suggests that people are sensitive to what others are doing (or what they perceive others to be doing) and may not contribute towards renewable energy if they are not confident that others are contributing as well. It deserves note, however, that many questions remain unanswered, including the aggregate size and cause of the effect. As mentioned earlier, these issues, and the need for further research in this area, are discussed further in Section 8. The survey then asked whether voluntary green power demand might replace or supplement the need for government intervention to support renewable energy:
If every household and business in the United States had the chance to voluntarily purchase renewable energy through one of these programs, how do you think that would affect the need for the government to continue its support of renewable energy?
Table 21 shows the results of this question by response category. As shown, few respondents believe that voluntary efforts would eliminate the need for continued governmental involvement. However, respondents vary on whether they believe that voluntary options would decrease, increase, or have no effect on government policy.
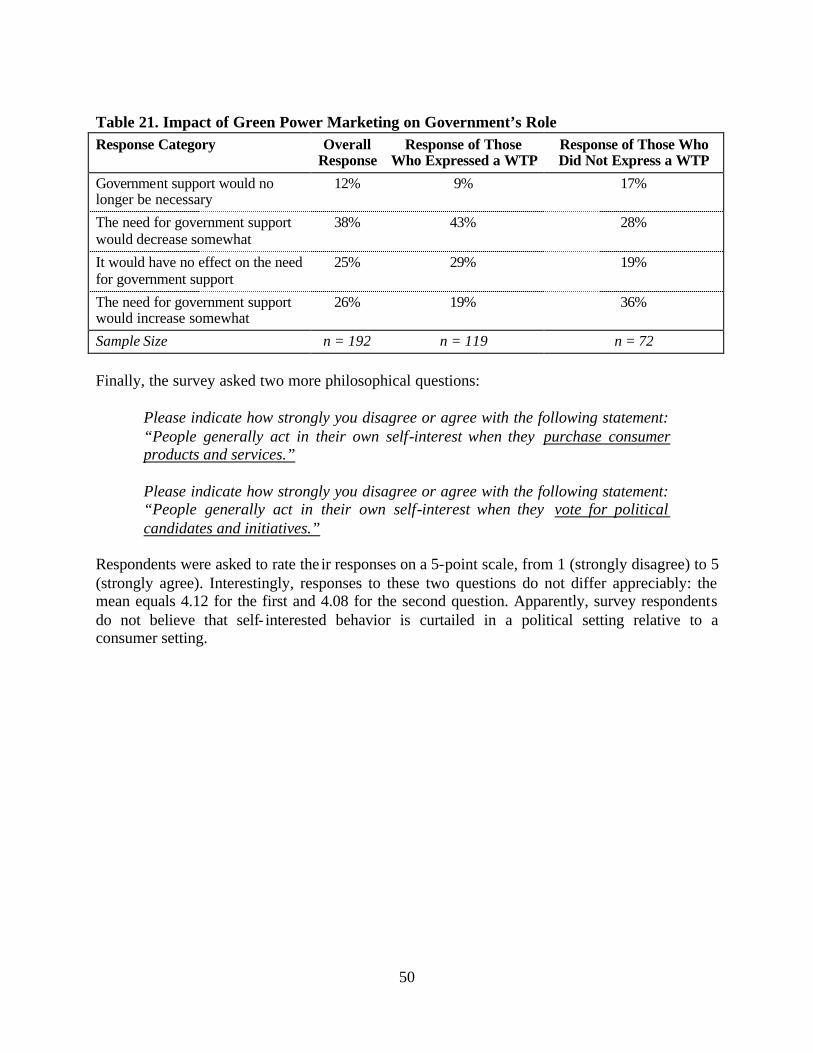
50
Table 21. Impact of Green Power Marketing on Government’s Role Response Category Overall
Response Response of Those
Who Expressed a WTP Response of Those Who Did Not Express a WTP
Government support would no longer be necessary
12% 9% 17%
The need for government support would decrease somewhat
38% 43% 28%
It would have no effect on the need for government support
25% 29% 19%
The need for government support would increase somewhat
26% 19% 36%
Sample Size n = 192 n = 119 n = 72
Finally, the survey asked two more philosophical questions: Please indicate how strongly you disagree or agree with the following statement: “People generally act in their own self-interest when they purchase consumer products and services.” Please indicate how strongly you disagree or agree with the following statement: “People generally act in their own self-interest when they vote for political candidates and initiatives.”
Respondents were asked to rate the ir responses on a 5-point scale, from 1 (strongly disagree) to 5 (strongly agree). Interestingly, responses to these two questions do not differ appreciably: the mean equals 4.12 for the first and 4.08 for the second question. Apparently, survey respondents do not believe that self- interested behavior is curtailed in a political setting relative to a consumer setting.
51
6. Summary of Findings
The main objective of this research has been to test the hypothesis that individuals’ stated WTP for a public good will differ based on the way in which the good is provided and funded. The final sections of this report describe the implications of our results for: (1) the methodology and practice of contingent valuation, (2) understanding the nature and magnitude of the “participation expectations” finding, and (3) policymakers and marketers interested in supporting renewable energy. Before detailing these implications, however, we first briefly summarize the key findings of this work:
• Contingent valuation responses are somewhat sensitive to payment and provision
context. Using both bivariate and multivariate analysis, we find a statistically significant difference in WTP responses in two of four pair wise comparisons. We find evidence that elicited WTP is higher under a collective payment method than under a voluntary one. Similarly, we find evidence that stated WTP under a private provision arrangement exceeds WTP under government provision. While evidence for these conclusions exists, it should be noted that the absolute magnitude of the effects are not always sizable, especially at higher bid levels. The results are also largely driven by survey responses to just one scenario at one bid level: Scenario 4 – collective payment, private provision – at 50¢/month.
• Responses to the “certainty” and “participation expectations” questions provide further
evidence of a preference for collective payments. In particular, a greater uncertainty in WTP response was found in Scenario 3 – voluntary payment, private provision – than under any other scenario. More persuasively (because Scenario 3 also includes customer switching, which confounds an interpretation of the results), when confronted with the “participation expectations” question, survey respondents expected a higher WTP under collective payment than under voluntary payment.
• Contingent valuation responses are strongly correlated with expectations for the
willingness to pay of others. Those survey respondents who indicate a willingness to pay for renewable energy are systematically more likely to also believe that many other U.S. residents would also pay the specified premium for renewable energy. This is true across all payment and provision scenarios, and the magnitude of the effect is sizable. Also interesting is that survey respondents generally feel that they are more likely to be willing to pay for renewable energy than would other U.S. residents.
• Regression analysis supports the construct validity of this CV application and identifies correlates to WTP. The probability of a “yes” response to the valuation question varies with a number of explanatory variables in a reasonable and expected fashion, thereby offering some support for the construct validity of this CV application. Results from this analysis also identify a number of socioeconomic, demographic, and attitudinal correlates to willingness to pay. Several of these correlates lend further support to the “participation expectations” finding.
• Opinion survey results are consistent with the contingent valuation findings. Responses
to the opinion survey demonstrate provision and payment preferences that are consistent with

52
the findings of the CV study. Collective payment is moderately preferred to voluntary payment, while private provision is preferred to government provision. Similarly, we find some evidence of a “bandwagon” or “reciprocity” effect in the opinion survey.
53
7. Implications for Contingent Valuation Fischhoff and Furby (1988) note that transactions involve three components – the good, the payment, and the social context – while Hoehn and Randall (1987) explain: “CVM [contingent valuation method] designates a class of valuation methods and there is considerable variety within that class. Not all CVM applications are created equal and differences among formats are likely to influence CVM performance… the research task in applied CVM is not to find the unique value of some change in amenities but to determine the value of the change conditioned upon an appropriate specification of the implementation and payment rules… a change in the payment or implementation rule cannot be interpreted meaningfully as information bias.” The results of this study indicate the potential for institutional context (payment and provision rules in particular) to influence CV-derived willingness to pay measures. Though the differences are at times small, and statistical significance can only be claimed in two of four pair-wise comparisons, the results presented here suggest that CV surveys can be somewhat sensitive to changes in payment and provision context. Our specific findings have important implications for the contingent valuation method, and should influence: (1) the interpretation of CV-derived welfare impacts of environmental programs, (2) beliefs about the incentive properties of various payment mechanisms commonly used in CV surveys, and (3) the interpretation of criterion validity studies in contingent valuation. These points are described in detail below.
7.1 Provision Approach: Government vs. Private Consistent with the results presented in Johnson et al. (1999), our findings provide evidence that CV measures of welfare change can be affected by the provision arrangement. Respondents presented with a renewable energy program that involved government collection and expenditure of funds generally provided lower WTP measures than those respondents faced with private sector provision of the good. Presumably, a somewhat greater degree of faith is placed on private sector provision than on government provision. This result may be of some concern to economists that use CV as an estimate of “unique” welfare impacts because our findings suggest that such “unique” impacts (which are not contingent on the provision arrangement) may not be precisely identifiable with contingent valuation. An important caveat is in order on this point, however – proponents of CV do not generally argue that CV provides a precise estimate of welfare impacts, only a satisfactory estimate, and the provision effects identified in this paper therefore do little to invalidate CV as a potential tool for estimating welfare impacts. Consequently, the importance of this study’s results on this score are that: (1) they provide additional evidence of the importance of social context and provision arrangements on elicited WTP, and (2) they suggest that, when designing CV scenarios, researchers must consider the provision arrangement as not just a tool to elicit a “unique” valuation estimate, but also as an important element of the valuation itself. If the goal of CV research is to offer a reliable estimate of “unique” value that is divorced from the provision arrangement, CV researchers should consider using multiple provision arrangements to test for such effects.
54
7.2 Payment Method: Collective vs. Voluntary Of more consequence to contingent valuation are this study’s results on the sensitivity of stated WTP to collective and voluntary payment methods. As discussed earlier in this report, there exist two conflicting theories of behavioral response when an individual is faced with a CV scenario involving voluntary payment. The first assumes that respondents answer CV questions as if they are being faced with a true economic choice to voluntarily contribute. In this case, survey respondents have an incentive to free ride and provide valuation responses that are below those elicited in an incentive-compatible collective payment context. The second possible response recognizes the long-standing concern among economists about strategic behavior in survey settings. In this case, survey respondents are posited to overstate their willingness to pay (i.e., over-bid) when presented with a voluntary payment in order to maintain the option of actually paying for the good, or free riding, at some point in the future. Results from this study suggest that the first effect exerts a slightly more powerful influence on survey responses than the second. Despite concerns raised by Carson et al. (1999) and others, this study finds limited evidence for the magnitude of over-bidding behavior that is posited by those who are concerned that strategic behavior may be rampant in CV surveys that lack incentive compatibility. Instead, if anything, this study finds some evidence of free riding and truth telling when survey respondents are faced with a voluntary payment mechanism. It appears as if some CV respondents may recognize the incentive to free ride and respond to non- incentive compatible CV surveys as if they involved real economic commitments.21 The importance of this finding to the CV literature is twofold, as discussed below.
Private versus Public Goods Models in Contingent Valuation Studies The hypothetical market included in CV surveys may be modeled as a private good (voluntary payments) or a public good (collective payments). Early CV studies often used voluntary payment methods (the private good model) to elicit WTP or did not make it clear whether payment was voluntary or collective (see, e.g., Desvousges et al. 1996). More recent CV studies have noted the poor incentive properties of voluntary payment methods, and have instead generally used clearly specified collective payment scenarios.22 Though criticisms of voluntary payment methods in hypothetical CV surveys are becoming more common (see, e.g., Carson et al. 1999, Randall 1996), these criticisms are based largely on economic theory and concerns over incentive compatibility as opposed to empirical evidence.
21 We should note several other possible explanations for the relatively modest difference between voluntary and collective WTP as elicited through this CV survey. First, it is possible that survey respondents are simply inattentive to the payment method when answering CV questions and did not pay great attention to this detail when answering. Second, and related, responses may reflect participants’ expressed preferences for renewable energy rather than a detailed evaluation of the payment method per se; in this case, respondents may treat the proposal as symbolic of a larger policy and ignore the details. Third, respondents may be answering the survey truthfully and simply not fully recognize a difference between voluntary and collective WTP or the existence of free riding or strategic behavior incentives. 22 It deserves note, however, that some contemporary CV studies continue to place credence on voluntary payment methods despite incentive compatibility concerns (see, e.g., Stevens et al. 1991, Berrens et al. 1998, Champ et al. 1997).
55
Despite theoretical predictions and concerns to the contrary, the results presented in this report show that valua tion responses to CV surveys based on voluntary payments will not necessarily be overstated relative to the incentive-compatible collective payment approach. Instead, where differences do exist, our results show that eliciting payments based on voluntary payments appears to provide a lower estimate of willingness to pay. Moreover, differences in voluntary and collective WTP, especially at high bid levels, are not particularly striking. It is unclear whether this is because respondents are simply inattentive to changes in the payment method, or whether their willingness to pay truly is insensitive to the method of payment. Regardless of the explanation, theoretical concerns notwithstanding, this study suggests that selection of an incentive-compatible collective payment approach or a non- incentive compatible voluntary approach may not be a decisive factor in CV surveys. We find little empirical evidence of strong misstatement effects and strategic behavior when survey participants are faced with voluntary payments, at least relative to an incentive-compatible design. At the least, the present practice of some CV researchers to dismiss CV studies that utilize voluntary payments due to incentive compatibility concerns alone appears overly hasty, and not yet supported by strong empirical evidence. Interpreting Criterion Validity Studies Of perhaps even more importance are the implications of these findings for the interpretation of criterion validity studies. A central question regarding contingent valuation is whether the values elicited from hypothetical surveys reflect the amounts individuals would actually pay for proposed programs. Criterion validity studies assess the difference between hypothetical statements of WTP as expressed in CV surveys and actual WTP as expressed through true market behavior. A large number of such studies have been undertaken using private goods,23 voluntary contributions to public goods,24 and mandatory contributions to public goods through referenda.25 While methods and results vary considerably across studies, the weight of the evidence suggests that hypothetical values are often greater than values as expressed through real economic commitments; this finding appears especially true when voluntary contributions to public goods are involved. Critics of CV point to these results as showing that CV-derived WTP estimates – even if elicited with “state of the art” methods – are biased upwards (Cummings and Harrison 1994). Perhaps respondents who are uncertain of their precise valuation will simply say “yes” to a CV question when presented with a “reasonable” price, for example, or do not fully consider budget constraints when faced with a hypothetical question, or simply wish to register their positive opinion of the good by indicating their willingness to pay regardless of the payment level. To counter this criticism, proponents of CV have authored a number of studies that search for ways
23 See, e.g., Loomis et al. (1997), Johannesson et al. (1998), Smith and Mansfield (1998), Kealy et al. (1988), Dickie et al. (1987), Blumenschein et al. (1998), Neill et al. (1994), Coursey et al. (1987), Bishop and Heberlein (1979), Cummings et al. (1995), Frykblom (1997). 24 See, e.g., Seip and Strand (1992), Sinden (1988), Kealy et al. (1990), Shechter et al. (1998), Foster et al. (1997), Champ et al. (1997), Ethier et al. (2000), Byrnes et al. (1999), Spencer et al. (1998). 25 See, e.g., Cummings and Taylor (1998), Cummings et al. (1997), Taylor (1998), Vossler and Kerkvliet (2003).
56
to eliminate “hypothetical” bias through calibration, wordsmithing, and other approaches. 26 In each case, the intent is to reduce CV valuation estimates so that they converge with evidence from real economic commitments. Another group of CV practitioners defends the contingent valuation method on different grounds. This group takes issue with the design and incentive properties of many of the criterion validity studies, which they argue offer fertile ground for free riding and strategic behavior and do not represent the “state of the art” in contingent valuation (Randall 1998).27 In particular, economic theory predicts that individuals who are faced with an actual opportunity to voluntarily contribute to public goods will generally not do so, and will instead free ride. Additionally, as already attributed to Carson et al. (1999) and Carson (1997), hypothetical voluntary payments, whether for public or private goods, have been predicted to lead to strategic behavior and over-bidding relative to the “true” valuations that would derive from collective payment mechanisms. These authors therefore argue that it is not CV – properly designed – that is biased, but rather the design of many of the criterion validity tests. In fact, considering these two incentives, Carson (1997) concludes: “voluntary contribution mechanisms should generally be avoided in CV surveys.” The standard collective payment measure is recommended in its stead. Results from the CV survey presented in this report place some doubt on these latter arguments, and provide tentative support for the serious concern of upward bias in even well designed CV surveys. In particular, the arguments raised above suggest that when voluntary contributions to public goods are involved actual contributions will be biased downwards by free riding and hypothetical contributions will be biased upwards by over-bidding. While the present study was not designed to test for free riding effects when real payments are involved, it finds no evidence of overbidding in the hypothetical voluntary payment condition relative to an incentive compatible, collective payment design. This casts doubt on at least one of the two arguments for why hypothetical voluntary payments to public goods may exceed actual payments. The two remaining possibilities include: (1) free riding in the actual payment condition, or (2) an overall upwards bias in CV responses, whether collective or voluntary payments are used. Nothing in the present study can distinguish the relative importance of these two effects in a public goods context. If the results of this study are extrapolated to a private goods context, however, they provide further evidence that upwards bias in CV responses may be a serious concern. As already noted, observed differences between hypothetical purchase intentions and actual purchases of private goods are sometime attributed to strategic overstatement in the hypothetical payment condition;
26 Some have suggested calibration – simply “correcting” CV estimates by scaling them down by a factor that is derived through experimentation (see, for example, Champ and Bishop 1998, List and Shogren 1998, Fox et al. 1998, Blackburn et al. 1994, Mansfield 1998). An alternative approach is through various types of “wordsmithing” to induce responses to hypothetical questions to mimic responses made by subjects facing actual payments (Loomis et al. 1994, Neill 1995, Cummings and Osborne 1996, Loomis et al. 1996). Still others suggest a “learning” design with more than one CV iteration (Bjornstad et al 1997), or a provision point mechanism (Prince et al. 1992). 27 Randall (1998) notes: “Existing literature provides considerable testimony to the tendency of researchers to pay too little attention to the incentives inherent in the contingent choice format and its actual choice counterpart, and to overinterpret the results, implying that results found with particular contingent choice formats can be generalized to CV at large.”
57
for private goods, the actual payment condition is incentive compatible because free-riding incentives are absent. At least for public goods, however, we find no evidence of strategic overstatement relative to an incentive compatible design. Absent evidence to the contrary, we suspect that strategic overstatement in a private goods context is equally unlikely. If this is so, the only remaining explanation for differences between hypothetical and actual payments to private goods in well-designed studies is that there is a general upwards bias in response to hypothetical CV questions. This upwards bias may be caused by a number of factors, including a lack of consideration for budgetary limitations, the respondents’ desires to express their preferences for the good regardless of the payment amount, or by perceived social pressure. Regardless of the reason for the bias, however, an appeal to the possibility of strategic overbidding incentives may not be enough to vindicate CV in the face of criterion validity studies. While no one experiment is definitive, our findings should be of some concern to CV practitioners.
58
8. Implications of the “Participation Expectations” Effect This study also contributes, albeit more modestly, to the collective action and related literatures on interpersonal influence, reciprocity, trust in others, and bandwagon effects. Perhaps more important than its direct contributions to these literatures, however, the findings of this report point to research questions that deserve additional attention. Here we briefly summarize the various academic literatures that relate to “participation expectations,” describe the results of our study and how they relate to the extant literature, and highlight open research questions that remain unanswered by our results. A variety of academic literatures have noted the prevalence of the “participation expectations” effect and of interpersonal influence in decision-making more broadly. As discussed earlier, two of the more relevant papers include Orbell and Dawes (1991) and Dawes, McTavish and Shaklee (1977), both of which conclude that, in experimental settings, contributors to public goods expect significantly more cooperation than do defectors. A related study by Pieters et al. (1998) shows that the expected pro-environmental behavior of other households is positively correlated with individuals’ own environmental behaviors. Others have gone even farther by claiming a causal rela tionship: people are not only sensitive to what others are doing, but may not participate in an activity unless they are confident that others are participating as well. For example, in sociology the prevalence of “bandwagon” or “critical mass” effects is often noted in studies of how innovations diffuse through society and in studies of how collective action problems can be solved when interpersonal networks and social norms become activated (Rogers 1962, Marwell et al. 2000, Macy 1991, Elster 1989, Oliver 1993). In fact, the presence and importance of interpersonal influence, norms of behavior, and social reference groups is the foundation of much of discipline of sociology. In evaluations of environmental attitudes and behaviors, studies often find that individuals who rank higher in “trust” or “faith in others” also contribute more to environmental causes,28 and that social influences affect behavior (Manzo and Weinstein 1987, Osterhus 1997, Lutzenhiser 1993, LaTour and Manrai 1989, Bearden et al. 1989). It is also widely believed that one person’s charitable contributions can be significantly influenced by the contributions of others. Marketers, meanwhile, describe the difficultly of “crossing the chasm” to reach critical mass in product sales (Moore 1991), while economists and political scientists sometimes find evidence for bandwagon effects in voting behavior (Hong and Konrad 1998). Finally, in the collective action literature, Sugden (1984), Chong (1991), Lichbach (1996) and others highlight the importance of reciprocity in providing incentives to contribute; contributions are often matched with contributions, while defection is matched with defection. Formally, game theorists and others note that if individuals can contribute to public goods contingent upon other participants, they can sometimes “solve” the free rider dilemma (Carson and Mitchell 1989, Axelrod 1984, Cornes and Sandler 1986). While discussion of the influence of such factors is prevalent in other disciplines, these effects have not been thoroughly tested in CV research, where a narrow focus on economic motivations
28 The same effect is found in other “social dilemmas” as well. See Piliavin and Charng (1990) for a list of some of these studies.
59
that assume rational maximizing behavior and independent choices often pervades research agendas.29 This study takes a preliminary step in the direction of testing for “participation expectations” in a contingent valuation setting. As already highlighted, we find substantial evidence that those who indicate a willingness to pay for renewable energy are also far more likely to believe that many others would also contribute. This is equally true under both voluntary and collective payment methods. Apparently, this “participation expectation” result is not limited to cases of voluntary payments, but is also reflected in referendum-style policy decisions. We also find that both the aggregate expected WTP of others and the support of near peers (family and friends) have separate and important relationships to an individual’s stated willingness to pay. By illustrating the apparent importance of such social influences in a contingent valuation setting, this study extends a large body of other work that has explored these concepts in more detail. Our results seemingly illustrate the complexity of individual decision-making. Free riding behavior as described by economics typically posits a utilitarian choice and assumes individualism, maximization of self- interest, and rationality. At least in its pure form, this theory does not appear to pay enough attention to the social nature of the choice in question, and in particular the apparent social interdependence of choices. The results of our analysis suggest that there is a need to include social factors in understanding choice behavior when public goods are involved, and to understand responses to contingent valuation surveys. It must be noted, however, that much remains to be done to make these findings and their implications actionable in a practical or theoretical sense. One issue that deserves further attention is that of causality and the “bandwagon” or “reciprocity” effect. Specifically, is it because others are expected to contribute that survey respondents also indicate a willingness to pay? Or, do respondents who say they are willing to pay simply “defend” their choice by saying that they believe others would make a similar one? Put another way, is it beliefs causing choice, or choice causing beliefs?30 Evidence for both effects is offered in the extant literature. The opinion survey results presented in Section 5 of this report are suggestive of a true bandwagon or reciprocity effect (beliefs causing choice), but contingent valuation responses merely indicate a positive correlation between WTP and “participation expectations,” not a direction of causality. More research will be needed to further test for a true bandwagon or reciprocity effect and to understand the magnitude and importance of that effect, both in hypothetical survey settings and in actual choice situations involving renewable energy products.
29 Some exceptions do exist. Fischhoff and Furby (1988), Blamey (1998), and Harris et al. (1989), for example, note the importance of social context and the possible influence of others in CV transactions in a qualitative fashion, while Vadnjal and O’Conner (1994), Shechter et al. (1998) and Schkade and Payne (1994) note this influence after interviewing or surveying CV respondents. Others have explicitly explored the impact of “reminders” of others’ contributions on WTP. Green et al. (1994), for example, reminded survey respondents that a large number of other individuals would also be asked for contributions. When they did so, a higher percentage of survey respondents indicated that they also would contribute, but the actual amount of each contribution was lower. Baron and Maxwell (1996) conducted a similar study with similar results, while Bohara et al. (1998) find similar results under an open-ended elicitation format but that a dichotomous choice format is immune to this effect. These findings are reminiscent of the “bystander” effect discussed in the social sciences. Under the bystander effect, the knowledge of others’ potential participation inhibits contributions because of a diffusion of perceived responsibility. 30 Dawes, McTavish and Shaklee (1977), for example, argue that it is choice causing beliefs rather than beliefs causing choice.
60
Another important area of further research is to understand the causes of the “participation expectations” results. Several possible causes based on the extant literature include (1) satisficing or imitation behavior (i.e., if others are doing it, it must be ok), (2) concerns over fairness in payment, (3) the effects of social pressure or social reference groups, (4) norms of reciprocity or cooperation, (5) a belief that the social and psychological benefits of participation will only be operative if a significant number of others also participate, and (6) a belief that the action will only be successful if others also contribute. While the positive correlation between WTP and “participation expectations” is strong, and some evidence has been presented that is suggestive of the bandwagon/reciprocity effect, it should be clear that the results presented here are not sufficient to truly understand the nature and magnitude of these influences. In the meantime, our findings do have at least two tentative implications of interest to CV practitioners and environmental marketers. First, for environmental marketers, these findings are supportive of the concerns and marketing suggestions offered by Smith and Haugtvedt (1995) and Weiner and Doescher (1991). In both cases, the authors note that concerns that others may not contribute may partially explain the gap between environmental attitudes and environmental behaviors, and suggest that to be successful social marketers must persuade individuals that others will also contribute. Second, in contingent valuation, a modest debate has arisen over whether survey participants should be informed of the valuation responses of others. Economists in this debate argue that providing survey respondents information on the (claimed or actual) responses on other subjects could induce strategic behavior or reliance on the “informed” bids of others in formulating one’s own answers (Arrow 1986, Freeman 1986). Kahnemann (1986), meanwhile, sees such information as an integral part of the valuation process – any one individual’s WTP is inextricably linked to what others are paying. While our findings cannot determine which argument is “correct” in an objective sense, they do suggest that individuals may come into a valuation exercise already holding views on the likely contributions of others and that these views may affect valuation responses.
61
9. Implications for Renewable Energy Programs Policymakers should care about the impacts of payment and provision context on stated willingness to pay because these effects have ramifications for how environmental programs could most effectively be funded. Marketers, meanwhile, can benefit from information on the barriers to green power market development. We conclude this report by describing the implications of our work for renewables policy and green power marketing, and discussing the need for further research in these areas. 9.1 Payment Preferences and Renewable Energy Support Options A variety of approaches can be used to support renewable power generation. At present, three approaches have gained prominence in the U.S. and overseas: (1) the renewables portfolio standard (RPS) – a mandatory requirement that electricity suppliers deliver a certain percentage of renewable energy (Scenario 4), (2) the system benefits charge (SBC) – a surcharge on electricity bills, the funds from which are used to support renewable energy (Scenario 1), and (3) green power marketing – relying on customers to voluntarily purchase renewable energy from electricity suppliers (Scenario 3). The survey results presented in this report provide some insight into the preferences of U.S. residents towards these approaches, as well as the opportunities and challenges facing voluntary customer demand for renewable energy. The option that elicits the highest WTP in the CV survey is the RPS: collective payment, with private provision. The SBC and green power marketing are viewed almost equally. Looking at any individual bid level, however, these differences are not always striking. At the 50¢/month bid level, for example, 79% of respondents indicate a willingness to pay for an RPS, 63% for an SBC, and 59% for a voluntary green power product. At higher bid levels, the differences become even more modest. From a policy standpoint, however, such comparisons are not as meaningful as looking across bid levels. Green power products on the market today often cost $5-10/month more than traditional electric service for a typical household, while the cost of RPS and SBC policies is typically estimated to be below $1/month for residential customers. Comparing the RPS and SBC at 50¢/month to green power marketing at $8/month leads to an attenuation of preferences. The RPS and SBC are still supported at 79% and 63%, but stated participation in voluntary green power programs drops to 44%.
Results from other questions in the CV and opinion surveys lend further support to these conclusions. Those survey respondents who indicated a willingness to pay for renewable energy on a voluntary basis from green power marketers were also less sure of their responses than were those who were asked a similar question involving collective payment. Similarly, when asked about the participation expectations of others, survey respondents consistently indicated that they would expect a higher WTP under collective payment than under voluntary payment. Moving to the opinion survey, respondents modestly preferred collective payment and private provision over voluntary payment and government provision. When asked how the availability of voluntary green power choices would affect the need for the government to continue its support of renewable energy, only 12% of respondents felt that government support would no longer be
62
necessary. 51% felt that the need for government support would remain the same or increase, while 38% felt that government support could decrease somewhat. In sum, survey results show a preference for collective payment and private provision, and a majority of respondents do not believe that voluntary green power options will eliminate the need for continued government policy supports for renewable energy. It deserves mention, however, that the strength of these preferences (as expressed in a survey setting) is perhaps not as high as what one might expect for a good (renewable energy) that provides public benefits. In the opinion survey, for example, collective payment is preferred over voluntary payment by a slim 53% to 47% margin; private provision is preferred to governmental provision on a 54% to 46% basis. Not surprisingly, those who believe renewable energy production should be increased, even if it costs more, are far more likely to prefer collective payment, while those who do not feel that renewable energy merits further support prefer voluntary payments. What is somewhat surprising is that just 55% of respondents say that renewable energy should be increased, even if it costs more than other electricity production options. This finding differs from the reported results of many other surveys that show large majorities of U.S. residents supporting renewable energy. Apparently, at least in this survey setting, U.S. residents do not recognize the need for collective action for renewable energy to the degree that one might expect.
9.2 The Limits of Green Markets Though research presented in this report shows that collective measures of policy support are generally viewed as preferable to voluntary efforts, 44% of respondents still indicate a willingness to pay for a green power product priced at $8 per month. Moreover, respondents believe that 32% of other U.S. residents would be willing to pay this same level. Both of these WTP numbers are considerably above the 1-3% market penetration rate that is common in actual green power offerings to date in the United States. Though the research presented in this report was not designed to explain this discrepancy directly, it does offer some insight. As discussed below, free riding in an actual payment condition and upwards bias in hypothetical statements of willingness to pay are not the only plausible explanations for the difference between expressed preferences for renewable energy and actual purchase behavior. Survey results suggest four additional explanations not historically emphasized in the economics literature. • Preferences for Collective Payment Vehicles and Free-Riding. Economic theory suggests
that reliance on voluntary green power demand may be precarious because free riding would be expected to dominate actual purchase decisions. While free riding has been posited to exist in theory, and has been shown to exist in experimental settings, using survey responses our research shows a preference for collective payments over voluntary payments, and therefore suggests that free riding may play a specific role in thwarting voluntary contributions to environmental causes. This preference for collective action rather than reliance on voluntary demand may be a stronger factor in an actual payment condition than under the hypothetical survey situation tested in this report.
63
• Upwards Bias in CV WTP Questions. As was suggested earlier, contingent valuation survey results offer some evidence of an upwards bias in responses to hypothetical CV questions. When asked whether they would be willing to pay a $3-8 per month premium for renewable energy, 40-60% of survey respondents say they would not pay this amount, regardless of whether payments are collective or voluntary. Given the possibility of upwards bias, the estimate that 40-60% of U.S. residents simply do not value renewable energy sufficiently to be willing to pay at the $3-8 level should be considered a lower bound. Perhaps the single largest barrier to green power sales would therefore appear to be a simple lack of interest in paying the requisite premium to support renewable energy.
• Bandwagon Effects, Critical Mass, and Reciprocity. Though the findings are still
tentative and additional research is required, CV results show a strong positive correlation between stated WTP and the expectations for the WTP of others. Opinion survey results go one step farther and show that the participation decisions of others (or the perceptions of those decisions) may have a direct and causal influence on individuals’ own participation: higher levels of participation by others increases one’s own WTP. These results tentatively suggest that the anemic participation rates in actual green power programs may, in part, be a self- fulfilling prophecy. After all, without a “critical mass” of participants, households may become disillusioned and choose not to participate. Pending further confirmation through additional research, the findings presented here suggests that the most difficult part of developing the green power market may be to develop a stable base of contributors on which further contributions can grow.
• Lack of Knowledge of Green Power Availability. As with any new product on the market,
heavy marketing is often needed to educate and inform potential purchasers of the product and its benefits. Opinion survey results show that just 8% of respondents believe that a green power product is available for purchase in their region. With actual availability at approximately 40% nationwide, it is evident that a large number of potential green power buyers are simply unaware of the products that are available. Intensive education and marketing efforts may therefore be needed to tap green power demand.
• Hesitancy in Switching Electricity Providers. The least amount of respondent certainty
surrounded willingness to pay responses to the green power marketing CV scenario, which involved switching to a new electricity provider. Meanwhile, for those respondents who indicated they were not willing to pay under this scenario, a need for further information was cited as an important reason; 24% of these respondents also indicated that they would not want to switch electricity providers for other reasons. Finally, in the opinion survey utility provision of green power was preferred on a 67% to 33% basis over purchasing green power by switching to a new electricity supplier.
• Distrust in the Product and Supplier. A great deal of distrust was expressed in the CV and
opinion surveys about both government and private provision of renewable energy. Of those who indicated they were not willing to pay for renewable energy in the CV surveys, however, the greatest amount of distrust was expressed in the voluntary green power marketing scenario (Scenario 3). Meanwhile, even among those who expressed interest in purchasing green power in the opinion survey, two of the most significant concerns
64
(expressed by 42% and 32% of respondents, respectively) were a lack of trust in the electricity supplier to effectively provide renewable energy and a lack of trust in that supplier to provide high quality service.
Based on these findings, it is clear that one cannot reasonably label all those who do not purchase green products as public-goods free riders; free riding incentives and preferences for collective payments do not appear to be only explanations for the wide gulf between positive environmental attitudes and actual purchase decisions. Apparently, if demand for green power is to increase appreciably not only will the standard economic barrier of free-riding stand in the way, but so too will a host of other barriers to volunteerism in the green market.
9.3 Research Needs and Next Steps Research presented in this report suggests that free-riding behavior is just one of many reasons for the poor showing of the green power market to date. We have also found consumer decision making to be far more complex than traditional economic models would seem to suggest, and have found only weak preferences for collective action to support renewable energy markets. These findings highlight two areas in which further research is needed: • Further Explore the Reasons for the Gap Between Hypothetical and Observed WTP.
Research reported in this study not only shows that free-riding behavior and preferences for collective payments are not the only reasons for the wide gap between hypothetical statements of WTP and observed experience with green power programs, but also identifies a number of additional explanations for the weak response to green power programs. Further work is needed to understand the relative influence of these various factors and to thereby develop a better framework for understanding the difficulties of marketing a green product.
• Understanding the Reasons for the Meager Preference for Collective Action. Perhaps
more importantly, results presented in this report show a more modest preference for collective payment vehic les among U.S. residents than might be expected based on the public goods theory alone. Further research is needed to confirm and explain this somewhat puzzling result. In particular, research should explore the relative importance of at least three possib le explanations for this finding. First, people seem to believe that voluntary consumer action to support renewable energy can be far more successful than practice bears out; on average, respondents to the CV survey thought that 32% of other U.S. residents would be willing to voluntarily contribute $8 per month to a green power program. It may be that collective policy measures are not strongly preferred simply because people believe that voluntary actions can be effective. Second, survey responses show that another possible reason for the somewhat tepid response to collective policy efforts may be that renewable energy is simply not as highly valued as suggested by earlier research; when asked whether renewable energy generation should be increased, even if it cost a bit more, just 55% responded affirmatively. Finally, the survey uncovered some distrust for the government’s ability to provide renewable energy effectively; people may therefore believe that “governmental failure” is just as significant under collective payments as “market failure” is under voluntary payments. Understanding the relative influence of these various factors

65
would usefully inform national and state policy debates on the relative merits of collective and voluntary renewable energy programs.
66
10. References Ajzen, I., Brown, T., Rosenthal, L. 1996. “Information Bias in Contingent Valuation: Effects of
Personal Relevance, Quality of Information, and Motivational Orientation.” Journal of Environmental Economics and Management, 30: 43.57.
Arrow, K. 1986. Comments in Cummings, Brookshire and Schulze, Valuing Environmental
Goods: An Assessment of the Contingent Valuation Method. Totowa, New Jersey: Rowman and Allanheld.
Arrow, K., Solow, R., Portney, P., Leaner, E., Radner, R., Schuman, H. 1993. “Report of the
NOAA Panel on Contingent Valuation.” Federal Register, 58(10): 4602-4614. Axelrod, R. 1984. The Evolution of Cooperation. Basic Books. Babb, E., Sherr, B. 1975. “Pricing Public Goods: An Experiment with Two Proposed Pricing
Systems.” Public Choice, 23: 25-48. Barron, J., Maxwell, N. 1996. “Cost of Public Goods Affects Willingness to Pay for Them.”
Journal of Behavioral Decision Making, 9: 173-183. Bateman, I., Langford, I., Turner, T., Willis, K., Garrod, G. 1995. “Elicitation and Truncation
Effects In Contingent Valuation Studies.” Ecological Economics, 12: 161-179. Bateman, I., Willis, K. (eds). 1999. Valuing Environmental Preferences: Theory and Practice of
the Contingent Valuation Method in the US, EU, and Developing Countries. Oxford, United Kingdom: Oxford University Press.
Bearden, W., Netemeyer, R., Teel, J. 1989. “Measurement of Consumer Susceptibility to
Interpersonal Influence.” Journal of Consumer Research, 15: 473-481. Berger, I., Corbin, R. 1992. “Perceived Consumer Effectiveness and Faith in Others as
Moderators of Environmentally Responsible Behaviors.” Journal of Public Policy and Marketing, 11(2): 79-100.
Berrens, R., Bohara, A., Jenkins-Smith, H., Silva, C., Ganderton, P., Brookshire, D. 1998. “A
Joint Investigation of Public Support and Public Values: Case of Instream Flows in New Mexico.” Ecological Economics, 27: 189-203.
Bishop, R., Heberlein, T. 1979. “Measuring Values of Extramarket Goods: Are Indirect
Measures Biased?” American Journal of Agricultural Economics, 61: 926-930. Bjornstad, D., Cummings, R., Osborne, L. 1997. “A Learning Design for Reducing Hypothetical
Bias in the Contingent Valuation Method.” Environmental and Resource Economics, 10: 207-221.
67
Bjornstad, D., Kahn, J. (eds). 1996. The Contingent Valuation of Environmental Resources: Methodological Issues and Research Needs. Cheltenham, United Kingdom: Edward Elgar.
Blackburn, M., Harrison, G., Rustrom, E. 1994. “Statistical Bias Functions and Informative
Hypothetical Surveys.” American Journal of Agricultural Economics, 76: 1084-1088. Blamey, R. 1998. “Contingent Valuation and the Activation of Environmental Norms.”
Ecological Economics, 24: 47-72. Blumenschein, K., Johannesson, M., Blomquist, G., Liljas, B., O’Conor, R. 1998. “Experimental
Results on Expressed Certainty and Hypothetical Bias in Contingent Valuation.” Southern Economic Journal, 65(1): 169-177.
Bohara, A., Berrens, R., Jenkins-Smith, H., Silva, C., Brookshire, D. 1998. “Effects of Total
Cost and Group-Size Information on Willingness to Pay Responses: Open Ended vs. Dichotomous Choice.” Journal of Environmental Economics and Management, 35: 142-163.
Bohm, P. 1972. “Estimating Demand for Public Goods: An Experiment.” European Economic
Review, 3: 111-130. Brooks, A. 2000. “Public Subsides and Charitable Giving: Crowding out, Crowding in, or
Both?” Journal of Policy Analysis and Management, 19 (3): 451-464. Brookshire, D., Randall, A., Stoll, J. 1980. “Valuing Increments and Decrements in Natural
Resource Service Flows.” American Journal of Agricultural Economics, 62(3): 478-488. Brookshire, D., d’Arge, R., Schulze, W, Thayer, M. 1981. “Experiments in Valuing Public
Goods.” Advances in Applied Microeconomics, 1: 123-172. Byrnes, B., Jones, C., Goodman, S. 1999. “Cont ingent Valuation and Real Economic
Commitments: Evidence from Electric Utility Green Pricing Programmes.” Journal of Environmental Planning and Management, 42(2): 149-166.
Carson, R. 1997. “Contingent Valuation: Theoretical Advances and Empirical Tests Since the
NOAA Panel.” American Journal of Agricultural Economics, 79(5): 1501-1507. Carson, R., Groves, T., Machina, M. 1999. “Incentives and Informational Properties of
Preference Questions.” Plenary Address: European Association of Resource and Environmental Economists. Oslo, Norway.
Champ, P., Bishop, R. 1998. Wind-Power Program Participation: Developing Predictive
Models. Prepared for the Energy Center of Wisconsin. Madison, Wisconsin.
68
Champ, P., Bishop, R., Brown, T., McCollum, D. 1997. “Using Donation Mechanisms to Value Nonuse Benefits from Public Goods.” Journal of Environmental Economics and Management, 33: 151-162.
Champ, P., Flores, N., Brown, T, Chivers, J. 2002. “Contingent Valuation and Incentives.” Land
Economics, 78 (4): 591-604. Chong, D. 1991. Collective Action and the Civil Rights Movement . Chicago, Ill.: University of
Chicago Press. Cornes, R., Sandler, T. 1986. The Theory of Externalities, Public Goods, and Club Goods.
Cambridge, United Kingdom: Cambridge University Press. Coursey, D., Hovis, J., Schulze, W. 1987. “The Disparity Between Willingness to Accept and
Willingness to Pay Measures of Value.” Quarterly Journal of Economics, 102(3): 679-690.
Crocker, T., Shogren, J., Turner, P. 1998. “Incomplete Beliefs and Nonmarket Valuation.
Resource and Energy Economics, 20: 139-162. Cronin, F., Herzeg, K. 1982. Valuing Nonmarket Goods Through Contingent Markets. PNL-
4255. Richland, Washington: Pacific Northwest Laboratory. Cummings, R., Taylor, L. 1998. “Does Realism Matter in Contingent Valuation Surveys?” Land
Economics, 74(2): 203-215. Cummings, R., Harrison, G., Rutstrom, E. 1995. “Homegrown Values and Hypothetical Surveys:
Is the Dichotomous Choice Approach Incentive-Compatible?” The American Economic Review, 85(1): 260-266.
Cummings, R., Elliot, S., Harrison, G., Murphy, J. 1997. “Are Hypothetical Referenda Incentive
Compatible. Journal of Political Economy, 105(3): 609-621. Cummings, R., Harrison, G. 1994. “Was the Ohio Court Well Informed in its Assessment of the
Accuracy of the Contingent Valuation Method?” Natural Resources Journal, 34: 1-36. Cummings, R., Osborne, L. 1996. Unbiased Value Estimates for Environmental Goods: A Cheap
Talk Design for the Contingent Valuation Method. Working Paper, Policy Research Center. Atlanta, Georgia: Georgia State University.
Dawes, R., McTavish, J., Shaklee, H. 1977. “Behavior, Communication, and Assumptions About
Other People’s Behavior in a Commons Dilemma Situation.” Journal of Personality and Social Psychology, 35: 1-11.
Decision Research. 1992. Summary of Green Power Research Results. Presentation prepared for
New England Power Service.
69
Desvousges, W., Hudson, S., Ruby, M. 1996. “Evaluating CV Performance: Separating the Light from the Heat.” Chapter 7 in Bjornstad and Kahn (eds.) The Contingent Valuation of Environmental Resources: Methodological Issues and Research Needs. Cheltenham, United Kingdom: Edward Elgar.
Diamond, P., Hausman, J. 1994. “Contingent Valuation: Is Some Number Better than No
Number?” Journal of Economic Perspectives, 8(4): 45-64. Dickie, M., Fisher, A., Gerking, S. 1987. “Market Transactions and Hypothetical Demand Data:
A Comparative Study.” Journal of the American Statistical Association, 82(397): 69-75. Dillman, D. 2000. Mail and Internet Surveys: The Tailored Design Method. Second Edition.
New York, NY: John Wiley & Sons, Inc. Ellen, P., Wiener, J., Cobb-Walgren, C. 1991. “The Role of Perceived Consumer Effectiveness
in Motivating Environmentally Conscious Behaviors.” Journal of Public Policy and Marketing, 10 (2): 102-117.
Elster, J. 1989. “Social Norms and Economic Theory.” Journal of Economic Perspectives, 3 (4):
99-117. Energy Coordinating Agency of Philadelphia (ECAP). 1998. The Residential Market Potential
for Renewables and Energy Conservation in Pennsylvania. Philadelphia, Pennsylvania: The Energy Coordinating Agency of Philadelphia.
Ethier, R., Poe, G., Schulze, W., Clark, J. 2000. “A Comparison of Hypothetical Phone and Mail
Contingent Valuation Responses for Green-Pricing Electricity Programs.” Land Economics, 76(1): 54-67.
Farhar, B. 1999. Willingness to Pay for Electricity from Renewable Resources: A Review of
Utility Market Research. NREL/TP-550-26148. Golden, Colorado: National Renewable Energy Laboratory.
Farhar, B., Coburn, T. 1999. Colorado Homeowner Preferences on Energy and Environmental
Policy. NREL/TP-550-25285. Golden, Colorado: National Renewable Energy Laboratory.
Ferguson, E. 1999. Renewable Resources and Conservation: What Consumers Want. Portland,
Oregon: Renewable Northwest Project. Fischhoff, B., Furby, L. 1988. “Measuring Values: A Conceptual Framework for Interpreting
Transactions with Special Reference to Contingent Valuation of Visibility.” Journal of Risk and Uncertainty, 1: 147-184.
70
Foster, V., Bateman, I., Harley, D. 1997. “Real and Hypothetical Willingness to Pay for Environmental Preservation: A Non-Experimental Comparison.” Journal of Agricultural Economics, 48(2): 123-138.
Fox, J., Shogren, J., Hayes, D., Kliebenstein, J. 1998. “CVM-X: Calibrating Contingent
Valuation with Experimental Auction Markets. American Journal of Agricultural Economics: 36-48.
Freeman, A. 1986. Comments in Cummings, Brookshire and Schulze, Valuing Environmental
Goods: An Assessment of the Contingent Valuation Method. Totowa, New Jersey: Rowman and Allanheld.
Frykblom, P. 1997. “Hypothetical Question Modes and Real Willingness to Pay.” Journal of
Environmental Economics and Management, 34: 275-287. Green, D., Kahnemann, D., Kunreuther, H. 1994. “How Scope and Method of Public Funding
Affect Willingness to Pay for Public Goods.” Public Opinion Quarterly, 58(1): 49-67. Greenley, D., Walsh, R., Young, R. 1981. “Option Value: Empirical Evidence from a Case Study
of Recreation and Water Quality.” Quarterly Journal of Economics, 96: 657-672. Guagnano, G., Dietz, T., Stern, P. 1994. “Willingness to Pay for Public Goods: A Test of the
Contribution Mechanism.” Psychological Science, 5(6): 411-415. Hanley, N., Milne, J. 1996. “Ethical Beliefs and Behaviour in Contingent Valuation Surveys.”
Journal of Environmental Planning and Management, 39(2): 255-272. Hanemann, M. 1994. “Valuing the Environment through Contingent Valuation.” Journal of
Economic Perspectives, 8(4): 19-43 Hanemann, M. 1996. “Theory Versus Data in the Contingent Valuation Debate.” Chapter 3 in
Bjornstad and Kahn (eds.) The Contingent Valuation of Environmental Resources: Methodological Issues and Research Needs. Cheltenham, United Kingdom: Edward Elgar.
Hanemann, M., Kanninen, B. 1999. “The Statistical Analysis of Discrete-Response CV Data.”
Chapter 11 in Bateman and Willis (eds.) Valuing Environmental Preferences: Theory and Practice of the Contingent Valuation Method in the US, EU, and Developing Countries. Oxford, United Kingdom: Oxford University Press.
Harris, C., Brown, G. 1992. “Gain, Loss and Personal Responsibility: The Role of Motivation in
Resource Valuation Decision-Making.” Ecological Economics, 5:73-92. Harris, C., Driver, B., McLaughlin, W. 1989. “Improving the Contingent Valuation Method: A
Psychological Perspective.” Journal of Environmental Economics and Management, 17: 213-229.
71
Hausman, J.A (ed.). 1993. Contingent Valuation: A Critical Assessment. Amsterdam, Netherlands: North-Holland.
Hoehn, J., Randall, A. 1987. “A Satisfactory Benefit Cost Indicator from Contingent Valuation.”
Journal of Environmental Economics and Management, 14: 226-247. Hong, C., Konrad, K. 1998. “Bandwagon Effects and Two-Party Majority Voting.” Journal of
Risk and Uncertainty, 16 (2): 165-172. Johannesson, M., Liljas, B., Johansson, P. 1998. “An Experimental Comparison of Dichotomous
Choice Contingent Valuation Questions and Real Purchase Decisions.” Applied Economics, 20: 643-647.
Johnson, R., Swallow, S., Weaver, T. 1999. “Estimating Willingness to Pay and Resource
Tradeoffs with Different Payment Mechanisms: An Evaluation of a Funding Guarantee for Watershed Management.” Journal of Environmental Economics and Management, 38: 97-120.
Kahnemann, D. 1986. Comments in Cummings, Brookshire and Schulze, Valuing Environmental
Goods: An Assessment of the Contingent Valuation Method. Totowa, New Jersey: Rowman and Allanheld.
Kealy, M., Montgomery, M., Dovidio, J. 1990. “Reliability and Predictive Validity of
Contingent Values: Does the Nature of the Good Matter?” Journal of Environmental Economics and Management, 19: 244-263.
Kealy, M., Dovidio, J., Rockel, M. 1988. “Accuracy in Valuation as a Matter of Degree.” Land
Economics, 64(2): 158-171. Kotchen, M., Reiling, S. 2000. “Environmental Attitudes, Motivations, and Contingent Valua tion
of Nonuse Values: A Case Study Involving Endangered Species. Ecological Economics, 32: 93-107.
LaTourm S., Manrai, A. 1989. “Interactive Impact of Informational and Normative Influence on
Donations.” Journal of Marketing Research, 26: 327-335. Ledyard, J. 1995. “Public Goods: A Survey of Experimental Research.” In J. Kagel and A. Roth,
eds., Handbook of Experimental Economics. Princeton, NJ: Princeton University Press. Lichbach, M. 1996. The Cooperator’s Dilemma. Ann Arbor, Michigan: The University of
Michigan Press. List, J., Shogren, J. 1998. “Calibration of the Difference Between Actual and Hypothetical
Valuations in a Field Experiment.” Journal of Economic Behavior and Organization, 37: 193-205.
72
Loomis, J., Brown, T., Lucero, B., Peterson, G. 1996. “Improving Validity Experiments of Contingent Valuation: Results from Efforts to Reduce the Disparity of Hypothetical and Actual Willingness to Pay.” Land Economics, 72(4): 450-461.
Loomis, J., Brown, T., Lucero, B., Peterson, G. 1997. “Evaluating the Validity of the
Dichotomous Choice Question Format in Contingent Valuation.” Environmental and Resource Economics, 10: 109-123.
Loomis, J., Gonzalez-Caban, A., Gregory, R. 1994. “Substitutes and Budget Constraints in
Contingent Valuation.” Land Economics, 70 (4): 499-506. Lunander, A. 1998. “Inducing Incentives to Understate and Overstate Willingness to Pay within
Open-Ended and Dichotomous-Choice Elicitation Formats: An Experimental Study.” Journal of Environmental Economics and Management, 35: 88-102.
Lutzenhiser, L. 1993. “Social and Behavioral Aspects of Energy Use.” Annual Review of Energy
and the Environment, 18: 247-289. Luzar, E., Cosse, K. 1998. “Willingness to Pay or Intention to Pay: The Attitude-Behavior
Relationship in Contingent Valuation.” Journal of Socio-Economics, 27(3): 527-444. Macy, M. 1991. “Chains of Cooperation: Threshold Effects in Collective Action.” American
Sociological Review, 56 (6): 730-747. Mansfield, C. 1998. “A Consistent Method for Calibrating Contingent Value Survey Data.”
Southern Economic Journal, 64(3): 665-681. Manzo, L., Weinstein, N. 1987. “Behavioral Commitment to Environmental Protection: A Study
of Active and Nonactive Members of the Sierra Club.” Environment and Behavior, 19 (6): 673-694.
Marwell, G., Oliver, P., Prahl, R. 1988. “Social Networks and Collective Action: A Theory of
Critical Mass. III.” American Journal of Sociology, 94 (3)” 502-534. Milon, J. 1989. “Contingent Valuation Experiments for Strategic Behavior.” Journal of
Environmental Economics and Management, 17: 293-308. Mitchell, R., Carson, R. 1989. Using Surveys to Value Public Goods: The Contingent Valuation
Method. Washington, D.C.: Resources for the Future. Moore, G. 1991. Crossing the Chasm: Marketing and Selling High-Tech Products to
Mainstream Customers. New York, NY: HarperBusiness. Neill, H. 1995. “The Context for Substitutes in CVM Studies: Some Empirical Observations.”
Journal of Environmental Economics and Management, 29 (3): 33-397.
73
Neill, H., Cummings, R., Ganderton, P., Harrison, G., McGuckin, T. 1994. “Hypothetical Surveys and Real Economic Commitments.” Land Economics, 70(2): 146-154
Oliver, P. 1993. “Formal Models of Collective Action.” Annual Review of Sociology, 19: 271-
300. Orbell, J., Dawes, R. 1991. “A ‘Cognitive Miser’ Theory of Cooperators’ Advantage.” American
Political Science Review, 85 (2): 515-528. Osterhus, T. 1997. “Pro-Social Consumer Influence Strategies: When and How do They Work?”
Journal of Marketing, 61: 16-29. Pieters, R., Bijmolt, T., Raaij, F., Kruijk, M. 1998. “Consumers’ Attributions of
Proenvironmental Behavior, Motivation, and Ability to Self and Others.” Journal of Public Policy and Marketing, 17 (2): 215-225.
Piliavin, J., Charng, H. 1990. “Altruism: A Review of Recent Theory and Research.” Annual
Review of Sociology, 16: 27-65. Poe, G., Clark, J., Schulze, W. 1997. Can Hypothetical Questions Predict Actual Participation in
Public Programs? A Field Validity Test Using A Provision Point Mechanism. ERE 97-05. Ithaca, NY: Cornell University.
Posavac, S. 1998. “Strategic Overbidding in Contingent Valuation: Stated Economic Value of
Public Goods Varies According to Consumers Expectations of Funding Source.” Journal of Economic Psychology, 19: 205-214.
Prince, R., McKee, M., Ben-David, S., Bagnoli, M. 1992. “Improving the Contingent Valuation
Method: Implementing the Contribution Game.” Journal of Environmental Economics and Management, 23: 78-90.
Randall, A. 1996. “Calibration of CV Responses: Discussion.” Chapter 11 in Bjornstad and
Kahn (eds.) The Contingent Valuation of Environmental Resources: Methodological Issues and Research Needs. Cheltenham, United Kingdom: Edward Elgar.
Randall, A. 1998. “Beyond the Crucial Experiment: Mapping the Performance Characteristics of
Contingent Valuation.” Resource and Energy Economics, 20: 197-206. Randall, A., Ives, C., Eastman, C. 1974. Benefits of Abating Aesthetic Environmental Damage
from the Four Corners Power Plant, Fruitland, New Mexico. Agricultural Experiment Station Bulletin 618.Las Cruces, New Mexico: Mexico State University.
Richer, J. 1995. Green Giving: An Analysis of Contributions to Major U.S. Environmental
Groups. Discussion Paper 95-39. Washington, D.C.: Resources for the Future.
74
Roberts, J. 1996. “Green Consumers in the 1990s: Profile and Implications for Advertising.” Journal of Business Research, 36: 217-231.
Rogers, E. 1962. Diffusion of Innovations. New York, NY: The Free Press. Rose, S., Clark, J., Poe, G., Rondeau, D., Schulze, W. 1997. The Private Provision of Public
Goods: Tests of a Provision Point Mechanism for Funding Green Power Programs. ERE 97-02. Ithaca, NY: Cornell University.
Rowe, R., Chestnut, L. 1983. “Valuing Environmental Commodities: Revisited.” Land
Economics, 59 (4): 404-410. Rowe, R., D’Arge, R., Brookshire, D. 1980. “An Experiment on the Economic Value of
Visibility.” Journal of Environmental Economics and Management, 7: 1-19. Samuelson, P. 1954. “The Pure Theory of Public Expenditure.” Review of Economics and
Statistics, 36: 386-389. Schkade, D., Payne, J. 1994. “How People Respond to Contingent Valuation Questions: A
Verbal Protocol Analysis of Willingness to Pay for an Environmental Regulation.” Journal of Environmental Economics and Management, 26: 88-109.
Shechter, M, Reiser, B., Zaitsev, N. 1998. “Measuring Passive Use Values: Pledges, Donations
and CV Responses in Connection with an Important Natural Resource. Environmental and Resource Economics, 12: 457-478.
Sinden, J. 1988. “Empirical Tests of Hypothetical Bias in Consumers’ Surplus Surveys.”
Australian Journal of Agricultural Economics, 32(2/3): 98-112. Seip, K., Strand, J. 1992. “Willingness to Pay for Environmental Goods in Norway: a Contingent
Valuation Study with Real Payment.” Environmental and Resource Economics, 2: 91-106.
Sloan, M., Taddune, G. 1999. “What Texans Want from Their Electric Utility.” Proceedings:
SOLAR 1999. Portland, Maine: American solar Energy Society. Smith, S., Haugtvedt, C. 1995. “Implications of Understanding Basic Attitude Change Processes
and Attitude Structure for Enhancing Pro-Environmental Behaviors.” Chapter 8 in M. Polansky and A. Mintu-Wimsatt eds. Environmental Marketing: Strategies, Practice, Theory, Research. New York, New York: The Hawthorn Press.
Smith, V.K., Mansfield, C. 1998. “Buying Time: Real and Hypothetical Questions.” Journal of
Environmental Economics and Management, 26: 209-224.
75
Spencer, M., Swallow, S., Miller, C. 1998. “Valuing Water Quality Monitoring: A Contingent Valuation Experiment Involving Hypothetical and Real Payments. Agricultural and Resource Economics Review, April, 28-41.
Steinberg, R. 1987. “Voluntary Donations and Public Expenditures in a Federalist System.” The
American Economic Review, 77 (1): 24-36. Stevens, T., DeCoteau, N., Willis, C. 1997. “Sensitivity of Contingent Valuation to Alternative
Payment Schedules.” Land Economics, 73(1): 140-149. Stevens, T., Echeverria, J., Glass, R., Hagar, T., More, T. 1991. “Measuring the Existence Value
of Wildlife: What Do CVM Estimates Really Show?” Land Economics, 67(4): 390-400. Sugden, R. 1984. “Reciprocity: The Supply of Public Goods Through Voluntary Contributions.”
The Economic Journal, 94 (376): 772-787. Taylor, L. 1998. “Incentive Compatible Referenda and the Valuation of Environmental Goods.”
Agricultural and Resource Economics Review, October, 132-139. Vadnjal, D., O’Connor, M. 1994. “What is the Value of Rangitoto Island?” Environmental
Values, 3: 369-380. Vossler, C., Kerkvliet, J. 2003. “A Criterion Validity Test of the Contingent Valuation Method:
Comparing Hypothetical and Actual Voting Behavior for a Public Referendum.” Journal of Environmental Economics and Management, 45: 631-649.
Weiner, J., Doescher, T. 1991. “A Framework for Promoting Cooperation.” Journal of
Marketing, 55: 38-47.
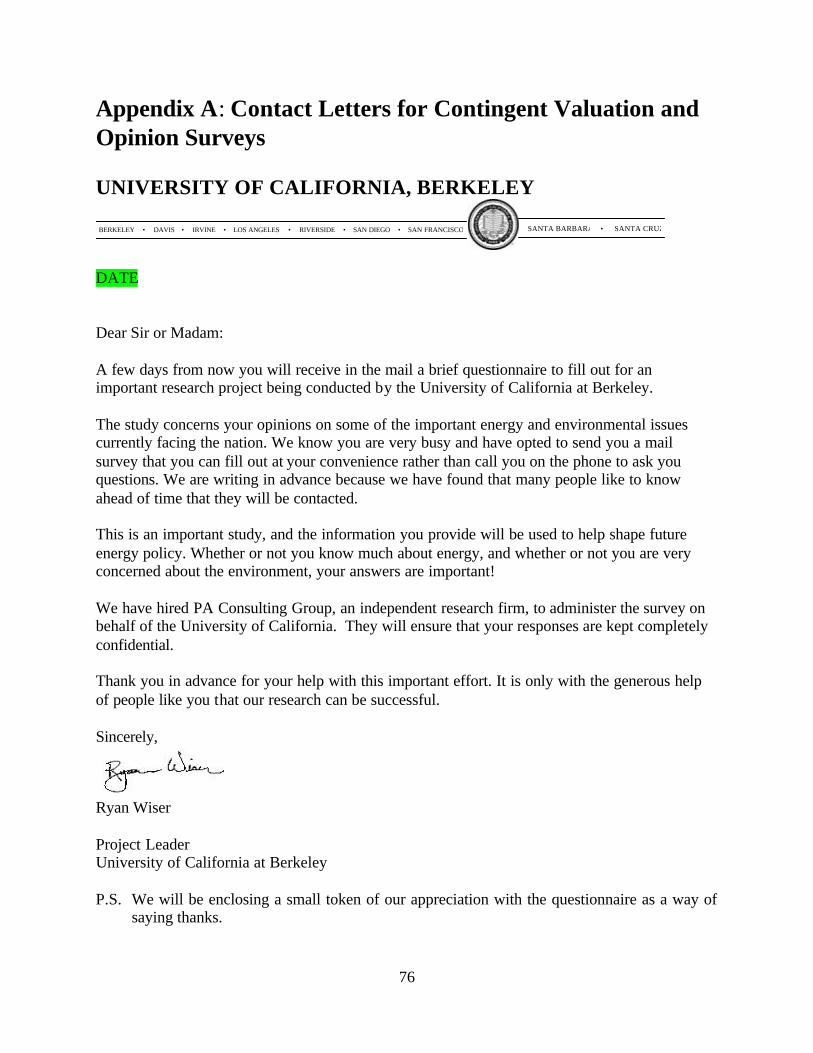
76
Appendix A: Contact Letters for Contingent Valuation and Opinion Surveys UNIVERSITY OF CALIFORNIA, BERKELEY
BERKELEY DAVIS IRVINE LOS ANGELES RIVERSIDE SAN DIEGO SAN FRANCISCO• • • • • • SANTA BARBARA SANTA CRUZ•
DATE Dear Sir or Madam: A few days from now you will receive in the mail a brief questionnaire to fill out for an important research project being conducted by the University of California at Berkeley. The study concerns your opinions on some of the important energy and environmental issues currently facing the nation. We know you are very busy and have opted to send you a mail survey that you can fill out at your convenience rather than call you on the phone to ask you questions. We are writing in advance because we have found that many people like to know ahead of time that they will be contacted. This is an important study, and the information you provide will be used to help shape future energy policy. Whether or not you know much about energy, and whether or not you are very concerned about the environment, your answers are important! We have hired PA Consulting Group, an independent research firm, to administer the survey on behalf of the University of California. They will ensure that your responses are kept completely confidential. Thank you in advance for your help with this important effort. It is only with the generous help of people like you that our research can be successful. Sincerely,
Ryan Wiser
Project Leader University of California at Berkeley P.S. We will be enclosing a small token of our appreciation with the questionnaire as a way of
saying thanks.
77
UNIVERSITY OF CALIFORNIA, BERKELEY
BERKELEY DAVIS IRVINE LOS ANGELES RIVERSIDE SAN DIEGO SAN FRANCISCO• • • • • • SANTA BARBARA SANTA CRUZ•
DATE Dear Sir or Madam: We are writing to ask for your help in a study that is being sponsored by the University of California at Berkeley. The study concerns your opinions on some of the most important energy and environmental issues facing the nation. You are part of a small group of individuals that were randomly selected to represent the views of all Americans. Whether or not you know much about energy, and whether or not you are very concerned about the environment, your answers to the enclosed survey are vitally important! Results from the survey will be used to help shape future policy in the United States. In particular, because of changes in the electric utility industry, the nation is faced with a decision about whether to support renewable energy sources (such as wind power and solar energy) in the future. However, little is known about what people think about this issue. Only by asking people throughout the country to give their honest opinions can we incorporate those opinions into national policy decisions. You can be assured of complete confidentiality. Your name will never be associated with the study’s findings. When you have completed the questionnaire, your name will be deleted from the mailing list and never connected to your answers in any way. We have hired PA Consulting Group, an independent research firm, to administer the survey on behalf of the University of California. They will ensure that your responses are kept completely confidential. If you have any questions about the study’s purpose, please feel free to call me at the University of California at (510) 486-5474. If you have any questions about the survey booklet, please call Kimberly Bakalars at PA Consulting Group toll- free at 1-800-935-4277. Thank you in advance for your help with this important study. Sincerely,
Ryan Wiser Project Leader University of California at Berkeley P.S. Please accept the enclosed $1 as a token of our appreciation for your help.

78
Dear Sir or Madam: A few days ago you should have received a short survey asking your opinions about important energy and environmental issues currently facing the nation. You are part of a small group of individuals randomly selected to receive this survey. If you have already filled out and returned the questionnaire to us, please accept our sincere thanks. If not, we hope you will take a moment to complete and return the survey today. It is extremely important that we hear from you because your responses will help shape future energy policy in the United States. If you did not receive the questionnaire, or if it was misplaced, please call Kimberly Bakalars at PA Consulting Group toll-free at 1-800-935-4277 and she will get another one in the mail to you today. We are hoping to hear from you soon. Your contribution to the success of this study will be greatly appreciated!
Ryan Wiser University of California at Berkeley
c/o PA Consulting Group, 2711 Allen Boulevard, Suite 200, Middleton, WI 53562
79
UNIVERSITY OF CALIFORNIA, BERKELEY
BERKELEY DAVIS IRVINE LOS ANGELES RIVERSIDE SAN DIEGO SAN FRANCISCO• • • • • • SANTA BARBARA SANTA CRUZ•
DATE Dear Sir or Madam: We are sorry to bother you again, but it is important to hear from you. A few weeks ago we sent you a survey asking what you think about critical energy and environmental issues facing the nation. We believe it is important that people’s opinions towards energy and environmental issues be incorporated into national policy decisions. Good decisions about energy policy can only be made if we know how people like you will be affected. We are sending you another copy of the questionnaire because of our concern that people who have not responded may have different opinions than those who have. To get a good understanding of the range of opinions about the issues, we must hear from as many people as possible. Regardless of whether or not you know much about energy issues, and whether or not you are very concerned about the environment, it is important that we hear your opinions. We also want to assure you that your responses to this survey will be kept strictly confidential and that your name will never be revealed to anyone. Information from the survey will be reported only in statistical terms. The identification number on the back of the survey is used only for tracking purposes so we can avoid re-contacting those people who have already completed the survey. Because your response is so important, we are enclosing another copy of the survey and a postage-paid, self-addressed envelope for your convenience. If for some reason you can’t complete the survey, please write us a note on your survey booklet and return it. If you have any questions about the purpose of the study or its use, please feel free to call me at the University of California at Berkeley at (510) 486-5474. If you have any questions about the survey booklet, please call Kimberly Bakalars at PA Consulting Group toll- free at 1-800-935-4277.
Sincerely,
Ryan Wiser Project Leader University of California at Berkeley
80
Appendix B: Sample Contingent Valuation Surveys
SCENARIO 1: 50 CENTS/MONTH BID LEVEL
Deciding Our Energy Future: Choices for Electricity Supply Survey
University of California at Berkeley

81
Section 1: Energy Issues Facing the United States
To begin, we would like to ask you some questions about yourself and about your feelings on the electricity industry and on renewable energy.
1. Do you own or rent your residence? (please circle one number)
1 Own 2 Rent, lease or other arrangement
2. Does your household pay its own electricity bill? (please circle one number)
1 No ? Please STOP HERE and return the survey. Thank you for your participation! 2 Yes ? Please GO TO QUESTION 3 and continue with this survey
3. Households in some states now have the option of choosing which company will provide their
electricity (much like choosing a new long-distance telephone provider). Does your household have the option of choosing your electric company? (please circle one number)
1 No 2 Yes 3 Don't know
4. In meeting the nation's overall electricity needs, please indicate how important each of the
following issues is to you. (please circle one number for each issue)
not at all important
extremely important
Ensuring that electricity service is reliable 1 2 3 4 5
Increasing the amount of electricity generated from renewable sources (such as wind and solar)
1 2 3 4 5
Minimizing the cost of electricity to consumers 1 2 3 4 5
Increasing investments in energy efficiency 1 2 3 4 5
Improving the quality of customer service 1 2 3 4 5
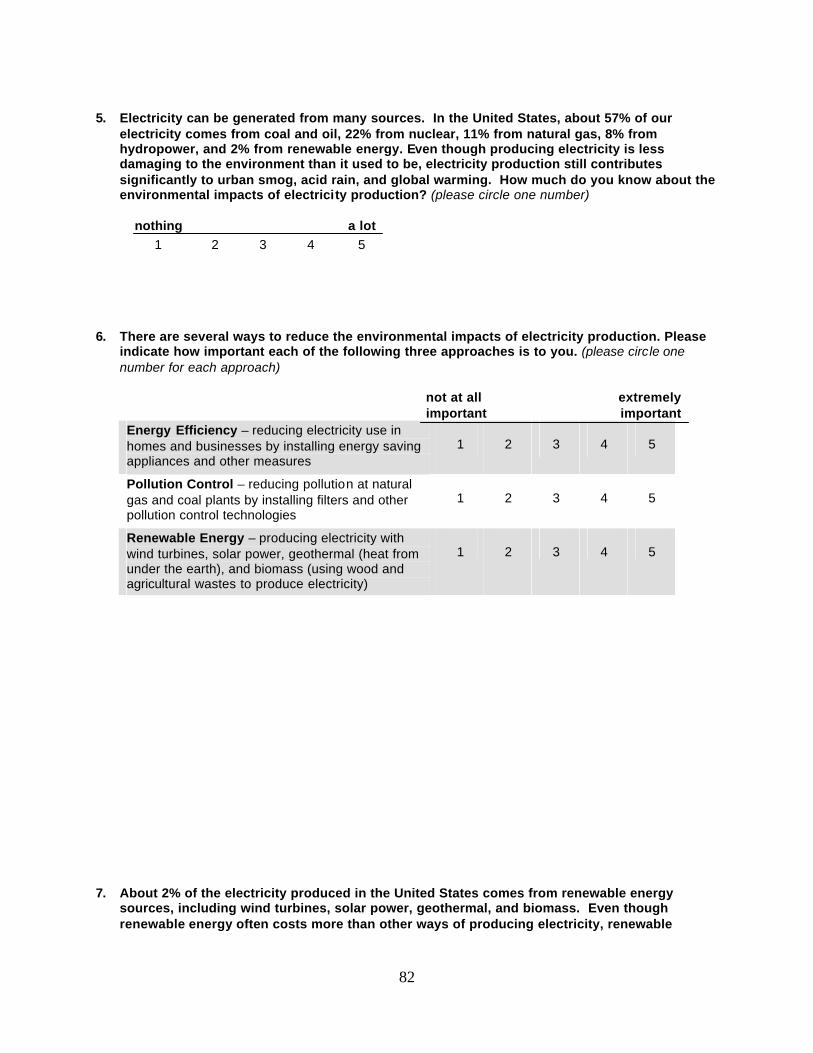
82
5. Electricity can be generated from many sources. In the United States, about 57% of our
electricity comes from coal and oil, 22% from nuclear, 11% from natural gas, 8% from hydropower, and 2% from renewable energy. Even though producing electricity is less damaging to the environment than it used to be, electricity production still contributes significantly to urban smog, acid rain, and global warming. How much do you know about the environmental impacts of electricity production? (please circle one number)
nothing a lot
1 2 3 4 5 6. There are several ways to reduce the environmental impacts of electricity production. Please
indicate how important each of the following three approaches is to you. (please circle one number for each approach)
not at all
important
extremely important
Energy Efficiency – reducing electricity use in homes and businesses by installing energy saving appliances and other measures
1 2 3 4 5
Pollution Control – reducing pollution at natural gas and coal plants by installing filters and other pollution control technologies
1 2 3 4 5
Renewable Energy – producing electricity with wind turbines, solar power, geothermal (heat from under the earth), and biomass (using wood and agricultural wastes to produce electricity)
1 2 3 4 5
7. About 2% of the electricity produced in the United States comes from renewable energy sources, including wind turbines, solar power, geothermal, and biomass. Even though renewable energy often costs more than other ways of producing electricity, renewable
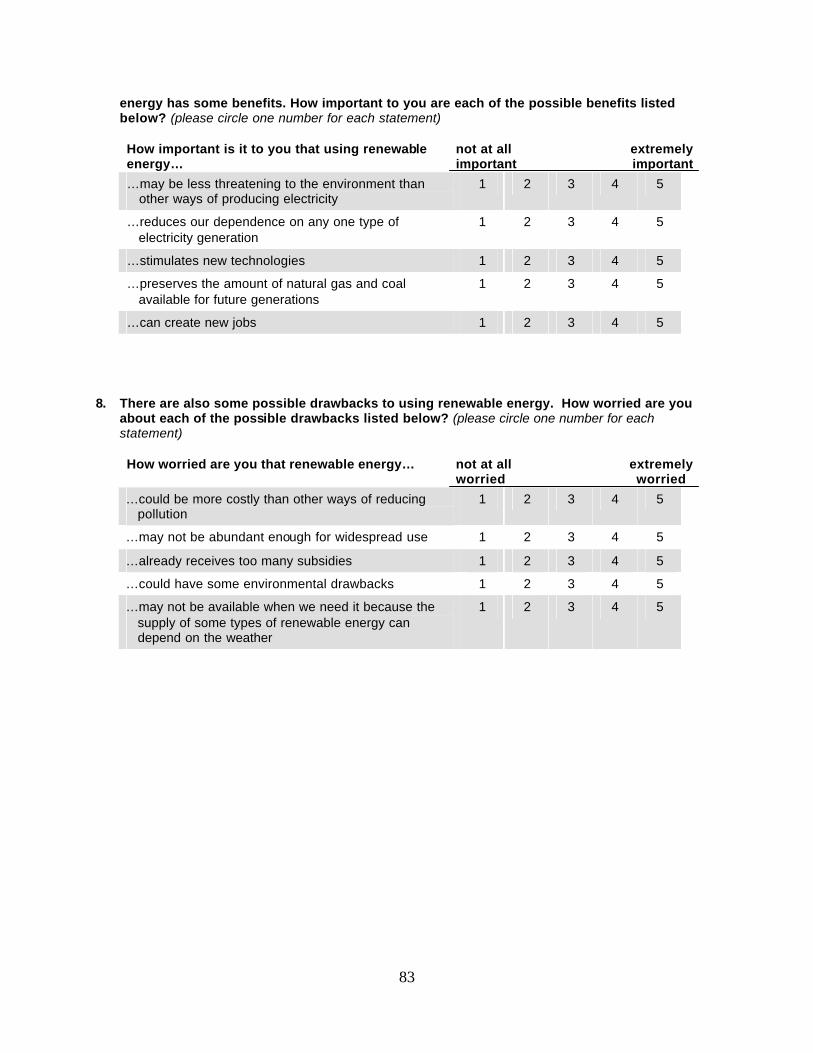
83
energy has some benefits. How important to you are each of the possible benefits listed below? (please circle one number for each statement)
How important is it to you that using renewable energy…
not at all important
extremely important
…may be less threatening to the environment than other ways of producing electricity
1 2 3 4 5
…reduces our dependence on any one type of electricity generation
1 2 3 4 5
…stimulates new technologies 1 2 3 4 5
…preserves the amount of natural gas and coal available for future generations
1 2 3 4 5
…can create new jobs 1 2 3 4 5 8. There are also some possible drawbacks to using renewable energy. How worried are you
about each of the possible drawbacks listed below? (please circle one number for each statement) How worried are you that renewable energy…
not at all worried
extremely worried
…could be more costly than other ways of reducing pollution
1 2 3 4 5
…may not be abundant enough for widespread use 1 2 3 4 5
…already receives too many subsidies 1 2 3 4 5
…could have some environmental drawbacks 1 2 3 4 5
…may not be available when we need it because the supply of some types of renewable energy can depend on the weather
1 2 3 4 5
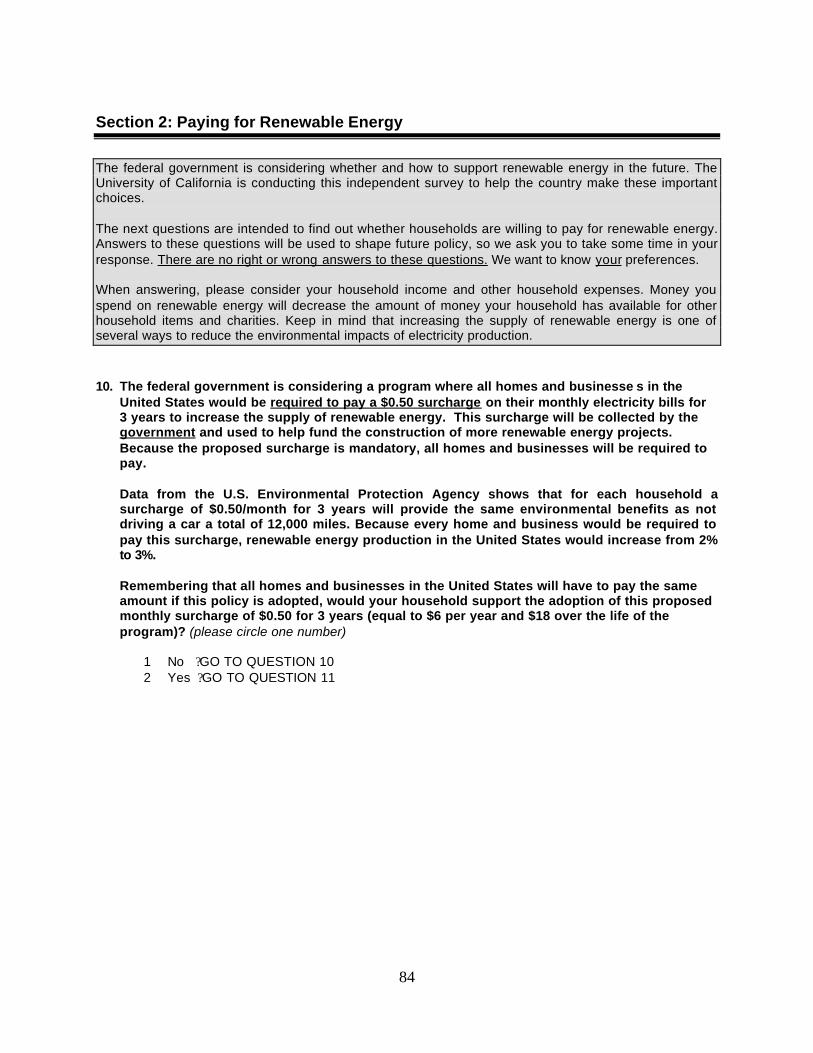
84
Section 2: Paying for Renewable Energy
The federal government is considering whether and how to support renewable energy in the future. The University of California is conducting this independent survey to help the country make these important choices. The next questions are intended to find out whether households are willing to pay for renewable energy. Answers to these questions will be used to shape future policy, so we ask you to take some time in your response. There are no right or wrong answers to these questions. We want to know your preferences. When answering, please consider your household income and other household expenses. Money you spend on renewable energy will decrease the amount of money your household has available for other household items and charities. Keep in mind that increasing the supply of renewable energy is one of several ways to reduce the environmental impacts of electricity production.
10. The federal government is considering a program where all homes and businesse s in the
United States would be required to pay a $0.50 surcharge on their monthly electricity bills for 3 years to increase the supply of renewable energy. This surcharge will be collected by the government and used to help fund the construction of more renewable energy projects. Because the proposed surcharge is mandatory, all homes and businesses will be required to pay. Data from the U.S. Environmental Protection Agency shows that for each household a surcharge of $0.50/month for 3 years will provide the same environmental benefits as not driving a car a total of 12,000 miles. Because every home and business would be required to pay this surcharge, renewable energy production in the United States would increase from 2% to 3%. Remembering that all homes and businesses in the United States will have to pay the same amount if this policy is adopted, would your household support the adoption of this proposed monthly surcharge of $0.50 for 3 years (equal to $6 per year and $18 over the life of the program)? (please circle one number)
1 No ? GO TO QUESTION 10 2 Yes ? GO TO QUESTION 11
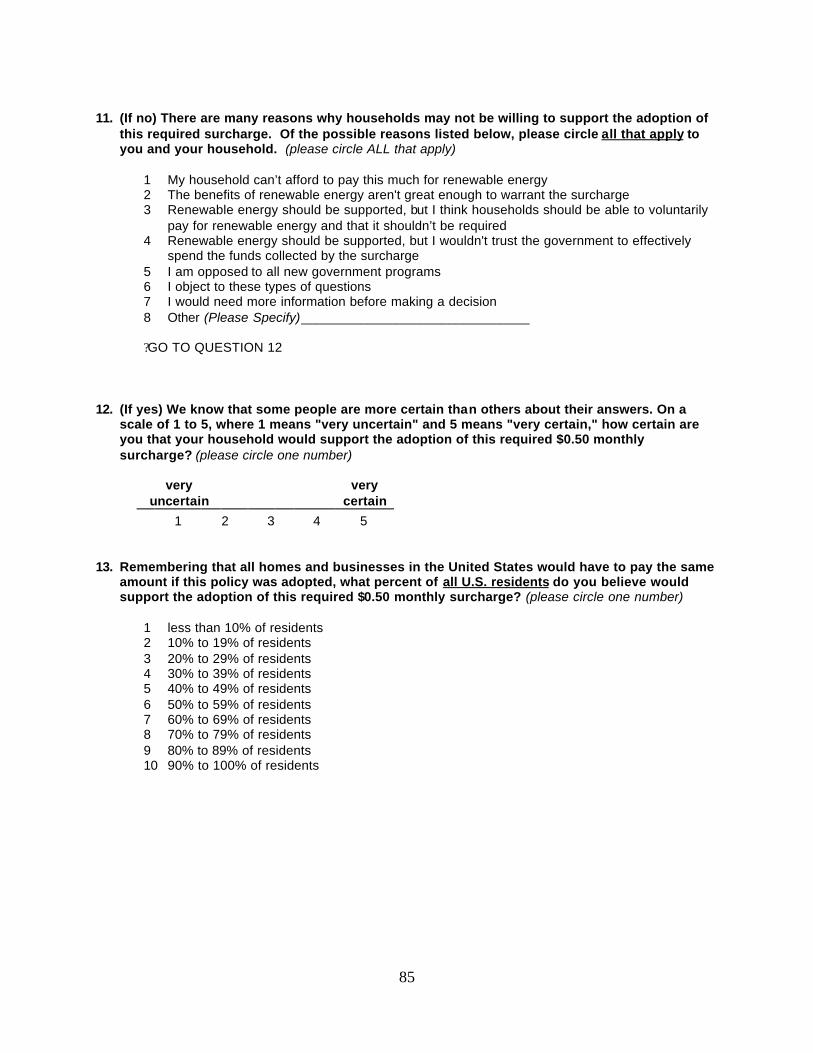
85
11. (If no) There are many reasons why households may not be willing to support the adoption of
this required surcharge. Of the possible reasons listed below, please circle all that apply to you and your household. (please circle ALL that apply)
1 My household can’t afford to pay this much for renewable energy 2 The benefits of renewable energy aren't great enough to warrant the surcharge 3 Renewable energy should be supported, but I think households should be able to voluntarily
pay for renewable energy and that it shouldn’t be required 4 Renewable energy should be supported, but I wouldn't trust the government to effectively
spend the funds collected by the surcharge 5 I am opposed to all new government programs 6 I object to these types of questions 7 I would need more information before making a decision 8 Other (Please Specify)_______________________________ ? GO TO QUESTION 12
12. (If yes) We know that some people are more certain than others about their answers. On a
scale of 1 to 5, where 1 means "very uncertain" and 5 means "very certain," how certain are you that your household would support the adoption of this required $0.50 monthly surcharge? (please circle one number)
very
uncertain very
certain
1 2 3 4 5 13. Remembering that all homes and businesses in the United States would have to pay the same
amount if this policy was adopted, what percent of all U.S. residents do you believe would support the adoption of this required $0.50 monthly surcharge? (please circle one number)
1 less than 10% of residents 2 10% to 19% of residents 3 20% to 29% of residents 4 30% to 39% of residents 5 40% to 49% of residents 6 50% to 59% of residents 7 60% to 69% of residents 8 70% to 79% of residents 9 80% to 89% of residents 10 90% to 100% of residents

86
Section 3: Your Attitudes about Environmental Issues 14. Please indicate how strongly you disagree or agree with each of the following statements.
(please circle one number for each statement)
strongly disagree
somewhat disagree
neutral somewhat agree
strongly agree
I am often one of the first people I know to try new products
1 2 3 4 5
There is not much that any one individual can do about the environment
1 2 3 4 5
I am more likely to buy environmentally friendly products if I know that other people are doing the same
1 2 3 4 5
I don’t trust the environmental claims of companies offering environmentally friendly products
1 2 3 4 5
I don’t trust other people to make personal sacrifices to protect the environment
1 2 3 4 5
Now that companies are offering environmentally friendly products, we don’t need as many environmental regulations
1 2 3 4 5
The government can’t be trusted to collect funds and spend them on worthwhile causes
1 2 3 4 5
The government should require everyone to help pay for environmental improvements
1 2 3 4 5
I will only pay more for environmentally friendly products if I receive a direct benefit from doing so
1 2 3 4 5
I think my family and friends would support renewable energy if they had the option
1 2 3 4 5

87
15. Which of the following actions do you and your household do on a regular basis? (please circle ALL that apply)
1 Try to buy products that are environmentally friendly 2 Pay more for products that are environmentally friendly 3 Recycle newspaper, metals, plastics, or glass 4 Purchase organic foods 5 Reduce energy use in the home 6 Walk, ride a bike, carpool, or take mass transit to help the environment 7 Donate money to environmental causes 8 Volunteer time to environmental causes 9 Invest money in companies that are socially responsible 10 Write letters to politicians about environmental issues 11 Weigh candidates’ environmental records when deciding who to vote for
16. How much do you think individuals like yourself can do about the following? (please circle one
number for each problem)
nothing
not much
some-thing
a lot
reducing litter in public places 1 2 3 4
decreasing the amount of solid waste in landfills 1 2 3 4
decreasing air pollution that produces smog 1 2 3 4
lessening the destruction of the ozone layer 1 2 3 4
increasing the amount of renewable energy used 1 2 3 4
reducing the threat of global warming 1 2 3 4
reducing the loss of wilderness areas 1 2 3 4

88
17. How much do you think government programs and regulations can do about the following? (please circle one number for each problem)
nothing not
much some-thing
a lot
reducing litter in public places 1 2 3 4
decreasing the amount of solid waste in landfills 1 2 3 4
decreasing air pollution that produces smog 1 2 3 4
lessening the destruction of the ozone layer 1 2 3 4
increasing the amount of renewable energy used 1 2 3 4
reducing the threat of global warming 1 2 3 4
reducing the loss of wilderness areas 1 2 3 4
Section 4: About You
These last few questions will help us understand how well you and other respondents to the survey represent all U.S. residents. All the information in this section (and the entire survey booklet) is confidential. Your name will never be associated with your answers to these questions. 18. How old are you? (please circle one number)
1 17 years or under 2 18 to 24 years 3 25 to 34 years 4 35 to 44 years 5 45 to 54 years 6 55 to 64 years 7 65 years and over
19. Are you male or female? (please circle one number)
1 Male 2 Female
20. Do you have children? (please circle one number)
1 Yes 2 No

89
21. What is the highest grade or year of school that you have completed? (please circle one
number)
1 No school 2 Grade school (1-8 years) 3 Some high school (9-11 years) 4 Completed high school (12 years) 5 Some college but no degree (13-15 years) 6 Associate degree 7 Bachelor’s degree 8 Post graduate
22. Regardless of your party identification, how would you rate yourself politically? (please circle one number)
1 Very conservative 2 Somewhat conservative 3 Neither conservative nor liberal 4 Somewhat liberal 5 Very liberal
23. Below is a list of household income categories. Which income category best describes the
combined year 2000 income of you and all adult family members living with you, before taxes? (please circle one number)
1 Less than $10,000 2 $10,000 - $19,999 3 $20,000 - $29,999 4 $30,000 - $39,999 5 $40,000 - $49,999 6 $50,000 - $59,999 7 $60,000 - $69,999 8 $70,000 - $79,999 9 $80,000 - $89,999 10 $90,000 - $99,999 11 $100,000 - $149,999 12 $150,000 or more
Thank you for your cooperation!
Your assistance in answering this survey is very much appreciated.

90
If we have overlooked something or if you have anything else to tell us, please feel free to do so in the space below.
Please return your completed survey in the postage-paid envelope provided to:
Choices for Electricity Supply Survey University of California at Berkeley
c/o PA Consulting Group 2711 Allen Boulevard, Suite 200
Middleton, WI 53562
If you have any questions about the survey, please contact: Kim Bakalars 1-800-935-4277
The results of this study will be available on the Internet by December 2001 at: www.are.berkeley.edu/CESS
91
SCENARIO 2: $3/MONTH BID LEVEL
Deciding Our Energy Future: Choices for Electricity Supply Survey
University of California at Berkeley

92
Section 1: Energy Issues Facing the United States
To begin, we would like to ask you some questions about yourself and about your feelings on the electricity industry and on renewable energy.
1. Do you own or rent your residence? (please circle one number)
1 Own 2 Rent, lease or other arrangement
2. Does your household pay its own electricity bill? (please circle one number)
1 No ? Please STOP HERE and return the survey. Thank you for your participation! 2 Yes ? Please GO TO QUESTION 3 and continue with this survey
3. Households in some states now have the option of choosing which company will provide their
electricity (much like choosing a new long-distance telephone provider). Does your household have the option of choosing your electric company? (please circle one number)
1 No 2 Yes 3 Don't know
4. In meeting the nation's overall electricity needs, please indicate how important each of the
following issues is to you. (please circle one number for each issue)
not at all important
extremely important
Ensuring that electricity service is reliable 1 2 3 4 5
Increasing the amount of electricity generated from renewable sources (such as wind and solar)
1 2 3 4 5
Minimizing the cost of electricity to consumers 1 2 3 4 5
Increasing investments in energy efficiency 1 2 3 4 5
Improving the quality of customer service 1 2 3 4 5
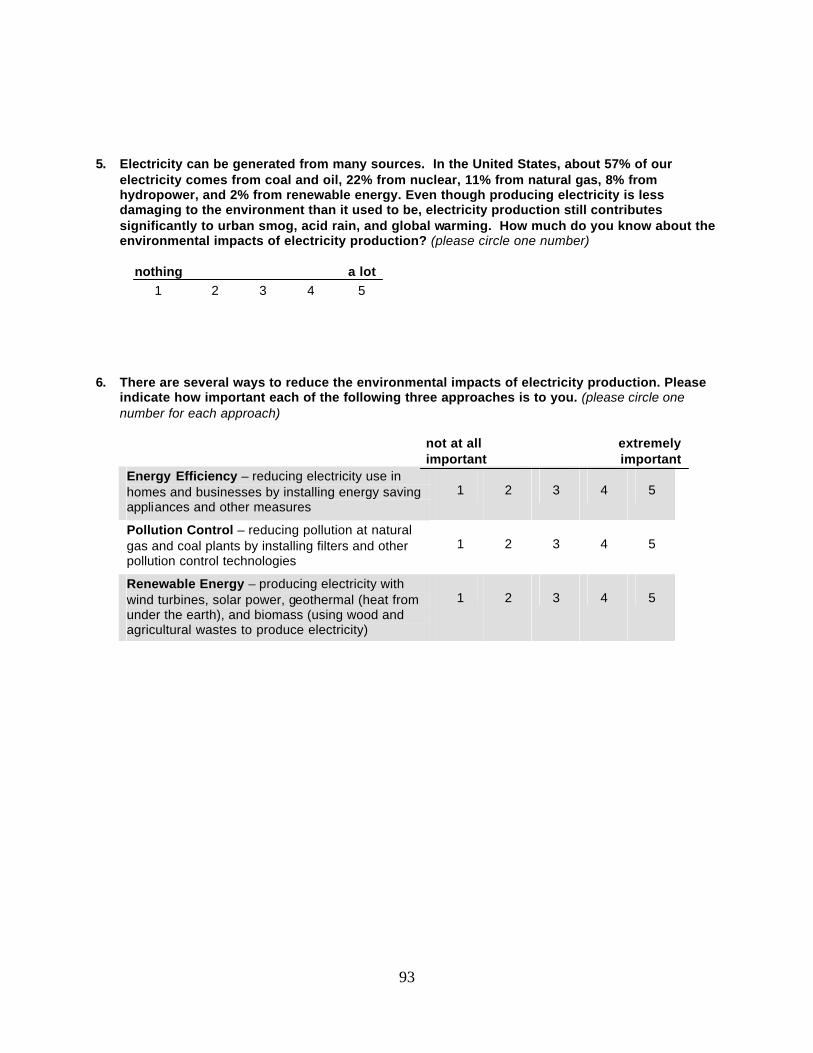
93
5. Electricity can be generated from many sources. In the United States, about 57% of our
electricity comes from coal and oil, 22% from nuclear, 11% from natural gas, 8% from hydropower, and 2% from renewable energy. Even though producing electricity is less damaging to the environment than it used to be, electricity production still contributes significantly to urban smog, acid rain, and global warming. How much do you know about the environmental impacts of electricity production? (please circle one number)
nothing a lot
1 2 3 4 5 6. There are several ways to reduce the environmental impacts of electricity production. Please
indicate how important each of the following three approaches is to you. (please circle one number for each approach)
not at all
important
extremely important
Energy Efficiency – reducing electricity use in homes and businesses by installing energy saving appliances and other measures
1 2 3 4 5
Pollution Control – reducing pollution at natural gas and coal plants by installing filters and other pollution control technologies
1 2 3 4 5
Renewable Energy – producing electricity with wind turbines, solar power, geothermal (heat from under the earth), and biomass (using wood and agricultural wastes to produce electricity)
1 2 3 4 5

94
7. About 2% of the electricity produced in the United States comes from renewable energy sources, including wind turbines, solar power, geothermal, and biomass. Even though renewable energy often costs more than other ways of producing electricity, renewable energy has some benefits. How important to you are each of the possible benefits listed below? (please circle one number for each statement)
How important is it to you that using renewable energy…
not at all important
extremely important
…may be less threatening to the environment than other ways of producing electricity
1 2 3 4 5
…reduces our dependence on any one type of electricity generation
1 2 3 4 5
…stimulates new technologies 1 2 3 4 5
…preserves the amount of natural gas and coal available for future generations
1 2 3 4 5
…can create new jobs 1 2 3 4 5 8. There are also some possible drawba cks to using renewable energy. How worried are you
about each of the possible drawbacks listed below? (please circle one number for each statement) How worried are you that renewable energy…
not at all worried
extremely worried
…could be more costly than other ways of reducing pollution
1 2 3 4 5
…may not be abundant enough for widespread use 1 2 3 4 5
…already receives too many subsidies 1 2 3 4 5
…could have some environmental drawbacks 1 2 3 4 5
…may not be available when we need it because the supply of some types of renewable energy can depend on the weather
1 2 3 4 5
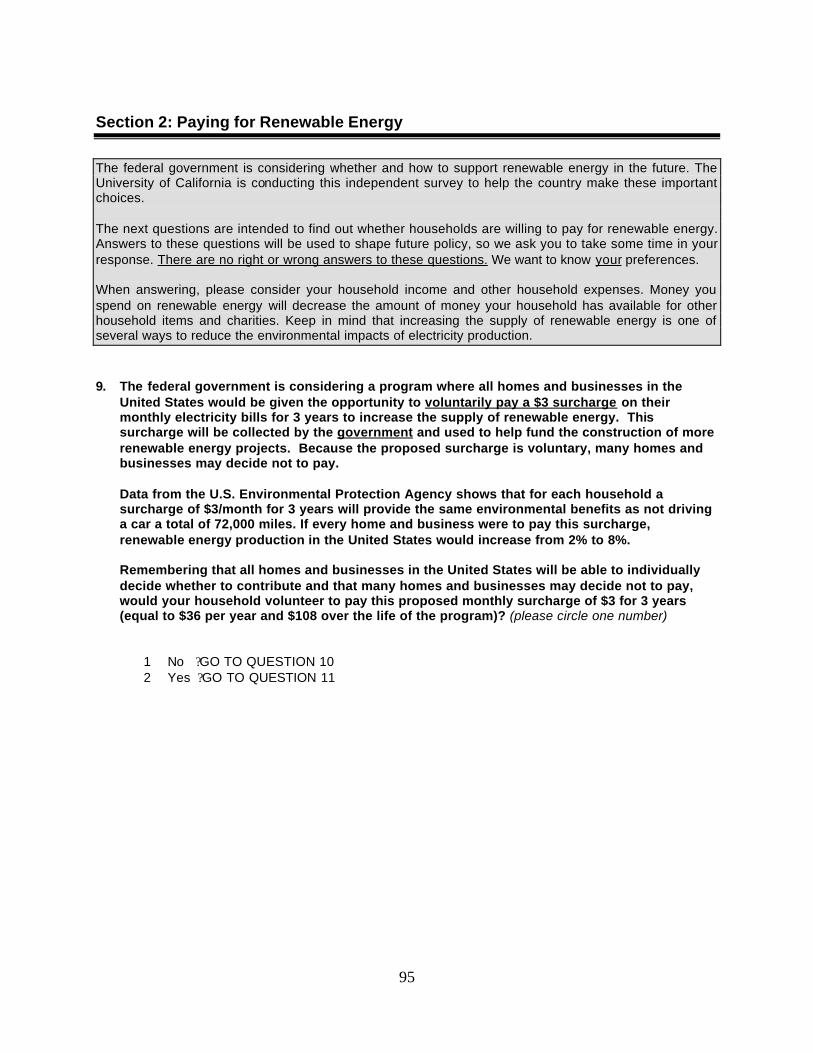
95
Section 2: Paying for Renewable Energy
The federal government is considering whether and how to support renewable energy in the future. The University of California is conducting this independent survey to help the country make these important choices. The next questions are intended to find out whether households are willing to pay for renewable energy. Answers to these questions will be used to shape future policy, so we ask you to take some time in your response. There are no right or wrong answers to these questions. We want to know your preferences. When answering, please consider your household income and other household expenses. Money you spend on renewable energy will decrease the amount of money your household has available for other household items and charities. Keep in mind that increasing the supply of renewable energy is one of several ways to reduce the environmental impacts of electricity production.
9. The federal government is considering a program where all homes and businesses in the United States would be given the opportunity to voluntarily pay a $3 surcharge on their monthly electricity bills for 3 years to increase the supply of renewable energy. This surcharge will be collected by the government and used to help fund the construction of more renewable energy projects. Because the proposed surcharge is voluntary, many homes and businesses may decide not to pay. Data from the U.S. Environmental Protection Agency shows that for each household a surcharge of $3/month for 3 years will provide the same environmental benefits as not driving a car a total of 72,000 miles. If every home and business were to pay this surcharge, renewable energy production in the United States would increase from 2% to 8%. Remembering that all homes and businesses in the United States will be able to individually decide whether to contribute and that many homes and businesses may decide not to pay, would your household volunteer to pay this proposed monthly surcharge of $3 for 3 years (equal to $36 per year and $108 over the life of the program)? (please circle one number)
1 No ? GO TO QUESTION 10 2 Yes ? GO TO QUESTION 11
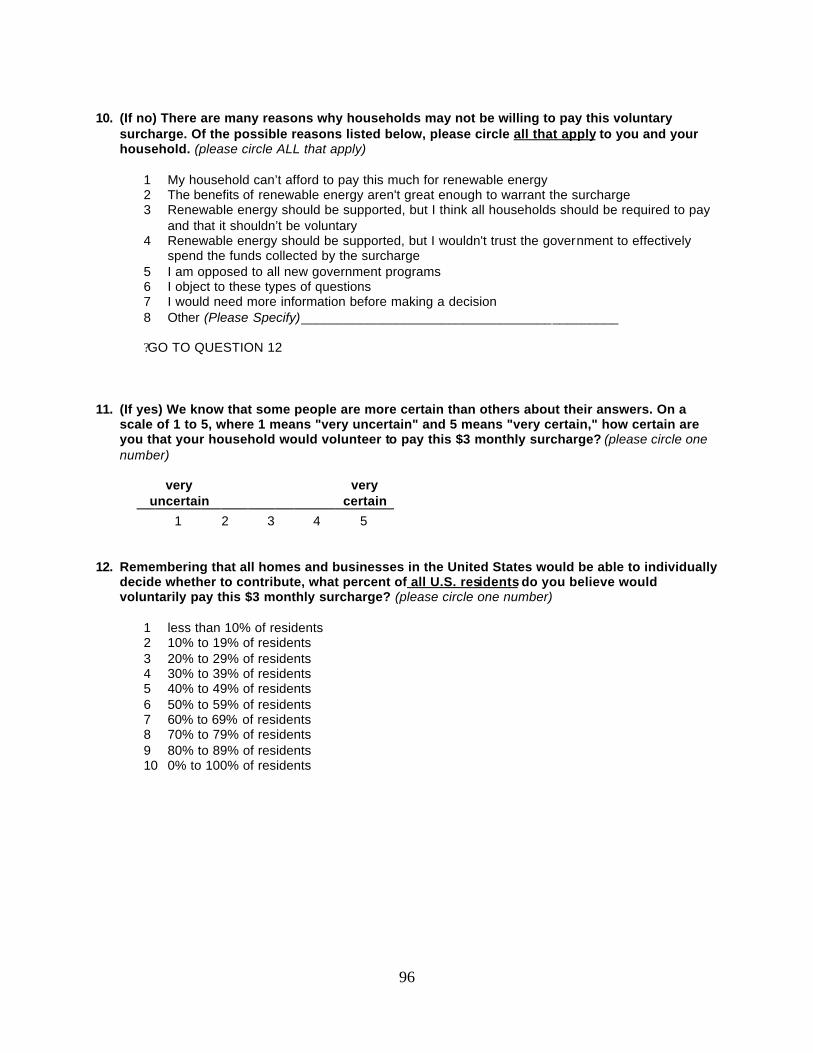
96
10. (If no) There are many reasons why households may not be willing to pay this voluntary
surcharge. Of the possible reasons listed below, please circle all that apply to you and your household. (please circle ALL that apply)
1 My household can’t afford to pay this much for renewable energy 2 The benefits of renewable energy aren't great enough to warrant the surcharge 3 Renewable energy should be supported, but I think all households should be required to pay
and that it shouldn’t be voluntary 4 Renewable energy should be supported, but I wouldn't trust the government to effectively
spend the funds collected by the surcharge 5 I am opposed to all new government programs 6 I object to these types of questions 7 I would need more information before making a decision 8 Other (Please Specify)___________________________________________ ? GO TO QUESTION 12
11. (If yes) We know that some people are more certain than others about their answers. On a
scale of 1 to 5, where 1 means "very uncertain" and 5 means "very certain," how certain are you that your household would volunteer to pay this $3 monthly surcharge? (please circle one number)
very
uncertain very
certain
1 2 3 4 5 12. Remembering that all homes and businesses in the United States would be able to individually
decide whether to contribute, what percent of all U.S. residents do you believe would voluntarily pay this $3 monthly surcharge? (please circle one number)
1 less than 10% of residents 2 10% to 19% of residents 3 20% to 29% of residents 4 30% to 39% of residents 5 40% to 49% of residents 6 50% to 59% of residents 7 60% to 69% of residents 8 70% to 79% of residents 9 80% to 89% of residents 10 0% to 100% of residents
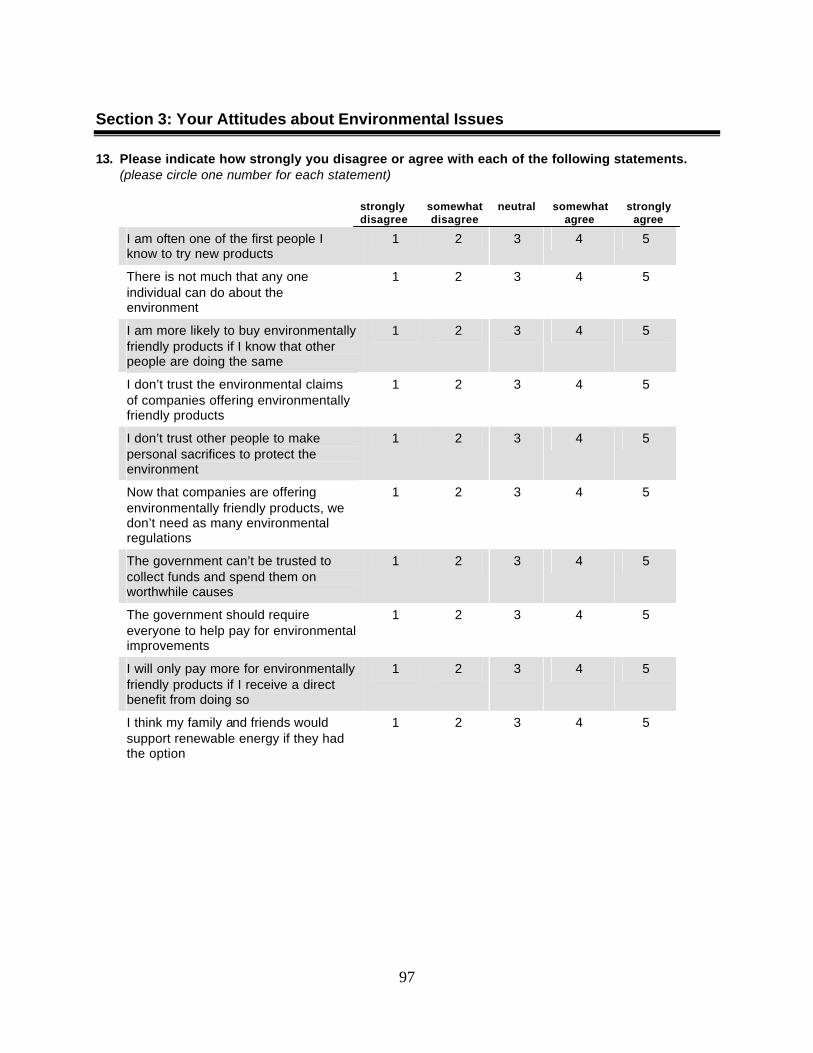
97
Section 3: Your Attitudes about Environmental Issues 13. Please indicate how strongly you disagree or agree with each of the following statements.
(please circle one number for each statement)
strongly disagree
somewhat disagree
neutral somewhat agree
strongly agree
I am often one of the first people I know to try new products
1 2 3 4 5
There is not much that any one individual can do about the environment
1 2 3 4 5
I am more likely to buy environmentally friendly products if I know that other people are doing the same
1 2 3 4 5
I don’t trust the environmental claims of companies offering environmentally friendly products
1 2 3 4 5
I don’t trust other people to make personal sacrifices to protect the environment
1 2 3 4 5
Now that companies are offering environmentally friendly products, we don’t need as many environmental regulations
1 2 3 4 5
The government can’t be trusted to collect funds and spend them on worthwhile causes
1 2 3 4 5
The government should require everyone to help pay for environmental improvements
1 2 3 4 5
I will only pay more for environmentally friendly products if I receive a direct benefit from doing so
1 2 3 4 5
I think my family and friends would support renewable energy if they had the option
1 2 3 4 5

98
14. Which of the following actions do you and your household do on a regular basis? (please circle ALL that apply)
1 Try to buy products that are environmentally friendly 2 Pay more for products that are environmentally friendly 3 Recycle newspaper, metals, plastics, or glass 4 Purchase organic foods 5 Reduce energy use in the home 6 Walk, ride a bike, carpool, or take mass transit to help the environment 7 Donate money to environmental causes 8 Volunteer time to environmental causes 9 Invest money in companies that are socially responsible 10 Write letters to politicians about environmental issues 11 Weigh candidates’ environmental records when deciding who to vote for
15. How much do you think individuals like yourself can do about the following? (please circle one
number for each problem)
nothing
not much
some-thing
a lot
reducing litter in public places 1 2 3 4
decreasing the amount of solid waste in landfills 1 2 3 4
decreasing air pollution that produces smog 1 2 3 4
lessening the destruction of the ozone layer 1 2 3 4
increasing the amount of renewable energy used 1 2 3 4
reducing the threat of global warming 1 2 3 4
reducing the loss of wilderness areas 1 2 3 4
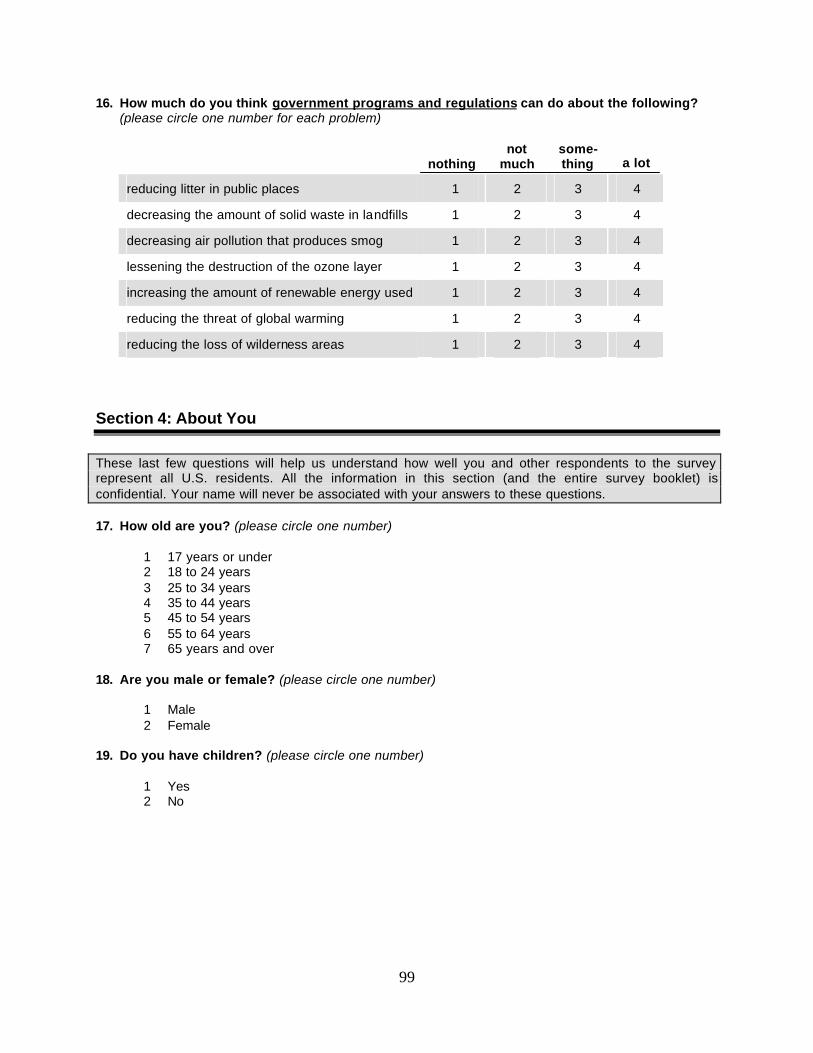
99
16. How much do you think government programs and regulations can do about the following? (please circle one number for each problem)
nothing not
much some-thing
a lot
reducing litter in public places 1 2 3 4
decreasing the amount of solid waste in landfills 1 2 3 4
decreasing air pollution that produces smog 1 2 3 4
lessening the destruction of the ozone layer 1 2 3 4
increasing the amount of renewable energy used 1 2 3 4
reducing the threat of global warming 1 2 3 4
reducing the loss of wilderness areas 1 2 3 4
Section 4: About You
These last few questions will help us understand how well you and other respondents to the survey represent all U.S. residents. All the information in this section (and the entire survey booklet) is confidential. Your name will never be associated with your answers to these questions. 17. How old are you? (please circle one number)
1 17 years or under 2 18 to 24 years 3 25 to 34 years 4 35 to 44 years 5 45 to 54 years 6 55 to 64 years 7 65 years and over
18. Are you male or female? (please circle one number)
1 Male 2 Female
19. Do you have children? (please circle one number)
1 Yes 2 No

100
20. What is the highest grade or year of school that you have completed? (please circle one
number)
1 No school 2 Grade school (1-8 years) 3 Some high school (9-11 years) 4 Completed high school (12 years) 5 Some college but no degree (13-15 years) 6 Associate degree 7 Bachelor’s degree 8 Post graduate
21. Regardless of your party identification, how would you rate yourself politically? (please circle one number)
1 Very conservative 2 Somewhat conservative 3 Neither conservative nor liberal 4 Somewhat liberal 5 Very liberal
22. Below is a list of household income categories. Which income category best describes the
combined year 2000 income of you and all adult family members living with you, before taxes? (please circle one number)
1 Less than $10,000 2 $10,000 - $19,999 3 $20,000 - $29,999 4 $30,000 - $39,999 5 $40,000 - $49,999 6 $50,000 - $59,999 7 $60,000 - $69,999 8 $70,000 - $79,999 9 $80,000 - $89,999 10 $90,000 - $99,999 11 $100,000 - $149,999 12 $150,000 or more
Thank you for your cooperation!
Your assistance in answering this survey is very much appreciated.

101
If we have overlooked something or if you have anything else to tell us, please feel free to do so in the space below.
Please return your completed survey in the postage-paid envelope provided to:
Choices for Electricity Supply Survey University of California at Berkeley
c/o PA Consulting Group 2711 Allen Boulevard, Suite 200
Middleton, WI 53562
If you have any questions about the survey, please contact: Kim Bakalars 1-800-935-4277
The results of this study will be available on the Internet by December 2001 at: www.are.berkeley.edu/CESS

102
SCENARIO 3: $8/MONTH BID LEVEL
Deciding Our Energy Future: Choices for Electricity Supply Survey
University of California at Berkeley
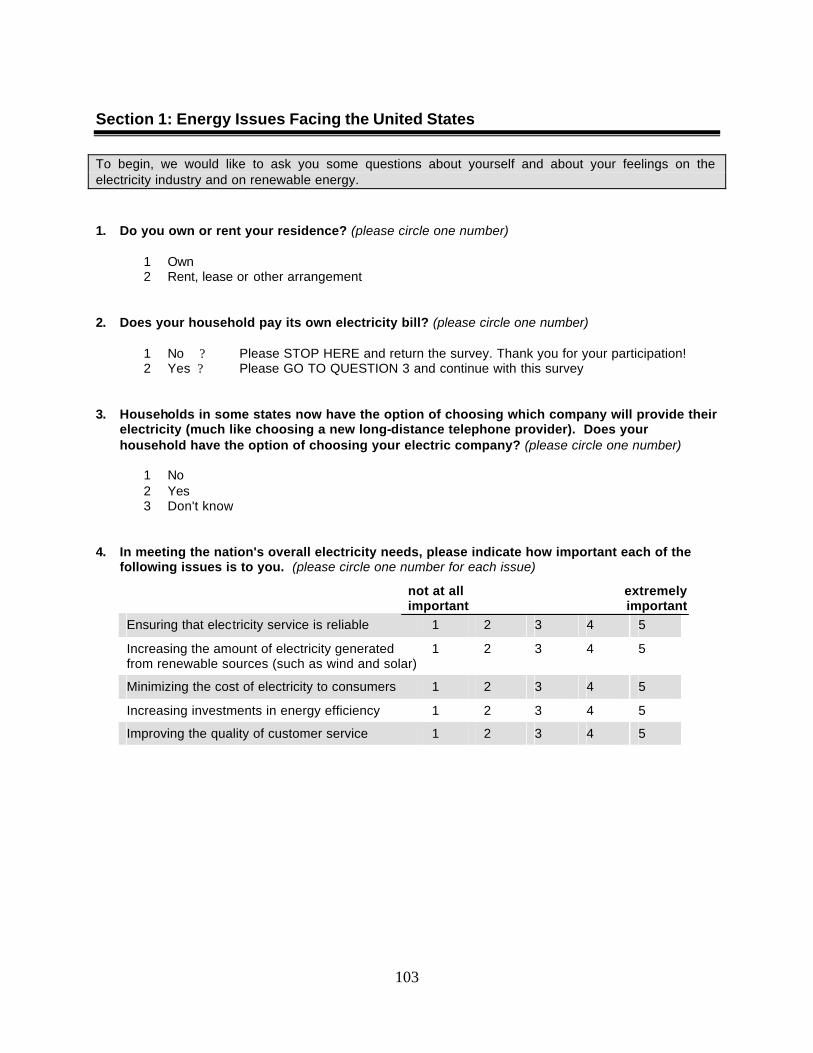
103
Section 1: Energy Issues Facing the United States
To begin, we would like to ask you some questions about yourself and about your feelings on the electricity industry and on renewable energy.
1. Do you own or rent your residence? (please circle one number)
1 Own 2 Rent, lease or other arrangement
2. Does your household pay its own electricity bill? (please circle one number)
1 No ? Please STOP HERE and return the survey. Thank you for your participation! 2 Yes ? Please GO TO QUESTION 3 and continue with this survey
3. Households in some states now have the option of choosing which company will provide their
electricity (much like choosing a new long-distance telephone provider). Does your household have the option of choosing your electric company? (please circle one number)
1 No 2 Yes 3 Don't know
4. In meeting the nation's overall electricity needs, please indicate how important each of the
following issues is to you. (please circle one number for each issue)
not at all important
extremely important
Ensuring that electricity service is reliable 1 2 3 4 5
Increasing the amount of electricity generated from renewable sources (such as wind and solar)
1 2 3 4 5
Minimizing the cost of electricity to consumers 1 2 3 4 5
Increasing investments in energy efficiency 1 2 3 4 5
Improving the quality of customer service 1 2 3 4 5

104
5. Electricity can be generated from many sources. In the United States, about 57% of our
electricity comes from coal and oil, 22% from nuclear, 11% from natural gas, 8% from hydropower, and 2% from renewable energy. Even though producing electricity is less damaging to the environment than it used to be, electricity production still contributes significantly to urban smog, acid rain, and global warming. How much do you know about the environmental impacts of electricity production? (please circle one number)
nothing a lot
1 2 3 4 5 6. There are several ways to reduce the environmental impacts of electricity production. Please
indicate how important each of the following three approaches is to you. (please circle one number for each approach)
not at all
important
extremely important
Energy Efficiency – reducing electricity use in homes and businesses by installing energy saving appliances and other measures
1 2 3 4 5
Pollution Control – reducing pollution at natural gas and coal plants by installing filters and other pollution control technologies
1 2 3 4 5
Renewable Energy – producing electricity with wind turbines, solar power, geothermal (heat from under the earth), and biomass (using wood and agricultural wastes to produce electricity)
1 2 3 4 5

105
7. About 2% of the electricity produced in the United States comes from renewable energy sources, including wind turbines, solar power, geothermal, and biomass. Even though renewable energy often costs more than other ways of producing electricity, renewable energy has some benefits. How important to you are each of the possible benefits listed below? (please circle one number for each statement)
How important is it to you that using renewable energy…
not at all important
extremely important
…may be less threatening to the environment than other ways of producing electricity
1 2 3 4 5
…reduces our dependence on any one type of electricity generation
1 2 3 4 5
…stimulates new technologies 1 2 3 4 5
…preserves the amount of natural gas and coal available for future generations
1 2 3 4 5
…can create new jobs 1 2 3 4 5 8. There are also some possible drawbacks to using renewable energy. How worried are you
about each of the possible drawbacks listed below? (please circle one number for each statement) How worried are you that renewable energy…
not at all worried
extremely worried
…could be more costly than other ways of reducing pollution
1 2 3 4 5
…may not be abundant enough for widespread use 1 2 3 4 5
…already receives too many subsidies 1 2 3 4 5
…could have some environmental drawbacks 1 2 3 4 5
…may not be available when we need it because the supply of some types of renewable energy can depend on the weather
1 2 3 4 5
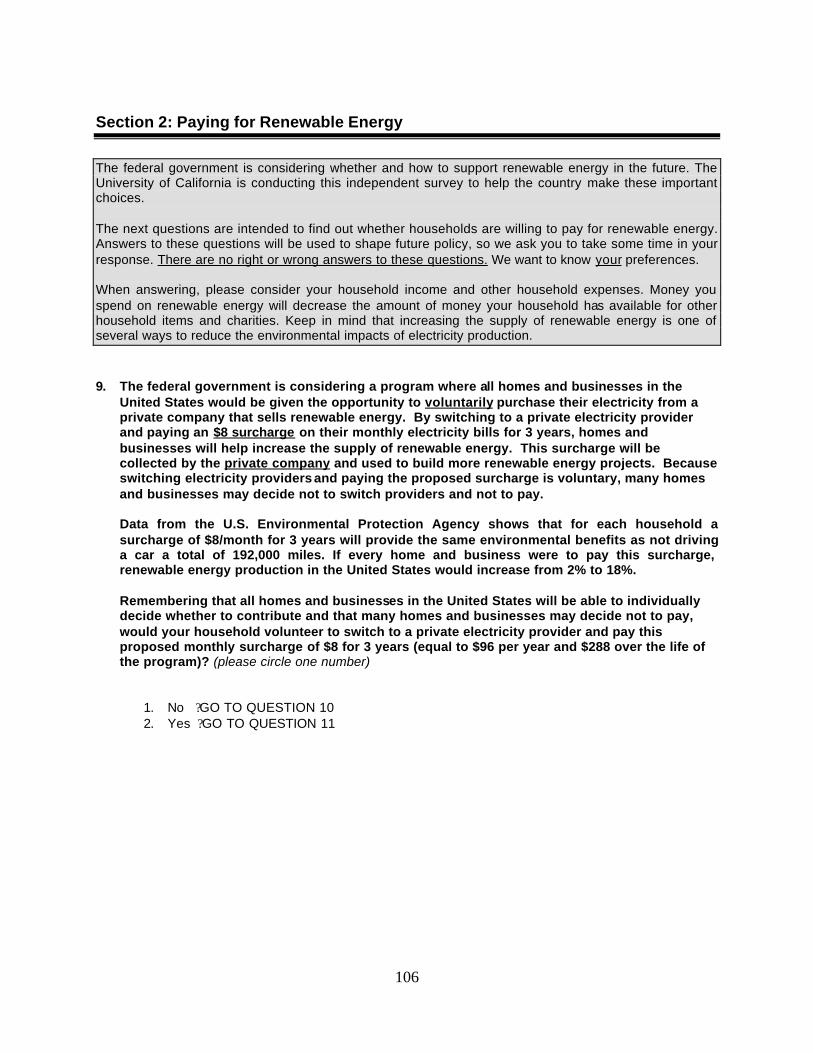
106
Section 2: Paying for Renewable Energy
The federal government is considering whether and how to support renewable energy in the future. The University of California is conducting this independent survey to help the country make these important choices. The next questions are intended to find out whether households are willing to pay for renewable energy. Answers to these questions will be used to shape future policy, so we ask you to take some time in your response. There are no right or wrong answers to these questions. We want to know your preferences. When answering, please consider your household income and other household expenses. Money you spend on renewable energy will decrease the amount of money your household has available for other household items and charities. Keep in mind that increasing the supply of renewable energy is one of several ways to reduce the environmental impacts of electricity production.
9. The federal government is considering a program where all homes and businesses in the United States would be given the opportunity to voluntarily purchase their electricity from a private company that sells renewable energy. By switching to a private electricity provider and paying an $8 surcharge on their monthly electricity bills for 3 years, homes and businesses will help increase the supply of renewable energy. This surcharge will be collected by the private company and used to build more renewable energy projects. Because switching electricity providers and paying the proposed surcharge is voluntary, many homes and businesses may decide not to switch providers and not to pay. Data from the U.S. Environmental Protection Agency shows that for each household a surcharge of $8/month for 3 years will provide the same environmental benefits as not driving a car a total of 192,000 miles. If every home and business were to pay this surcharge, renewable energy production in the United States would increase from 2% to 18%. Remembering that all homes and businesses in the United States will be able to individually decide whether to contribute and that many homes and businesses may decide not to pay, would your household volunteer to switch to a private electricity provider and pay this proposed monthly surcharge of $8 for 3 years (equal to $96 per year and $288 over the life of the program)? (please circle one number)
1. No ? GO TO QUESTION 10 2. Yes ? GO TO QUESTION 11
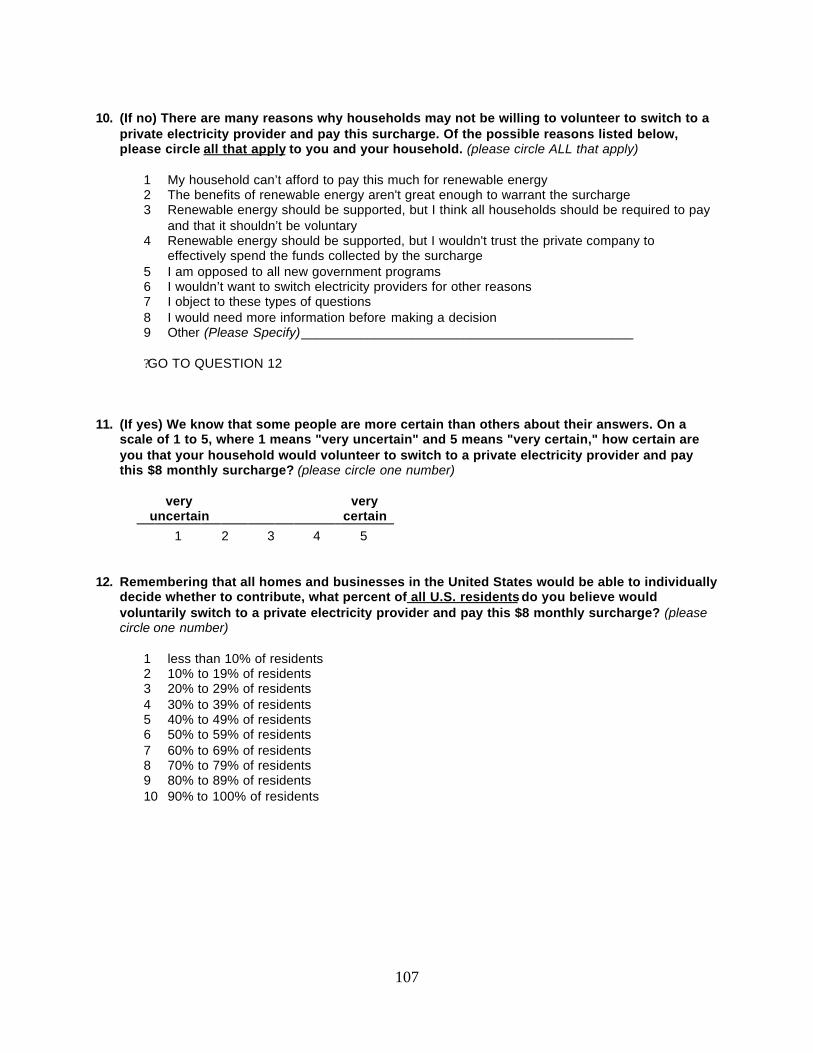
107
10. (If no) There are many reasons why households may not be willing to volunteer to switch to a
private electricity provider and pay this surcharge. Of the possible reasons listed below, please circle all that apply to you and your household. (please circle ALL that apply)
1 My household can’t afford to pay this much for renewable energy 2 The benefits of renewable energy aren't great enough to warrant the surcharge 3 Renewable energy should be supported, but I think all households should be required to pay
and that it shouldn’t be voluntary 4 Renewable energy should be supported, but I wouldn't trust the private company to
effectively spend the funds collected by the surcharge 5 I am opposed to all new government programs 6 I wouldn’t want to switch electricity providers for other reasons 7 I object to these types of questions 8 I would need more information before making a decision 9 Other (Please Specify)_____________________________________________ ? GO TO QUESTION 12
11. (If yes) We know that some people are more certain than others about their answers. On a
scale of 1 to 5, where 1 means "very uncertain" and 5 means "very certain," how certain are you that your household would volunteer to switch to a private electricity provider and pay this $8 monthly surcharge? (please circle one number)
very
uncertain very
certain
1 2 3 4 5 12. Remembering that all homes and businesses in the United States would be able to individually
decide whether to contribute, what percent of all U.S. residents do you believe would voluntarily switch to a private electricity provider and pay this $8 monthly surcharge? (please circle one number)
1 less than 10% of residents 2 10% to 19% of residents 3 20% to 29% of residents 4 30% to 39% of residents 5 40% to 49% of residents 6 50% to 59% of residents 7 60% to 69% of residents 8 70% to 79% of residents 9 80% to 89% of residents 10 90% to 100% of residents

108
Section 3: Your Attitudes about Environmental Issues 13. Please indicate how strongly you disagree or agree with each of the following statements.
(please circle one number for each statement)
strongly disagree
somewhat disagree
neutral somewhat agree
strongly agree
I am often one of the first people I know to try new products
1 2 3 4 5
There is not much that any one individual can do about the environment
1 2 3 4 5
I am more likely to buy environmentally friendly products if I know that other people are doing the same
1 2 3 4 5
I don’t trust the environmental claims of companies offering environmentally friendly products
1 2 3 4 5
I don’t trust other people to make personal sacrifices to protect the environment
1 2 3 4 5
Now that companies are offering environmentally friendly products, we don’t need as many environmental regulations
1 2 3 4 5
The government can’t be trusted to collect funds and spend them on worthwhile causes
1 2 3 4 5
The government should require everyone to help pay for environmental improvements
1 2 3 4 5
I will only pay more for environmentally friendly products if I receive a direct benefit from doing so
1 2 3 4 5
I think my family and friends would support renewable energy if they had the option
1 2 3 4 5

109
14. Which of the following actions do you and your household do on a regular basis? (please circle ALL that apply)
1 Try to buy products that are environmentally friendly 2 Pay more for products that are environmentally friendly 3 Recycle newspaper, metals, plastics, or glass 4 Purchase organic foods 5 Reduce energy use in the home 6 Walk, ride a bike, carpool, or take mass transit to help the environment 7 Donate money to environmental causes 8 Volunteer time to environmental causes 9 Invest money in companies that are socially responsible 10 Write letters to politicians about environmental issues 11 Weigh candidates’ environmental records when deciding who to vote for
15. How much do you think individuals like yourself can do about the following? (please circle one
number for each problem)
nothing
not much
some-thing
a lot
reducing litter in public places 1 2 3 4
decreasing the amount of solid waste in landfills 1 2 3 4
decreasing air pollution that produces smog 1 2 3 4
lessening the destruction of the ozone layer 1 2 3 4
increasing the amount of renewable energy used 1 2 3 4
reducing the threat of global warming 1 2 3 4
reducing the loss of wilderness areas 1 2 3 4

110
16. How much do you think government programs and regulations can do about the following? (please circle one number for each problem)
nothing not
much some-thing
a lot
reducing litter in public places 1 2 3 4
decreasing the amount of solid waste in landfills 1 2 3 4
decreasing air pollution that produces smog 1 2 3 4
lessening the destruction of the ozone layer 1 2 3 4
increasing the amount of renewable energy used 1 2 3 4
reducing the threat of global warming 1 2 3 4
reducing the loss of wilderness areas 1 2 3 4
Section 4: About You
These last few questions will help us understand how well you and other respondents to the survey represent all U.S. residents. All the information in this section (and the entire survey booklet) is confidential. Your name will never be associated with your answers to these questions. 17. How old are you? (please circle one number)
1 17 years or under 2 18 to 24 years 3 25 to 34 years 4 35 to 44 years 5 45 to 54 years 6 55 to 64 years 7 65 years and over
18. Are you male or female? (please circle one number)
1 Male 2 Female
19. Do you have children? (please circle one number)
1 Yes 2 No
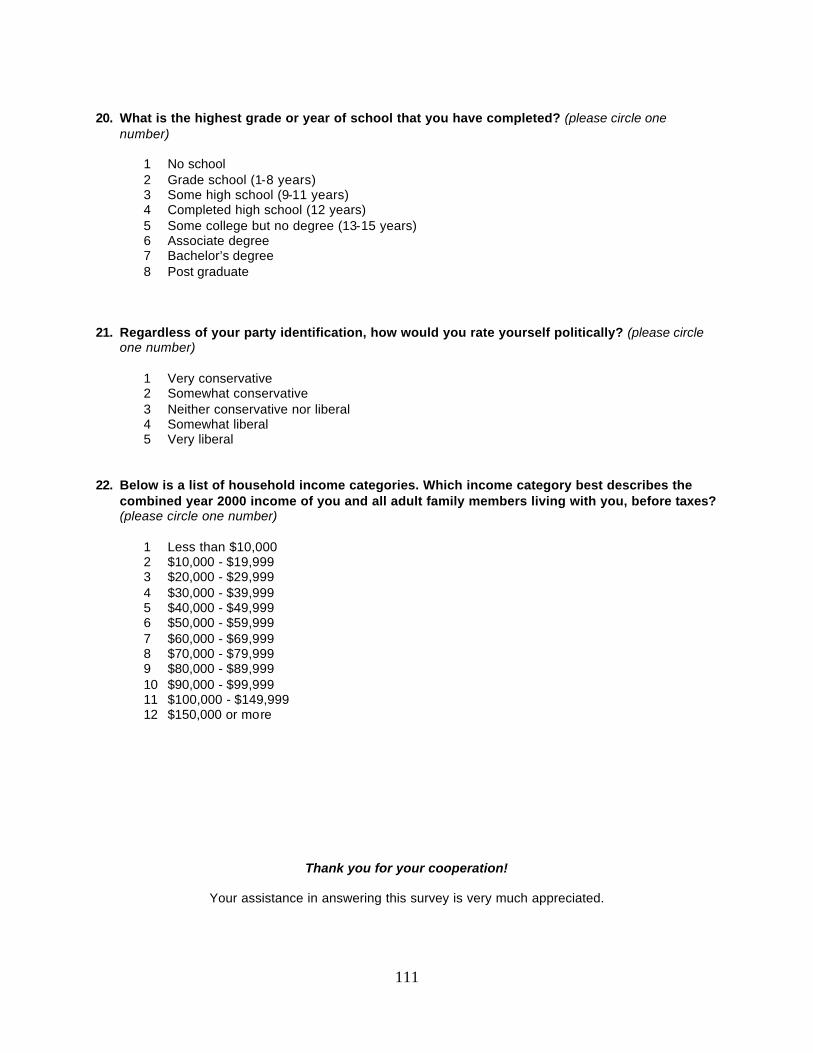
111
20. What is the highest grade or year of school that you have completed? (please circle one
number)
1 No school 2 Grade school (1-8 years) 3 Some high school (9-11 years) 4 Completed high school (12 years) 5 Some college but no degree (13-15 years) 6 Associate degree 7 Bachelor’s degree 8 Post graduate
21. Regardless of your party identification, how would you rate yourself politically? (please circle one number)
1 Very conservative 2 Somewhat conservative 3 Neither conservative nor liberal 4 Somewhat liberal 5 Very liberal
22. Below is a list of household income categories. Which income category best describes the
combined year 2000 income of you and all adult family members living with you, before taxes? (please circle one number)
1 Less than $10,000 2 $10,000 - $19,999 3 $20,000 - $29,999 4 $30,000 - $39,999 5 $40,000 - $49,999 6 $50,000 - $59,999 7 $60,000 - $69,999 8 $70,000 - $79,999 9 $80,000 - $89,999 10 $90,000 - $99,999 11 $100,000 - $149,999 12 $150,000 or more
Thank you for your cooperation!
Your assistance in answering this survey is very much appreciated.

112
If we have overlooked something or if you have anything else to tell us, please feel free to do so in the space below.
Please return your completed survey in the postage-paid envelope provided to:
Choices for Electricity Supply Survey University of California at Berkeley
c/o PA Consulting Group 2711 Allen Boulevard, Suite 200
Middleton, WI 53562
If you have any questions about the survey, please contact: Kim Bakalars 1-800-935-4277
The results of this study will be available on the Internet by December 2001 at: www.are.berkeley.edu/CESS

113
SCENARIO 4: 50 CENTS/MONTH BID LEVEL
Deciding Our Energy Future: Choices for Electricity Supply Survey
University of California at Berkeley

114
Section 1: Energy Issues Facing the United States
To begin, we would like to ask you some questions about yourself and about your feelings on the electricity industry and on renewable energy.
1. Do you own or rent your residence? (please circle one number)
1 Own 2 Rent, lease or other arrangement
2. Does your household pay its own electricity bill? (please circle one number)
1 No ? Please STOP HERE and return the survey. Thank you for your participation! 2 Yes ? Please GO TO QUESTION 3 and continue with this survey
3. Households in some states now have the option of choosing which company will provide their
electricity (much like choosing a new long-distance telephone provider). Does your household have the option of choosing your electric company? (please circle one number)
1 No 2 Yes 3 Don't know
4. In meeting the nation's overall electricity needs, please indicate how important each of the
following issues is to you. (please circle one number for each issue)
not at all important
extremely important
Ensuring that electricity service is reliable 1 2 3 4 5
Increasing the amount of electricity generated from renewable sources (such as wind and solar)
1 2 3 4 5
Minimizing the cost of electricity to consumers 1 2 3 4 5
Increasing investments in energy efficiency 1 2 3 4 5
Improving the quality of customer service 1 2 3 4 5

115
5. Electricity can be generated from many sources. In the United States, about 57% of our
electricity comes from coal and oil, 22% from nuclear, 11% from natural gas, 8% from hydropower, and 2% from renewable energy. Even though producing electricity is less damaging to the environment than it used to be, electricity production still contributes significantly to urban smog, acid rain, and global warming. How much do you know about the environmental impacts of electricity production? (please circle one number)
nothing a lot
1 2 3 4 5 6. There are several ways to reduce the environmental impacts of electricity production. Please
indicate how important each of the following three approaches is to you. (please circle one number for each approach)
not at all
important
extremely important
Energy Efficiency – reducing electricity use in homes and businesses by installing energy saving appliances and other measures
1 2 3 4 5
Pollution Control – reducing pollution at natural gas and coal plants by installing filters and other pollution control technologies
1 2 3 4 5
Renewable Energy – producing electricity with wind turbines, solar power, geothermal (heat from under the earth), and biomass (using wood and agricultural wastes to produce electricity)
1 2 3 4 5
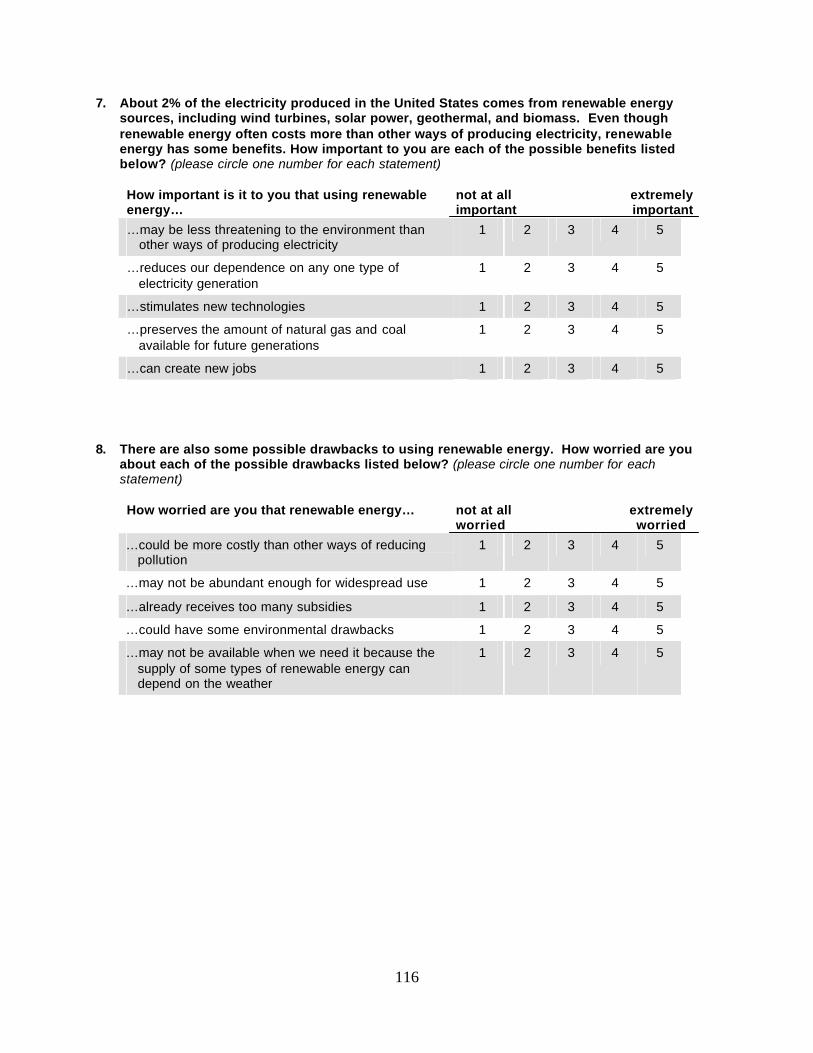
116
7. About 2% of the electricity produced in the United States comes from renewable energy sources, including wind turbines, solar power, geothermal, and biomass. Even though renewable energy often costs more than other ways of producing electricity, renewable energy has some benefits. How important to you are each of the possible benefits listed below? (please circle one number for each statement)
How important is it to you that using renewable energy…
not at all important
extremely important
…may be less threatening to the environment than other ways of producing electricity
1 2 3 4 5
…reduces our dependence on any one type of electricity generation
1 2 3 4 5
…stimulates new technologies 1 2 3 4 5
…preserves the amount of natural gas and coal available for future generations
1 2 3 4 5
…can create new jobs 1 2 3 4 5 8. There are also some possible drawbacks to using renewable energy. How worried are you
about each of the possible drawbacks listed below? (please circle one number for each statement) How worried are you that renewable energy…
not at all worried
extremely worried
…could be more costly than other ways of reducing pollution
1 2 3 4 5
…may not be abundant enough for widespread use 1 2 3 4 5
…already receives too many subsidies 1 2 3 4 5
…could have some environmental drawbacks 1 2 3 4 5
…may not be available when we need it because the supply of some types of renewable energy can depend on the weather
1 2 3 4 5
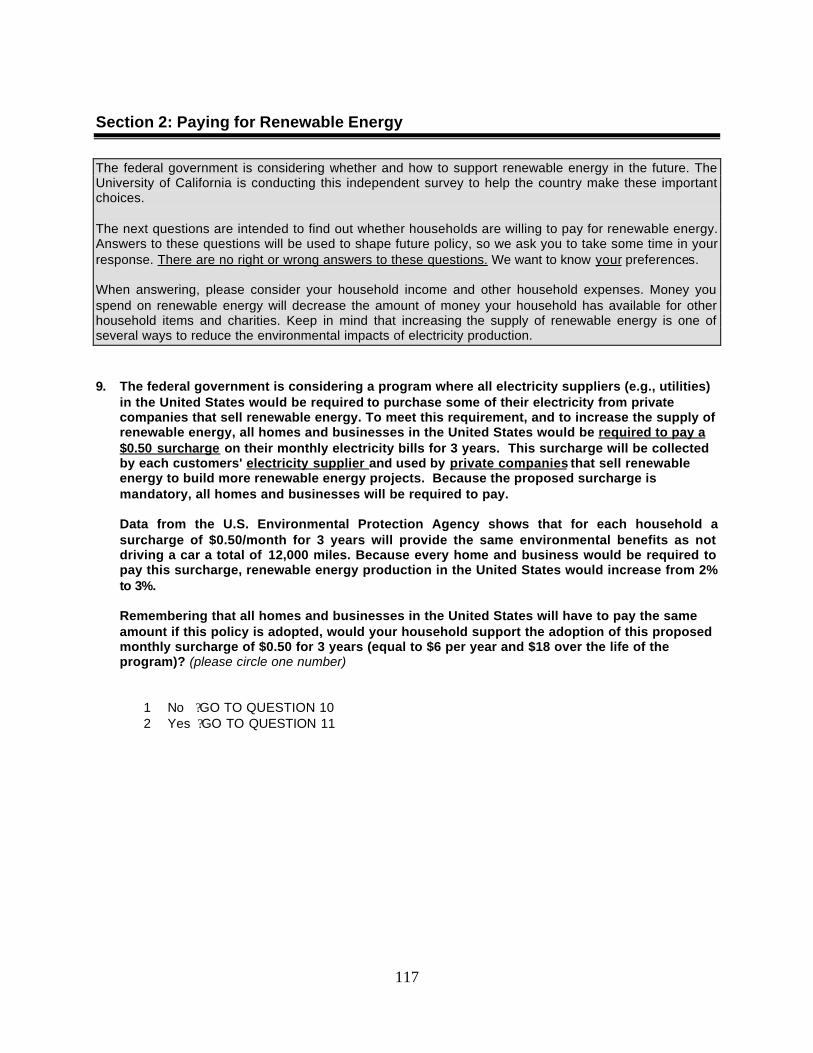
117
Section 2: Paying for Renewable Energy
The federal government is considering whether and how to support renewable energy in the future. The University of California is conducting this independent survey to help the country make these important choices. The next questions are intended to find out whether households are willing to pay for renewable energy. Answers to these questions will be used to shape future policy, so we ask you to take some time in your response. There are no right or wrong answers to these questions. We want to know your preferences. When answering, please consider your household income and other household expenses. Money you spend on renewable energy will decrease the amount of money your household has available for other household items and charities. Keep in mind that increasing the supply of renewable energy is one of several ways to reduce the environmental impacts of electricity production.
9. The federal government is considering a program where all electricity suppliers (e.g., utilities) in the United States would be required to purchase some of their electricity from private companies that sell renewable energy. To meet this requirement, and to increase the supply of renewable energy, all homes and businesses in the United States would be required to pay a $0.50 surcharge on their monthly electricity bills for 3 years. This surcharge will be collected by each customers' electricity supplier and used by private companies that sell renewable energy to build more renewable energy projects. Because the proposed surcharge is mandatory, all homes and businesses will be required to pay. Data from the U.S. Environmental Protection Agency shows that for each household a surcharge of $0.50/month for 3 years will provide the same environmental benefits as not driving a car a total of 12,000 miles. Because every home and business would be required to pay this surcharge, renewable energy production in the United States would increase from 2% to 3%. Remembering that all homes and businesses in the United States will have to pay the same amount if this policy is adopted, would your household support the adoption of this proposed monthly surcharge of $0.50 for 3 years (equal to $6 per year and $18 over the life of the program)? (please circle one number)
1 No ? GO TO QUESTION 10 2 Yes ? GO TO QUESTION 11
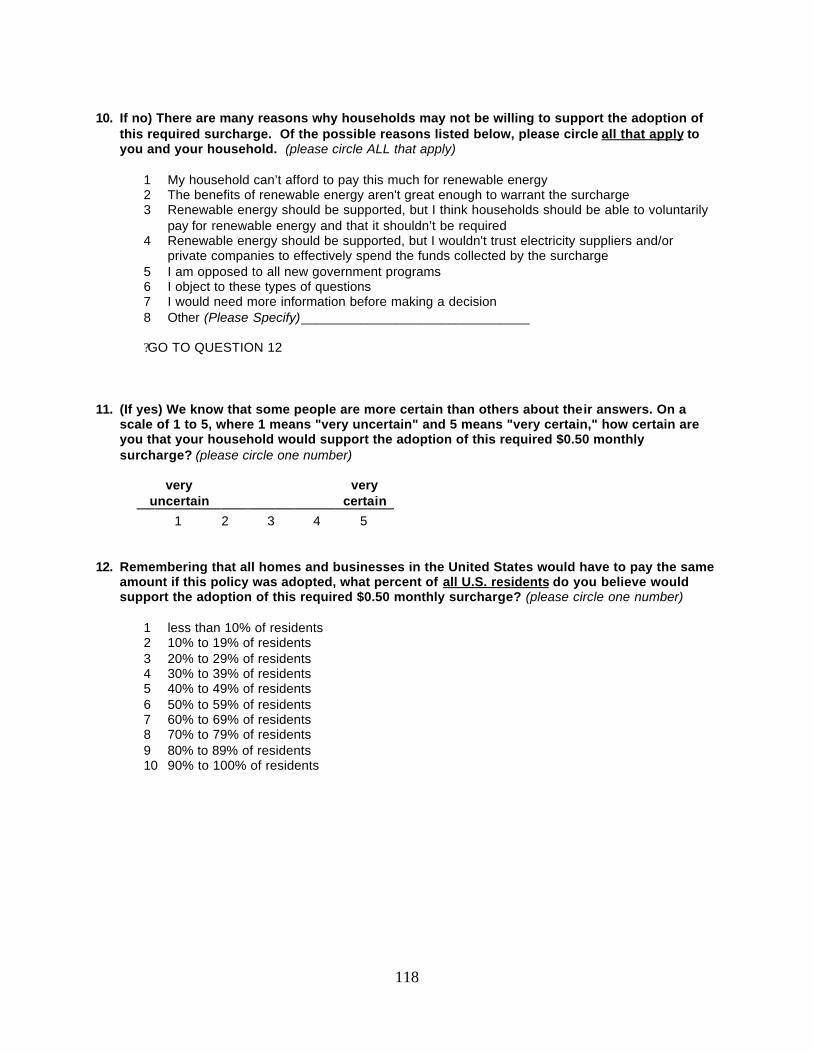
118
10. If no) There are many reasons why households may not be willing to support the adoption of
this required surcharge. Of the possible reasons listed below, please circle all that apply to you and your household. (please circle ALL that apply)
1 My household can’t afford to pay this much for renewable energy 2 The benefits of renewable energy aren't great enough to warrant the surcharge 3 Renewable energy should be supported, but I think households should be able to voluntarily
pay for renewable energy and that it shouldn’t be required 4 Renewable energy should be supported, but I wouldn't trust electricity suppliers and/or
private companies to effectively spend the funds collected by the surcharge 5 I am opposed to all new government programs 6 I object to these types of questions 7 I would need more information before making a decision 8 Other (Please Specify)_______________________________ ? GO TO QUESTION 12
11. (If yes) We know that some people are more certain than others about their answers. On a
scale of 1 to 5, where 1 means "very uncertain" and 5 means "very certain," how certain are you that your household would support the adoption of this required $0.50 monthly surcharge? (please circle one number)
very
uncertain very
certain
1 2 3 4 5 12. Remembering that all homes and businesses in the United States would have to pay the same
amount if this policy was adopted, what percent of all U.S. residents do you believe would support the adoption of this required $0.50 monthly surcharge? (please circle one number)
1 less than 10% of residents 2 10% to 19% of residents 3 20% to 29% of residents 4 30% to 39% of residents 5 40% to 49% of residents 6 50% to 59% of residents 7 60% to 69% of residents 8 70% to 79% of residents 9 80% to 89% of residents 10 90% to 100% of residents

119
Section 3: Your Attitudes about Environmental Issues 13. Please indicate how strongly you disagree or agree with each of the following statements.
(please circle one number for each statement)
strongly disagree
somewhat disagree
neutral somewhat agree
strongly agree
I am often one of the first people I know to try new products
1 2 3 4 5
There is not much that any one individual can do about the environment
1 2 3 4 5
I am more likely to buy environmentally friendly products if I know that other people are doing the same
1 2 3 4 5
I don’t trust the environmental claims of companies offering environmentally friendly products
1 2 3 4 5
I don’t trust other people to make personal sacrifices to protect the envi ronment
1 2 3 4 5
Now that companies are offering environmentally friendly products, we don’t need as many environmental regulations
1 2 3 4 5
The government can’t be trusted to collect funds and spend them on worthwhile causes
1 2 3 4 5
The government should require everyone to help pay for environmental improvements
1 2 3 4 5
I will only pay more for environmentally friendly products if I receive a direct benefit from doing so
1 2 3 4 5
I think my family and friends would support renewable energy if they had the option
1 2 3 4 5
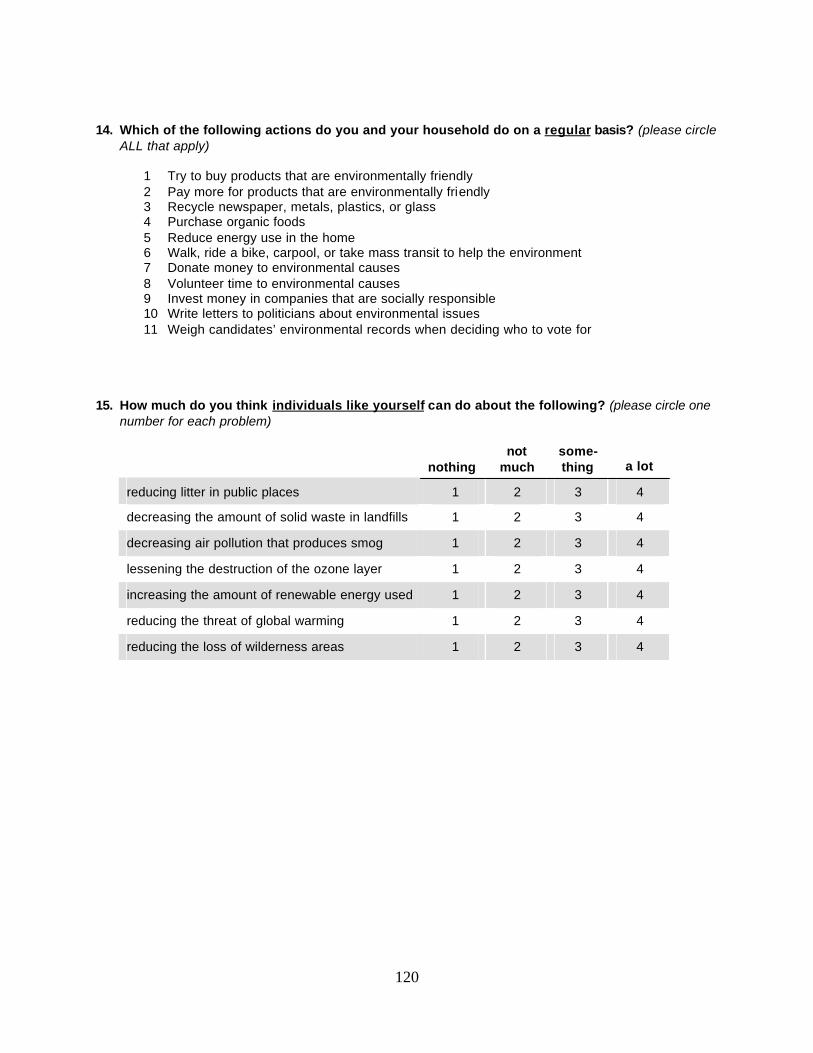
120
14. Which of the following actions do you and your household do on a regular basis? (please circle ALL that apply)
1 Try to buy products that are environmentally friendly 2 Pay more for products that are environmentally friendly 3 Recycle newspaper, metals, plastics, or glass 4 Purchase organic foods 5 Reduce energy use in the home 6 Walk, ride a bike, carpool, or take mass transit to help the environment 7 Donate money to environmental causes 8 Volunteer time to environmental causes 9 Invest money in companies that are socially responsible 10 Write letters to politicians about environmental issues 11 Weigh candidates’ environmental records when deciding who to vote for
15. How much do you think individuals like yourself can do about the following? (please circle one
number for each problem)
nothing
not much
some-thing
a lot
reducing litter in public places 1 2 3 4
decreasing the amount of solid waste in landfills 1 2 3 4
decreasing air pollution that produces smog 1 2 3 4
lessening the destruction of the ozone layer 1 2 3 4
increasing the amount of renewable energy used 1 2 3 4
reducing the threat of global warming 1 2 3 4
reducing the loss of wilderness areas 1 2 3 4

121
16. How much do you think government programs and regulations can do about the following? (please circle one number for each problem)
nothing not
much some-thing
a lot
reducing litter in public places 1 2 3 4
decreasing the amount of solid waste in landfills 1 2 3 4
decreasing air pollution that produces smog 1 2 3 4
lessening the destruction of the ozone layer 1 2 3 4
increasing the amount of renewable energy used 1 2 3 4
reducing the threat of global warming 1 2 3 4
reducing the loss of wilderness areas 1 2 3 4
Section 4: About You
These last few questions will help us understand how well you and other respondents to the survey represent all U.S. residents. All the information in this section (and the entire survey booklet) is confidential. Your name will never be associated with your answers to these questions. 17. How old are you? (please circle one number)
1 17 years or under 2 18 to 24 years 3 25 to 34 years 4 35 to 44 years 5 45 to 54 years 6 55 to 64 years 7 65 years and over
18. Are you male or female? (please circle one number)
1 Male 2 Female
19. Do you have children? (please circle one number)
1 Yes 2 No

122
20. What is the highest grade or year of school that you have completed? (please circle one
number)
1 No school 2 Grade school (1-8 years) 3 Some high school (9-11 years) 4 Completed high school (12 years) 5 Some college but no degree (13-15 years) 6 Associate degree 7 Bachelor’s degree 8 Post graduate
21. Regardless of your party identification, how would you rate yourself politically? (please circle one number)
1 Very conservative 2 Somewhat conservative 3 Neither conservative nor liberal 4 Somewhat liberal 5 Very liberal
22. Below is a list of household income categories. Which income category best describes the
combined year 2000 income of you and all adult family members living with you, before taxes? (please circle one number)
1 Less than $10,000 2 $10,000 - $19,999 3 $20,000 - $29,999 4 $30,000 - $39,999 5 $40,000 - $49,999 6 $50,000 - $59,999 7 $60,000 - $69,999 8 $70,000 - $79,999 9 $80,000 - $89,999 10 $90,000 - $99,999 11 $100,000 - $149,999 12 $150,000 or more
Thank you for your cooperation!
Your assistance in answering this survey is very much appreciated.

123
If we have overlooked something or if you have anything else to tell us, please feel free to do so in the space below.
Please return your completed survey in the postage-paid envelope provided to:
Choices for Electricity Supply Survey University of California at Berkeley
c/o PA Consulting Group 2711 Allen Boulevard, Suite 200
Middleton, WI 53562
If you have any questions about the survey, please contact: Kim Bakalars 1-800-935-4277
The results of this study will be available on the Internet by December 2001 at: www.are.berkeley.edu/CESS
124
Appendix C: Opinion Survey
Deciding Our Energy Future: Choices for Electricity Supply Survey
University of California at Berkeley

125
Section 1: Energy Issues Facing the United States
To begin, we would like to ask you some questions about yourself and about your feelings on the electricity industry and on renewable energy. 1. Do you own or rent your residence? (please circle one number)
1 Own 2 Rent, lease or other arrangement
2. Does your household pay its own electricity bill? (please circle one number)
1 No ? Please STOP HERE and return the survey. Thank you for your participation! 2 Yes ? Please GO TO QUESTION 3 and continue with this survey
3. Households in some states now have the option of choosing which company will provide their
electricity (much like choosing a new long-distance telephone provider). Does your household have the option of choosing your electric company? (please circle one number)
1 No 2 Yes 3 Don't know
4. In meeting the nation's overall electricity needs, please indicate how important each of the
following issues is to you. (please circle one number for each issue)
not at all important
extremely important
Ensuring that electricity service is reliable 1 2 3 4 5
Increasing the amount of electricity generated from renewable sources (such as wind and solar)
1 2 3 4 5
Minimizing the cost of electricity to consumers 1 2 3 4 5
Increasing investments in energy efficiency 1 2 3 4 5
Improving the quality of customer service 1 2 3 4 5
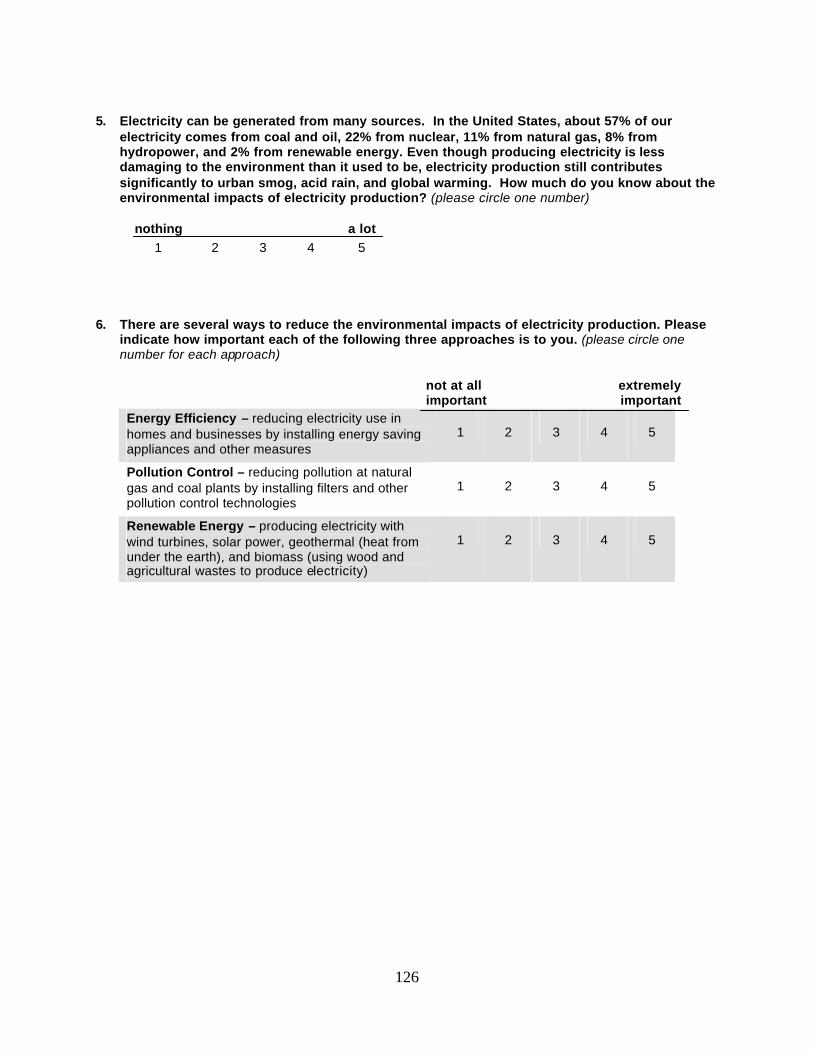
126
5. Electricity can be generated from many sources. In the United States, about 57% of our
electricity comes from coal and oil, 22% from nuclear, 11% from natural gas, 8% from hydropower, and 2% from renewable energy. Even though producing electricity is less damaging to the environment than it used to be, electricity production still contributes significantly to urban smog, acid rain, and global warming. How much do you know about the environmental impacts of electricity production? (please circle one number)
nothing a lot
1 2 3 4 5 6. There are several ways to reduce the environmental impacts of electricity production. Please
indicate how important each of the following three approaches is to you. (please circle one number for each approach)
not at all
important
extremely important
Energy Efficiency – reducing electricity use in homes and businesses by installing energy saving appliances and other measures
1 2 3 4 5
Pollution Control – reducing pollution at natural gas and coal plants by installing filters and other pollution control technologies
1 2 3 4 5
Renewable Energy – producing electricity with wind turbines, solar power, geothermal (heat from under the earth), and biomass (using wood and agricultural wastes to produce electricity)
1 2 3 4 5
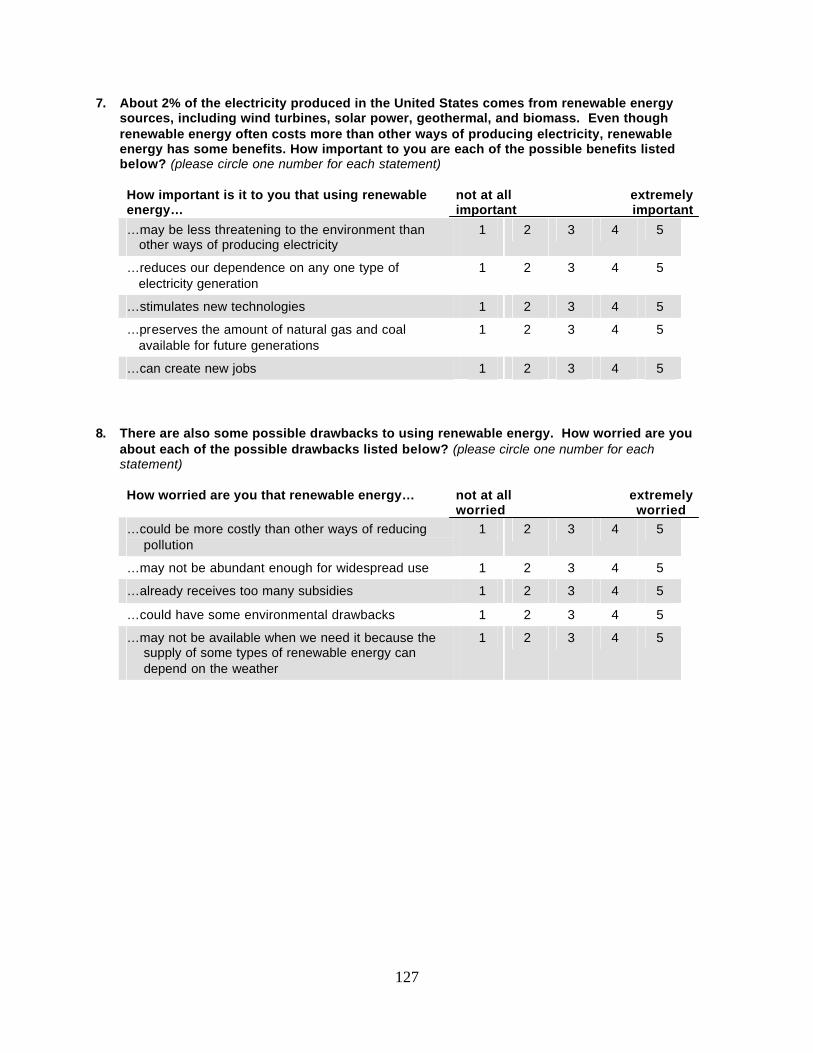
127
7. About 2% of the electricity produced in the United States comes from renewable energy sources, including wind turbines, solar power, geothermal, and biomass. Even though renewable energy often costs more than other ways of producing electricity, renewable energy has some benefits. How important to you are each of the possible benefits listed below? (please circle one number for each statement)
How important is it to you that using renewable energy…
not at all important
extremely important
…may be less threatening to the environment than other ways of producing electricity
1 2 3 4 5
…reduces our dependence on any one type of electricity generation
1 2 3 4 5
…stimulates new technologies 1 2 3 4 5
…preserves the amount of natural gas and coal available for future generations
1 2 3 4 5
…can create new jobs 1 2 3 4 5 8. There are also some possible drawbacks to using renewable energy. How worried are you
about each of the possible drawbacks listed below? (please circle one number for each statement) How worried are you that renewable energy…
not at all worried
extremely worried
…could be more costly than other ways of reducing pollution
1 2 3 4 5
…may not be abundant enough for widespread use 1 2 3 4 5
…already receives too many subsidies 1 2 3 4 5
…could have some environmental drawbacks 1 2 3 4 5
…may not be available when we need it because the supply of some types of renewable energy can depend on the weather
1 2 3 4 5
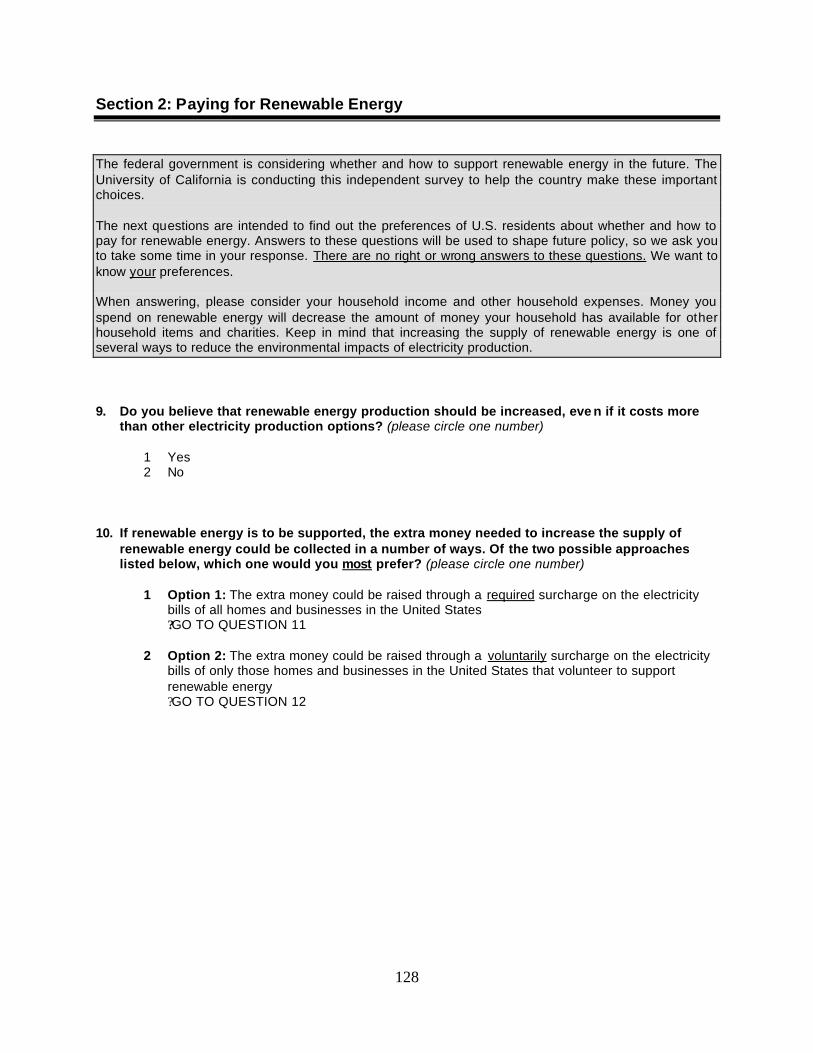
128
Section 2: Paying for Renewable Energy
The federal government is considering whether and how to support renewable energy in the future. The University of California is conducting this independent survey to help the country make these important choices. The next questions are intended to find out the preferences of U.S. residents about whether and how to pay for renewable energy. Answers to these questions will be used to shape future policy, so we ask you to take some time in your response. There are no right or wrong answers to these questions. We want to know your preferences. When answering, please consider your household income and other household expenses. Money you spend on renewable energy will decrease the amount of money your household has available for other household items and charities. Keep in mind that increasing the supply of renewable energy is one of several ways to reduce the environmental impacts of electricity production. 9. Do you believe that renewable energy production should be increased, eve n if it costs more
than other electricity production options? (please circle one number)
1 Yes 2 No
10. If renewable energy is to be supported, the extra money needed to increase the supply of
renewable energy could be collected in a number of ways. Of the two possible approaches listed below, which one would you most prefer? (please circle one number)
1 Option 1: The extra money could be raised through a required surcharge on the electricity
bills of all homes and businesses in the United States ? GO TO QUESTION 11 2 Option 2: The extra money could be raised through a voluntarily surcharge on the electricity
bills of only those homes and businesses in the United States that volunteer to support renewable energy
? GO TO QUESTION 12
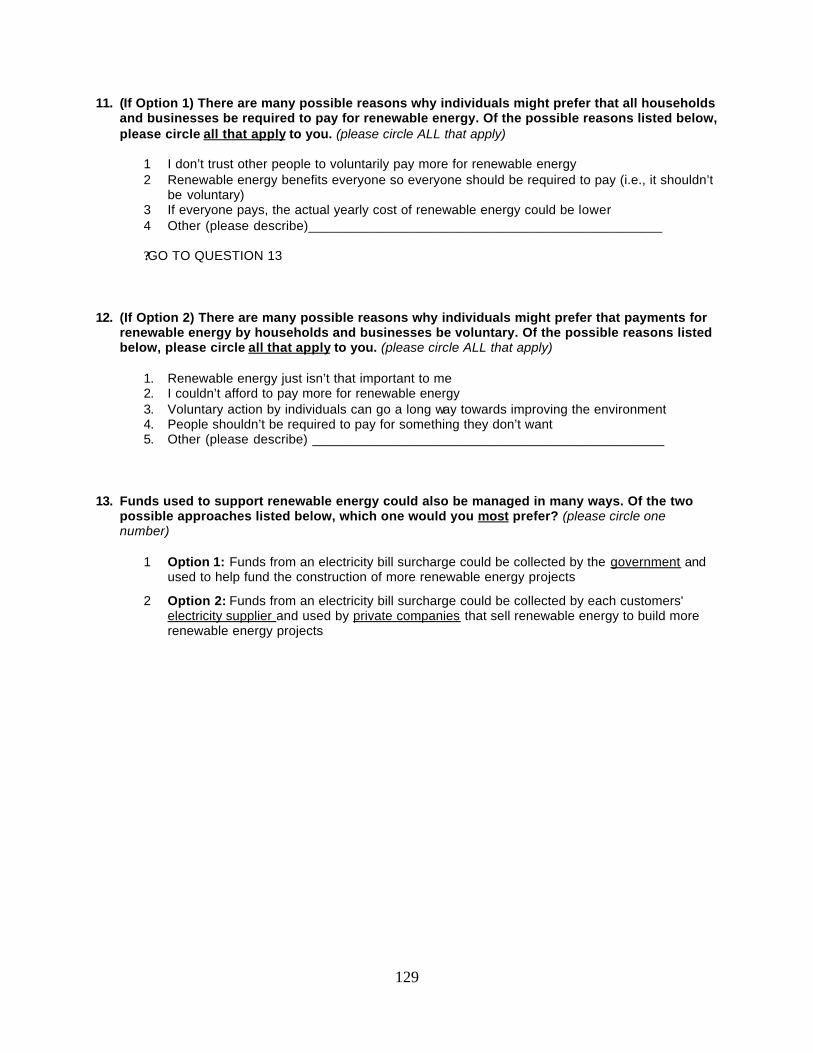
129
11. (If Option 1) There are many possible reasons why individuals might prefer that all households and businesses be required to pay for renewable energy. Of the possible reasons listed below, please circle all that apply to you. (please circle ALL that apply)
1 I don’t trust other people to voluntarily pay more for renewable energy 2 Renewable energy benefits everyone so everyone should be required to pay (i.e., it shouldn’t
be voluntary) 3 If everyone pays, the actual yearly cost of renewable energy could be lower 4 Other (please describe)________________________________________________ ? GO TO QUESTION 13
12. (If Option 2) There are many possible reasons why individuals might prefer that payments for
renewable energy by households and businesses be voluntary. Of the possible reasons listed below, please circle all that apply to you. (please circle ALL that apply)
1. Renewable energy just isn’t that important to me 2. I couldn’t afford to pay more for renewable energy 3. Voluntary action by individuals can go a long way towards improving the environment 4. People shouldn’t be required to pay for something they don’t want 5. Other (please describe) ________________________________________________
13. Funds used to support renewable energy could also be managed in many ways. Of the two
possible approaches listed below, which one would you most prefer? (please circle one number)
1 Option 1: Funds from an electricity bill surcharge could be collected by the government and
used to help fund the construction of more renewable energy projects
2 Option 2: Funds from an electricity bill surcharge could be collected by each customers' electricity supplier and used by private companies that sell renewable energy to build more renewable energy projects
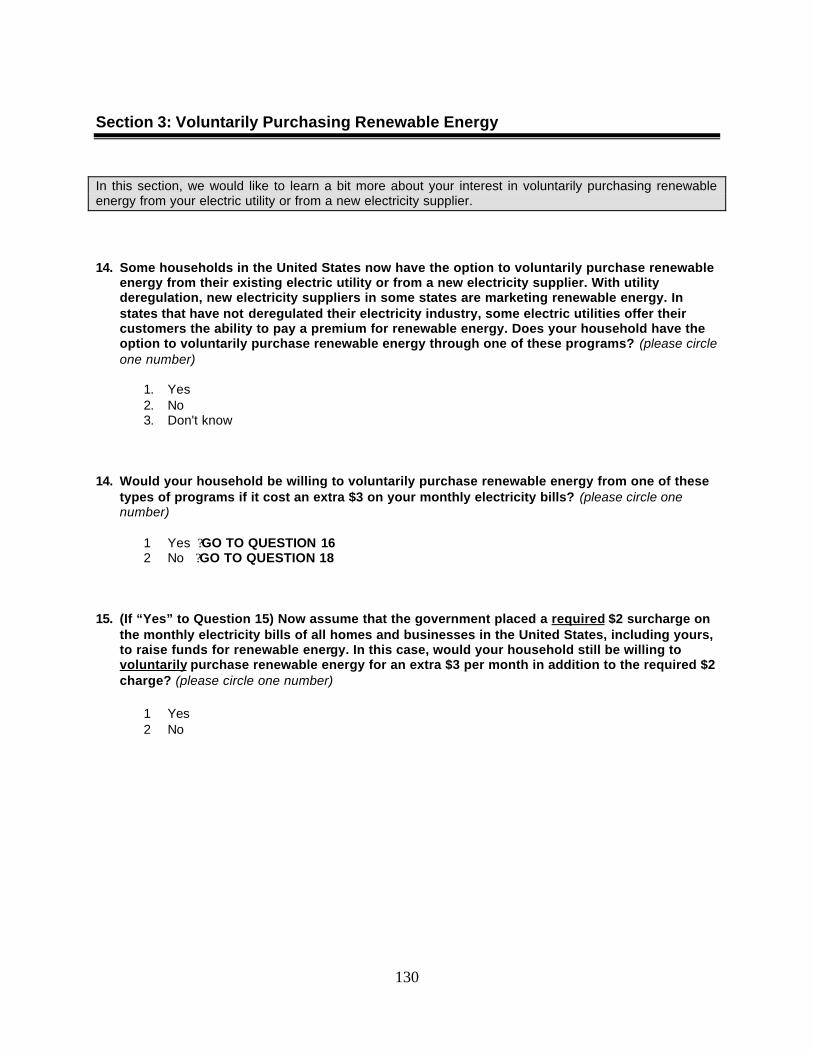
130
Section 3: Voluntarily Purchasing Renewable Energy
In this section, we would like to learn a bit more about your interest in voluntarily purchasing renewable energy from your electric utility or from a new electricity supplier.
14. Some households in the United States now have the option to voluntarily purchase renewable
energy from their existing electric utility or from a new electricity supplier. With utility deregulation, new electricity suppliers in some states are marketing renewable energy. In states that have not deregulated their electricity industry, some electric utilities offer their customers the ability to pay a premium for renewable energy. Does your household have the option to voluntarily purchase renewable energy through one of these programs? (please circle one number)
1. Yes 2. No 3. Don't know
14. Would your household be willing to voluntarily purchase renewable energy from one of these
types of programs if it cost an extra $3 on your monthly electricity bills? (please circle one number)
1 Yes ? GO TO QUESTION 16 2 No ? GO TO QUESTION 18
15. (If “Yes” to Question 15) Now assume that the government placed a required $2 surcharge on the monthly electricity bills of all homes and businesses in the United States, including yours, to raise funds for renewable energy. In this case, would your household still be willing to voluntarily purchase renewable energy for an extra $3 per month in addition to the required $2 charge? (please circle one number)
1 Yes 2 No
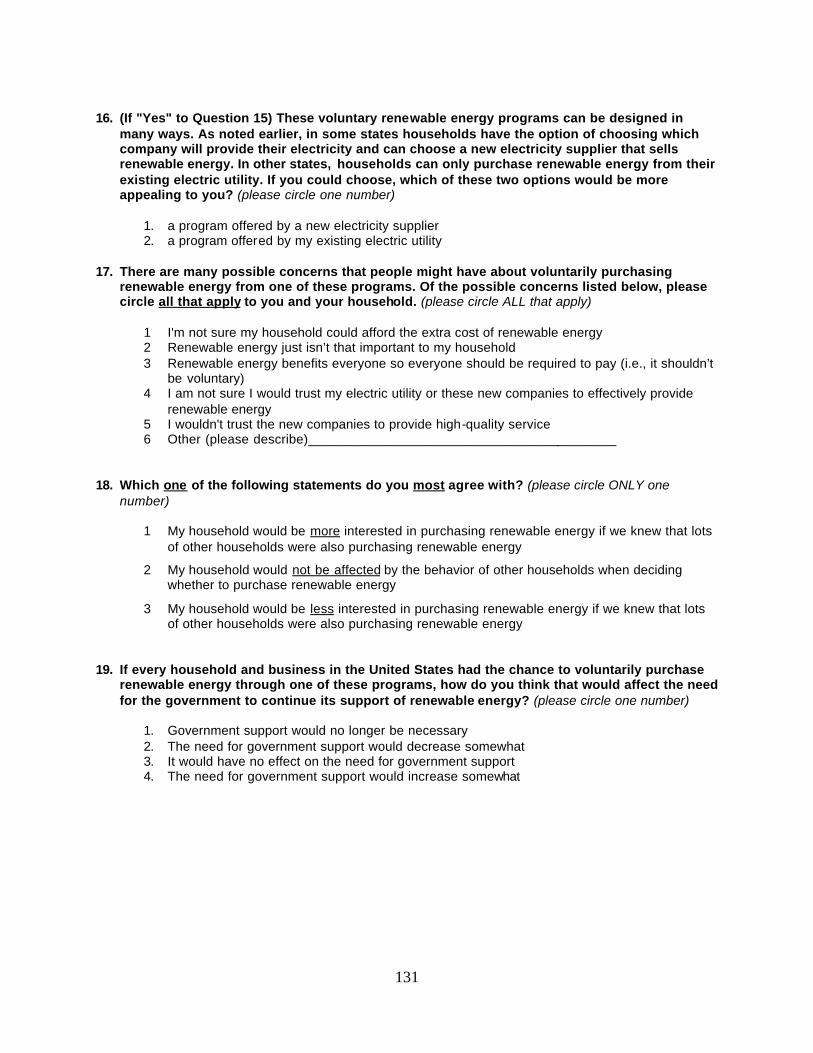
131
16. (If "Yes" to Question 15) These voluntary renewable energy programs can be designed in
many ways. As noted earlier, in some states households have the option of choosing which company will provide their electricity and can choose a new electricity supplier that sells renewable energy. In other states, households can only purchase renewable energy from their existing electric utility. If you could choose, which of these two options would be more appealing to you? (please circle one number)
1. a program offered by a new electricity supplier 2. a program offered by my existing electric utility
17. There are many possible concerns that people might have about voluntarily purchasing
renewable energy from one of these programs. Of the possible concerns listed below, please circle all that apply to you and your household. (please circle ALL that apply)
1 I'm not sure my household could afford the extra cost of renewable energy 2 Renewable energy just isn’t that important to my household 3 Renewable energy benefits everyone so everyone should be required to pay (i.e., it shouldn’t
be voluntary) 4 I am not sure I would trust my electric utility or these new companies to effectively provide
renewable energy 5 I wouldn't trust the new companies to provide high-quality service 6 Other (please describe)__________________________________________
18. Which one of the following statements do you most agree with? (please circle ONLY one
number)
1 My household would be more interested in purchasing renewable energy if we knew that lots of other households were also purchasing renewable energy
2 My household would not be affected by the behavior of other households when deciding whether to purchase renewable energy
3 My household would be less interested in purchasing renewable energy if we knew that lots of other households were also purchasing renewable energy
19. If every household and business in the United States had the chance to voluntarily purchase
renewable energy through one of these programs, how do you think that would affect the need for the government to continue its support of renewable energy? (please circle one number)
1. Government support would no longer be necessary 2. The need for government support would decrease somewhat 3. It would have no effect on the need for government support 4. The need for government support would increase somewhat

132
Section 4: Your Attitudes about Environmental Issues 20. Please indicate how strongly you disagree or agree with each of the following statements.
(please circle one number for each statement)
strongly disagree
somewhat disagree
neutral somewhat agree
strongly agree
I am often one of the first people I know to try new products
1 2 3 4 5
There is not much that any one individual can do about the environment
1 2 3 4 5
I am more likely to buy environmentally friendly products if I know that other people are doing the same
1 2 3 4 5
I don’t trust the environmental claims of companies offering environmentally friendly products
1 2 3 4 5
I don’t trust other people to make personal sacrifices to protect the environment
1 2 3 4 5
Now that companies are offering environmentally friendly products, we don’t need as many environmental regulations
1 2 3 4 5
The government can’t be trusted to collect funds and spend them on worthwhile causes
1 2 3 4 5
The government should require everyone to help pay for environmental improvements
1 2 3 4 5
I will only pay more for environmentally friendly products if I receive a direct benefit from doing so
1 2 3 4 5
I think my family and friends would support renewable energy if they had the option
1 2 3 4 5

133
21. Which of the following actions do you and your household do on a regular basis? (please circle
ALL that apply)
1 Try to buy products that are environmentally friendly 2 Pay more for products that are environmentally friendly 3 Recycle newspaper, metals, plastics, or glass 4 Purchase organic foods 5 Reduce energy use in the home 6 Walk, ride a bike, carpool, or take mass transit to help the environment 7 Donate money to environmental causes 8 Volunteer time to environmental causes 9 Invest money in companies that are socially responsible 10 Write letters to politicians about environmental issues 11 Weigh candidates’ environmental records when deciding who to vote for
22. Please indicate how strongly you disagree or agree with the following statement: “People generally act in their own self-interest when they purchase consumer products and services.” (please circle one number)
1 strongly disagree 2 somewhat disagree 3 neutral 4 somewhat agree 5 strongly agree
23. Please indicate how strongly you disagree or agree with the following statement: “People generally act in their own self-interest when they vote for political candidates and initiatives.” (please circle one number)
1 strongly disagree 2 somewhat disagree 3 neutral 4 somewhat agree 5 strongly agree
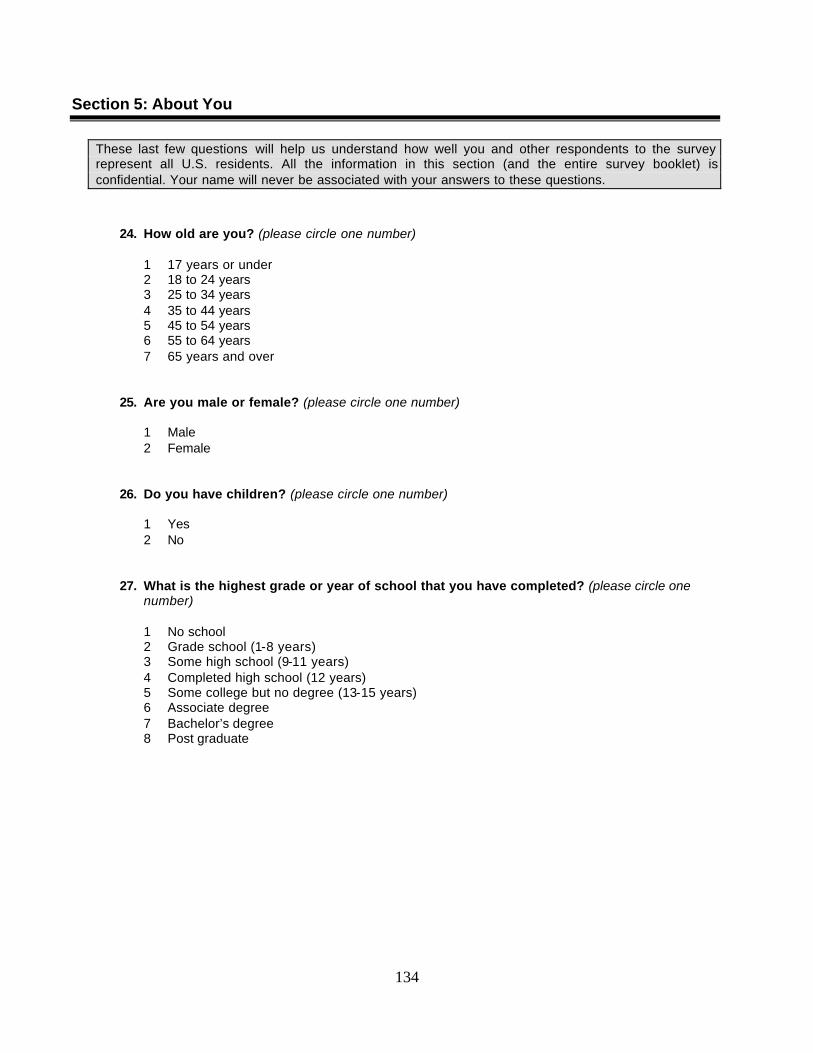
134
Section 5: About You
These last few questions will help us understand how well you and other respondents to the survey represent all U.S. residents. All the information in this section (and the entire survey booklet) is confidential. Your name will never be associated with your answers to these questions.
24. How old are you? (please circle one number)
1 17 years or under 2 18 to 24 years 3 25 to 34 years 4 35 to 44 years 5 45 to 54 years 6 55 to 64 years 7 65 years and over
25. Are you male or female? (please circle one number)
1 Male 2 Female
26. Do you have children? (please circle one number)
1 Yes 2 No
27. What is the highest grade or year of school that you have completed? (please circle one number)
1 No school 2 Grade school (1-8 years) 3 Some high school (9-11 years) 4 Completed high school (12 years) 5 Some college but no degree (13-15 years) 6 Associate degree 7 Bachelor’s degree 8 Post graduate

135
28. Regardless of your party identification, how would you rate yourself politically? (please circle one number)
1 Very conservative 2 Somewhat conservative 3 Neither conservative nor liberal 4 Somewhat liberal 5 Very liberal
29. Below is a list of household income categories. Which income category best describes the combined year 2000 income of you and all adult family members living with you, before taxes? (please circle one number)
1 Less than $10,000 2 $10,000 - $19,999 3 $20,000 - $29,999 4 $30,000 - $39,999 5 $40,000 - $49,999 6 $50,000 - $59,999 7 $60,000 - $69,999 8 $70,000 - $79,999 9 $80,000 - $89,999 10 $90,000 - $99,999 11 $100,000 - $149,999 12 $150,000 or more
Thank you for your cooperation!
Your assistance in answering this survey is very much appreciated.

136
If we have overlooked something or if you have anything else to tell us, please feel free to do so in the space below.
Please return your completed survey in the postage-paid envelope provided to:
Choices for Electricity Supply Survey University of California at Berkeley
c/o PA Consulting Group 2711 Allen Boulevard, Suite 200
Middleton, WI 53562
If you have any questions about the survey, please contact: Kim Bakalars 1-800-935-4277
The results of this study will be available on the Internet by December 2001 at: www.are.berkeley.edu/CESS
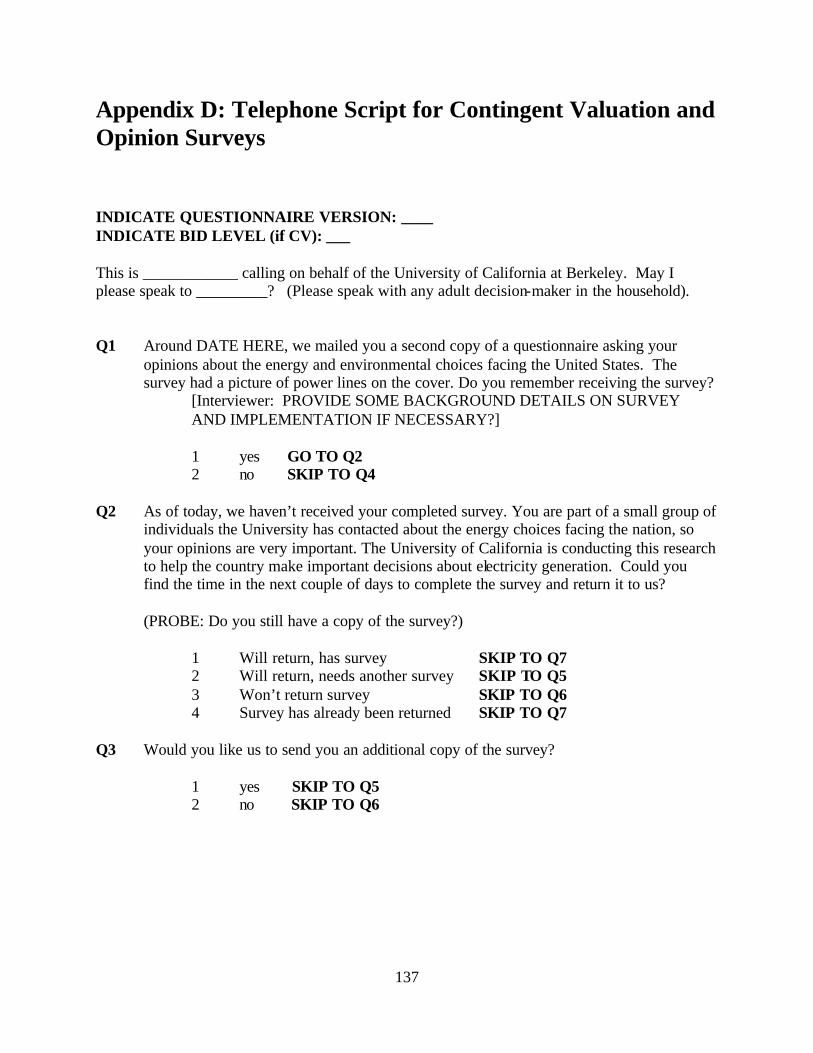
137
Appendix D: Telephone Script for Contingent Valuation and Opinion Surveys
INDICATE QUESTIONNAIRE VERSION: ____ INDICATE BID LEVEL (if CV): ___ This is ____________ calling on behalf of the University of California at Berkeley. May I please speak to _________? (Please speak with any adult decision-maker in the household). Q1 Around DATE HERE, we mailed you a second copy of a questionnaire asking your
opinions about the energy and environmental choices facing the United States. The survey had a picture of power lines on the cover. Do you remember receiving the survey?
[Interviewer: PROVIDE SOME BACKGROUND DETAILS ON SURVEY AND IMPLEMENTATION IF NECESSARY?]
1 yes GO TO Q2 2 no SKIP TO Q4
Q2 As of today, we haven’t received your completed survey. You are part of a small group of
individuals the University has contacted about the energy choices facing the nation, so your opinions are very important. The University of California is conducting this research to help the country make important decisions about electricity generation. Could you find the time in the next couple of days to complete the survey and return it to us?
(PROBE: Do you still have a copy of the survey?) 1 Will return, has survey SKIP TO Q7
2 Will return, needs another survey SKIP TO Q5 3 Won’t return survey SKIP TO Q6 4 Survey has already been returned SKIP TO Q7
Q3 Would you like us to send you an additional copy of the survey? 1 yes SKIP TO Q5
2 no SKIP TO Q6
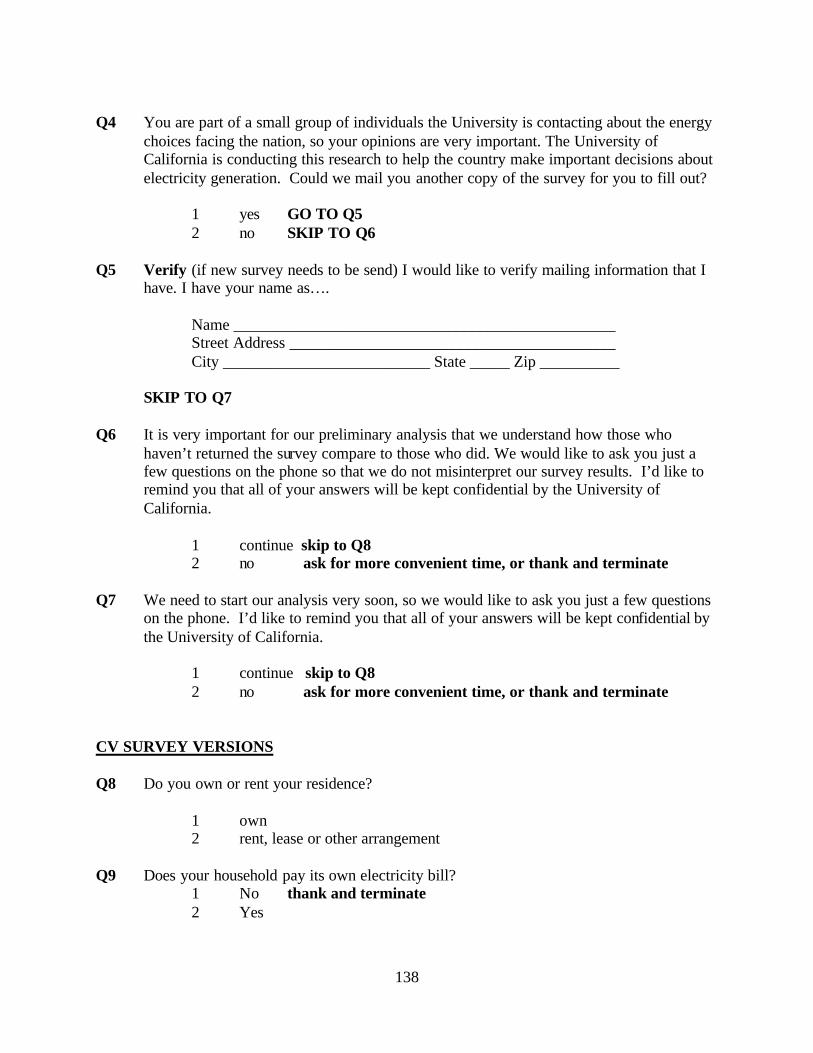
138
Q4 You are part of a small group of individuals the University is contacting about the energy
choices facing the nation, so your opinions are very important. The University of California is conducting this research to help the country make important decisions about electricity generation. Could we mail you another copy of the survey for you to fill out?
1 yes GO TO Q5
2 no SKIP TO Q6
Q5 Verify (if new survey needs to be send) I would like to verify mailing information that I have. I have your name as….
Name ________________________________________________ Street Address _________________________________________ City __________________________ State _____ Zip __________
SKIP TO Q7
Q6 It is very important for our preliminary analysis that we understand how those who
haven’t returned the survey compare to those who did. We would like to ask you just a few questions on the phone so that we do not misinterpret our survey results. I’d like to remind you that all of your answers will be kept confidential by the University of California.
1 continue skip to Q8 2 no ask for more convenient time, or thank and terminate Q7 We need to start our analysis very soon, so we would like to ask you just a few questions
on the phone. I’d like to remind you that all of your answers will be kept confidential by the University of California.
1 continue skip to Q8 2 no ask for more convenient time, or thank and terminate CV SURVEY VERSIONS Q8 Do you own or rent your residence?
1 own 2 rent, lease or other arrangement
Q9 Does your household pay its own electricity bill?
1 No thank and terminate 2 Yes
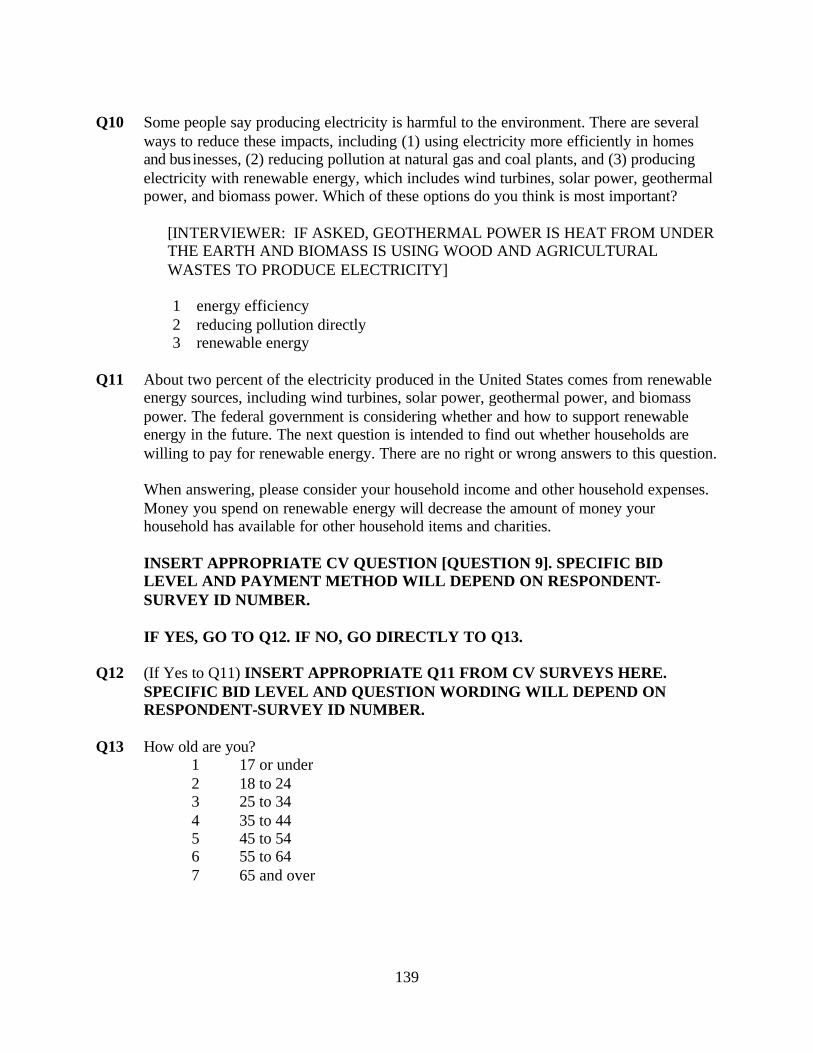
139
Q10 Some people say producing electricity is harmful to the environment. There are several
ways to reduce these impacts, including (1) using electricity more efficiently in homes and businesses, (2) reducing pollution at natural gas and coal plants, and (3) producing electricity with renewable energy, which includes wind turbines, solar power, geothermal power, and biomass power. Which of these options do you think is most important?
[INTERVIEWER: IF ASKED, GEOTHERMAL POWER IS HEAT FROM UNDER THE EARTH AND BIOMASS IS USING WOOD AND AGRICULTURAL WASTES TO PRODUCE ELECTRICITY]
1 energy efficiency 2 reducing pollution directly 3 renewable energy
Q11 About two percent of the electricity produced in the United States comes from renewable
energy sources, including wind turbines, solar power, geothermal power, and biomass power. The federal government is considering whether and how to support renewable energy in the future. The next question is intended to find out whether households are willing to pay for renewable energy. There are no right or wrong answers to this question. When answering, please consider your household income and other household expenses. Money you spend on renewable energy will decrease the amount of money your household has available for other household items and charities. INSERT APPROPRIATE CV QUESTION [QUESTION 9]. SPECIFIC BID LEVEL AND PAYMENT METHOD WILL DEPEND ON RESPONDENT-SURVEY ID NUMBER. IF YES, GO TO Q12. IF NO, GO DIRECTLY TO Q13.
Q12 (If Yes to Q11) INSERT APPROPRIATE Q11 FROM CV SURVEYS HERE.
SPECIFIC BID LEVEL AND QUESTION WORDING WILL DEPEND ON RESPONDENT-SURVEY ID NUMBER.
Q13 How old are you?
1 17 or under 2 18 to 24 3 25 to 34 4 35 to 44 5 45 to 54 6 55 to 64 7 65 and over
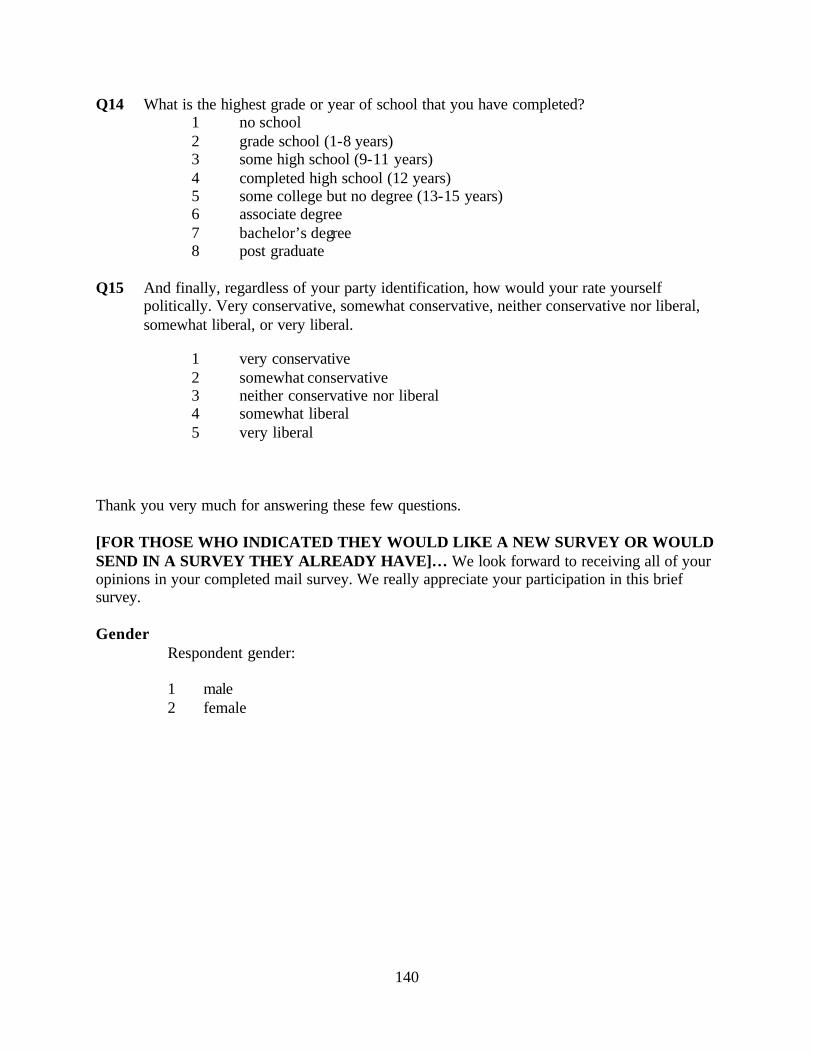
140
Q14 What is the highest grade or year of school that you have completed? 1 no school 2 grade school (1-8 years) 3 some high school (9-11 years) 4 completed high school (12 years) 5 some college but no degree (13-15 years) 6 associate degree 7 bachelor’s degree 8 post graduate
Q15 And finally, regardless of your party identification, how would your rate yourself
politically. Very conservative, somewhat conservative, neither conservative nor liberal, somewhat liberal, or very liberal.
1 very conservative 2 somewhat conservative 3 neither conservative nor liberal 4 somewhat liberal 5 very liberal
Thank you very much for answering these few questions. [FOR THOSE WHO INDICATED THEY WOULD LIKE A NEW SURVEY OR WOULD SEND IN A SURVEY THEY ALREADY HAVE]… We look forward to receiving all of your opinions in your completed mail survey. We really appreciate your participation in this brief survey. Gender Respondent gender:
1 male 2 female
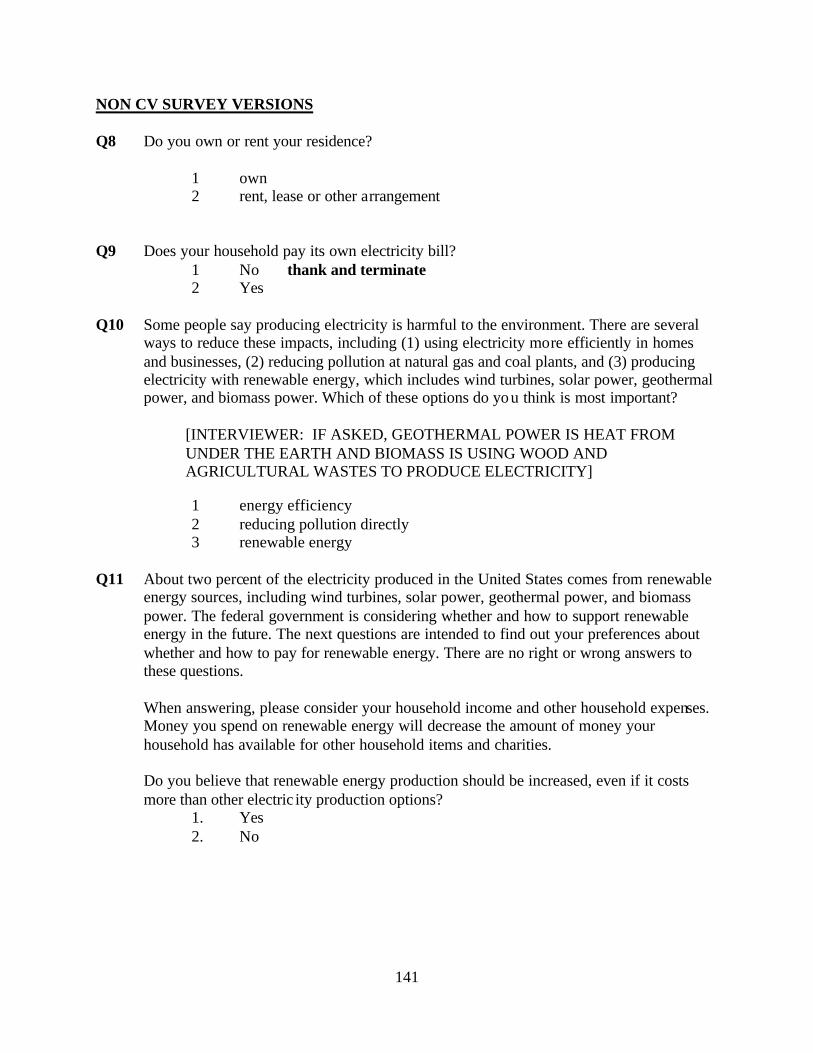
141
NON CV SURVEY VERSIONS Q8 Do you own or rent your residence?
1 own 2 rent, lease or other arrangement
Q9 Does your household pay its own electricity bill? 1 No thank and terminate 2 Yes
Q10 Some people say producing electricity is harmful to the environment. There are several
ways to reduce these impacts, including (1) using electricity more efficiently in homes and businesses, (2) reducing pollution at natural gas and coal plants, and (3) producing electricity with renewable energy, which includes wind turbines, solar power, geothermal power, and biomass power. Which of these options do you think is most important?
[INTERVIEWER: IF ASKED, GEOTHERMAL POWER IS HEAT FROM UNDER THE EARTH AND BIOMASS IS USING WOOD AND AGRICULTURAL WASTES TO PRODUCE ELECTRICITY]
1 energy efficiency 2 reducing pollution directly 3 renewable energy
Q11 About two percent of the electricity produced in the United States comes from renewable
energy sources, including wind turbines, solar power, geothermal power, and biomass power. The federal government is considering whether and how to support renewable energy in the future. The next questions are intended to find out your preferences about whether and how to pay for renewable energy. There are no right or wrong answers to these questions.
When answering, please consider your household income and other household expenses.
Money you spend on renewable energy will decrease the amount of money your household has available for other household items and charities. Do you believe that renewable energy production should be increased, even if it costs more than other electric ity production options?
1. Yes 2. No
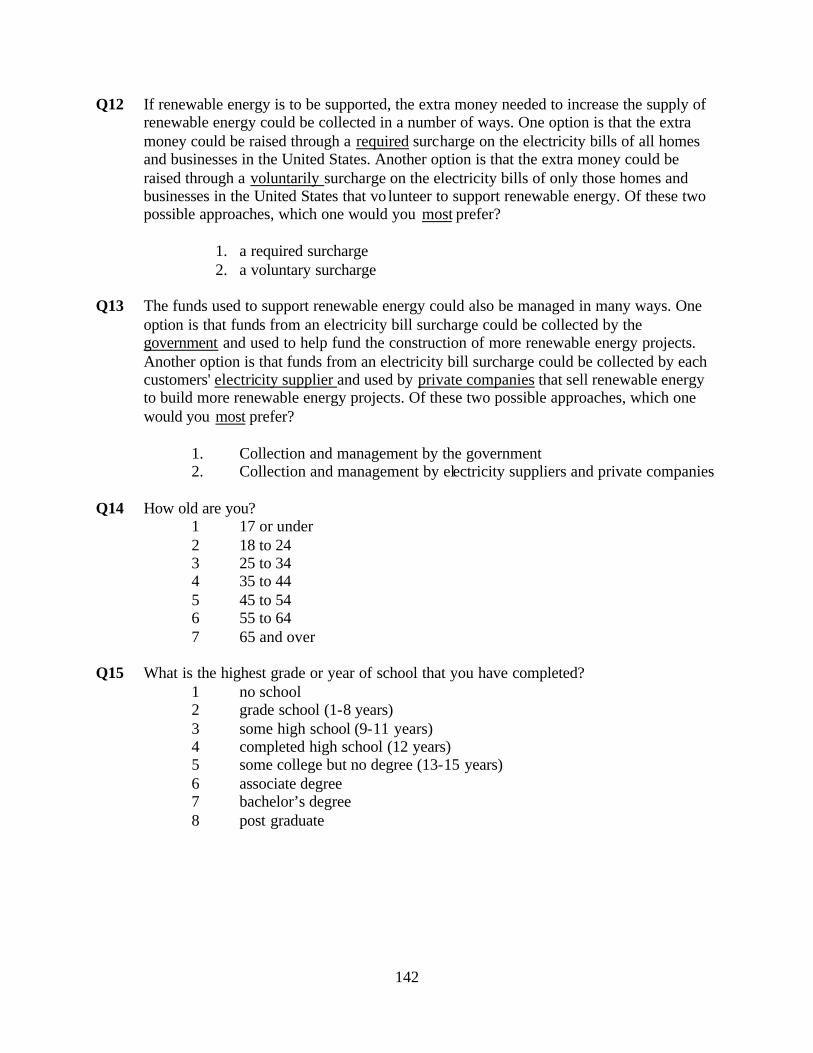
142
Q12 If renewable energy is to be supported, the extra money needed to increase the supply of renewable energy could be collected in a number of ways. One option is that the extra money could be raised through a required surcharge on the electricity bills of all homes and businesses in the United States. Another option is that the extra money could be raised through a voluntarily surcharge on the electricity bills of only those homes and businesses in the United States that vo lunteer to support renewable energy. Of these two possible approaches, which one would you most prefer?
1. a required surcharge 2. a voluntary surcharge
Q13 The funds used to support renewable energy could also be managed in many ways. One
option is that funds from an electricity bill surcharge could be collected by the government and used to help fund the construction of more renewable energy projects. Another option is that funds from an electricity bill surcharge could be collected by each customers' electricity supplier and used by private companies that sell renewable energy to build more renewable energy projects. Of these two possible approaches, which one would you most prefer?
1. Collection and management by the government 2. Collection and management by electricity suppliers and private companies
Q14 How old are you?
1 17 or under 2 18 to 24 3 25 to 34 4 35 to 44 5 45 to 54 6 55 to 64 7 65 and over
Q15 What is the highest grade or year of school that you have completed? 1 no school 2 grade school (1-8 years) 3 some high school (9-11 years) 4 completed high school (12 years) 5 some college but no degree (13-15 years) 6 associate degree 7 bachelor’s degree 8 post graduate
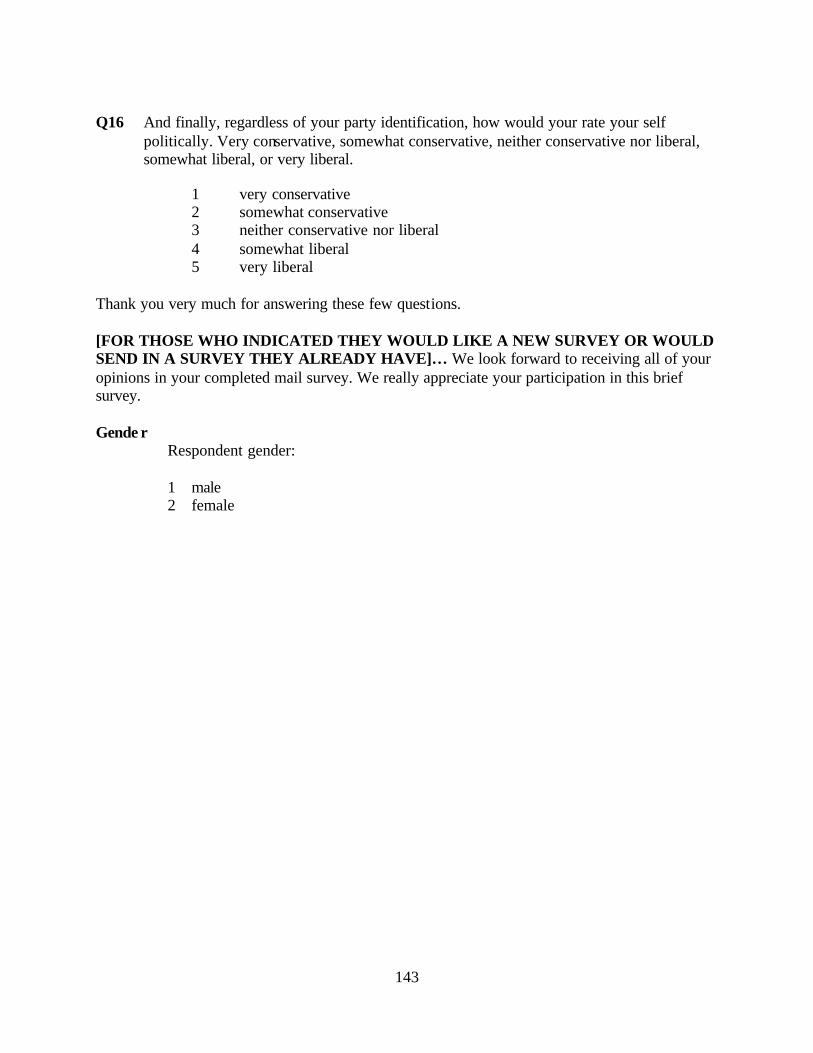
143
Q16 And finally, regardless of your party identification, how would your rate your self
politically. Very conservative, somewhat conservative, neither conservative nor liberal, somewhat liberal, or very liberal.
1 very conservative 2 somewhat conservative 3 neither conservative nor liberal 4 somewhat liberal 5 very liberal
Thank you very much for answering these few questions. [FOR THOSE WHO INDICATED THEY WOULD LIKE A NEW SURVEY OR WOULD SEND IN A SURVEY THEY ALREADY HAVE]… We look forward to receiving all of your opinions in your completed mail survey. We really appreciate your participation in this brief survey. Gende r Respondent gender:
1 male 2 female
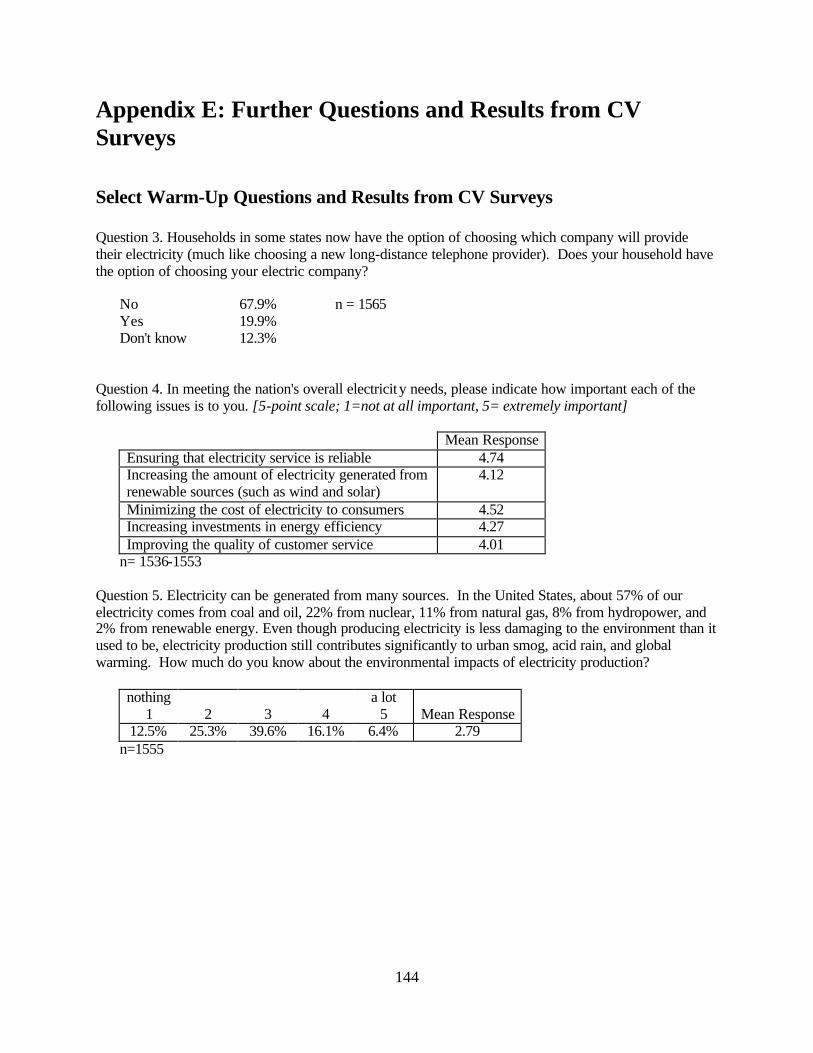
144
Appendix E: Further Questions and Results from CV Surveys
Select Warm-Up Questions and Results from CV Surveys
Question 3. Households in some states now have the option of choosing which company will provide their electricity (much like choosing a new long-distance telephone provider). Does your household have the option of choosing your electric company?
No 67.9% n = 1565 Yes 19.9% Don't know 12.3%
Question 4. In meeting the nation's overall electricity needs, please indicate how important each of the following issues is to you. [5-point scale; 1=not at all important, 5= extremely important]
Mean Response Ensuring that electricity service is reliable 4.74 Increasing the amount of electricity generated from renewable sources (such as wind and solar)
4.12
Minimizing the cost of electricity to consumers 4.52 Increasing investments in energy efficiency 4.27 Improving the quality of customer service 4.01
n= 1536-1553 Question 5. Electricity can be generated from many sources. In the United States, about 57% of our electricity comes from coal and oil, 22% from nuclear, 11% from natural gas, 8% from hydropower, and 2% from renewable energy. Even though producing electricity is less damaging to the environment than it used to be, electricity production still contributes significantly to urban smog, acid rain, and global warming. How much do you know about the environmental impacts of electricity production?
nothing 1
2
3
4
a lot 5
Mean Response
12.5% 25.3% 39.6% 16.1% 6.4% 2.79 n=1555
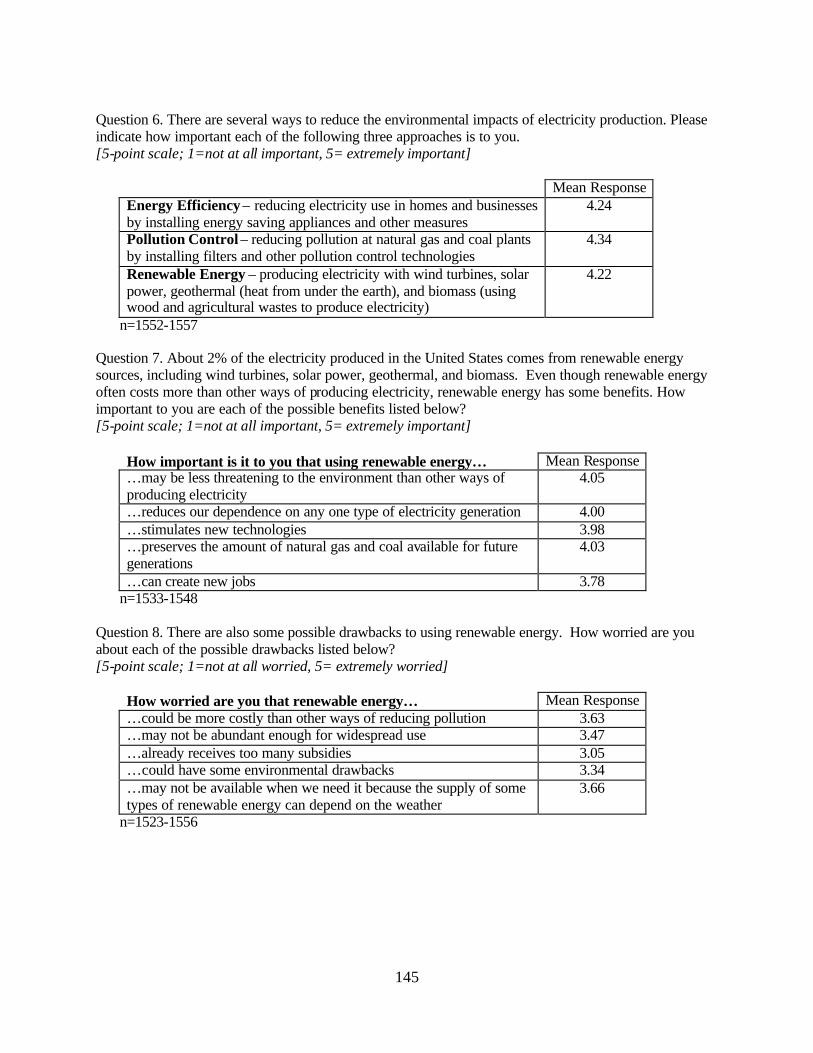
145
Question 6. There are several ways to reduce the environmental impacts of electricity production. Please indicate how important each of the following three approaches is to you. [5-point scale; 1=not at all important, 5= extremely important]
Mean Response Energy Efficiency – reducing electricity use in homes and businesses by installing energy saving appliances and other measures
4.24
Pollution Control – reducing pollution at natural gas and coal plants by installing filters and other pollution control technologies
4.34
Renewable Energy – producing electricity with wind turbines, solar power, geothermal (heat from under the earth), and biomass (using wood and agricultural wastes to produce electricity)
4.22
n=1552-1557 Question 7. About 2% of the electricity produced in the United States comes from renewable energy sources, including wind turbines, solar power, geothermal, and biomass. Even though renewable energy often costs more than other ways of producing electricity, renewable energy has some benefits. How important to you are each of the possible benefits listed below? [5-point scale; 1=not at all important, 5= extremely important]
How important is it to you that using renewable energy… Mean Response …may be less threatening to the environment than other ways of producing electricity
4.05
…reduces our dependence on any one type of electricity generation 4.00 …stimulates new technologies 3.98 …preserves the amount of natural gas and coal available for future generations
4.03
…can create new jobs 3.78 n=1533-1548
Question 8. There are also some possible drawbacks to using renewable energy. How worried are you about each of the possible drawbacks listed below? [5-point scale; 1=not at all worried, 5= extremely worried]
How worried are you that renewable energy… Mean Response …could be more costly than other ways of reducing pollution 3.63 …may not be abundant enough for widespread use 3.47 …already receives too many subsidies 3.05 …could have some environmental drawbacks 3.34 …may not be available when we need it because the supply of some types of renewable energy can depend on the weather
3.66
n=1523-1556
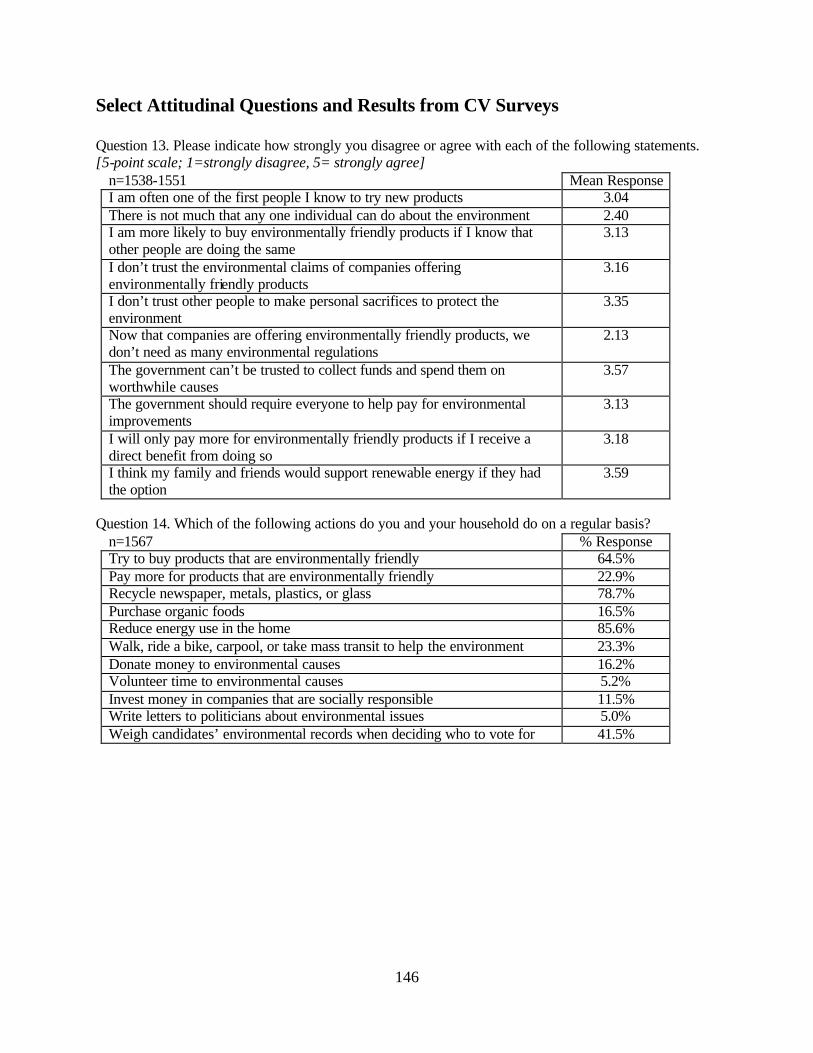
146
Select Attitudinal Questions and Results from CV Surveys
Question 13. Please indicate how strongly you disagree or agree with each of the following statements. [5-point scale; 1=strongly disagree, 5= strongly agree]
n=1538-1551 Mean Response I am often one of the first people I know to try new products 3.04 There is not much that any one individual can do about the environment 2.40 I am more likely to buy environmentally friendly products if I know that other people are doing the same
3.13
I don’t trust the environmental claims of companies offering environmentally friendly products
3.16
I don’t trust other people to make personal sacrifices to protect the environment
3.35
Now that companies are offering environmentally friendly products, we don’t need as many environmental regulations
2.13
The government can’t be trusted to collect funds and spend them on worthwhile causes
3.57
The government should require everyone to help pay for environmental improvements
3.13
I will only pay more for environmentally friendly products if I receive a direct benefit from doing so
3.18
I think my family and friends would support renewable energy if they had the option
3.59
Question 14. Which of the following actions do you and your household do on a regular basis?
n=1567 % Response Try to buy products that are environmentally friendly 64.5% Pay more for products that are environmentally friendly 22.9% Recycle newspaper, metals, plastics, or glass 78.7% Purchase organic foods 16.5% Reduce energy use in the home 85.6% Walk, ride a bike, carpool, or take mass transit to help the environment 23.3% Donate money to environmental causes 16.2% Volunteer time to environmental causes 5.2% Invest money in companies that are socially responsible 11.5% Write letters to politicians about environmental issues 5.0% Weigh candidates’ environmental records when deciding who to vote for 41.5%
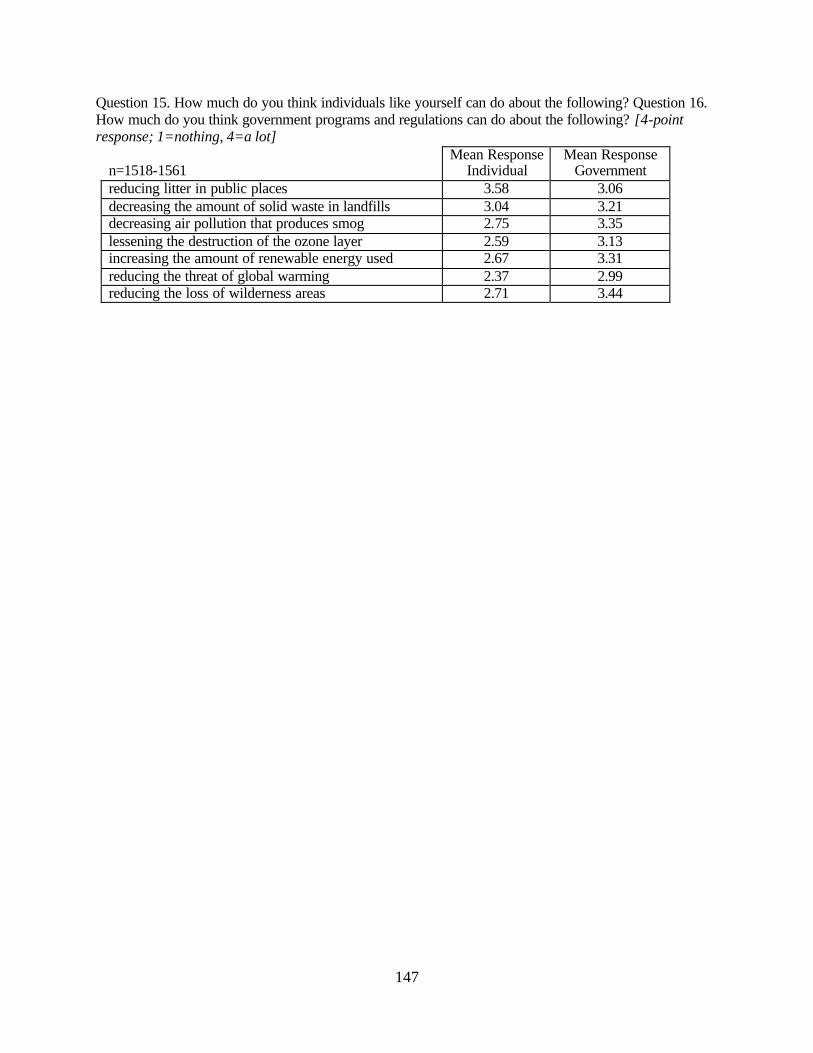
147
Question 15. How much do you think individuals like yourself can do about the following? Question 16. How much do you think government programs and regulations can do about the following? [4-point response; 1=nothing, 4=a lot]
n=1518-1561
Mean Response Individual
Mean Response Government
reducing litter in public places 3.58 3.06 decreasing the amount of solid waste in landfills 3.04 3.21 decreasing air pollution that produces smog 2.75 3.35 lessening the destruction of the ozone layer 2.59 3.13 increasing the amount of renewable energy used 2.67 3.31 reducing the threat of global warming 2.37 2.99 reducing the loss of wilderness areas 2.71 3.44