Embed Size (px)
Citation preview
1
USING DATA REGISTRIES TO IMPROVE CARE FOR HEART FAILURE PATIENTS

2
CHERIE’ BOXBERGER, MS. MBA. CPHQ REGIONAL VICE PRESIDENT – QUALITY & SYSTEM IMPROVEMENT
AR CO OK NM TX WY
FINANCIAL DISCLOSURE: AMERICAN HEART ASSOCIATION EMPLOYEE
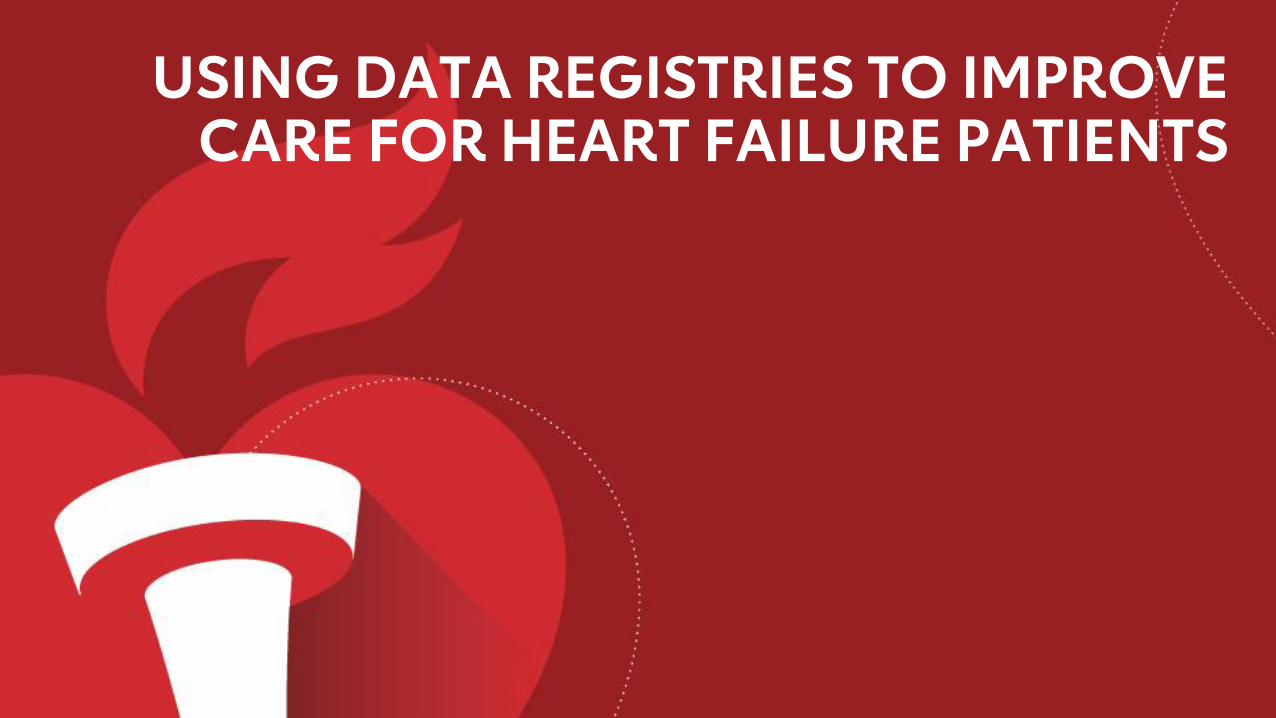
Guideline Directed Medical Therapies
2/13/2020 3
ARNI
3
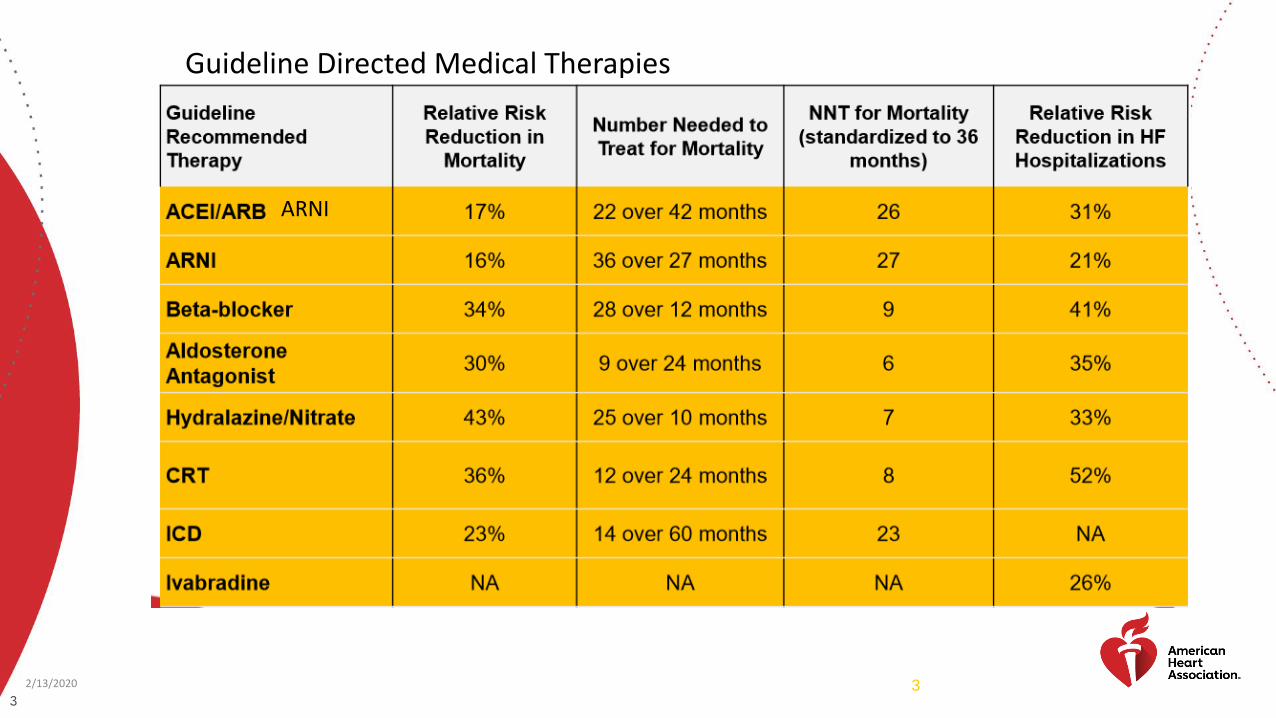
Guideline Directed Medical Therapies – AR, CO, OK, NM, TX, WY
93.8%
94.5%
21.3%
52.8%
25.7%
47.5%
64.1%
ARNI
2/13/2020 4 4
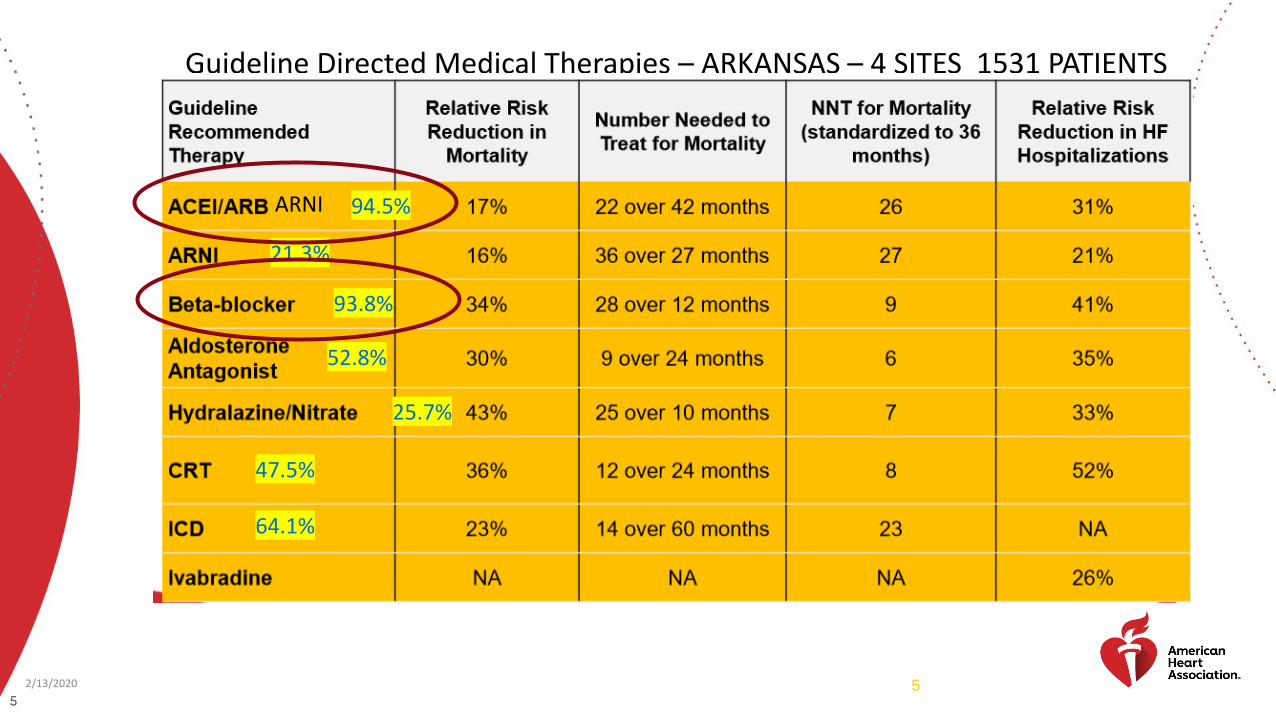
Guideline Directed Medical Therapies – ARKANSAS – 4 SITES 1531 PATIENTS
93.8%
94.5%
21.3%
52.8%
25.7%
47.5%
64.1%
ARNI
2/13/2020 5 5
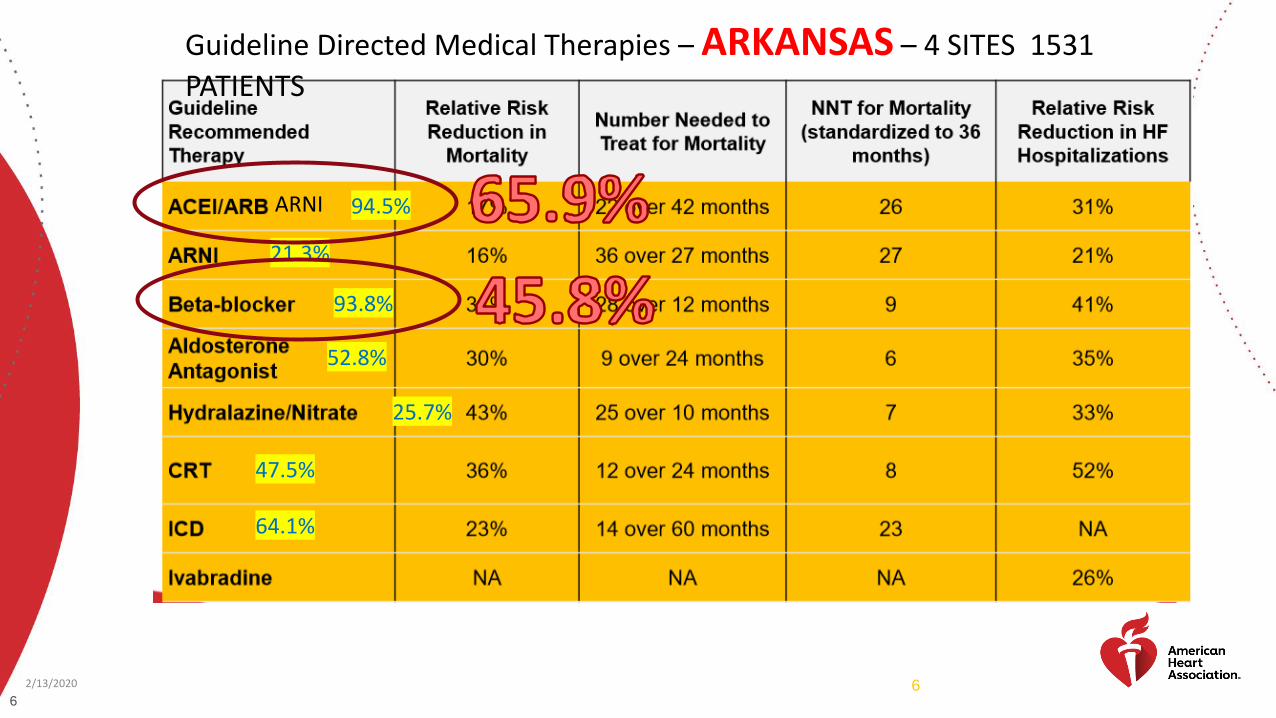
Guideline Directed Medical Therapies – ARKANSAS – 4 SITES 1531
PATIENTS
93.8%
94.5%
21.3%
52.8%
25.7%
47.5%
64.1%
ARNI
2/13/2020 6 6
7
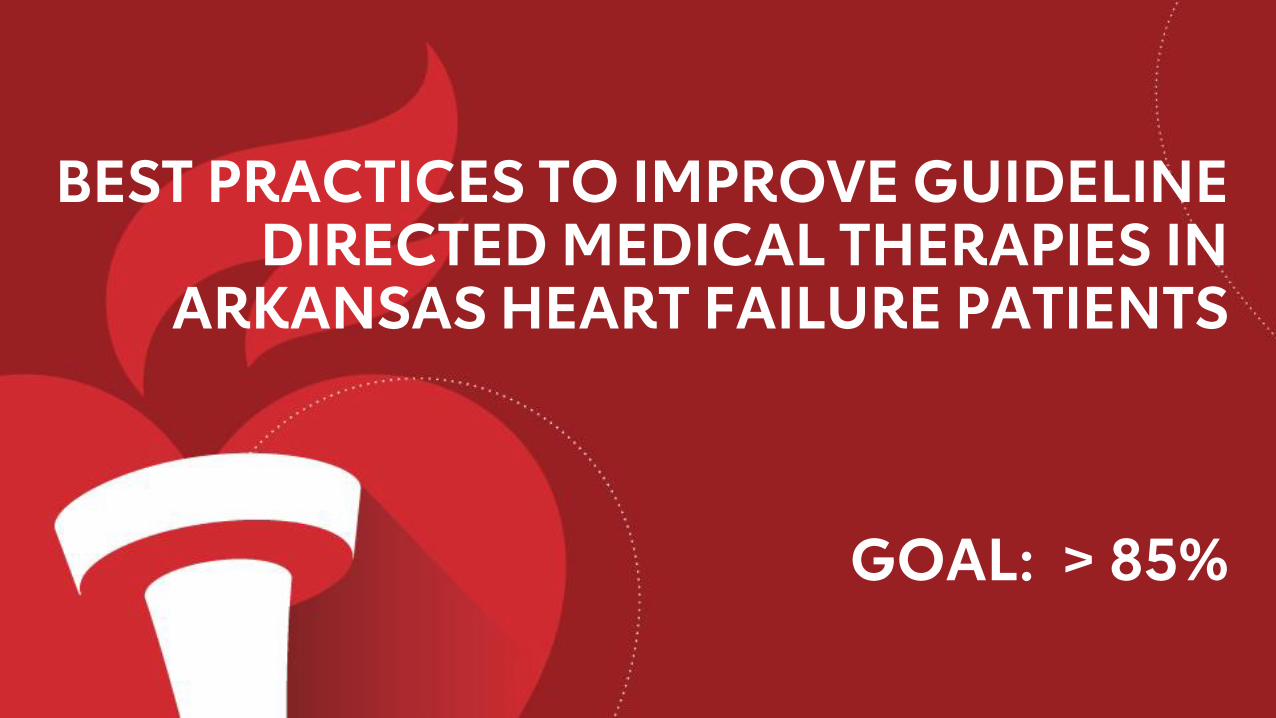
BEST PRACTICES TO IMPROVE GUIDELINE DIRECTED MEDICAL THERAPIES IN
ARKANSAS HEART FAILURE PATIENTS
GOAL: > 85%
Using Data Registries to Improve Care for Heart
Failure Patients Texas Health Arlington Memorial Hospital
January 2020
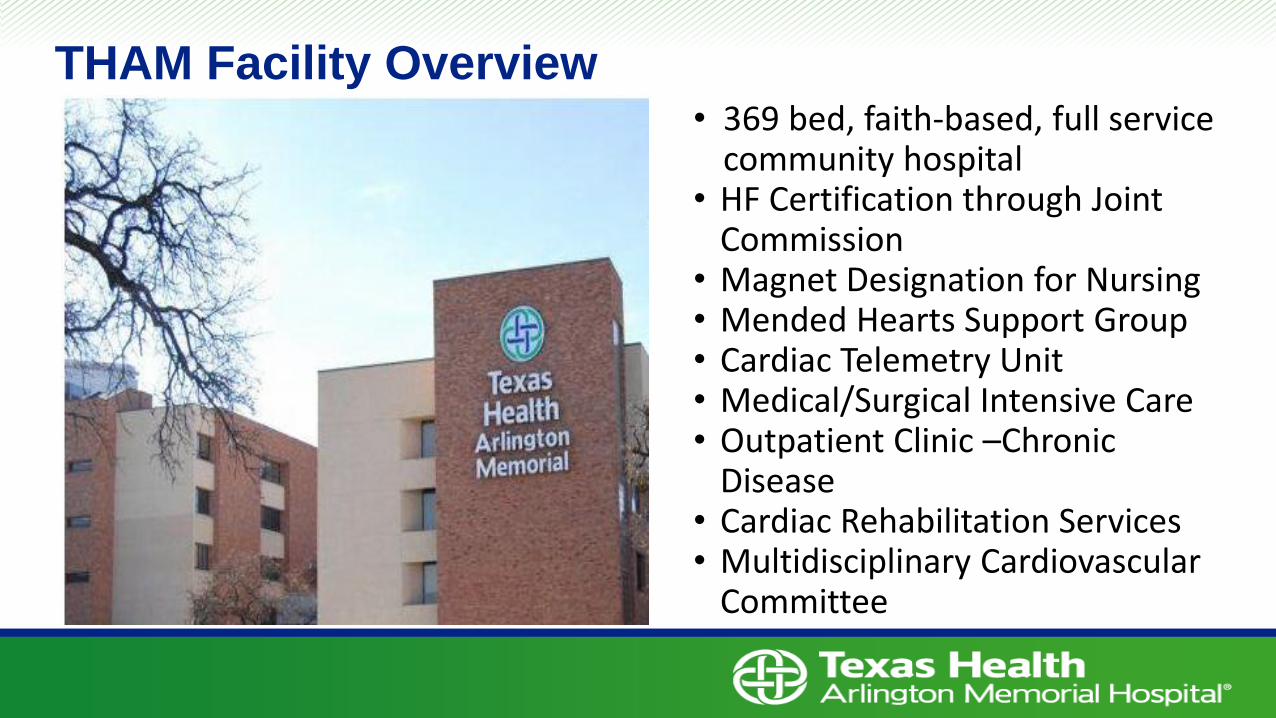
THAM Facility Overview • 369 bed, faith-based, full service
community hospital • HF Certification through Joint
Commission • Magnet Designation for Nursing • Mended Hearts Support Group • Cardiac Telemetry Unit • Medical/Surgical Intensive Care • Outpatient Clinic –Chronic
Disease • Cardiac Rehabilitation Services • Multidisciplinary Cardiovascular
Committee
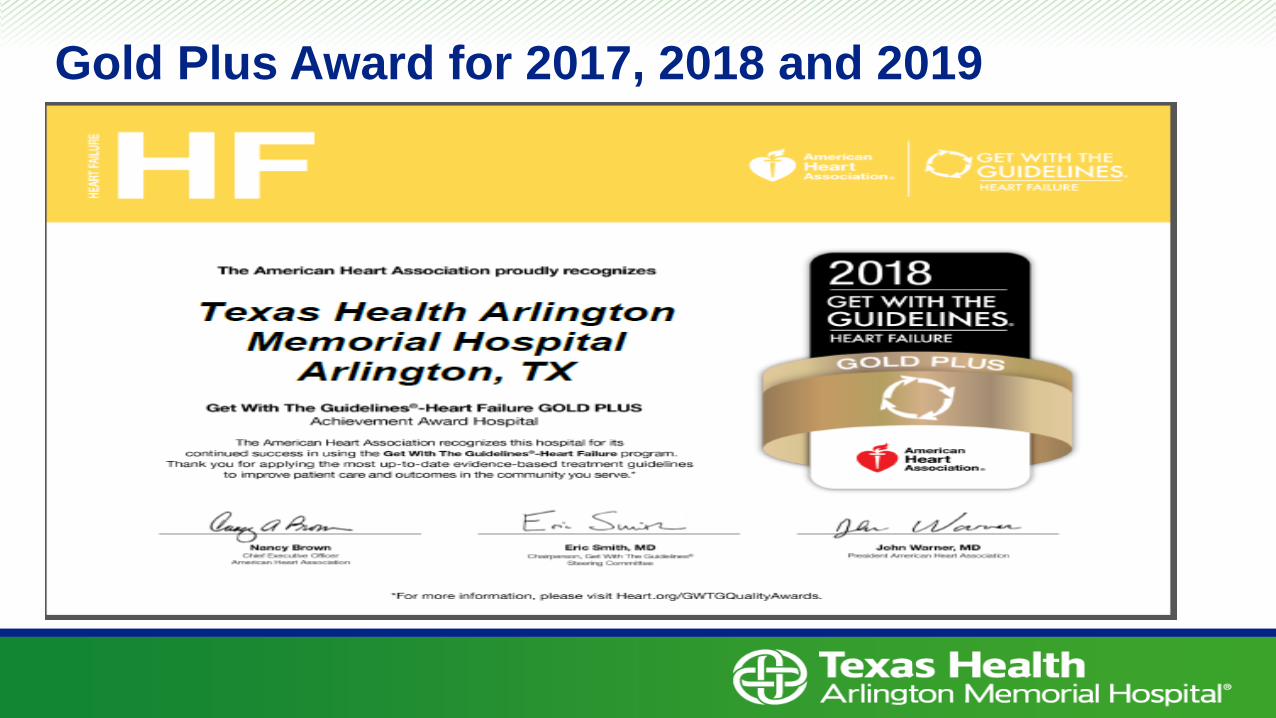
Gold Plus Award for 2017, 2018 and 2019
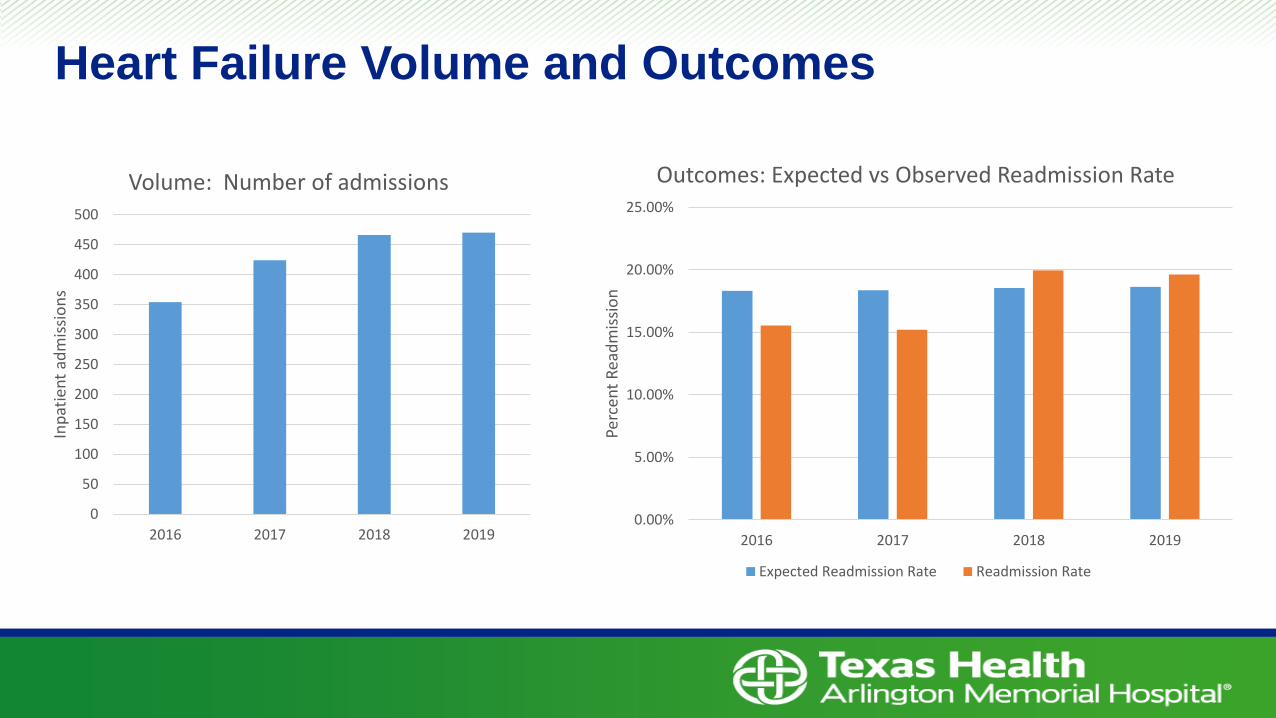
Heart Failure Volume and Outcomes
450
500
2016 2017 2018 2019
Inp
atie
nt
adm
issi
on
s
Volume: Number of admissions
20.00%
25.00%
Perc
ent
Rea
dm
issi
on
Outcomes: Expected vs Observed Readmission Rate
400
350
300
250
200
15.00%
10.00%
150
100 5.00%
50
0 0.00%
2016 2017 2018 2019
Expected Readmission Rate Readmission Rate
Collecting and Using Data Get With the Guidelines (GWTG) and Dashboards
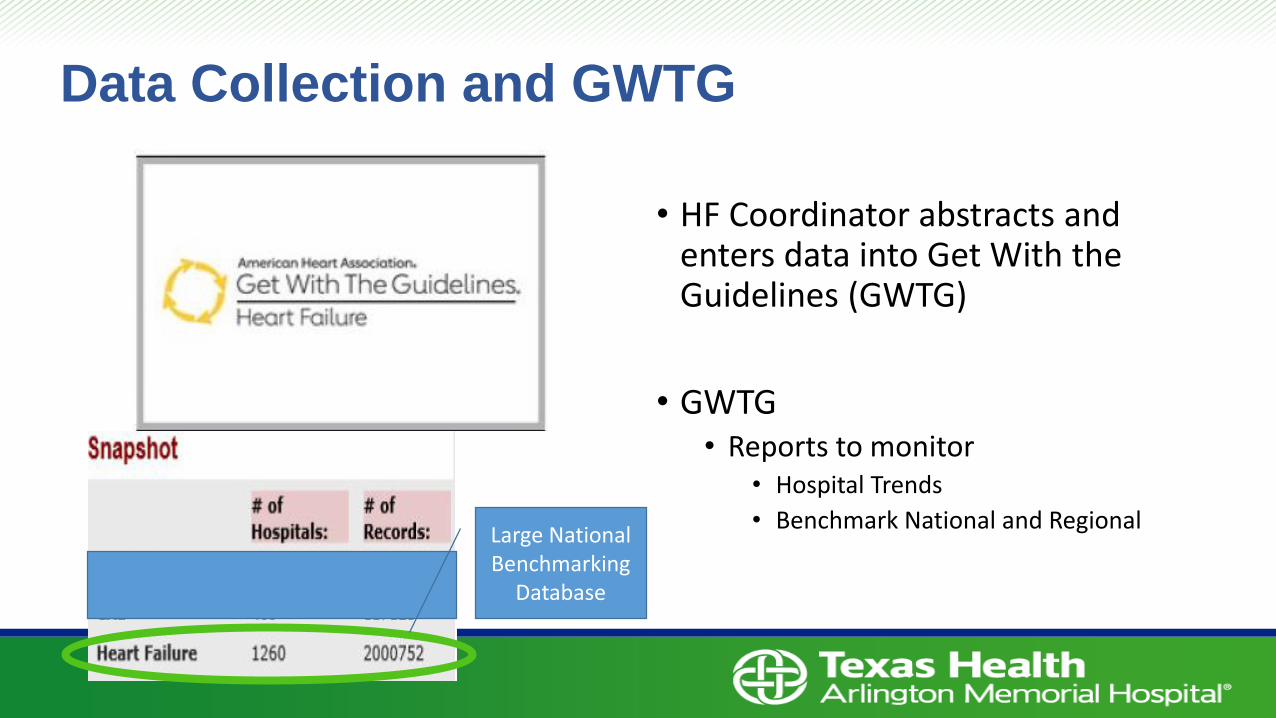
Data Collection and GWTG
• HF Coordinator abstracts and enters data into Get With the
Large National Benchmarking
Database
Guidelines (GWTG)
• GWTG • Reports to monitor
• Hospital Trends
• Benchmark National and Regional
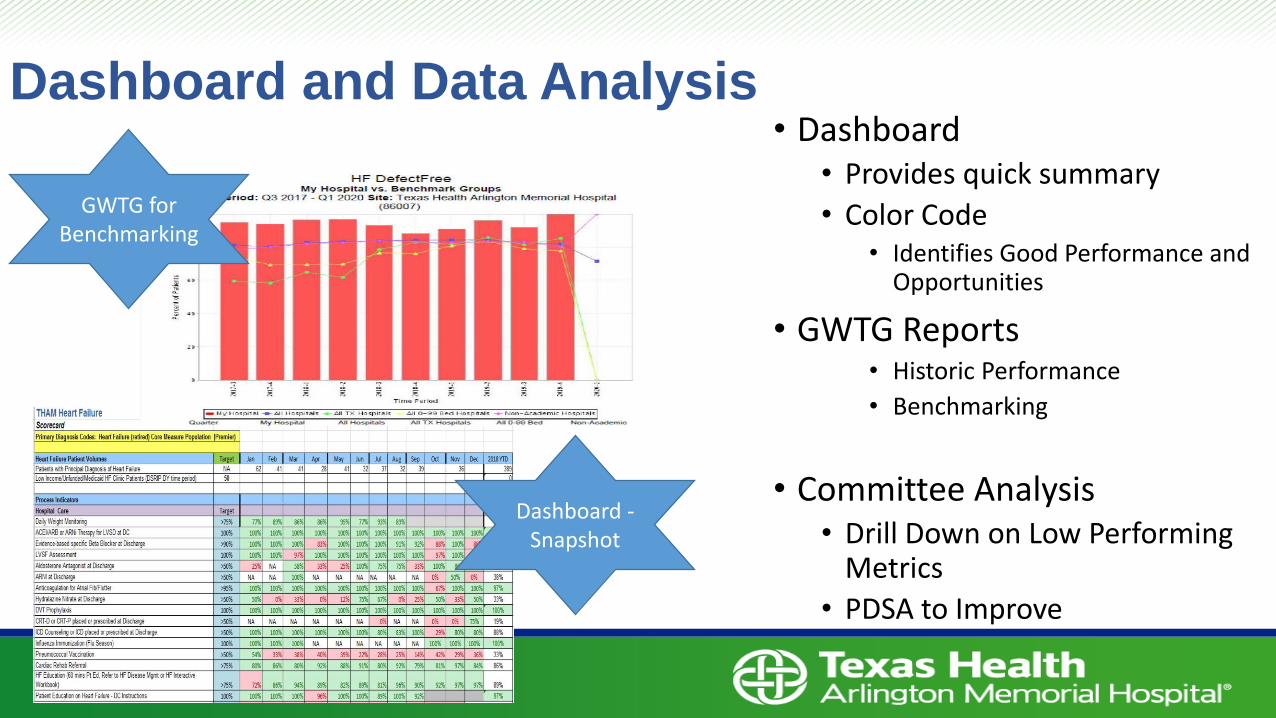
Dashboard and Data Analysis • Dashboard
• Provides quick summary
• Color Code • Identifies Good Performance and
Opportunities
• GWTG Reports • Historic Performance
• Benchmarking
• Committee Analysis • Drill Down on Low Performing
Metrics
• PDSA to Improve
GWTG for Benchmarking
Dashboard -Snapshot
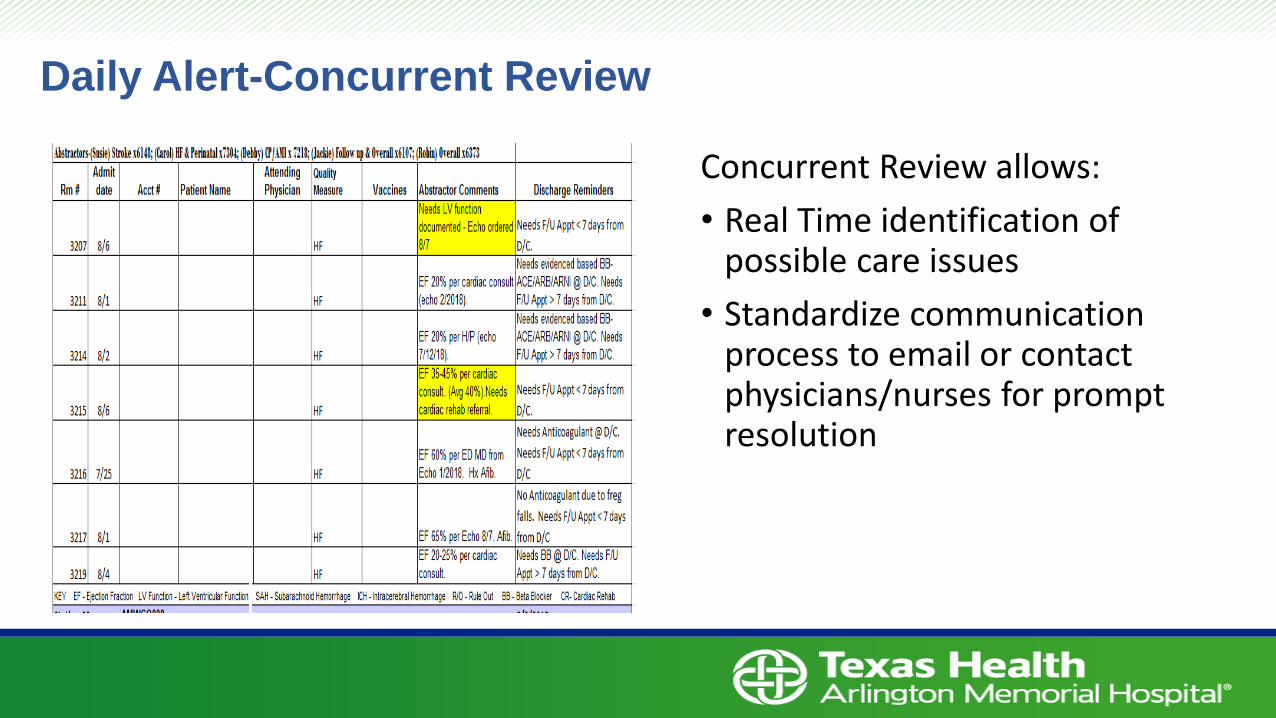
Daily Alert-Concurrent Review
Concurrent Review allows:
• Real Time identification of possible care issues
• Standardize communication process to email or contact physicians/nurses for prompt resolution
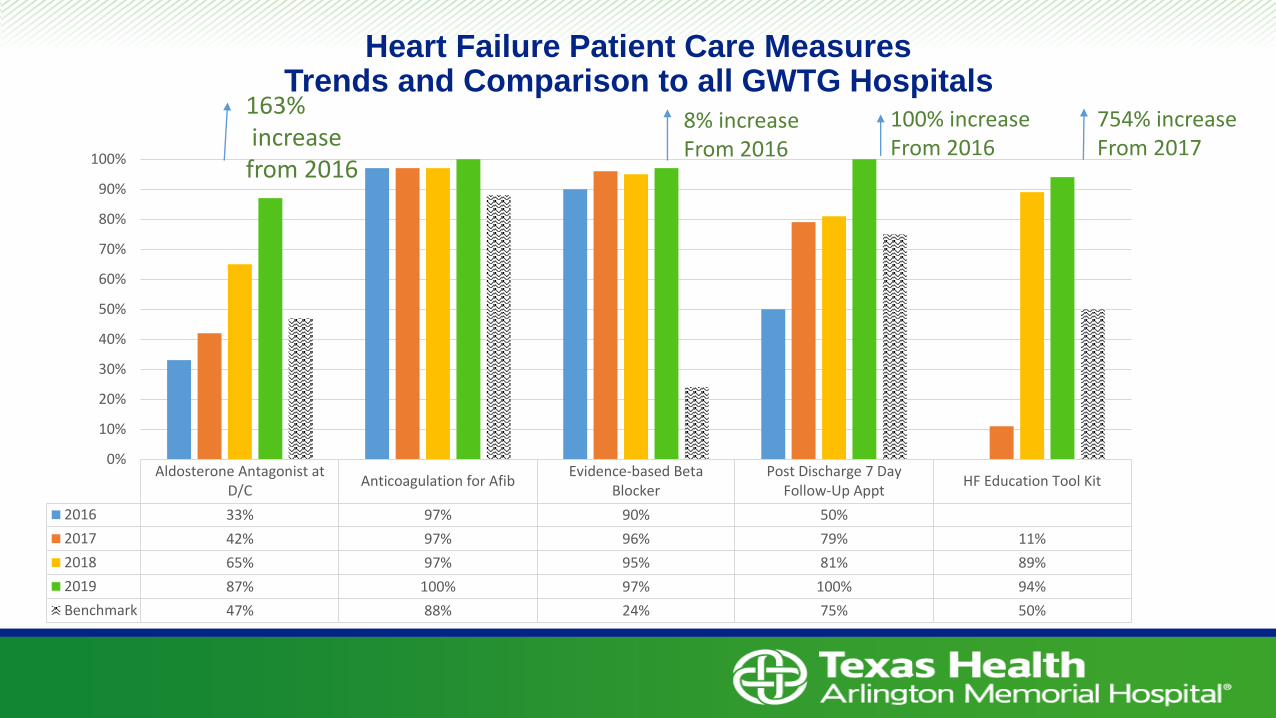
Aldosterone Antagonist at D/C
Anticoagulation for Afib Evidence-based Beta
Blocker Post Discharge 7 Day
Follow-Up Appt HF Education Tool Kit
2016 33% 97% 90% 50%
2017 42% 97% 96% 79% 11%
2018 65% 97% 95% 81% 89%
2019 87% 100% 97% 100% 94%
Benchmark 47% 88% 24% 75% 50%
0%
10%
20%
30%
40%
50%
60%
70%
80%
90%
100% from 2016
Heart Failure Patient Care Measures Trends and Comparison to all GWTG Hospitals
163% 8% increase 100% increase 754% increase
increase From 2016 From 2016 From 2017
Improving Performance Post Acute Care
Outpatient Chronic Care Clinic
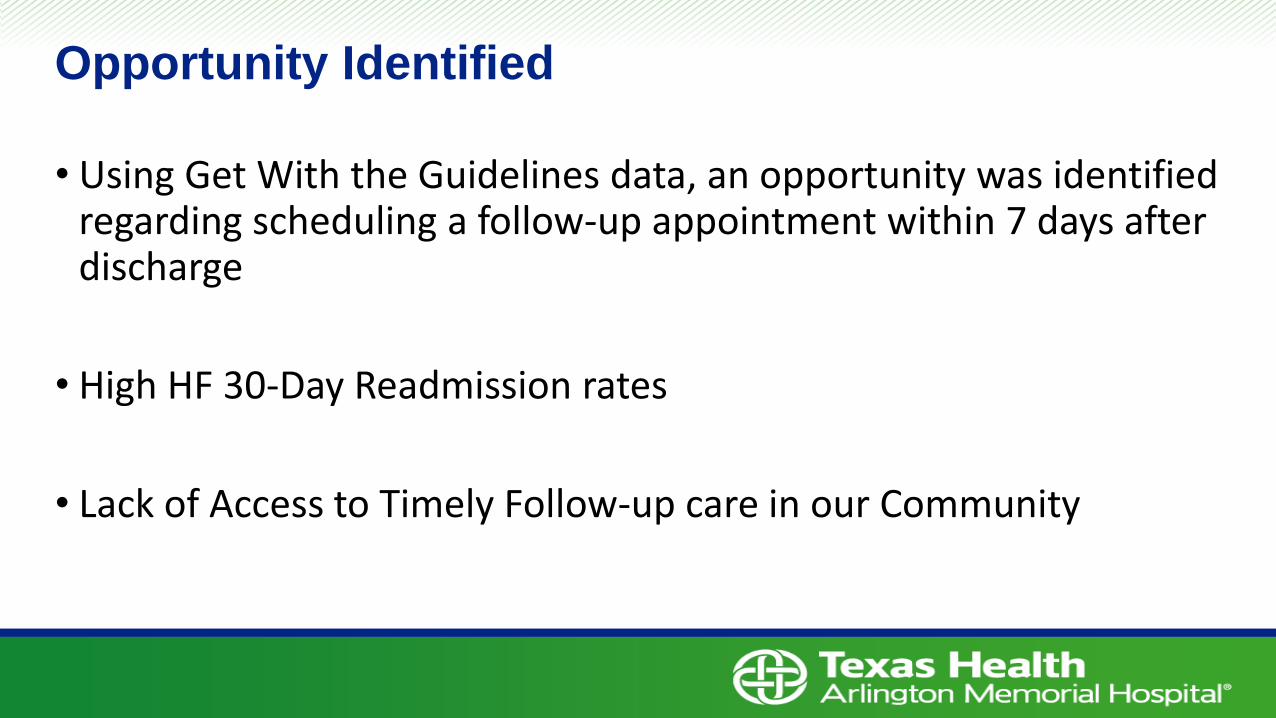
Opportunity Identified
• Using Get With the Guidelines data, an opportunity was identified regarding scheduling a follow-up appointment within 7 days after discharge
• High HF 30-Day Readmission rates
• Lack of Access to Timely Follow-up care in our Community
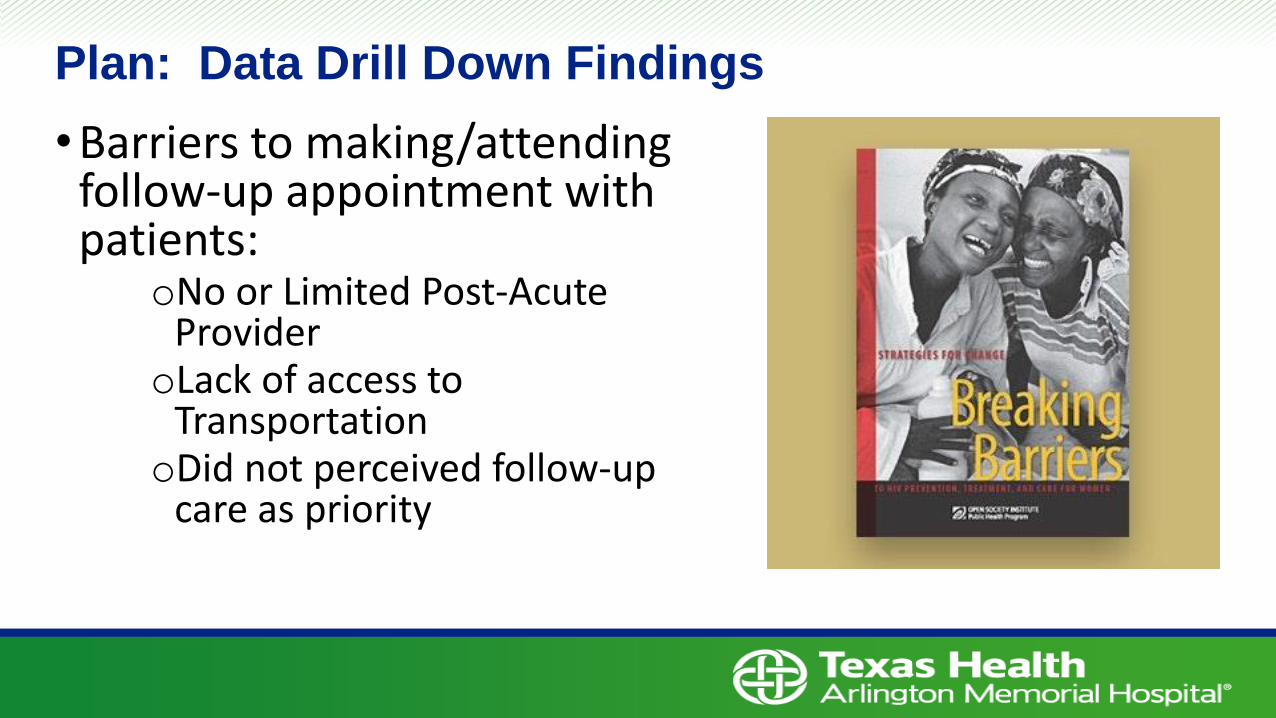
Plan: Data Drill Down Findings
• Barriers to making/attending follow-up appointment with patients:
oNo or Limited Post-Acute Provider oLack of access to
Transportation oDid not perceived follow-up
care as priority
Do: PI Actions to Improve
• Provide Appointment Prior to Discharge and include in DC Instruction
• Utilize Clinic as Bridge for timely FU if pt’s Provider not available within 3-7 days (or has no provider)
• Easy for Care Transitions to schedule appt • Computer order for FU Appointment coordination • Care Transition Staff ability to schedule • Phone access to Clinic Scheduler
• Educate patients on importance of scheduling/keeping follow-up appointments
• Provide patient information or arranged transportation for follow-up visit
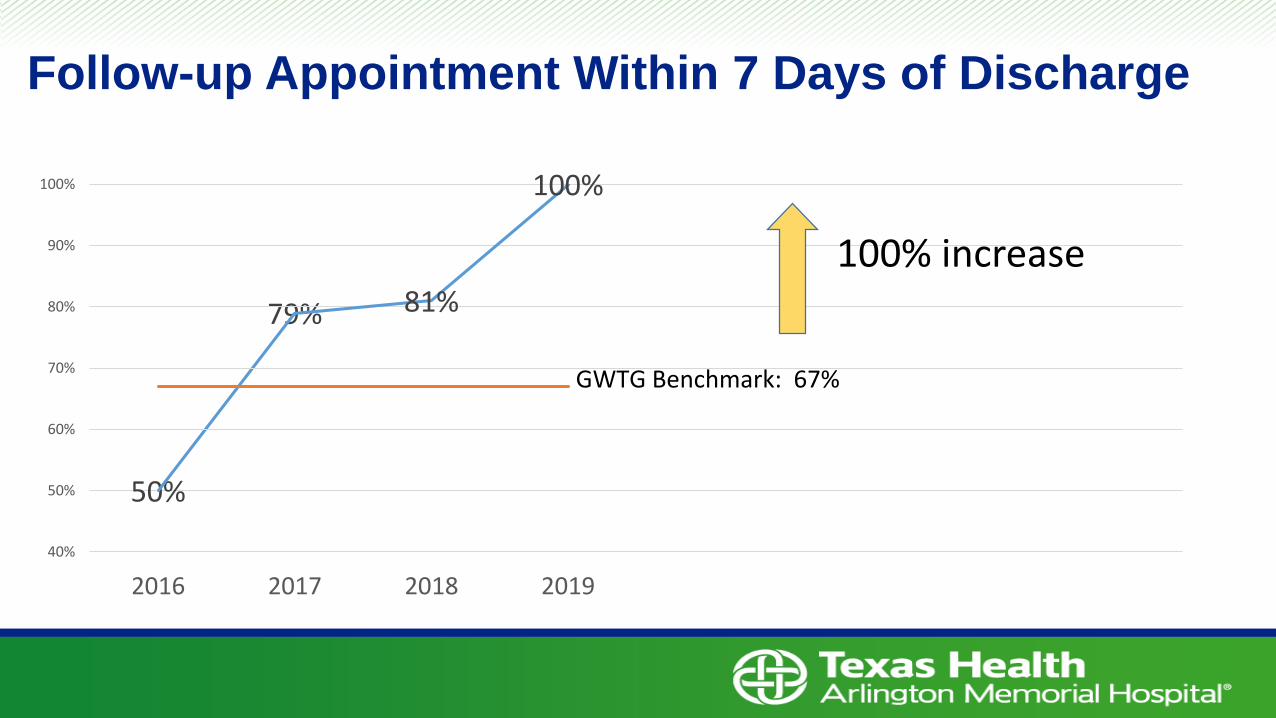
80% 79%
70% GWTG Benchmark: 67%
60%
50% 50%
Follow-up Appointment Within 7 Days of Discharge
81%
100%
90%
100%
100% increase
40%
2016 2017 2018 2019
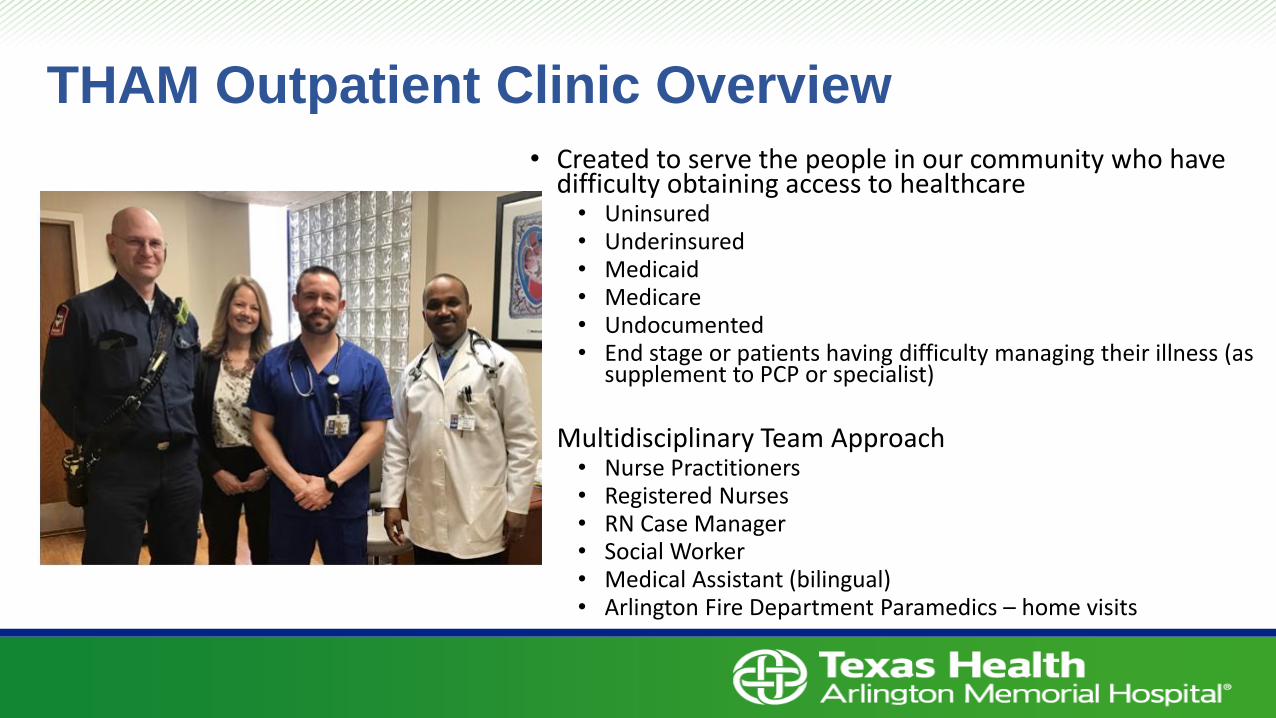
THAM Outpatient Clinic Overview
• Created to serve the people in our community who have difficulty obtaining access to healthcare
• Uninsured • Underinsured • Medicaid • Medicare • Undocumented • End stage or patients having difficulty managing their illness (as
supplement to PCP or specialist)
Multidisciplinary Team Approach • Nurse Practitioners • Registered Nurses • RN Case Manager • Social Worker • Medical Assistant (bilingual) • Arlington Fire Department Paramedics – home visits
•
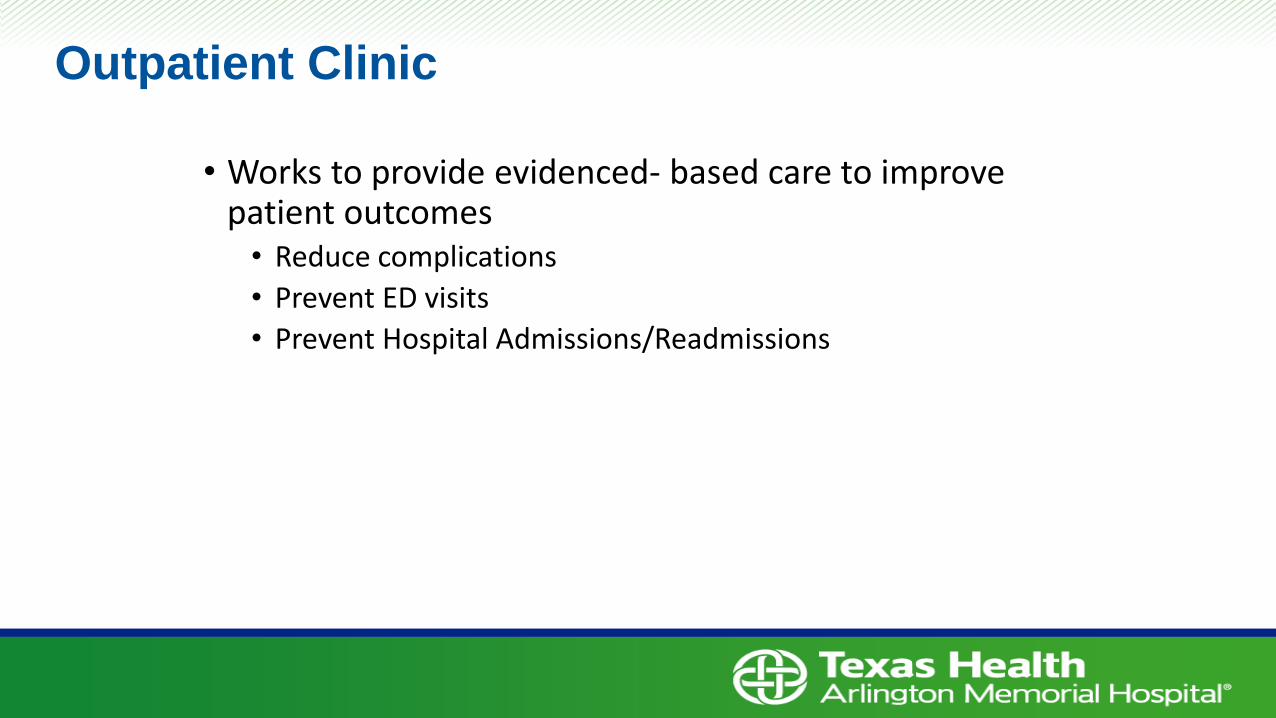
Outpatient Clinic
• Works to provide evidenced- based care to improve patient outcomes
• Reduce complications
• Prevent ED visits
• Prevent Hospital Admissions/Readmissions
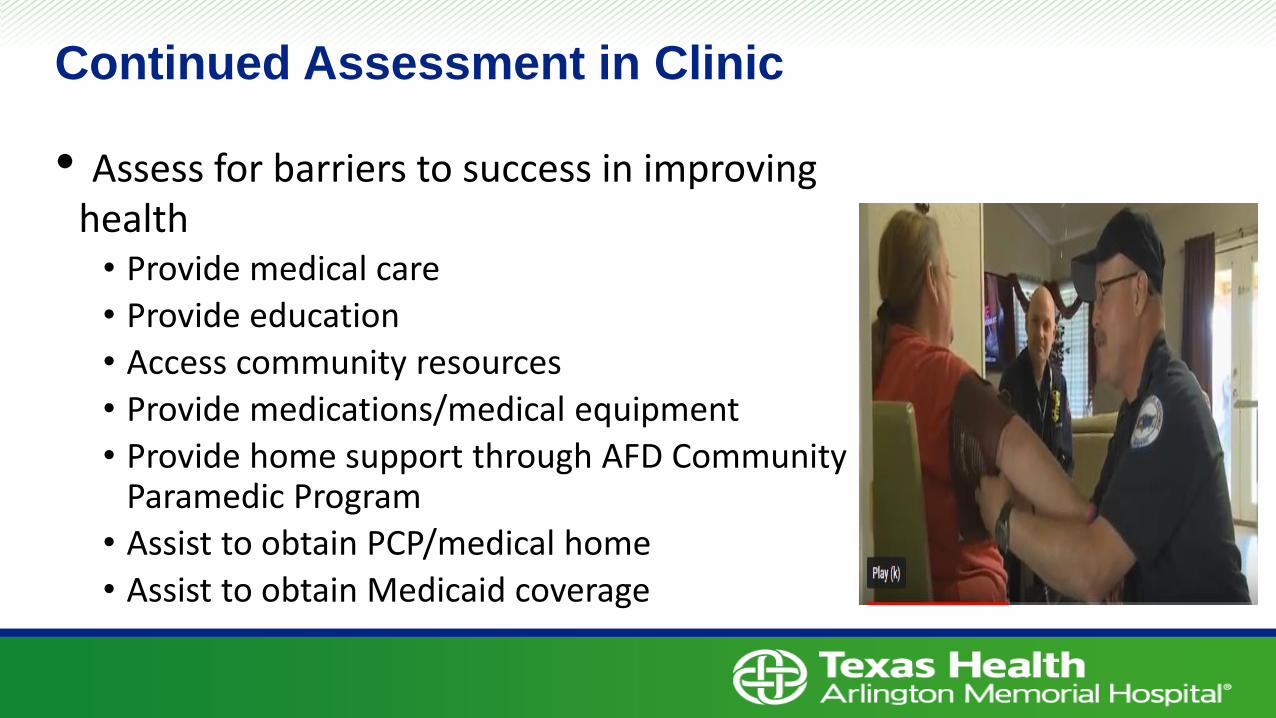
Continued Assessment in Clinic
• Assess for barriers to success in improving health
• Provide medical care
• Provide education
• Access community resources
• Provide medications/medical equipment
• Provide home support through AFD Community Paramedic Program
• Assist to obtain PCP/medical home
• Assist to obtain Medicaid coverage
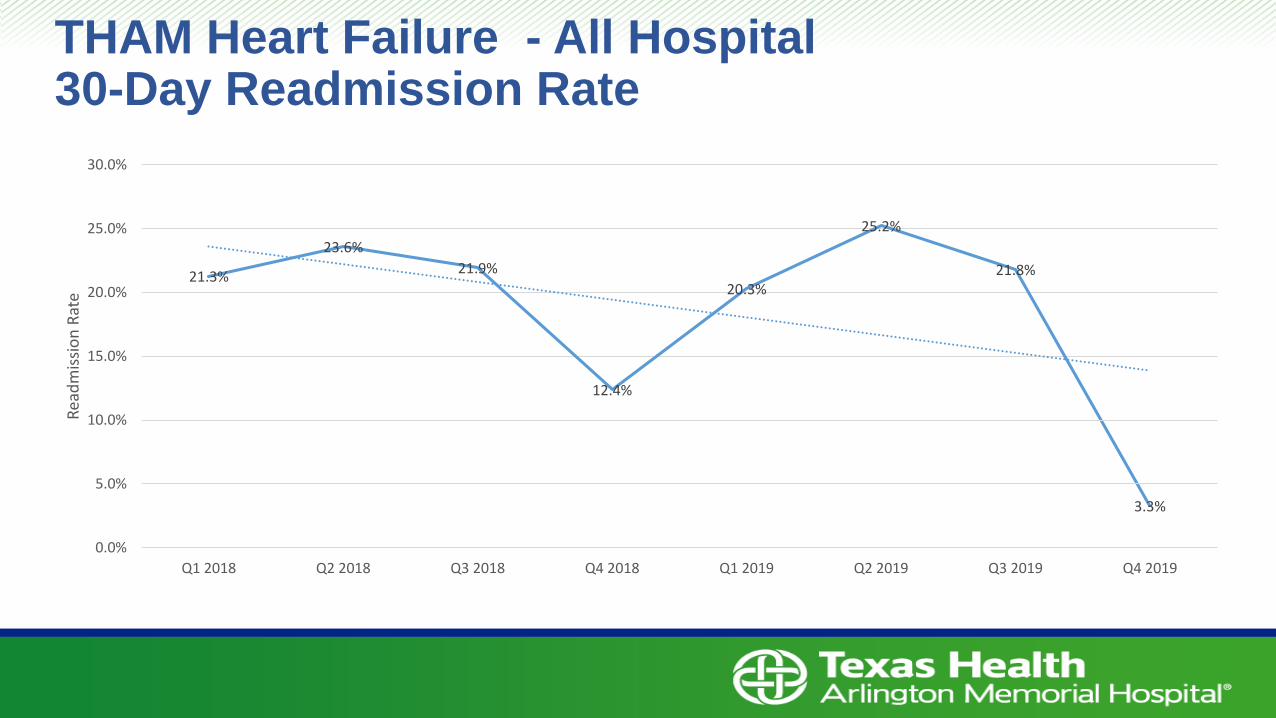
THAM Heart Failure - All Hospital 30-Day Readmission Rate
21.3%
23.6%
21.9%
12.4%
20.3%
25.2%
21.8%
3.3%
5.0%
10.0%
15.0%
20.0%
25.0%
30.0%
Rea
dm
issi
on
Rat
e
0.0%
Q1 2018 Q2 2018 Q3 2018 Q4 2018 Q1 2019 Q2 2019 Q3 2019 Q4 2019
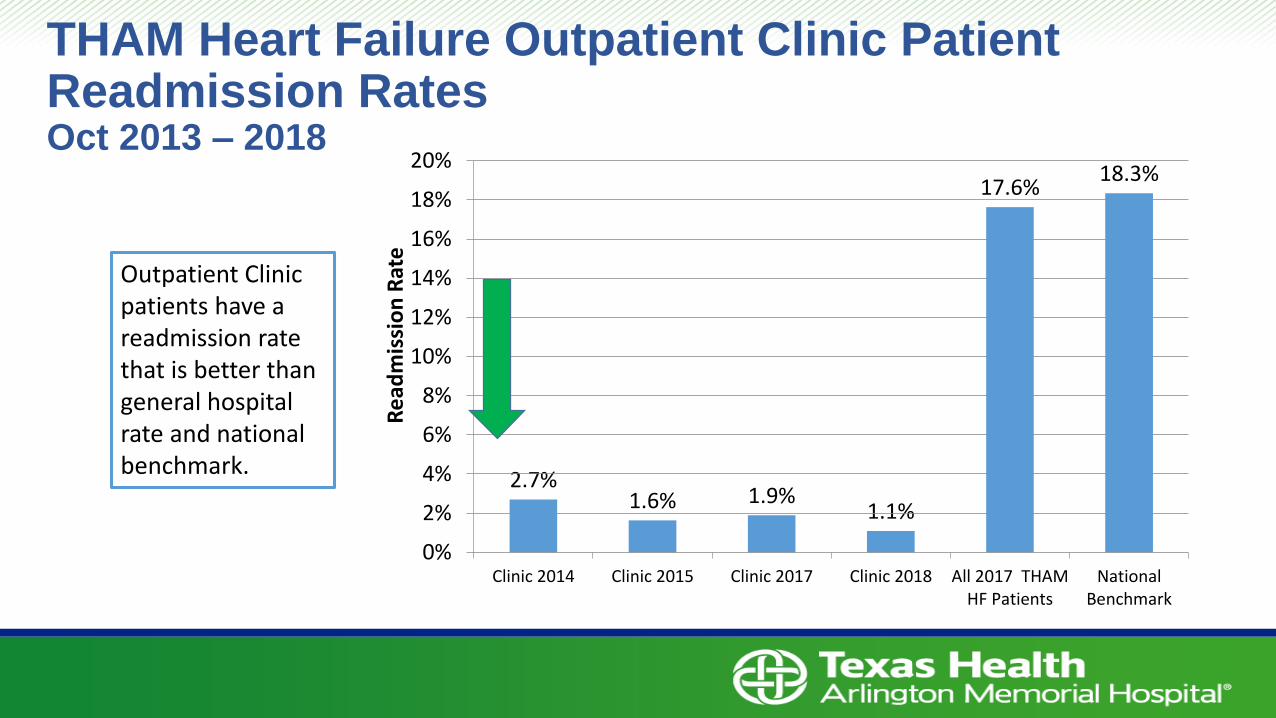
THAM Heart Failure Outpatient Clinic Patient Readmission Rates Oct 2013 – 2018
Outpatient Clinic patients have a readmission rate that is better than general hospital rate and national benchmark.
Re
adm
issi
on
Rat
e
20%
18%
16%
14%
12%
10%
8%
6%
4%
2%
0% Clinic 2014 Clinic 2015 Clinic 2017 Clinic 2018 All 2017 THAM National
HF Patients Benchmark
17.6% 18.3%
ris
Be
tte
Low
er
2.7% 1.6% 1.9%
1.1%
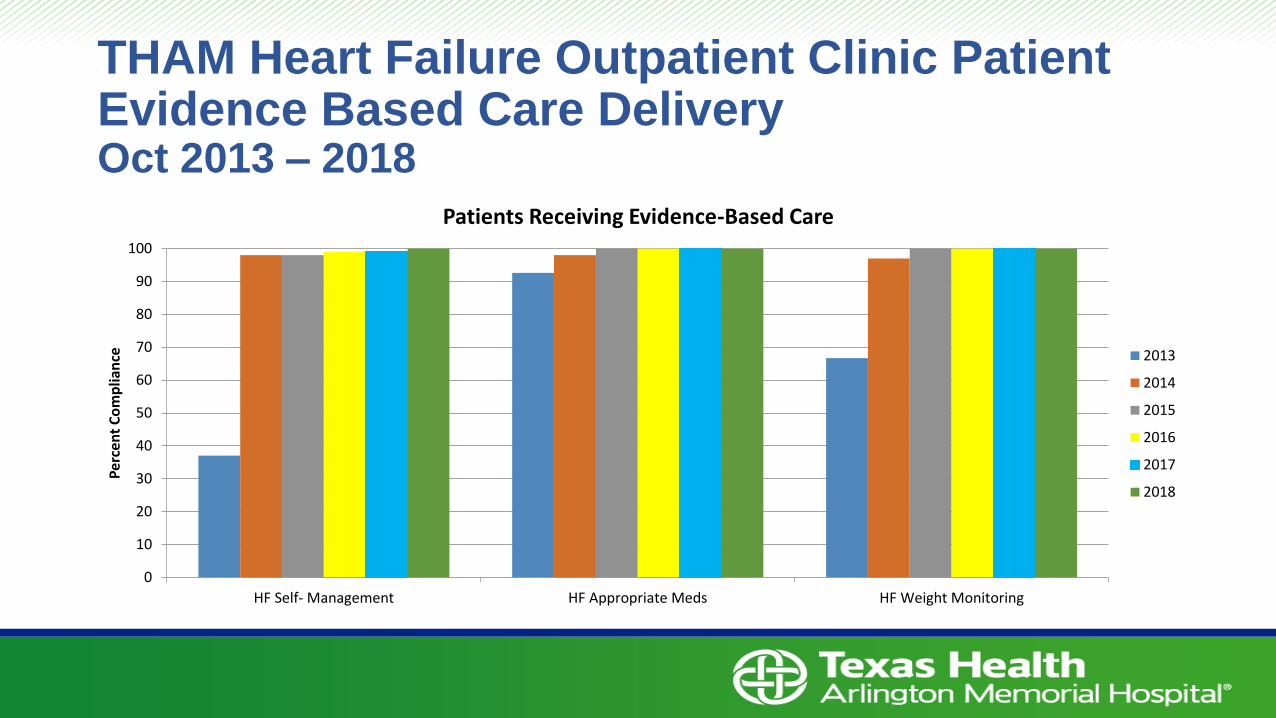
THAM Heart Failure Outpatient Clinic Patient Evidence Based Care Delivery Oct 2013 – 2018
Patients Receiving Evidence-Based Care
Per
cen
t C
om
plia
nce
100
90
80
70
60
50
40
30
20
10
0
2013
2014
2015
2016
2017
2018
HF Self- Management HF Appropriate Meds HF Weight Monitoring
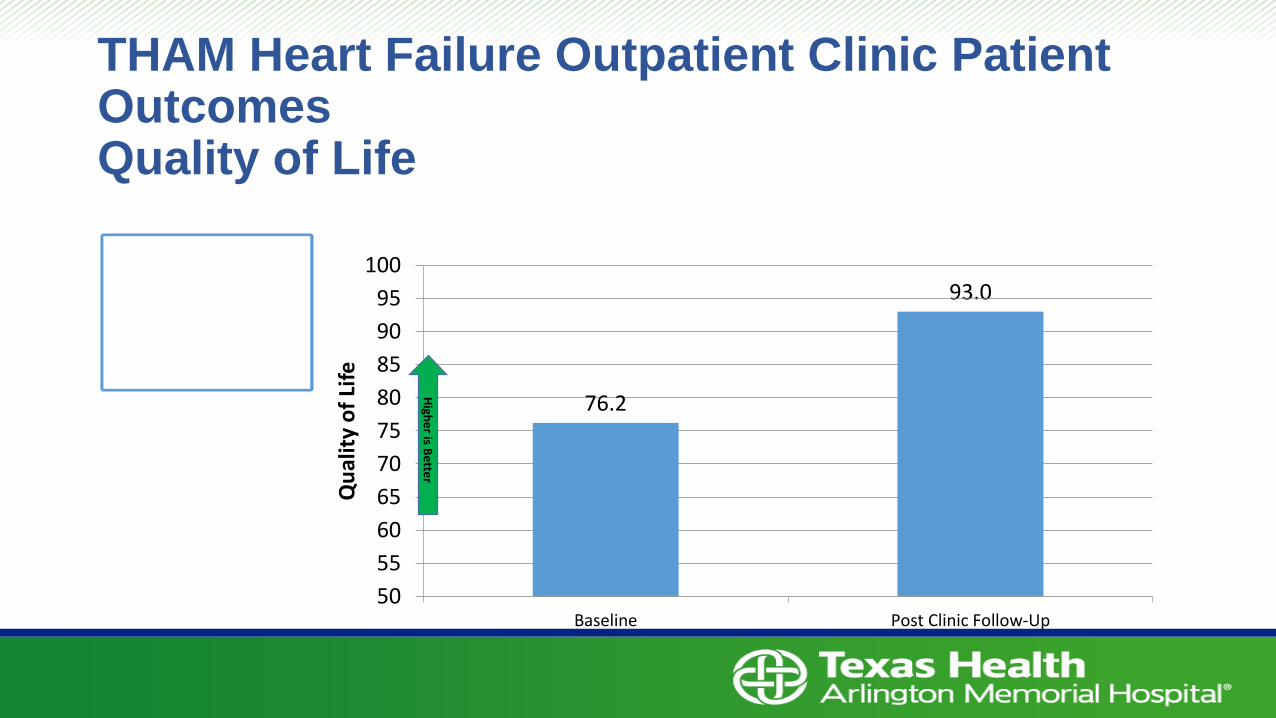
THAM Heart Failure Outpatient Clinic Patient Outcomes Quality of Life
76.2
93.0
50
55
60
65
70
75
80
85
90
95
100
Qu
alit
y o
f Li
fe
High
er is B
ette
r
HF Clinic Patient Quality of Life
Scores improved by 22.1%
Baseline Post Clinic Follow-Up
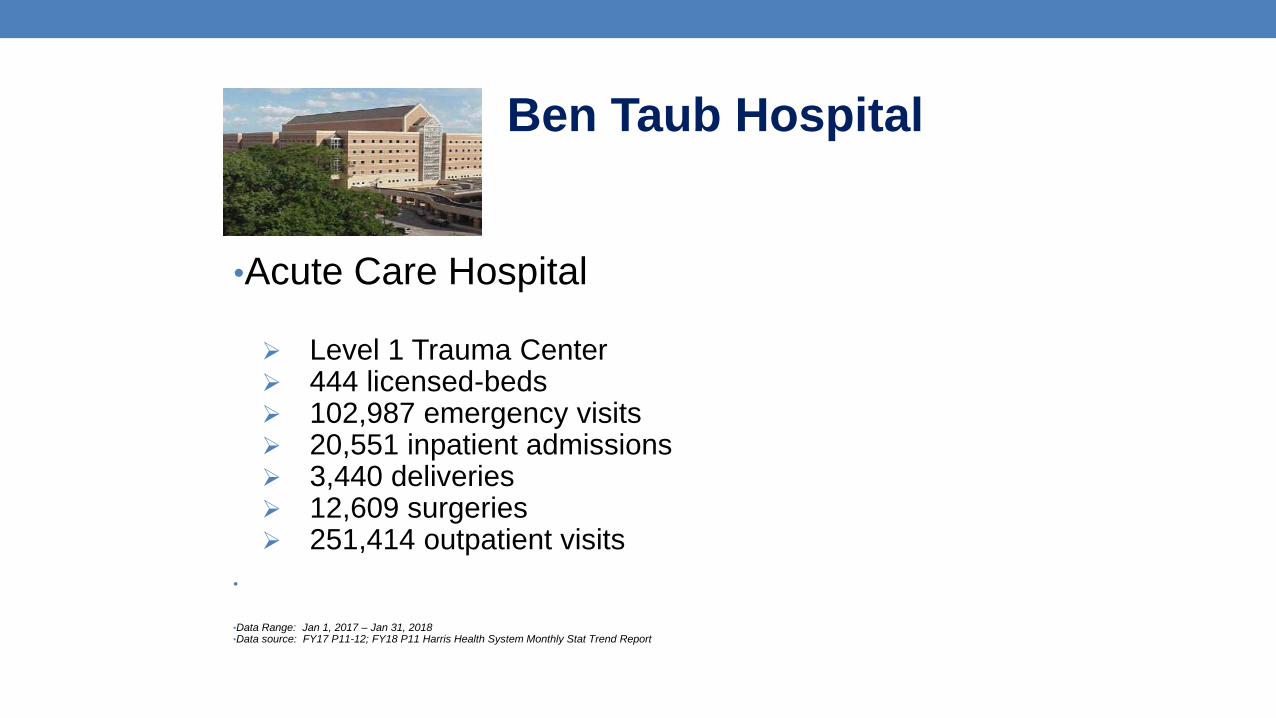
Ben Taub Hospital
•Acute Care Hospital
➢ Level 1 Trauma Center ➢ 444 licensed-beds ➢ 102,987 emergency visits ➢ 20,551 inpatient admissions ➢ 3,440 deliveries ➢ 12,609 surgeries ➢ 251,414 outpatient visits
•
•Data Range: Jan 1, 2017 – Jan 31, 2018 •Data source: FY17 P11-12; FY18 P11 Harris Health System Monthly Stat Trend Report
Baseline State of CHF Management at Our Institution
Largely Unknown
The only measure reported was readmission and mortality\
Reason: Switch from Joint Commission Accreditation to DNV
DNV does not require to monitor CHF Core measures
Value of Clinical Data Registry
• Clinical data registries provide significant data on:
• Use of evidence-based practice guidelines to evaluate proportion of patients receiving recommended treatment
• Compare the effectiveness of different treatments for the same disease or condition
• Evaluate different approaches to a procedure and to monitor the safety of implanted devices
• Support health care education, accreditation and certification.
• Ensure that payment is adjusted based on the quality of care provided
• Give patients the information they need to make better choices
Value of Registry to CHF Management at Ben Taub
• Foundation to establish a program with minimal financial investment
• Commitment from administration to support the program
• Increased physician awareness and compliance with GRT in CHF
• Establish metrics to drive quality care in CHF
Get With The Guidelines®- HF
• 702 U. S. hospitals are participating in the American Heart
Association’s GWTG – Heart Failure program
• Ben Taub Hospital/Baylor was awarded a grant from the AHA to
participate in this program
• Program started in mid Feb 2018
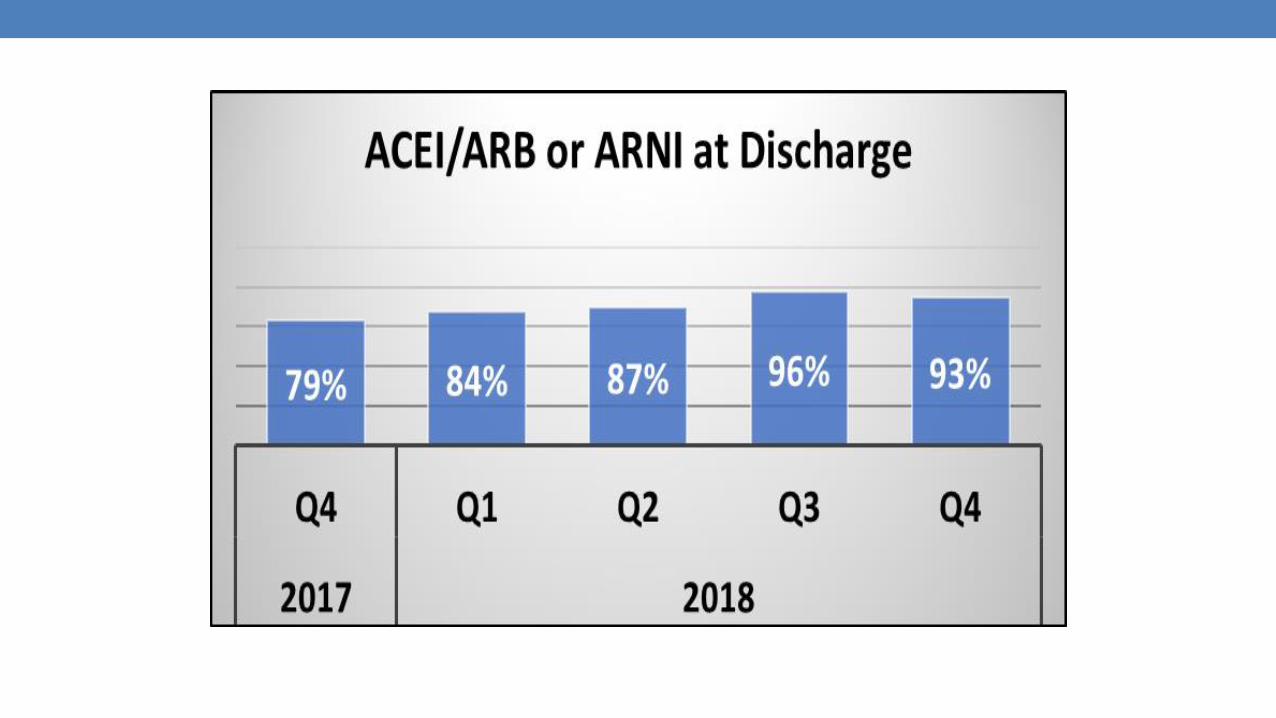
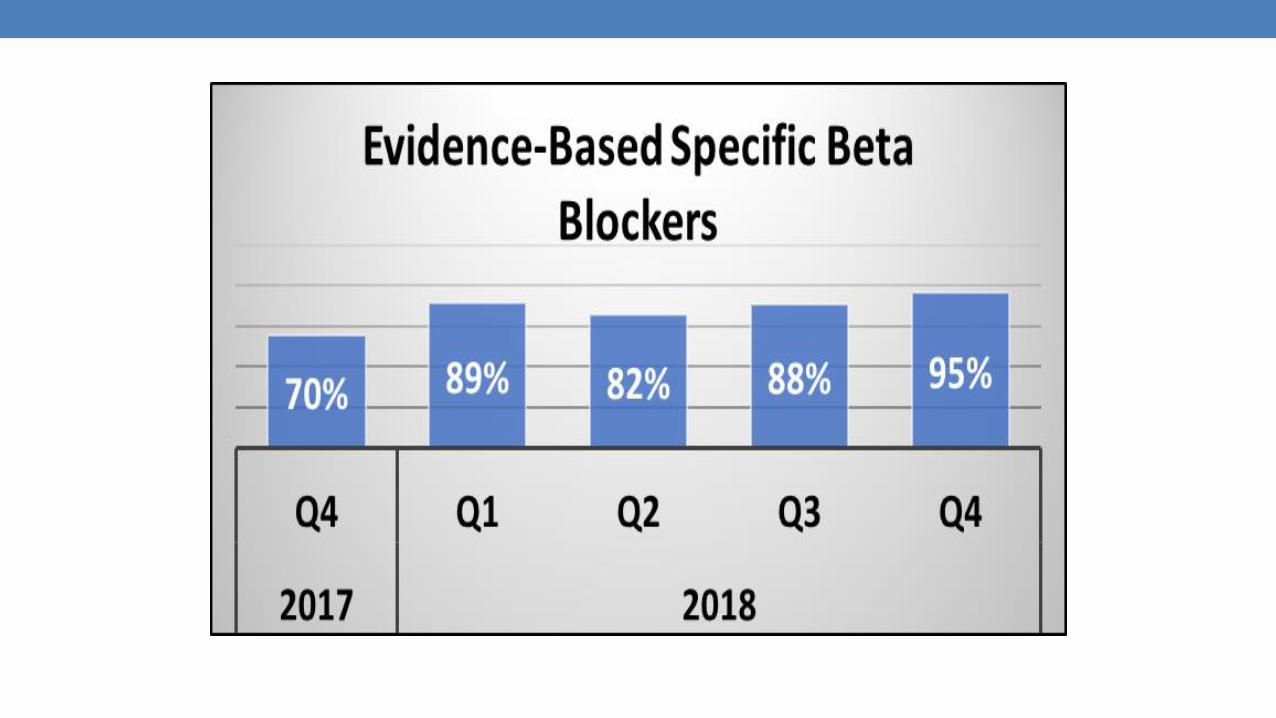
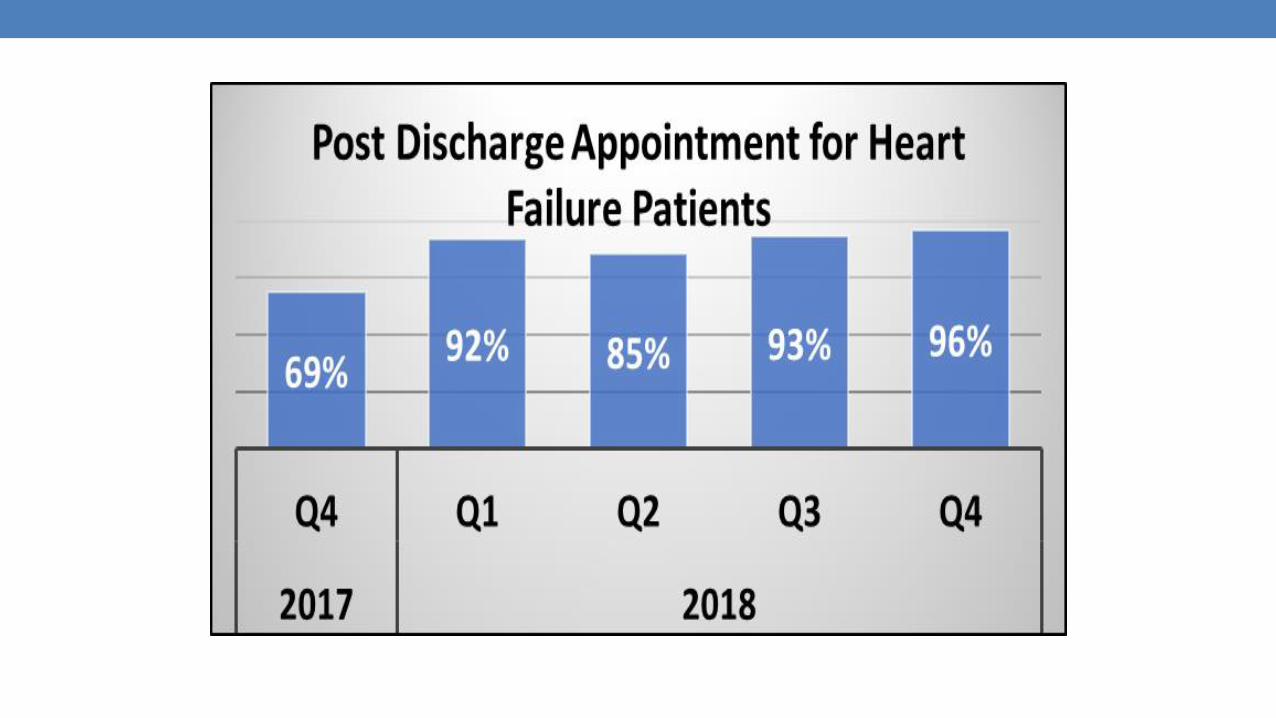
Get With The Guidelines® - HF Achievement Measures
• Evidence-based beta blockers
• Angiotensin converting enzyme inhibitor (ACEI) and angiotensin
receptor blocker (ARB), or ARNI at discharge
• Measure left ventricular function (EF by Echo, Nuc or cath)
• Post-discharge appointment for HF patients
• Readmission at 30 days
Get With The Guidelines® - HF Other Quality Measures
• Aldosterone antagonist at discharge
• Anticoagulation for atrial fibrillation
• Hydralazine/nitrate at discharge
• DVT prophylaxis
• CRT-D or CRT-P placed or prescribed at discharge
• ICD counseling or ICD placed or prescribed at discharge
• Influenza vaccination during flu season
• Pneumococcal vaccination
• Follow-up visit within 7 days or less
Initiative by BT Cardiology for
Coordination of Care
• Hospital Executives /Internal Med and out patient clinic leadership /Cardiology leadership
• Nursing Leaders
• Allied Services:
• Social work, Pharmacy, Dietary, Home Health
• IT personnel
• Quality Department
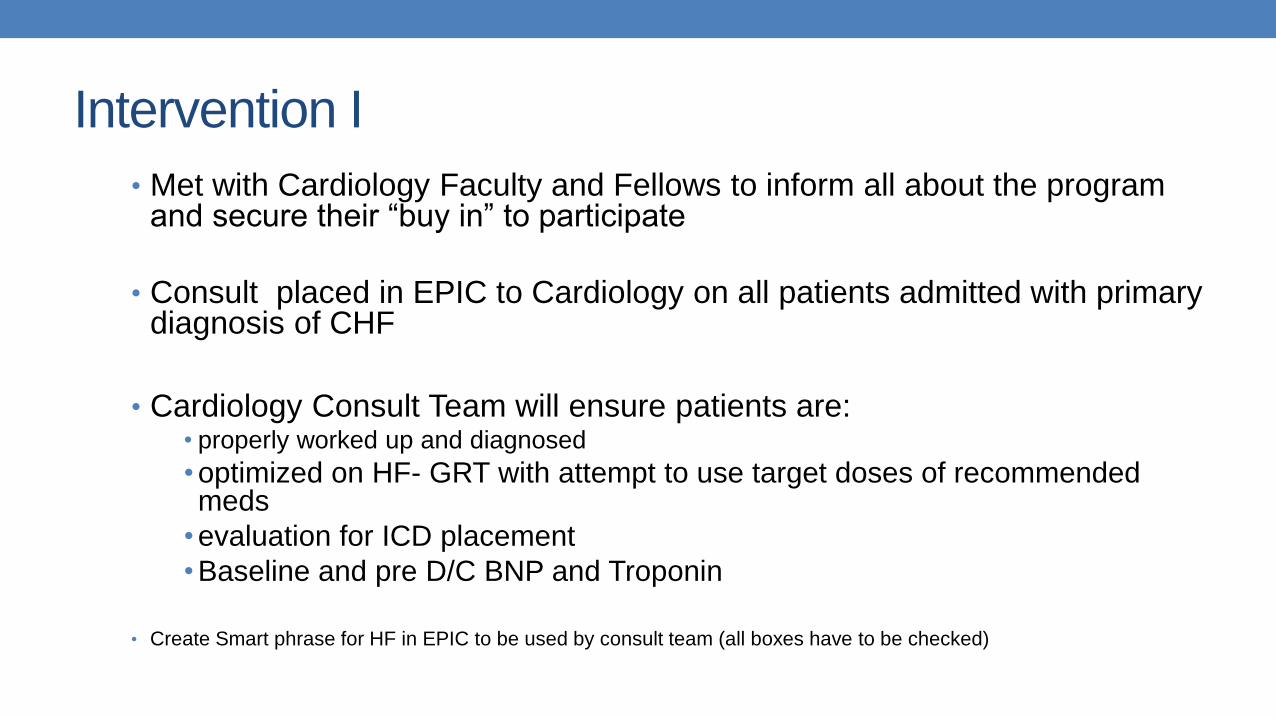
Intervention I
• Met with Cardiology Faculty and Fellows to inform all about the program and secure their “buy in” to participate
• Consult placed in EPIC to Cardiology on all patients admitted with primary diagnosis of CHF
• Cardiology Consult Team will ensure patients are: • properly worked up and diagnosed
• optimized on HF- GRT with attempt to use target doses of recommended meds
• evaluation for ICD placement
• Baseline and pre D/C BNP and Troponin
• Create Smart phrase for HF in EPIC to be used by consult team (all boxes have to be checked)
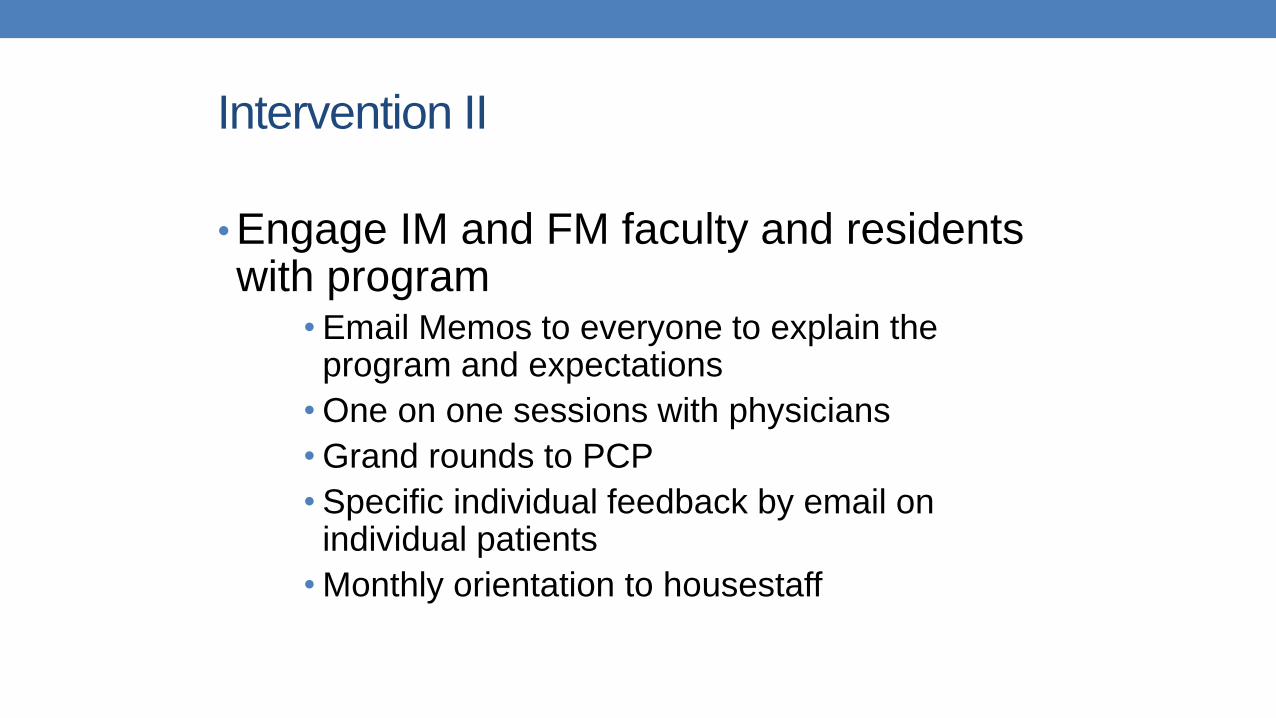
Intervention II
• Engage IM and FM faculty and residents with program
• Email Memos to everyone to explain the program and expectations
• One on one sessions with physicians
• Grand rounds to PCP
• Specific individual feedback by email on individual patients
• Monthly orientation to housestaff
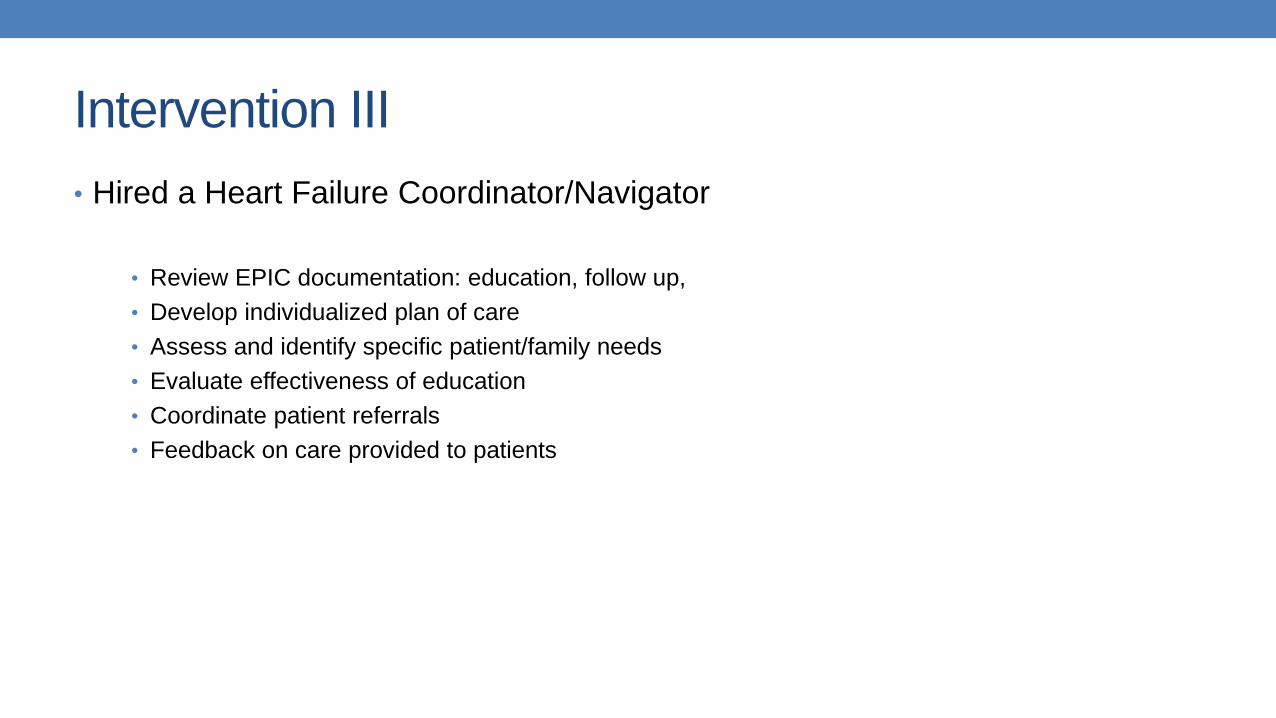
Intervention III
• Hired a Heart Failure Coordinator/Navigator
• Review EPIC documentation: education, follow up,
• Develop individualized plan of care
• Assess and identify specific patient/family needs
• Evaluate effectiveness of education
• Coordinate patient referrals
• Feedback on care provided to patients
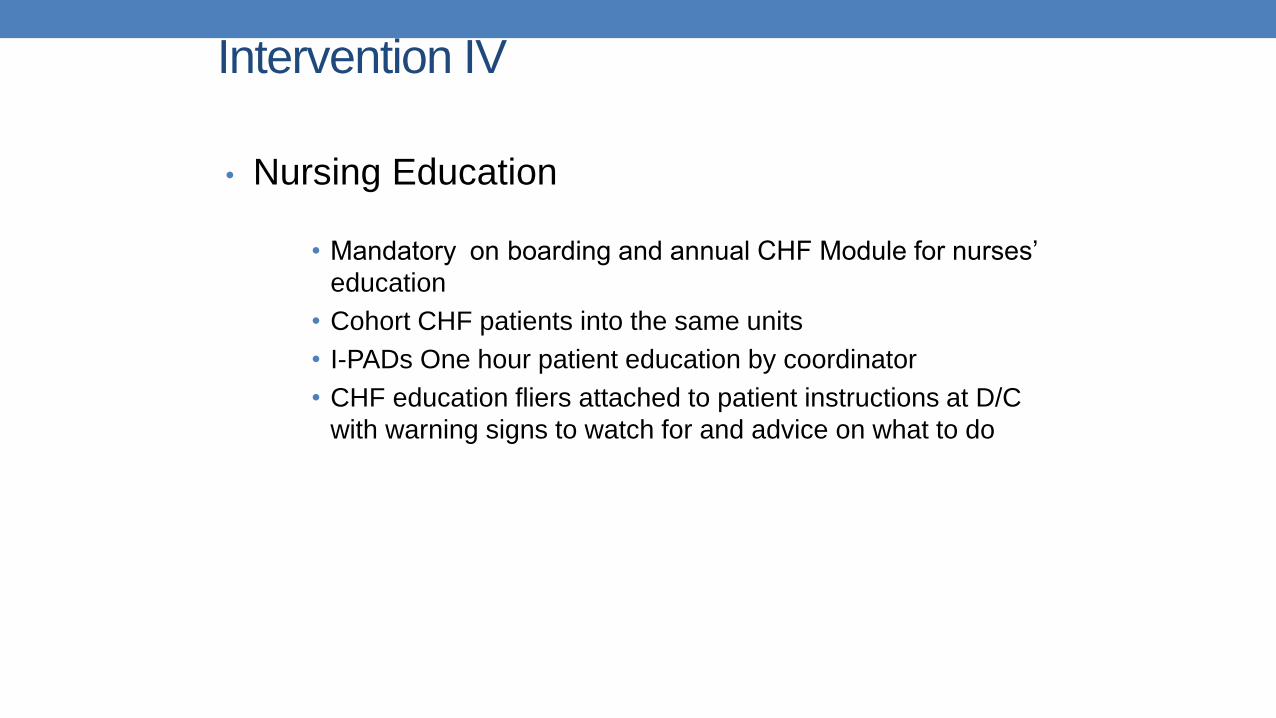
Intervention IV
• Nursing Education
• Mandatory on boarding and annual CHF Module for nurses’ education
• Cohort CHF patients into the same units
• I-PADs One hour patient education by coordinator
• CHF education fliers attached to patient instructions at D/C
with warning signs to watch for and advice on what to do
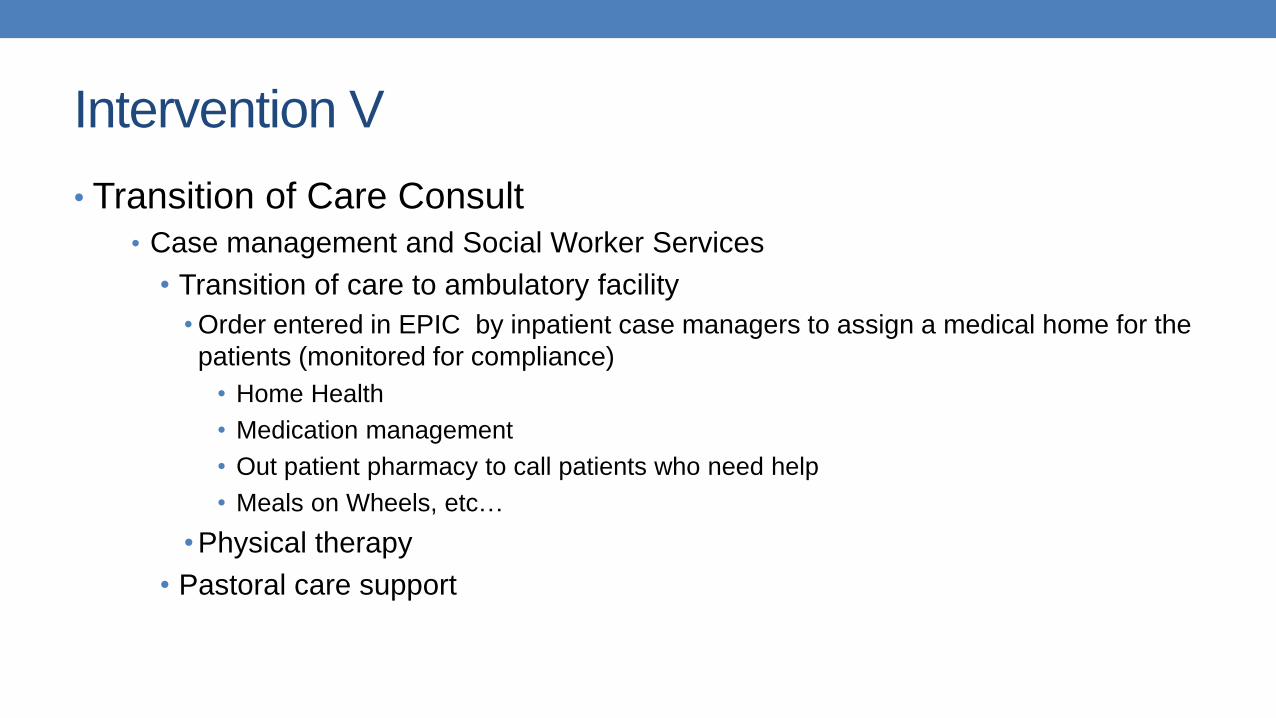
Intervention V
• Transition of Care Consult
• Case management and Social Worker Services
• Transition of care to ambulatory facility
• Order entered in EPIC by inpatient case managers to assign a medical home for the
patients (monitored for compliance)
• Home Health
• Medication management
• Out patient pharmacy to call patients who need help
• Meals on Wheels, etc…
• Physical therapy
• Pastoral care support
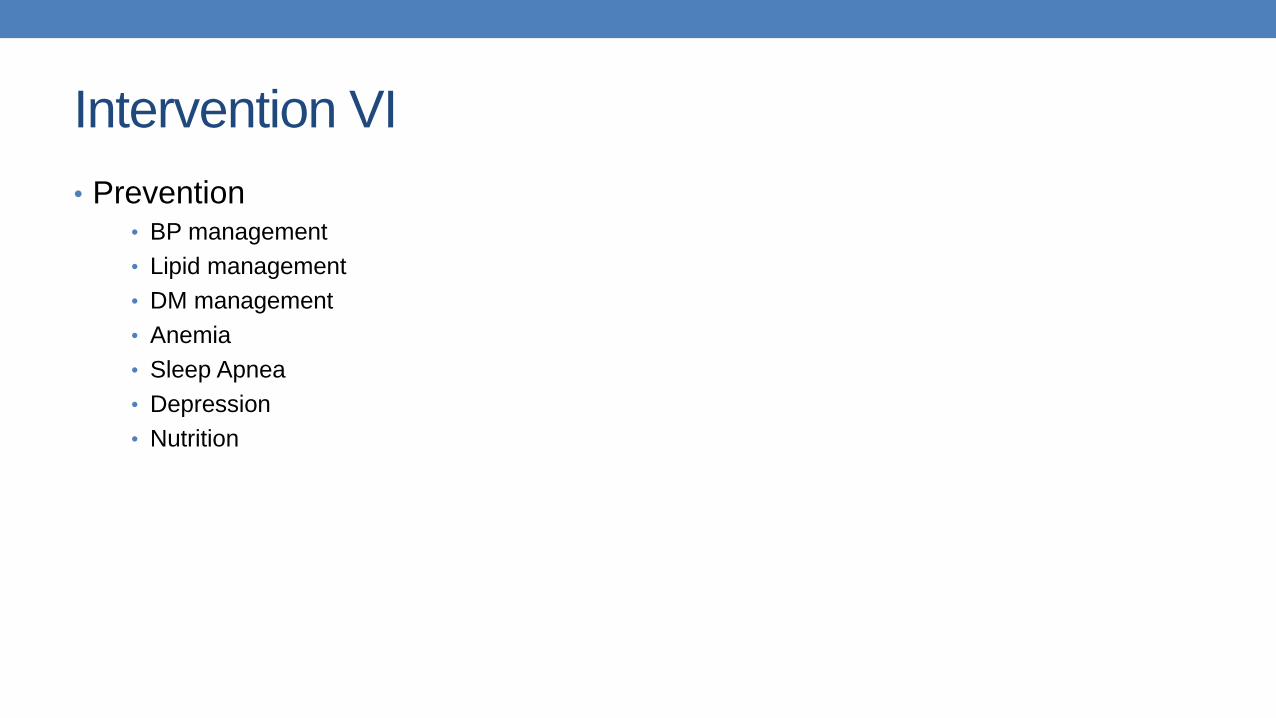
Intervention VI
• Prevention • BP management
• Lipid management
• DM management
• Anemia
• Sleep Apnea
• Depression
• Nutrition
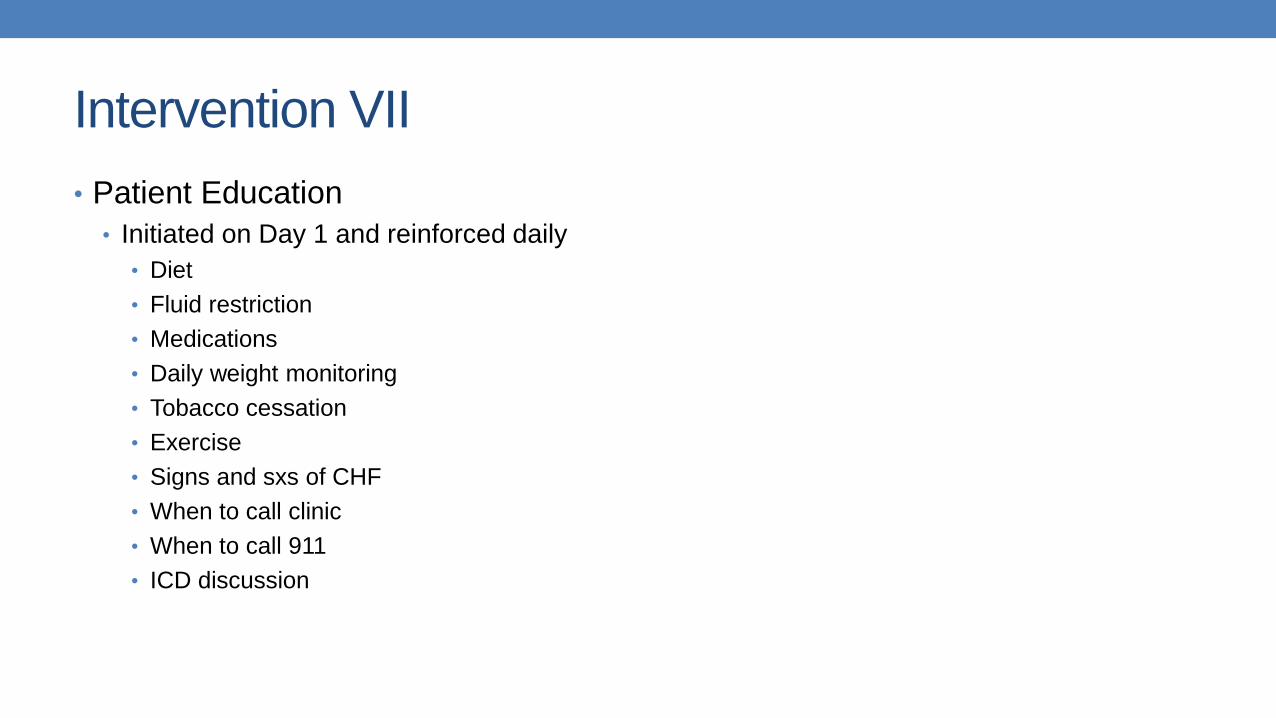
Intervention VII
• Patient Education
• Initiated on Day 1 and reinforced daily
• Diet
• Fluid restriction
• Medications
• Daily weight monitoring
• Tobacco cessation
• Exercise
• Signs and sxs of CHF
• When to call clinic
• When to call 911
• ICD discussion
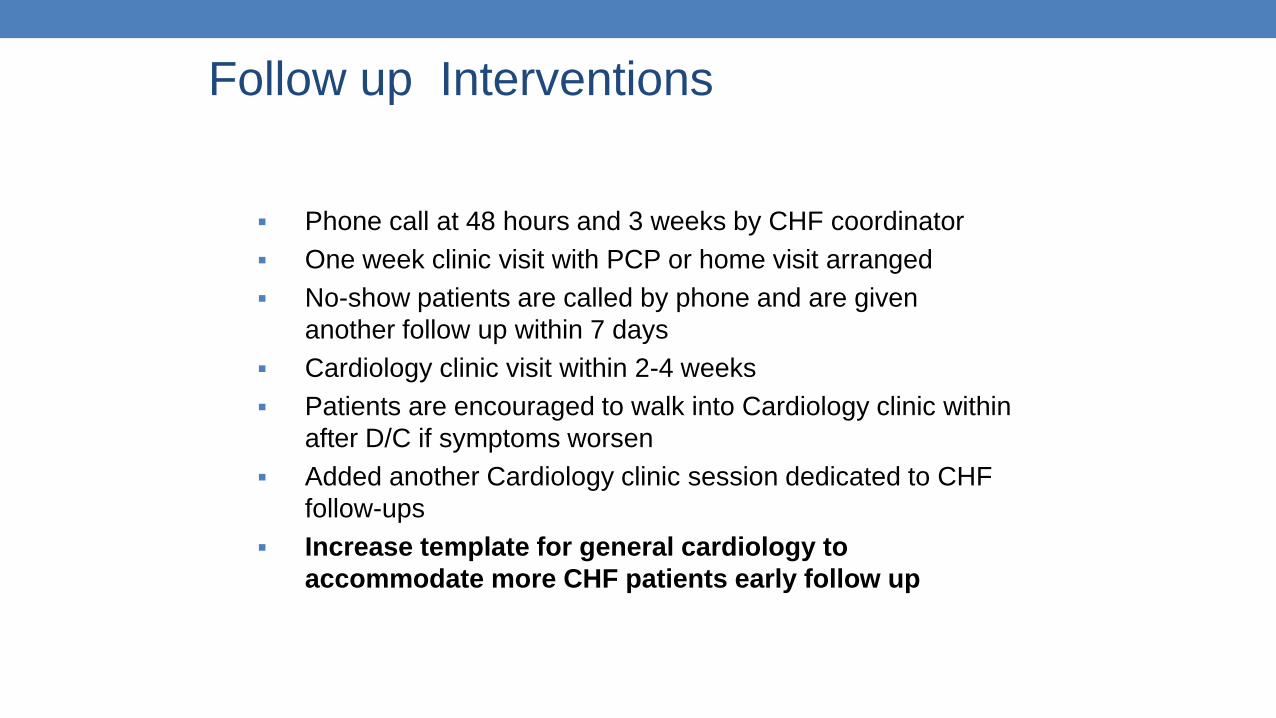
Follow up Interventions
▪ Phone call at 48 hours and 3 weeks by CHF coordinator
▪ One week clinic visit with PCP or home visit arranged
▪ No-show patients are called by phone and are given
another follow up within 7 days
▪ Cardiology clinic visit within 2-4 weeks
▪ Patients are encouraged to walk into Cardiology clinic within
after D/C if symptoms worsen
▪ Added another Cardiology clinic session dedicated to CHF
follow-ups
▪ Increase template for general cardiology to
accommodate more CHF patients early follow up
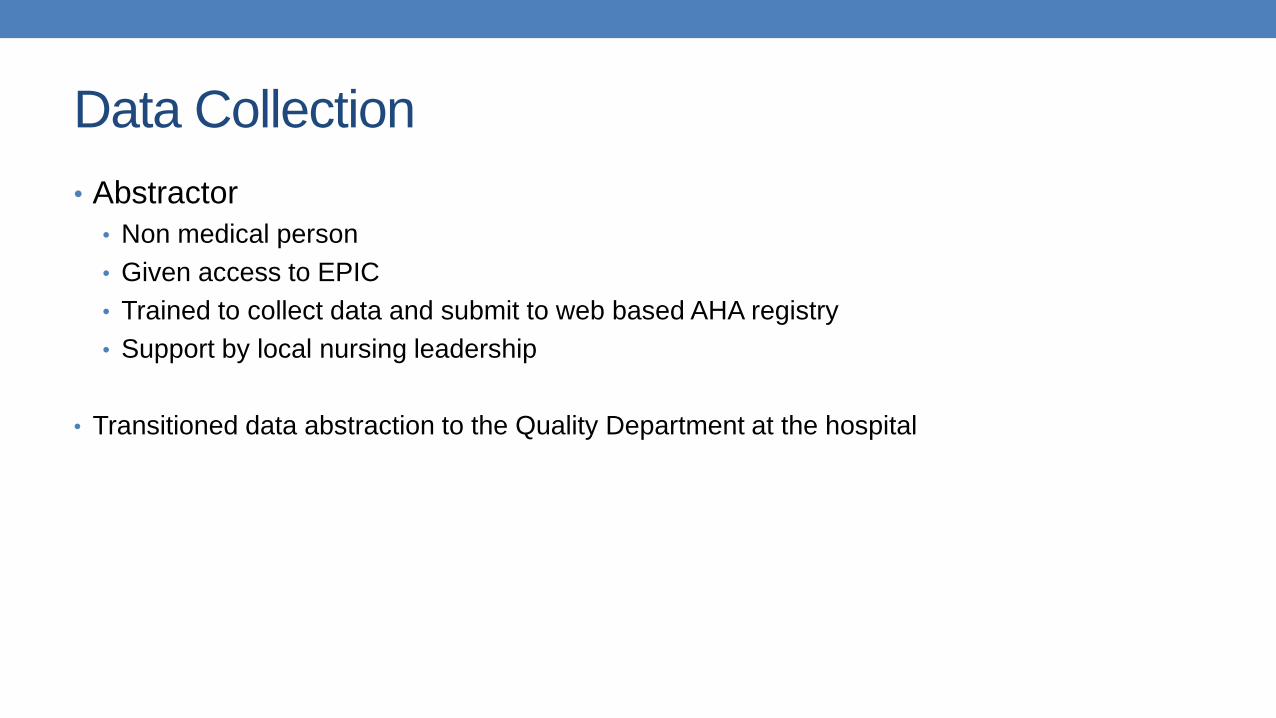
Data Collection
• Abstractor
• Non medical person
• Given access to EPIC
• Trained to collect data and submit to web based AHA registry
• Support by local nursing leadership
• Transitioned data abstraction to the Quality Department at the hospital
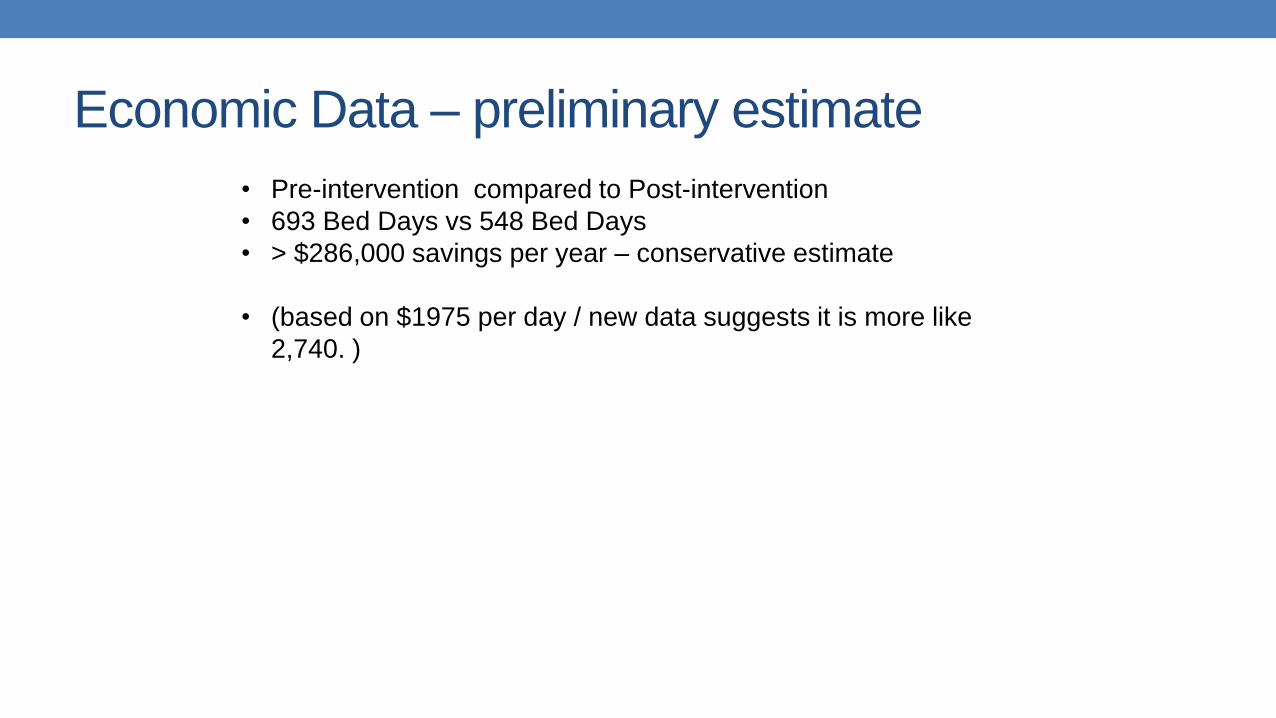
Economic Data – preliminary estimate
• Pre-intervention compared to Post-intervention
• 693 Bed Days vs 548 Bed Days
• > $286,000 savings per year – conservative estimate
• (based on $1975 per day / new data suggests it is more like
2,740. )
RESULTS OF USING A
NATIONAL REGISTRY
(GWTG)
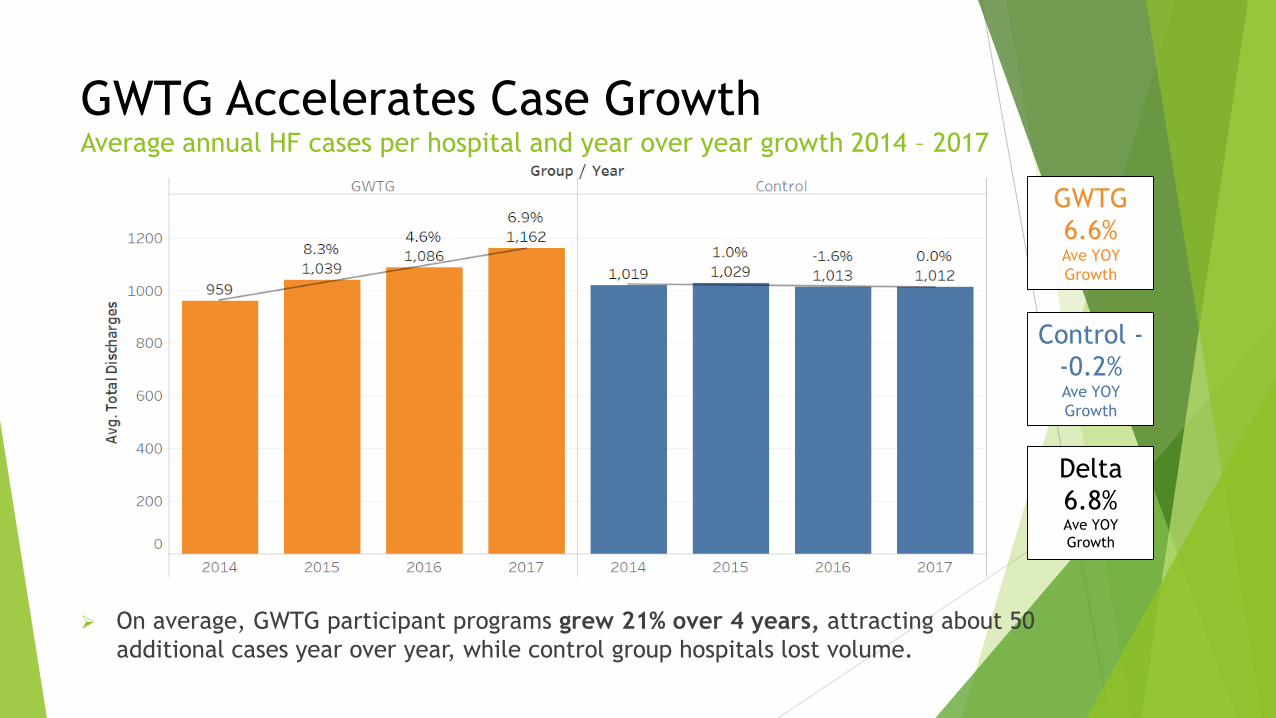
GWTG Accelerates Case Growth Average annual HF cases per hospital and year over year growth 2014 – 2017
Control -
-0.2% Ave YOY
Growth
GWTG
6.6% Ave YOY
Growth
Delta
6.8% Ave YOY
Growth
➢ On average, GWTG participant programs grew 21% over 4 years, attracting about 50
additional cases year over year, while control group hospitals lost volume.
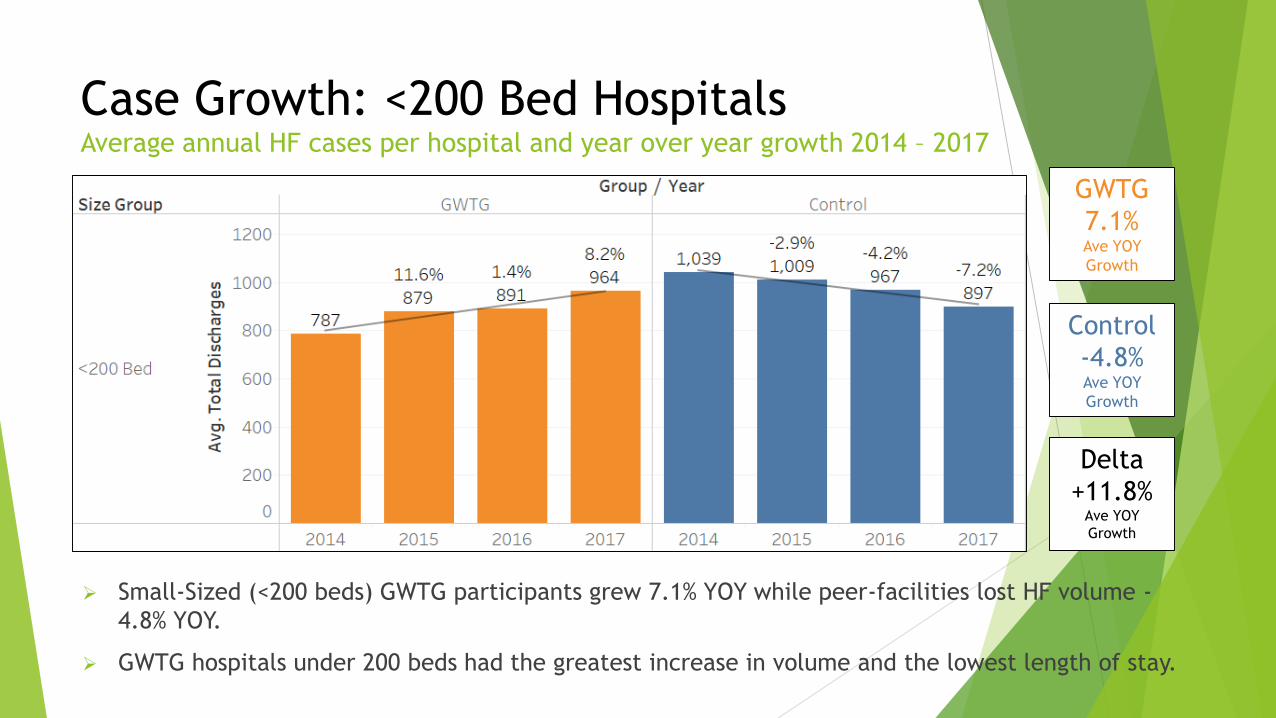
Case Growth: <200 Bed Hospitals Average annual HF cases per hospital and year over year growth 2014 – 2017
➢ Small-Sized (<200 beds) GWTG participants grew 7.1% YOY while peer-facilities lost HF volume -
4.8% YOY.
➢ GWTG hospitals under 200 beds had the greatest increase in volume and the lowest length of stay.
Control
-4.8% Ave YOY
Growth
GWTG
7.1% Ave YOY
Growth
Delta
+11.8% Ave YOY
Growth
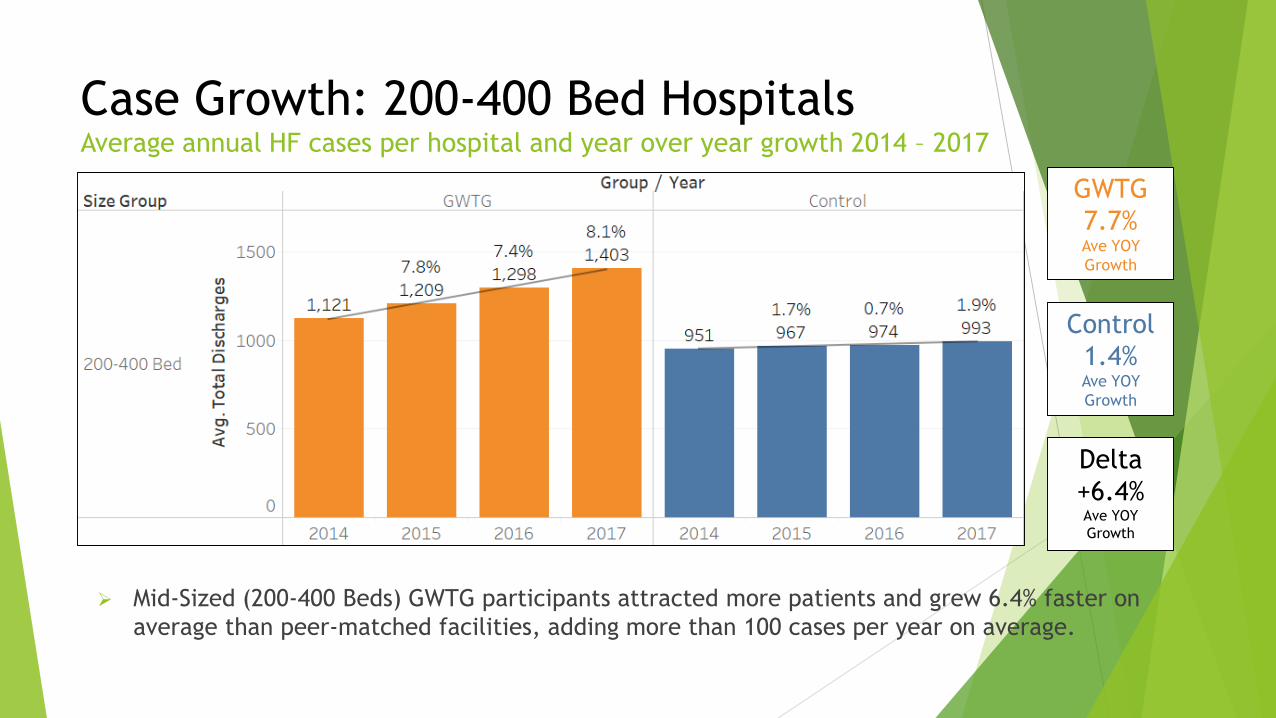
Case Growth: 200-400 Bed Hospitals Average annual HF cases per hospital and year over year growth 2014 – 2017
➢ Mid-Sized (200-400 Beds) GWTG participants attracted more patients and grew 6.4% faster on
average than peer-matched facilities, adding more than 100 cases per year on average.
Control
1.4% Ave YOY
Growth
GWTG
7.7% Ave YOY
Growth
Delta
+6.4% Ave YOY
Growth
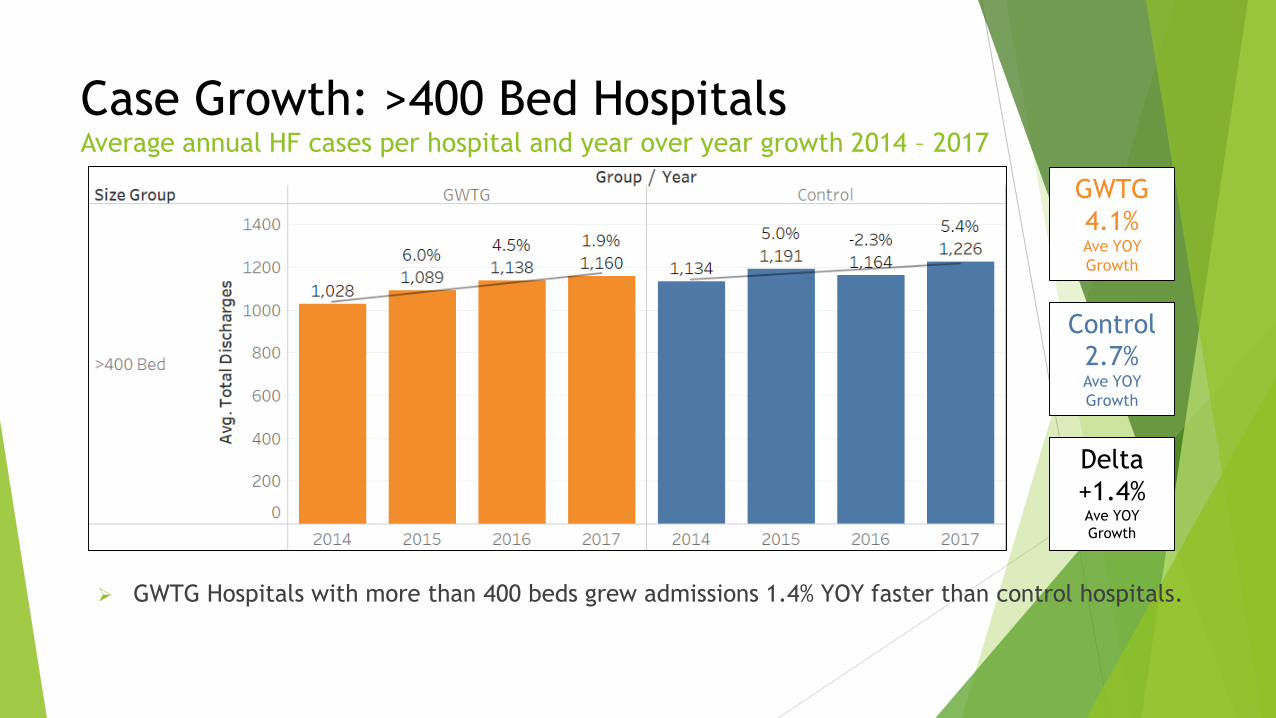
Case Growth: >400 Bed Hospitals Average annual HF cases per hospital and year over year growth 2014 – 2017
➢ GWTG Hospitals with more than 400 beds grew admissions 1.4% YOY faster than control hospitals.
Control
2.7% Ave YOY
Growth
GWTG
4.1% Ave YOY
Growth
Delta
+1.4% Ave YOY
Growth
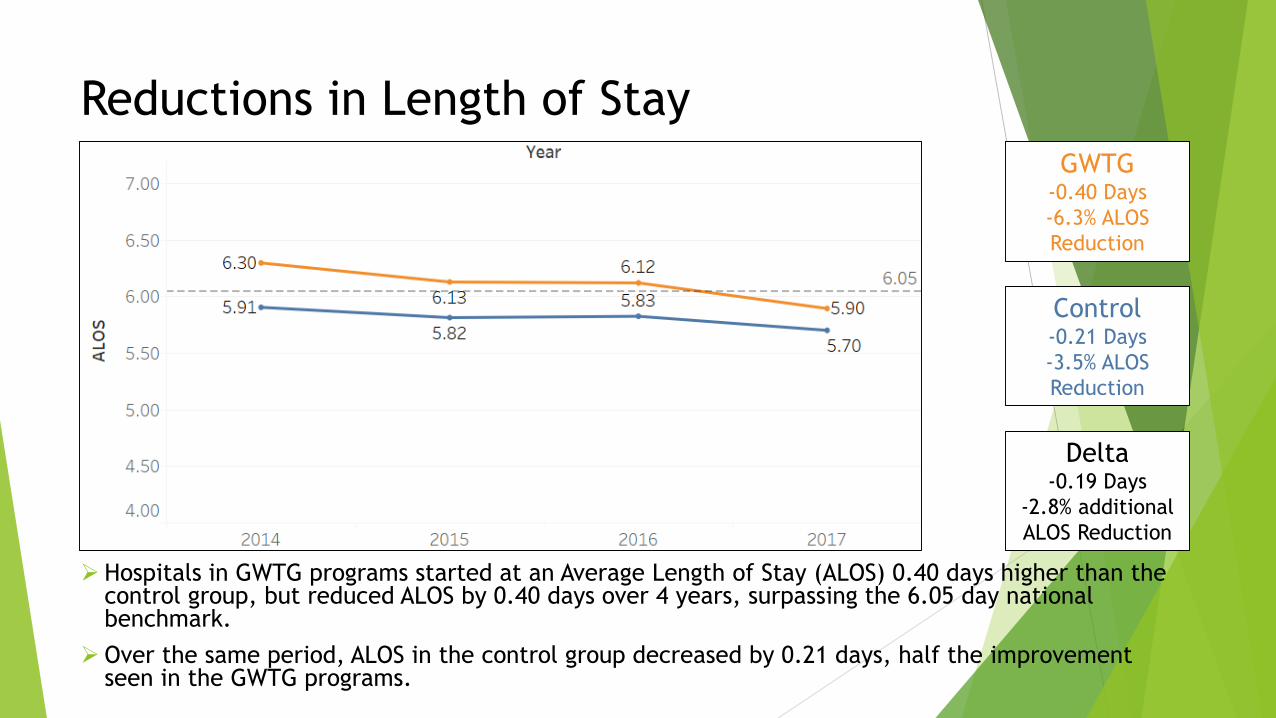
Reductions in Length of Stay
➢ Hospitals in GWTG programs started at an Average Length of Stay (ALOS) 0.40 days higher than the control group, but reduced ALOS by 0.40 days over 4 years, surpassing the 6.05 day national benchmark.
➢ Over the same period, ALOS in the control group decreased by 0.21 days, half the improvement seen in the GWTG programs.
Control -0.21 Days
-3.5% ALOS
Reduction
GWTG -0.40 Days
-6.3% ALOS
Reduction
Delta -0.19 Days
-2.8% additional
ALOS Reduction
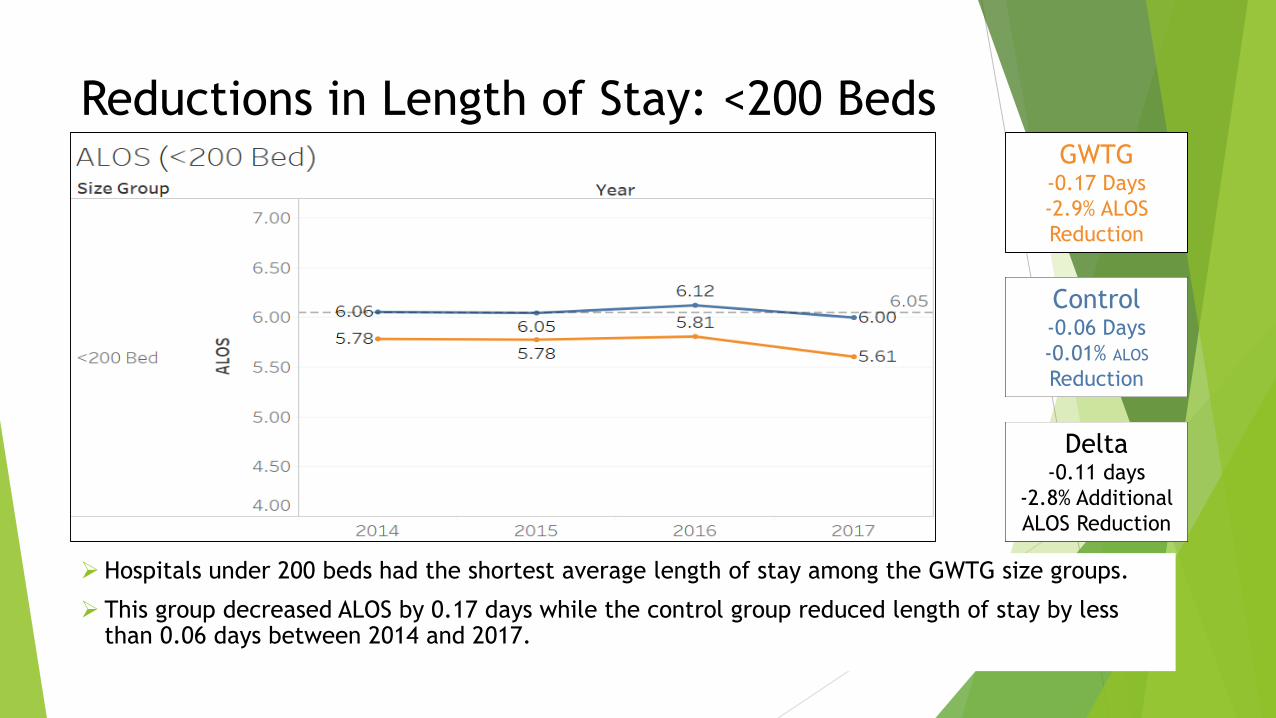
Reductions in Length of Stay: <200 Beds
➢ Hospitals under 200 beds had the shortest average length of stay among the GWTG size groups.
➢ This group decreased ALOS by 0.17 days while the control group reduced length of stay by less than 0.06 days between 2014 and 2017.
Control -0.06 Days
-0.01% ALOS
Reduction
GWTG -0.17 Days
-2.9% ALOS
Reduction
Delta -0.11 days
-2.8% Additional
ALOS Reduction
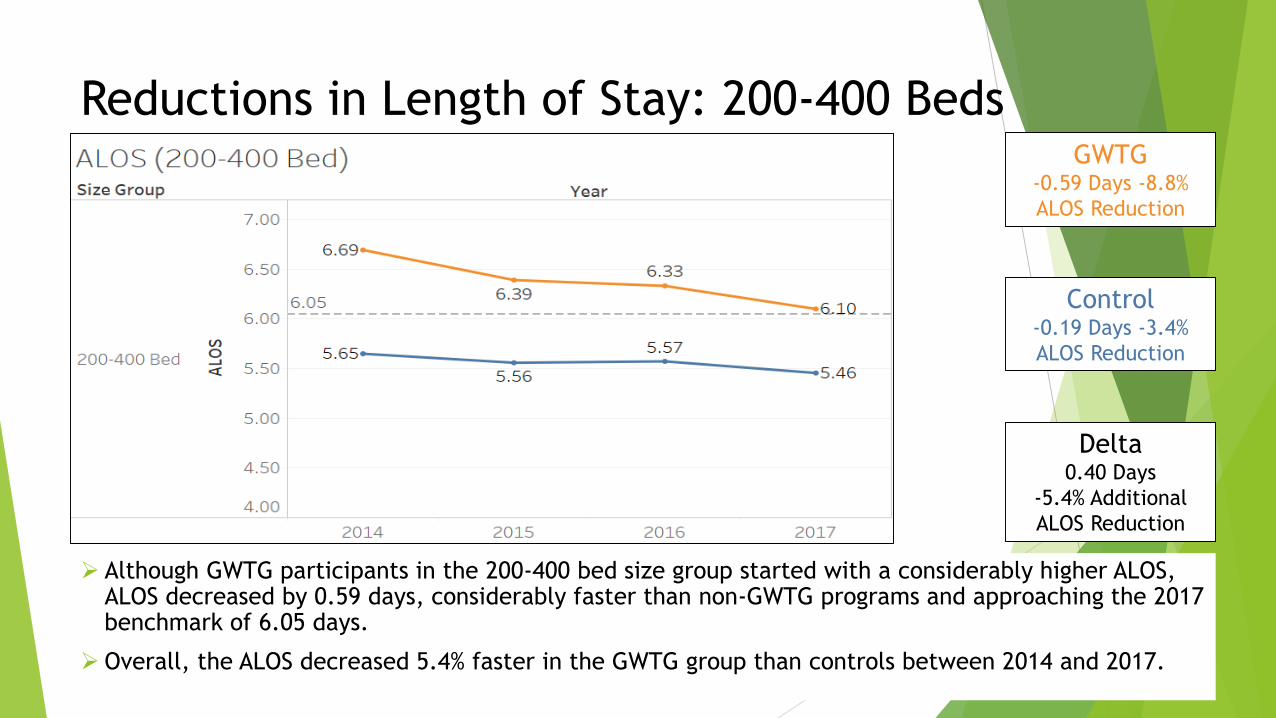
Reductions in Length of Stay: 200-400 Beds
➢ Although GWTG participants in the 200-400 bed size group started with a considerably higher ALOS, ALOS decreased by 0.59 days, considerably faster than non-GWTG programs and approaching the 2017 benchmark of 6.05 days.
➢ Overall, the ALOS decreased 5.4% faster in the GWTG group than controls between 2014 and 2017.
Control -0.19 Days -3.4%
ALOS Reduction
GWTG -0.59 Days -8.8%
ALOS Reduction
Delta 0.40 Days
-5.4% Additional
ALOS Reduction
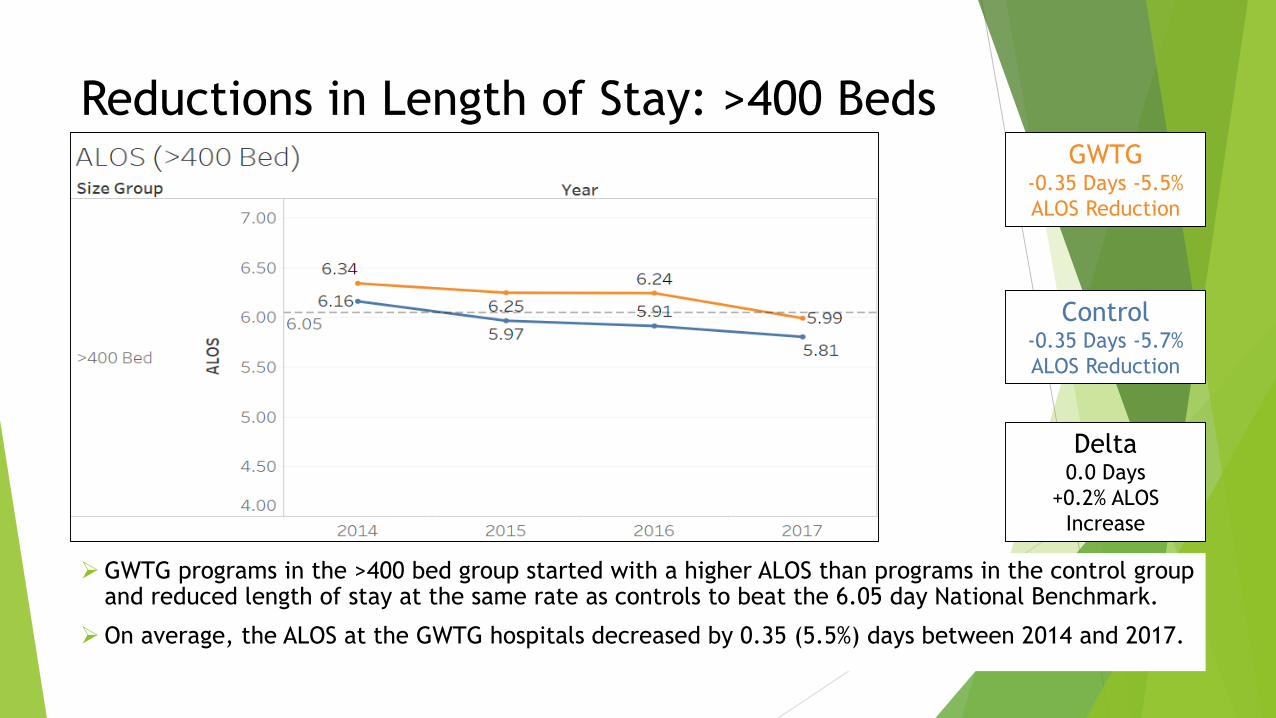
Reductions in Length of Stay: >400 Beds
➢ GWTG programs in the >400 bed group started with a higher ALOS than programs in the control group and reduced length of stay at the same rate as controls to beat the 6.05 day National Benchmark.
➢ On average, the ALOS at the GWTG hospitals decreased by 0.35 (5.5%) days between 2014 and 2017.
Control -0.35 Days -5.7%
ALOS Reduction
GWTG -0.35 Days -5.5%
ALOS Reduction
Delta 0.0 Days
+0.2% ALOS
Increase
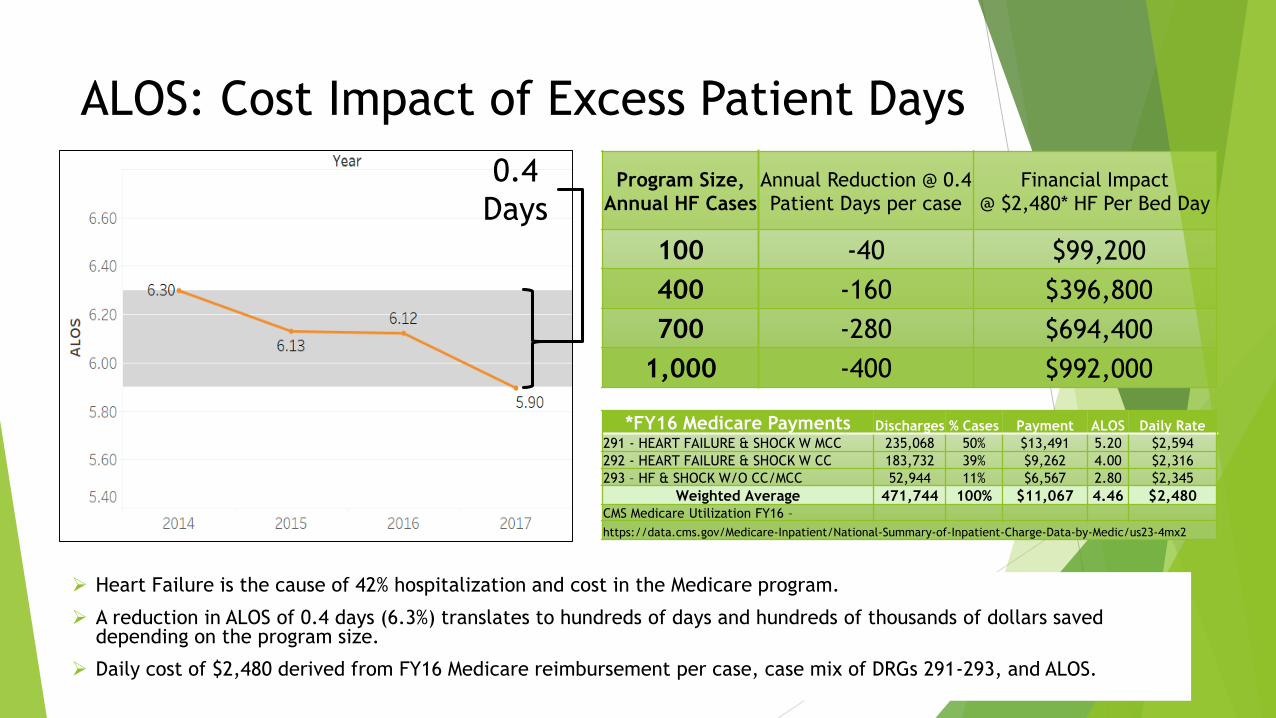
ALOS: Cost Impact of Excess Patient Days
0.4
Days Program Size,
Annual HF Cases
Annual Reduction @ 0.4
Patient Days per case
Financial Impact
@ $2,480* HF Per Bed Day
100 -40 $99,200
400 -160 $396,800
700 -280 $694,400
1,000 -400 $992,000
*FY16 Medicare Payments Discharges % Cases Payment ALOS Daily Rate
291 - HEART FAILURE & SHOCK W MCC 235,068 50% $13,491 5.20 $2,594
292 - HEART FAILURE & SHOCK W CC 183,732 39% $9,262 4.00 $2,316
293 – HF & SHOCK W/O CC/MCC 52,944 11% $6,567 2.80 $2,345
Weighted Average 471,744 100% $11,067 4.46 $2,480 CMS Medicare Utilization FY16 –
https://data.cms.gov/Medicare-Inpatient/National-Summary-of-Inpatient-Charge-Data-by-Medic/us23-4mx2
➢ Heart Failure is the cause of 42% hospitalization and cost in the Medicare program.
➢ A reduction in ALOS of 0.4 days (6.3%) translates to hundreds of days and hundreds of thousands of dollars saved depending on the program size.
➢ Daily cost of $2,480 derived from FY16 Medicare reimbursement per case, case mix of DRGs 291-293, and ALOS.
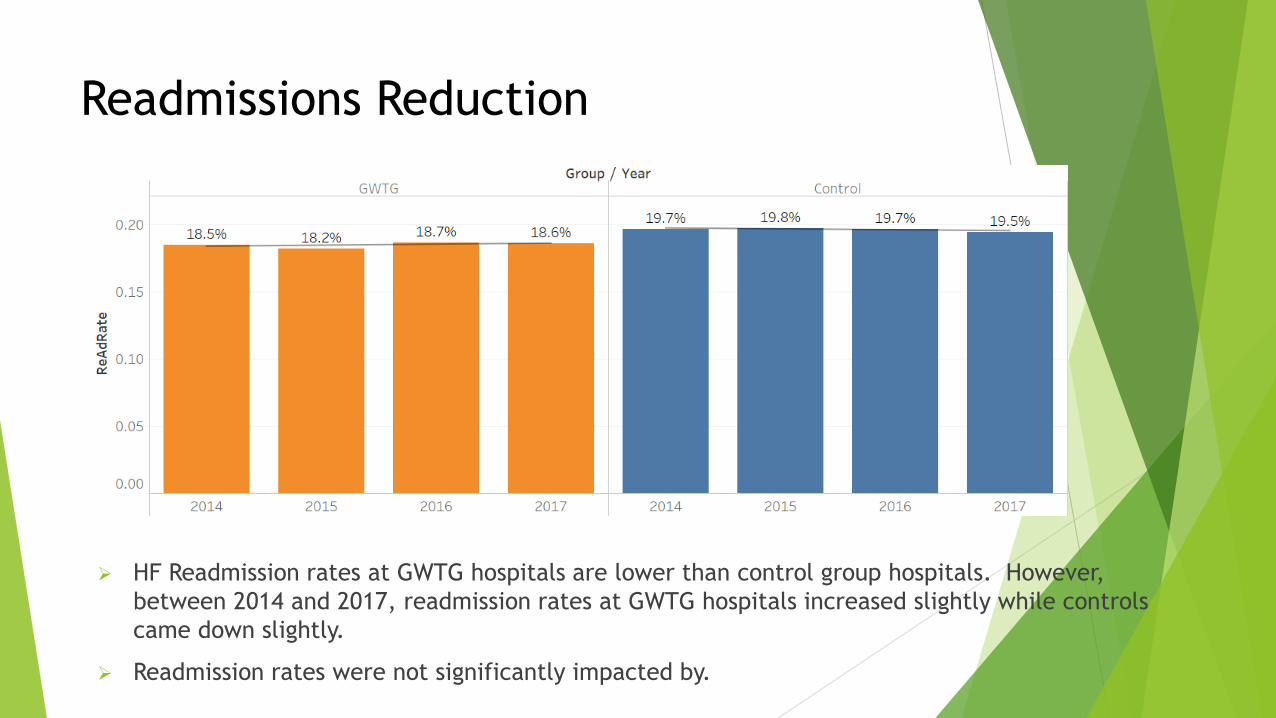
Readmissions Reduction
➢ HF Readmission rates at GWTG hospitals are lower than control group hospitals. However,
between 2014 and 2017, readmission rates at GWTG hospitals increased slightly while controls
came down slightly.
➢ Readmission rates were not significantly impacted by.
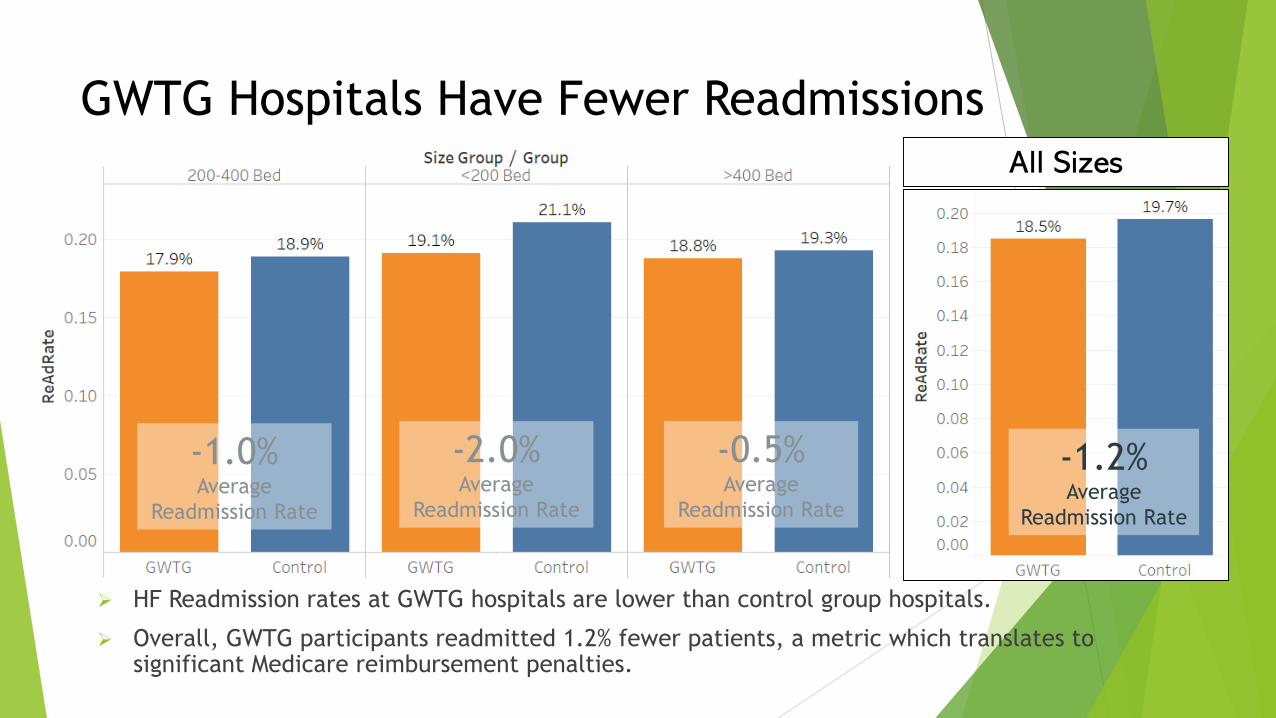
All Sizes
-1.2% Average
Readmission Rate
GWTG Hospitals Have Fewer Readmissions
-0.5% Average
Readmission Rate
-1.0% Average
Readmission Rate
-2.0% Average
Readmission Rate
➢ HF Readmission rates at GWTG hospitals are lower than control group hospitals.
➢ Overall, GWTG participants readmitted 1.2% fewer patients, a metric which translates to significant Medicare reimbursement penalties.
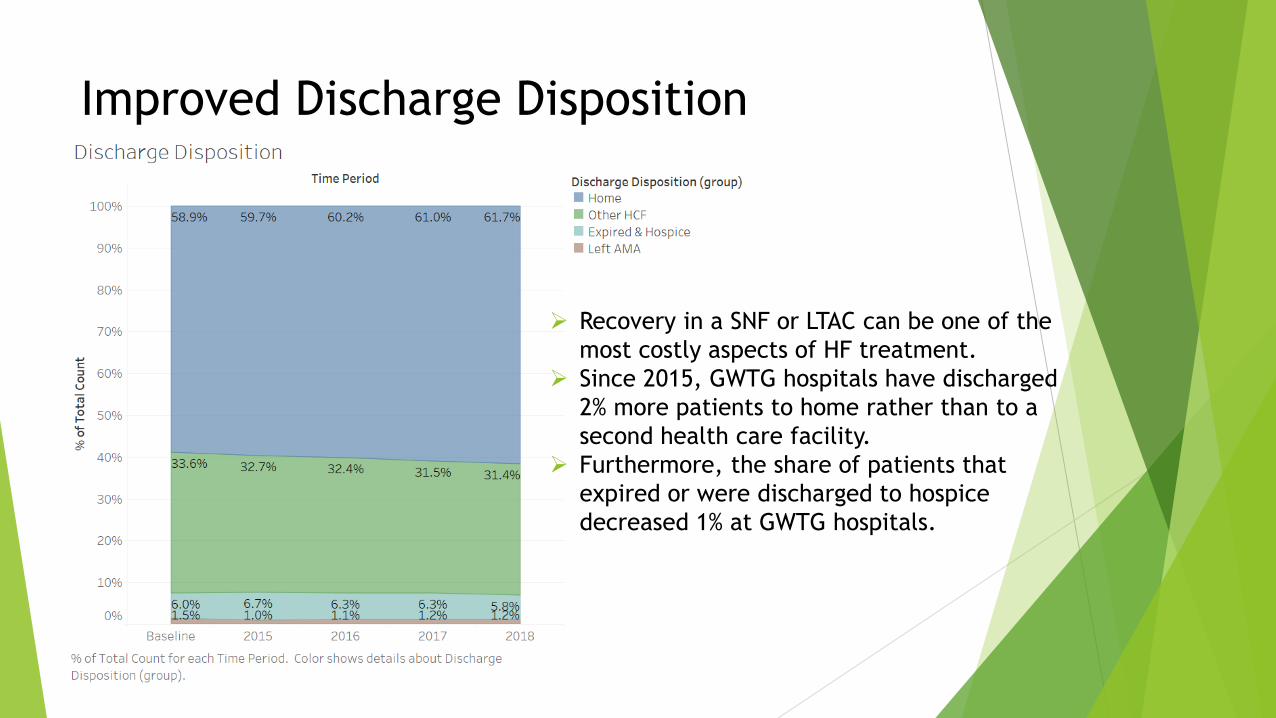
second health care facility.
Improved Discharge Disposition
➢ Recovery in a SNF or LTAC can be one of the
most costly aspects of HF treatment.
➢ Since 2015, GWTG hospitals have discharged
2% more patients to home rather than to a
➢ Furthermore, the share of patients that
expired or were discharged to hospice
decreased 1% at GWTG hospitals.
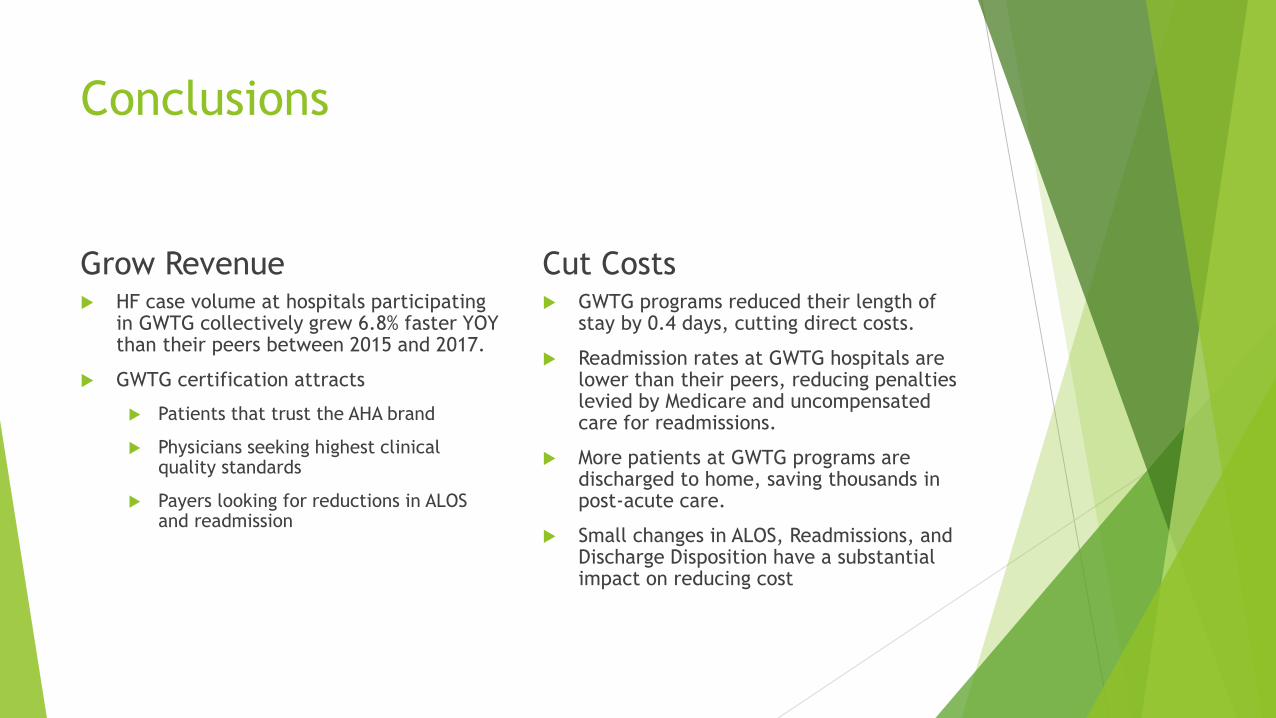
Conclusions
Grow Revenue HF case volume at hospitals participating
in GWTG collectively grew 6.8% faster YOY than their peers between 2015 and 2017.
GWTG certification attracts
Patients that trust the AHA brand
Physicians seeking highest clinical quality standards
Payers looking for reductions in ALOS and readmission
Cut Costs GWTG programs reduced their length of
stay by 0.4 days, cutting direct costs.
Readmission rates at GWTG hospitals are lower than their peers, reducing penalties levied by Medicare and uncompensated care for readmissions.
More patients at GWTG programs are discharged to home, saving thousands in post-acute care.
Small changes in ALOS, Readmissions, and Discharge Disposition have a substantial impact on reducing cost
66
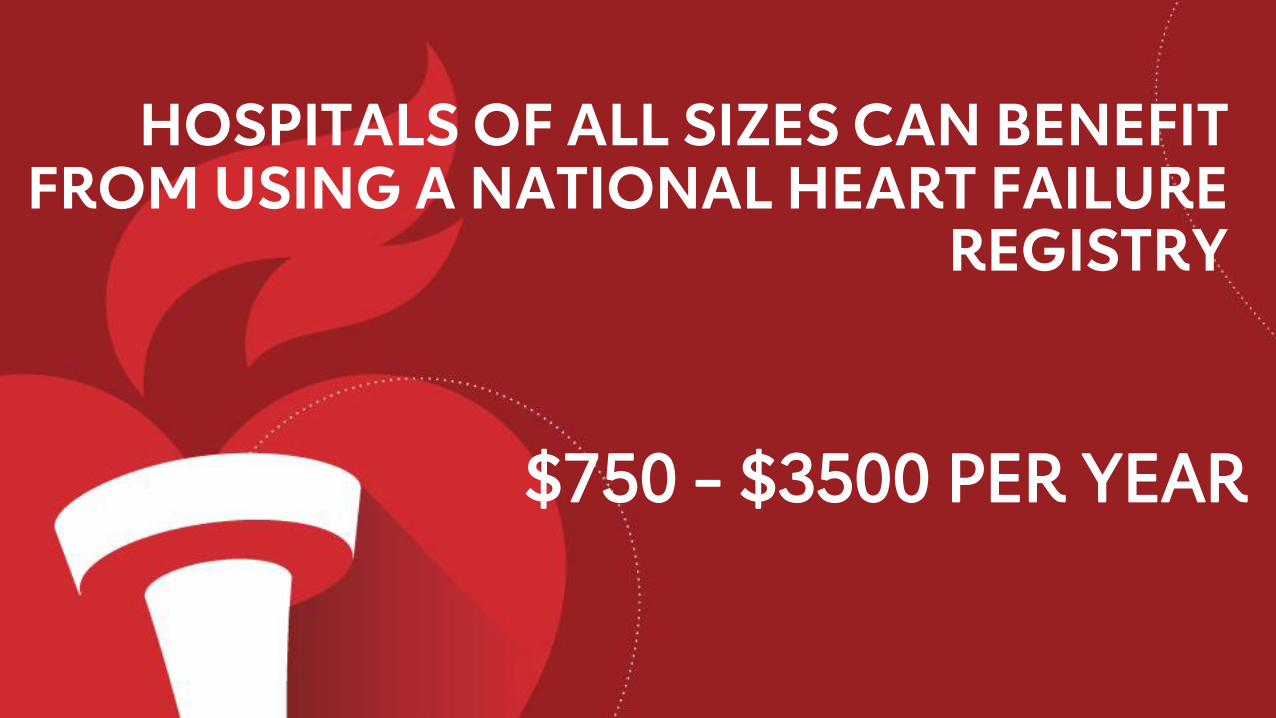
HOSPITALS OF ALL SIZES CAN BENEFIT FROM USING A NATIONAL HEART FAILURE
REGISTRY
$750 - $3500 PER YEAR

67
GET STARTED TODAY!