Embed Size (px)
Citation preview

Using Data to Improve Using Data to Improve Student AchievementStudent Achievement
Secondary Secondary MathematicsMathematics Preschool InservicePreschool Inservice
20062006

OutcomesOutcomes1.1. Know why we need to look at dataKnow why we need to look at data
2.2. Identify two types of testsIdentify two types of tests
3.3. Understand three types of scoresUnderstand three types of scores
4.4. Understand Summative & Formative Understand Summative & Formative AssessmentsAssessments
5.5. Be able to interpret Summative Be able to interpret Summative Assessment ReportsAssessment Reports
6.6. Know how to use data in instructional Know how to use data in instructional planning for increased student learningplanning for increased student learning
Why Look at Data?Why Look at Data?
The purpose of data is to giveThe purpose of data is to give educatorseducators:: INSIGHTINSIGHT
DIRECTIONDIRECTIONFEEDBACKFEEDBACK

Types of TestsTypes of TestsNorm-Referenced Test Norm-Referenced Test (NRT)(NRT)
Criterion-Referenced Test Criterion-Referenced Test (CRT)(CRT)

What is a What is a Norm-ReferencedNorm-Referenced Test Test (NRT)?(NRT)?
A standardized A standardized assessment in which assessment in which all students perform all students perform under the same under the same conditions. conditions.
Compares the performance of a Compares the performance of a student to other students nationally. student to other students nationally. Norm groups are students in the same Norm groups are students in the same grade and age.grade and age.
Example: FCAT NRTExample: FCAT NRT

What is a Criterion-Referenced What is a Criterion-Referenced Test (CRT)?Test (CRT)?
An assessment comparing one An assessment comparing one student's performance to a specific student's performance to a specific learning objective or performance learning objective or performance standard standard and notand not to the performance to the performance of other students.of other students.
For example: FCAT SSS (Sunshine For example: FCAT SSS (Sunshine State Standards)State Standards)

Summary NRT and CRTSummary NRT and CRT
TYPETYPENorm-
referenced Test (NRT)
Criterion-referenced Test (CRT)
DEFINITIONDEFINITION
Shows how a student does
in relation to a norm group
Shows how a student does
in relation to a standard
EXAMPLESEXAMPLES
FCAT NRTPSAT
FCAT SSSClass TestsAP ExamsSAT/ACT

Types of Types of ScoresScores

Raw Score (RS)Raw Score (RS) The number of items a student The number of items a student
answers correctly on a test.answers correctly on a test.
John took a 20 item mathematics John took a 20 item mathematics test (where each item was worth test (where each item was worth one point) and correctly one point) and correctly answered 17 items.answered 17 items.
His His raw scoreraw score for this assessment for this assessment is 17.is 17.

Scale Score (SS)Scale Score (SS) Mathematically converted raw scores Mathematically converted raw scores
based on level of difficulty per question.based on level of difficulty per question.
For FCAT-SSS, a computer program is For FCAT-SSS, a computer program is used to analyze student responses and used to analyze student responses and to compute the scale score. to compute the scale score.
Scale Scores reflect a more accurate Scale Scores reflect a more accurate picture of the student’s achievement picture of the student’s achievement level.level.

Scale Score (SS)Scale Score (SS) Higher scale scores indicate higher Higher scale scores indicate higher
proficiency.proficiency. On a continuous, vertical scale across grade On a continuous, vertical scale across grade
levels you can track a student's progress levels you can track a student's progress from lower to upper grade levels on one from lower to upper grade levels on one scale. Growth in scale score units indicates scale. Growth in scale score units indicates growth in proficiency. growth in proficiency.
For FCAT-SSS, the Developmental Scale For FCAT-SSS, the Developmental Scale Score is used to determine a student’s annual Score is used to determine a student’s annual progress from grade to grade.progress from grade to grade.
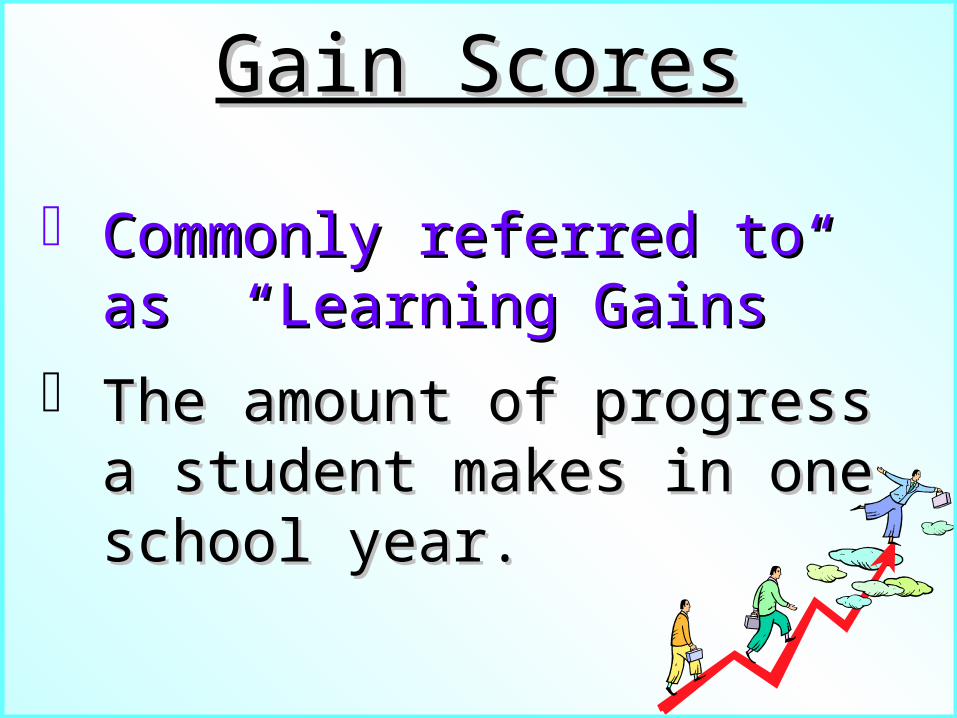
Gain ScoresGain Scores
Commonly referred to as Commonly referred to as “Learning Gains”“Learning Gains”
The amount of progress a The amount of progress a student makes in one student makes in one school year.school year.

Learning Gains: Who Qualifies?Learning Gains: Who Qualifies?
Students from all subgroups (all Students from all subgroups (all students, ESE, LEP, etc.) with students, ESE, LEP, etc.) with
matched, consecutive year (i.e. matched, consecutive year (i.e. 2005 & 2006) FCAT SSS results (a 2005 & 2006) FCAT SSS results (a pre- and post-test) in grades 4-10, pre- and post-test) in grades 4-10,
who were enrolled in the same who were enrolled in the same school during the October & school during the October &
February FTE Count.February FTE Count.

Learning Gains: Which Scores?Learning Gains: Which Scores?
Gains apply in reading and Gains apply in reading and math, not writing or science.math, not writing or science.
Pre-tests may be from same Pre-tests may be from same school, same district, or school, same district, or anywhere in the state.anywhere in the state.

Learning Gains:Learning Gains:What equals Adequate Yearly Progress What equals Adequate Yearly Progress (AYP)?(AYP)? A.A. Improve FCAT Achievement Levels Improve FCAT Achievement Levels
from 2005 to 2006 from 2005 to 2006 (e.g. 1-2, 2-3, 3-4, 4-5) (e.g. 1-2, 2-3, 3-4, 4-5) oror
B. Maintain “satisfactory” Achievement B. Maintain “satisfactory” Achievement Levels from 2005-2006 Levels from 2005-2006
(e.g. 3-3, 4-4, 5-5)(e.g. 3-3, 4-4, 5-5) oror
C. Demonstrate more than one year’sC. Demonstrate more than one year’s growth within Level 1 or Level 2 - growth within Level 1 or Level 2 - determined by DSS Cut Points (not determined by DSS Cut Points (not applicable for retained students)applicable for retained students)

FCAT SSS Developmental Scale

MATH MATH Graduation Passing Score Graduation Passing Score DSS 1889 or HigherDSS 1889 or Higher
GradeGrade Level 1Level 1 Level 2Level 2 Level 3Level 3 Level 4Level 4 Level 5Level 5
33 375-1078375-1078 1079-12681079-1268 1269-15081269-1508 1509-17491509-1749 1750-22251750-2225
44 581-1276581-1276 1277-14431277-1443 1444-16571444-1657 1658-18621658-1862 1863-23301863-2330
55 569-1451569-1451 1452-16311452-1631 1632-17681632-1768 1769-19561769-1956 1957-24561957-2456
66 770-1553770-1553 1554-16911554-1691 1692-18591692-1859 1860-20181860-2018 2019-24922019-2492
77 958-1660958-1660 1661-17851661-1785 1786-19381786-1938 1938-20791938-2079 2080-25722080-2572
88 1025-17321025-1732 1733-18501733-1850 1851-19971851-1997 1998-20911998-2091 2092-26052092-2605
99 1238-17811238-1781 1782-19001782-1900 1901-20221901-2022 2023-21412023-2141 2142-25962142-2596
1010 1068-18311068-1831 1832-19461832-1946 1947-20491947-2049 2050-21922050-2192 2193-27092193-2709

Learning Gains: RetaineesLearning Gains: RetaineesA retained student can only be A retained student can only be
counted as making adequate counted as making adequate progress if he/she:progress if he/she:
Moves up one level. Moves up one level. (e.g. 1-2, 2-3, 3-4, 4-5) (e.g. 1-2, 2-3, 3-4, 4-5)
Maintains a level 3, 4, or 5. Maintains a level 3, 4, or 5.

Developmental Scale Score Developmental Scale Score Gains Table (DSS Cut Points)Gains Table (DSS Cut Points)Students achieving within Level 1 (or within Level 2) for two consecutive Students achieving within Level 1 (or within Level 2) for two consecutive years must gainyears must gain at least one point moreat least one point more than those listed in the table in than those listed in the table in order to satisfy the “making annual learning gains” component of the order to satisfy the “making annual learning gains” component of the
school accountability system.school accountability system.
Grade Level ChangeGrade Level Change ReadingReading MathematicsMathematics
3 to 43 to 4 230230 162162
4 to 54 to 5 166166 119119
5 to 65 to 6 133133 9595
6 to 76 to 7 110110 7878
7 to 87 to 8 9292 6464
8 to 98 to 9 7777 5454
9 to 109 to 10 7777 4848

Learning Gains: ActivityLearning Gains: Activity
Using the data on the followingUsing the data on the following
table, determine:table, determine:
1.1. Which students made a Which students made a learning gain?learning gain?
2.2. What percentage of the What percentage of the teacher’s students made a teacher’s students made a learning gain?learning gain?

Data Display for FCAT Mathematics Data Display for FCAT Mathematics ResultsResults
StudentStudent 04/05 04/05 Grade Grade LevelLevel
05/0605/06
Grade Grade LevelLevel
Pre-test Pre-test Achievement Achievement
LevelLevel
Pre-Pre-test test DSSDSS
Post-test Post-test Achievement Achievement
LevelLevel
Post-Post-test test DSSDSS
Learning Gain Learning Gain DeterminationDetermination
AA 77 88 Level 1Level 1 Level 2Level 2Yes or NoYes or No
Reason: A, B, or CReason: A, B, or C
BB 77 88 Level 4Level 4 Level 4Level 4Yes or NoYes or No
Reason: A, B, or CReason: A, B, or C
CC 77 88 Level 2Level 2 15981598 Level 2Level 2 17431743Yes or NoYes or No
Reason: A, B, or CReason: A, B, or C
DD 88 88 Level 1Level 1 Level 2Level 2Yes or NoYes or No
Reason: A, B, or CReason: A, B, or C
EE 88 88 Level 3Level 3 Level 3Level 3Yes or NoYes or No
Reason: A, B, or CReason: A, B, or C
FF 88 88 Level 1Level 1 14861486 Level 1Level 1 16531653Yes or NoYes or No
Reason: A, B, or CReason: A, B, or C
GG 77 88 Level 5Level 5 Level 4Level 4Yes or NoYes or No
Reason: A, B, or CReason: A, B, or C

Teacher Learning Gains Based on Teacher Learning Gains Based on Data DisplayData Display
5 out of 7 students made learning gains.5 out of 7 students made learning gains. 71% of this teacher’s students made learning gains and 71% of this teacher’s students made learning gains and
add points towards the school’s grade.add points towards the school’s grade. No points are given to the school for Student F because No points are given to the school for Student F because
he was retained and stayed within level 1 – even he was retained and stayed within level 1 – even though he made significant gains in DSS points.though he made significant gains in DSS points.
No points are given to Student G because he decreased No points are given to Student G because he decreased a level.a level.
Total Number of Total Number of Students with a Pre Students with a Pre and Post-test who and Post-test who qualify for learning qualify for learning gain calculations:gain calculations:
Reason AReason A
Increased 1 or Increased 1 or more more
Achievement Achievement LevelsLevels
Reason BReason B
Maintains Maintains “satisfactory” “satisfactory”
levels levels
(3, 4, or 5)(3, 4, or 5)
Reason CReason C
DSS Target DSS Target Gain Gain
(More than a (More than a year’s growth)year’s growth)
77 22 22 11

FCAT FCAT Parent Parent ReportReport
Spring 2005Spring 2005Florida Comprehensive Assessment Test (FCAT)Florida Comprehensive Assessment Test (FCAT)
SSS Mathematics Student and Parent ReportSSS Mathematics Student and Parent ReportGrade 10Grade 10
Your 2005 Math ResultsYour 2005 Math Results
You have passed the grade 10 You have passed the grade 10 FCAT Mathematics test and your FCAT Mathematics test and your score is on grade level. You score is on grade level. You answered many of the questions answered many of the questions on FCAT correctly.on FCAT correctly.
Aprobaste el examen de Lectura Aprobaste el examen de Lectura del FCAT para el grado 10 y tu del FCAT para el grado 10 y tu calificación está al nivel. al nivel. Respondiste a muchas de las Respondiste a muchas de las preguntas del FCAST preguntas del FCAST correctamente.correctamente.
Ou pase eqzamen Leketi FCAT yo Ou pase eqzamen Leketi FCAT yo bay Klas bay Klas 10yèm nan epi ou nan epi ou fè yon yon nòt ki nan nivo klas la. Ou reponn ki nan nivo klas la. Ou reponn anpil nan kesvon FCAT yo san fot.anpil nan kesvon FCAT yo san fot.
CONTENT SCORES
ObjectiveNumber Possible
Number Correct
Number Sense & Operations 20 13
Patterns, Relationships, Algebra 10 6
Data, Statistics, & Probability 8 7
Geometry & Measurement 10 5
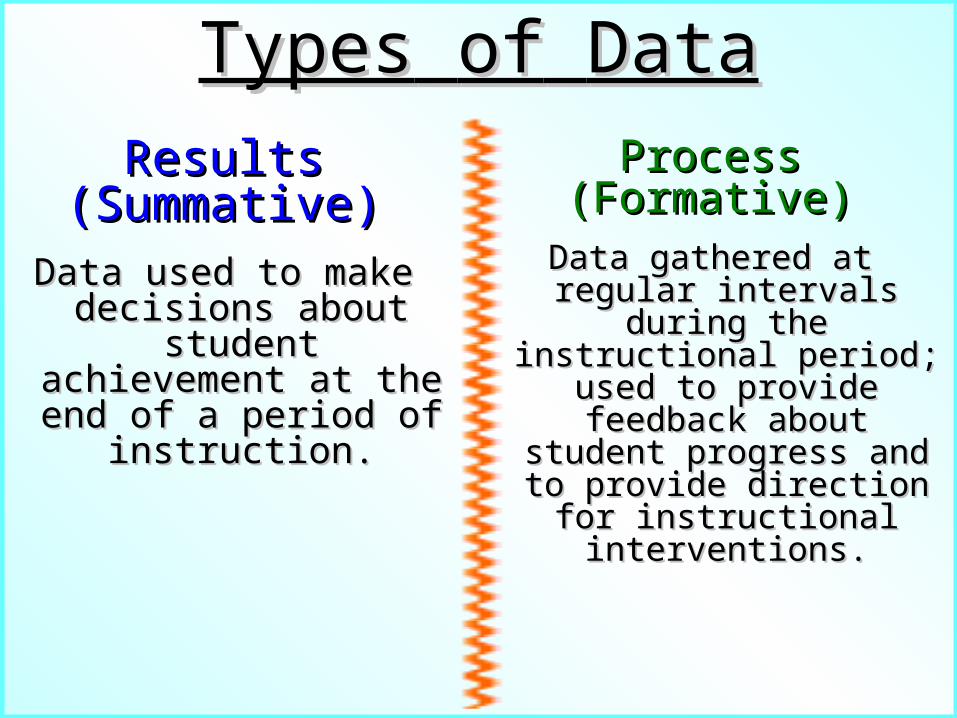
TypesTypes ofof DataDataResultsResults
(Summative)(Summative)Data used to make Data used to make
decisions about decisions about student achievement student achievement at the end of a period at the end of a period
of instruction.of instruction.
ProcessProcess(Formative)(Formative)
Data gathered at Data gathered at regular intervals regular intervals
during the during the instructional period; instructional period;
used to provide used to provide feedback about feedback about
student progress and student progress and to provide direction to provide direction
for instructional for instructional interventions.interventions.
A Closer Look at Results DataA Closer Look at Results Data
Examples:Examples:

What tools do we have?What tools do we have? FCAT Inquiry (Summative)FCAT Inquiry (Summative)
Teacher Tools for Data Collection Teacher Tools for Data Collection
(Can be Summative or Formative)(Can be Summative or Formative)
HistogramHistogramPareto ChartPareto ChartRun ChartRun ChartScatter DiagramScatter DiagramItem AnalysisItem Analysis

HistogramHistogram Bar chart representing a frequency Bar chart representing a frequency
distribution of student scoresdistribution of student scores Heights of the Heights of the
bars represent bars represent number of number of students scoring students scoring at same at same level/scorelevel/score
Used to Monitor progressUsed to Monitor progress

Histogram: Pre-Algebra Midterm TestHistogram: Pre-Algebra Midterm Test
Percentage CorrectPercentage Correct
Num
ber
of
Stu
dents
Num
ber
of
Stu
dents
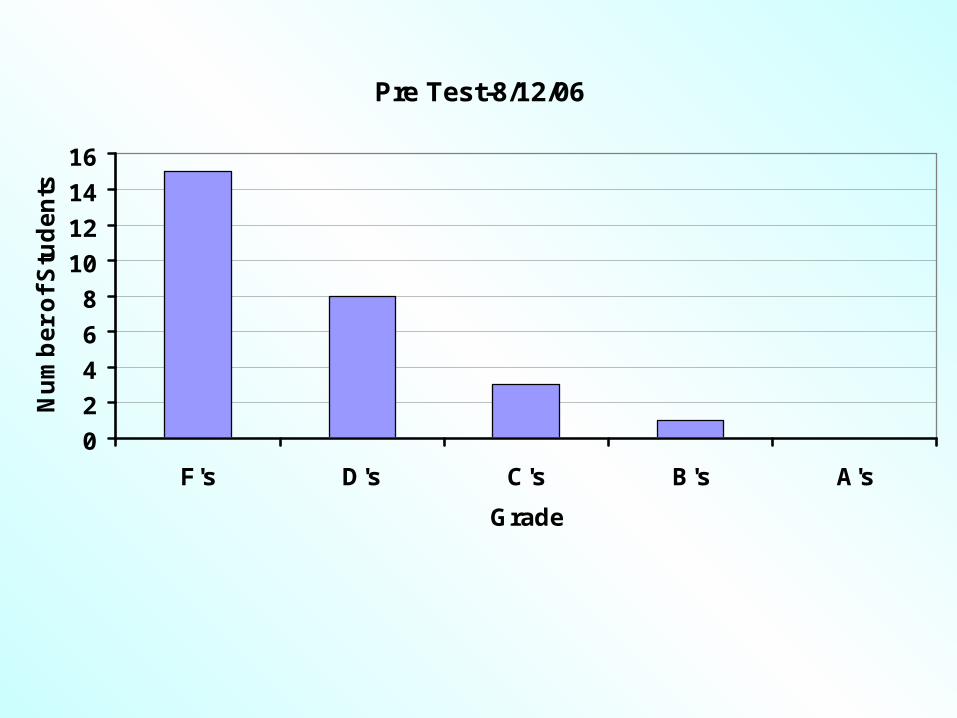
Pre Test-8/12/06
0
2
4
6
8
10
12
14
16
F's D's C's B's A's
Grade
Nu
mb
er
of
Stu
de
nts

2nd Quarter
0
2
4
6
8
10
12
14
F's D's C's B's A's
Grades
Nu
mb
er
of
Stu
de
nts

Post Test-Final-5/23/07
0
2
4
6
8
10
12
F's D's C's B's A's
Grades
Nu
mb
er
of
Stu
de
nts

Histogram: Grade Distribution in 8th Grade MathHistogram: Grade Distribution in 8th Grade MathF
req
uen
cyF
req
uen
cy
00
1010
2020
3030
4040
5050
6060
7070
0-10 11-20 21-30 31-40 41-50 51-60 61-70 71-80 81-90 91-1000-10 11-20 21-30 31-40 41-50 51-60 61-70 71-80 81-90 91-100
GradeGrade

Activity
Lee County Grade 8 Mathematics Scores
Percentage of Students by Achievement Level
Year Level 1 Level 2Levels
1-2 Level 3 Level 4 Level 5Levels
3-5
2001 23 22 45 33 14 9 56
2002 22 22 44 33 14 8 55
2003 20 23 43 35 14 8 57
2004 23 21 44 31 15 11 57
2005 21 20 41 34 15 10 59
2006 19 21 40 35 16 9 60

Activity Answer
Lee County FCAT Achievement Levels Grade 8
0
10
20
30
40
50
60
70
2001 2002 2003 2004 2005 2006
Year
Pe
rce
nt
of
Stu
de
nts
Levels 1-2 Levels 3-5

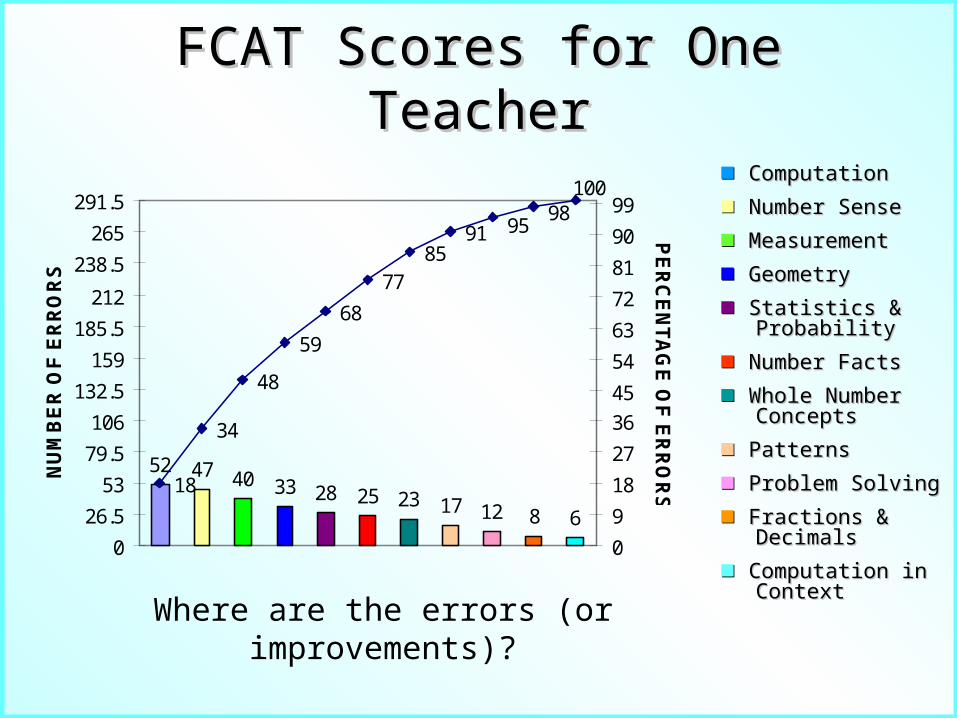
Pareto ChartPareto ChartUse to:Use to: Rank issues in order of occurrenceRank issues in order of occurrence Decide which Decide which
problems need problems need to be addressed to be addressed first first
Find the issues Find the issues that have the that have the greatest impact greatest impact
Monitor impact of changesMonitor impact of changes
Pareto Chart: Types of mistakes in Division Problems
0
10
20
30
40
50
60
70
80
90
100
Incorrect multiplication Incorrect subtraction No decimal Other
Mistake
Pe
rce
nt
0
10
20
30
40
50
60
70
80
90
100
Cu
mu
lati
ve
pe
rce
nta
ge

Pareto Chart: Types of mistakes in Division Problems
00
1010
2020
3030
4040
5050
6060
7070
8080
9090
100100
Incorrect Incorrect multiplicationmultiplication
IncorrectIncorrect subtractionsubtraction
No decimalNo decimal OtherOther
MistakeMistake
Perc
en
tPerc
en
t
00
1010
2020
3030
4040
5050
6060
7070
8080
9090
100100
Cu
mu
lati
ve p
erc
en
tag
eC
um
ula
tive p
erc
en
tag
e

Pareto Chart Data
FCAT Errors by subtest for one studentFCAT Errors by subtest for one student
StrandStrand Frequency of Frequency of ErrorsErrors
Percentage of Percentage of ErrorsErrors
Cumulative Cumulative PercentagePercentage
GeometryGeometry 77 7/24 = 29%7/24 = 29% 29%29%
MeasurementMeasurement 55 5/24 = 21%5/24 = 21% 50%50%
AlgebraAlgebra 55 5/24 = 21%5/24 = 21% 71%71%
Number SenseNumber Sense 44 4/24 = 17%4/24 = 17% 88%88%
Data AnalysisData Analysis 33 3/24 = 12%3/24 = 12% 100%100%
TotalTotal 2424 24/24 = 100%24/24 = 100%

0
10
20
30
40
50
60
70
80
90
100
Geometry Measurement Data Analysis Algebraic Thinking Number Sense
Subtest Categories
Pe
rce
nt
Megan Smith - Grade 9 - FCAT Subtest Megan Smith - Grade 9 - FCAT Subtest ScoresScores

2005/2006 - 9th Grade - Lee County 2005/2006 - 9th Grade - Lee County FCAT Errors by SubtestFCAT Errors by Subtest
0
10
20
30
40
50
60
70
80
90
100
Geometry AlgebraicThinking
Number Sense Measurement Data Analysis
Subtest Categories
Per
cen
t
52 47 40 33 28 25 23 17 12 8 6
18
34
48
59
68
7785
91
10098
95
0
26.5
53
79.5
106
132.5
159
185.5
212
238.5
265
291.5
NU
MB
ER
OF
ER
RO
RS
0
9
18
27
36
45
54
63
72
81
90
99
PE
RC
EN
TA
GE
OF
ER
RO
RS
ComputationComputation
Number SenseNumber Sense
MeasurementMeasurement
GeometryGeometry
Statistics & Statistics & ProbabilityProbability
Number FactsNumber Facts
Whole Number Whole Number ConceptsConcepts
PatternsPatterns
Problem SolvingProblem Solving
Fractions & Fractions & DecimalsDecimals
Computation in Computation in ContextContext
FCAT Scores for One TeacherFCAT Scores for One Teacher
Where are the errors (or improvements)?

RunRun ChartChartUse to:Use to: Monitor progress over timeMonitor progress over timeDisplay data in simplest formDisplay data in simplest form
0
10
20
30
40
50
60
70
80
90
100
1 2 3 4 5 6 7 8 9
Run Chart: Percent of Students Scoring at Least 80% on Weekly Math QuizRun Chart: Percent of Students Scoring at Least 80% on Weekly Math Quiz
Number of StudentsNumber of Students
Perc
en
tPerc
en
t

Student Run ChartsStudent Run ChartsThe place The place to start is to start is
with with students students graphing graphing their own their own progress.progress.

Run Chart: Number of Math Vocabulary WordsRun Chart: Number of Math Vocabulary Words
140140
145145
150150
155155
160160
165165
170170
175175
180180
11 22 33 44 55 66 77 88 99
WeekWeek
Num
ber
of
Word
s C
orr
ect
Num
ber
of
Word
s C
orr
ect

Class Goal: By the end of 9 weeks, 100% of our class will have an Class Goal: By the end of 9 weeks, 100% of our class will have an average of at least 80% on our weekly math quizzes.average of at least 80% on our weekly math quizzes.
Class Run Chart: Percent of Students Averaging at Least Class Run Chart: Percent of Students Averaging at Least 80% on Weekly Math Quizzes80% on Weekly Math Quizzes
00
1010
2020
3030
4040
5050
6060
7070
8080
9090
100100
11 22 33 44 55 66 77 88 99WeekWeek
Perc
en
t w
/ avg
. of
at
least
80
%Perc
en
t w
/ avg
. of
at
least
80
%
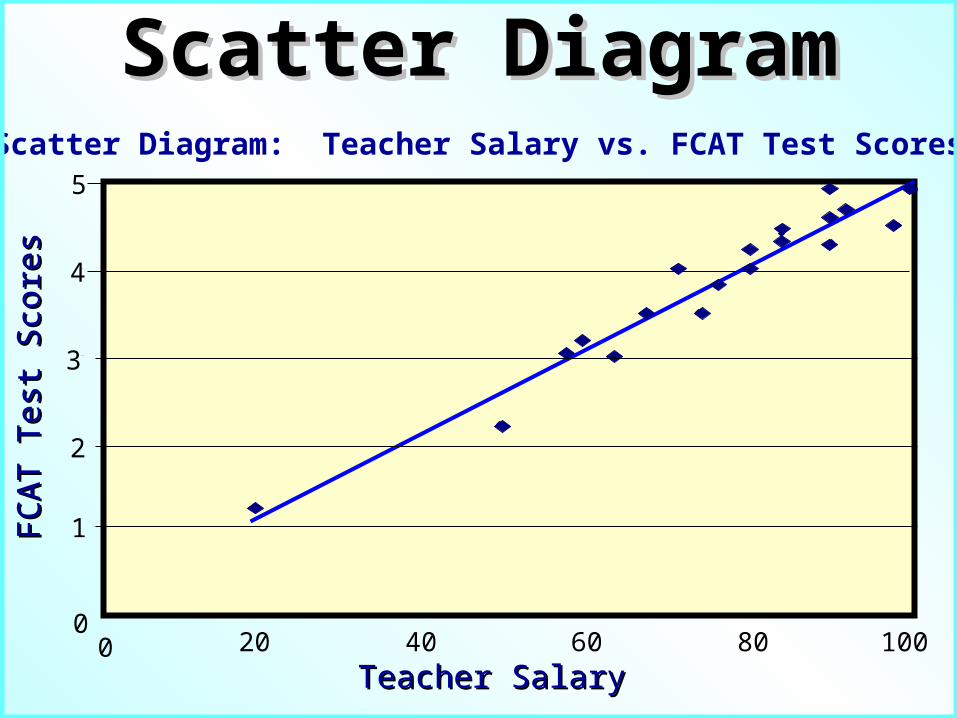
Scatter DiagramScatter DiagramScatter Diagram: Teacher Salary vs. FCAT Test Scores
1
2
3
4
5
0 20 40 60 80 100Teacher SalaryTeacher Salary
FCA
T T
est
Sco
res
FCA
T T
est
Sco
res
0

Scatter Diagram: Number of SiblingsScatter Diagram: Number of Siblings vs Grade Point Averagevs Grade Point Average
0.00.0
0.50.5
1.01.0
1.51.5
2.02.0
2.52.5
3.03.0
3.53.5
4.04.0
4.54.5
00 11 22 33 44 55 66
Number of SiblingsNumber of Siblings
Gra
de P
oin
t A
vera
ge
Gra
de P
oin
t A
vera
ge

Scatter Diagram: Hours of Sleep Scatter Diagram: Hours of Sleep vs. Mistakes on Testvs. Mistakes on Test
00
22
44
66
88
1010
1212
0 1 2 3 4 5 6 7 8 9 10
Hours of SleepHours of Sleep
Mis
take
sM
ista
kes

Student Score Level
1 96 5
2 64 4
3 68 5
4 86 5
5 71 4
6 86 5
7 82 4
8 79 5
9 68 3
10 46 4
11 50 2
12 39 1
13 21 1
14 54 3
15 61 2

Sopris-West Algebra Readiness Score vs. FCAT Level
0123456
0 20 40 60 80 100
Readiness Scores
FC
AT
Lev
el

Radar ChartRadar Chart

Example
8TH Grade Class of 2006
Total Students
Tested
Percentage of Total Scoring at Level
1 2 3 4 5 3-5
5th Grade 322 7.1 28.3 29.8 27.3 7.5 64.6
6th Grade
35322.1 25.5 28.9 18.4 5.1 52.4
7th Grade 343 16.3 23 38.2 16.3 6.1 60.6
8th Grade 439 13 21 40 18 8 66

8th Grade Class of 2006Percentage of Students
At Each Level
0
10
20
30
40
50
60
701
2
3
4
5
3-5
5th Grade
6th Grade
7th Grade
8th Grade

Item AnalysisItem Analysis
Use to:Use to:Determine mastered Determine mastered contentcontent
Determine most common Determine most common mistakesmistakes

CLASSROOM TEST ANALYSISBENCHMARKASSESSED
ITEM#
NUMBER CORRECT
NUMBERINCORRECT
NUMBERPARTIALCREDIT
NUMBERDISTRACTOR
A/1
NUMBERDISTRACTOR
B/2
NUMBERDISTRACTOR
C/3
NUMBERDISTRACTOR
D/4
NUMBERNO
ANSWER
1
2
3
4
5
6
7
8
9
10
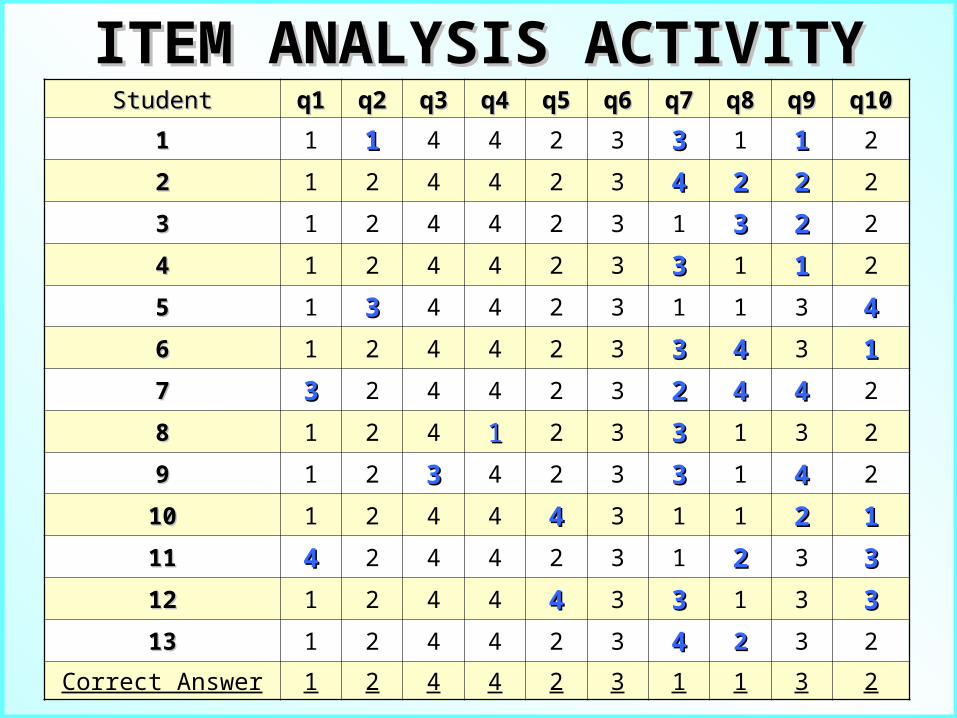
StudentStudent q1q1 q2q2 q3q3 q4q4 q5q5 q6q6 q7q7 q8q8 q9q9 q10q10
11 1 11 4 4 2 3 33 1 11 2
22 1 2 4 4 2 3 44 22 22 2
33 1 2 4 4 2 3 1 33 22 2
44 1 2 4 4 2 3 33 1 11 2
55 1 33 4 4 2 3 1 1 3 44
66 1 2 4 4 2 3 33 44 3 11
77 33 2 4 4 2 3 22 44 44 2
88 1 2 4 11 2 3 33 1 3 2
99 1 2 33 4 2 3 33 1 44 2
1010 1 2 4 4 44 3 1 1 22 11
1111 44 2 4 4 2 3 1 22 3 33
1212 1 2 4 4 44 3 33 1 3 33
1313 1 2 4 4 2 3 44 22 3 2
Correct Answer 1 2 4 4 2 3 1 1 3 2
ITEM ANALYSIS ACTIVITYITEM ANALYSIS ACTIVITY

Using Formative DataUsing Formative Datafor Continuous Improvementfor Continuous Improvement
Random sampling of end-Random sampling of end-of the year items provides of the year items provides
students a constant students a constant reviewreview of what has been of what has been taught and a constant taught and a constant
previewpreview of what is yet to of what is yet to be taught.be taught.

The The square rootsquare root of of “n” is an ample “n” is an ample sample size for sample size for accurate data, if accurate data, if
collected weekly or collected weekly or bi-weekly.bi-weekly.
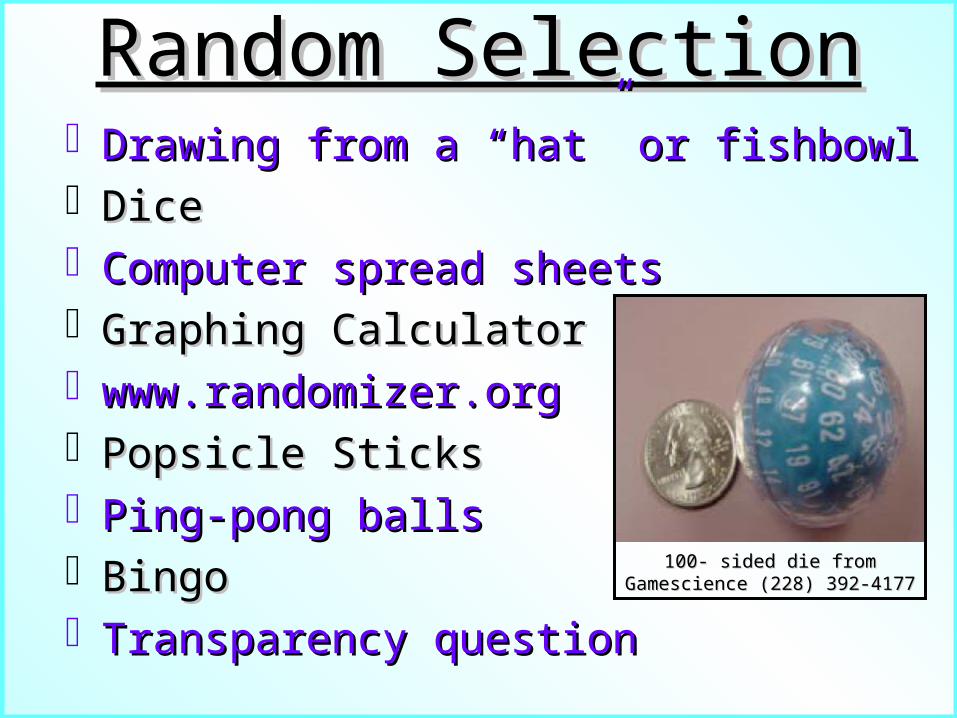
Random SelectionRandom Selection Drawing from a “hat” or fishbowlDrawing from a “hat” or fishbowl DiceDice Computer spread sheetsComputer spread sheets Graphing CalculatorGraphing Calculator www.randomizer.orgwww.randomizer.org Popsicle SticksPopsicle Sticks Ping-pong ballsPing-pong balls BingoBingo Transparency questionTransparency question
100- sided die from 100- sided die from Gamescience (228) 392-4177Gamescience (228) 392-4177

Data analysis provides:Data analysis provides:
InsightInsightandand
QuestionsQuestions

Adapted from Adapted from Getting Excited About DataGetting Excited About Data, Edie Holcomb, Edie Holcombwww.corwinpress.comwww.corwinpress.com
What question are we trying to answer?What question are we trying to answer?
What can we tell from the data?What can we tell from the data?
What can we NOT tell from the data?What can we NOT tell from the data?
What else might we want to know?What else might we want to know?
What good news is here for us to What good news is here for us to celebrate?celebrate?
What opportunities for improvement are What opportunities for improvement are suggested by the data?suggested by the data?
Questions to Ponder…Questions to Ponder…

ActionAction
Answers!Answers!ProvidesProvides

Implement the plan.Implement the plan.
Analyze the Analyze the results.results.
Make improvements.Make improvements.
Steps to Steps to ImprovementImprovement
PLANPLAN
DODO
STUDYSTUDY
ACTACT
What information have I What information have I gained from my data? gained from my data?
What interventions can I What interventions can I put in place?put in place?
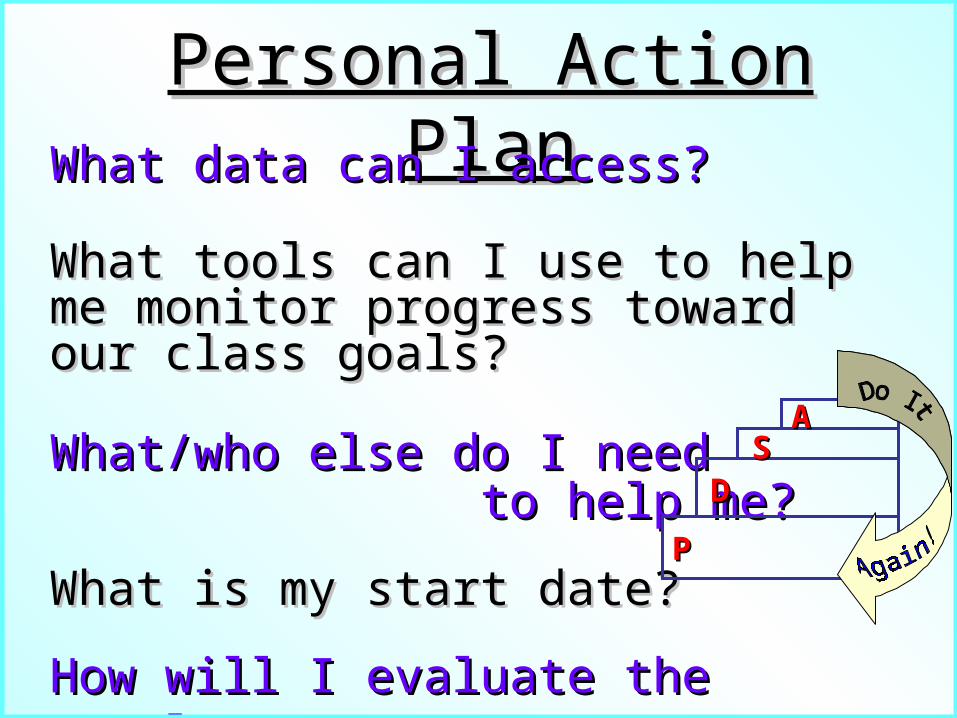
Personal Action PlanPersonal Action PlanWhat data can I access?What data can I access?
What tools can I use to help me What tools can I use to help me monitor progress toward our class monitor progress toward our class goals?goals?
What/who else do I need What/who else do I need to help me? to help me?
What is my start date?What is my start date?
How will I evaluate the results?How will I evaluate the results?
PP
DDSS
AA