Embed Size (px)
Citation preview

Using Dysphonic Voice to Characterize Speaker’s BiometryPedro Gómez, Eugenia San Segundo, Luis M. Mazaira,
Agustín Álvarez & and Victoria Rodellar
Center for Biomedical Technology, Universidad Politécnica de Madrid &Universidad Internacional Menéndez Pelayo (UIMP), Madrid, Spain
Abstract. Phonation distortion leaves relevant marks in a speaker’s biometricpro�le. Dysphonic voice production may be used for biometrical speaker charac-terization. In the present paper phonation features derived from the glottal source(GS) parameterization, after vocal tract inversion, is proposed for dysphonic voicecharacterization in Speaker Veri�cation tasks. The glottal source derived para-meters are matched in a forensic evaluation framework de�ning a distance-basedmetric speci�cation. The phonation segments used in the study are derived from�llers, long vowels, and other phonation segments produced in spontaneous te-lephone conversations. Phonated segments from a telephonic database of 100 maleSpanish native speakers are combined in a 10-fold cross-validation task to producethe set of quality measurements outlined in the paper. Shimmer, mucosal wavecorrelate, vocal fold cover biomechanical parameter unbalance and a subset of theGS cepstral pro�le produce accuracy rates as high as 99.57 for a wide threshold in-terval (62.08-75.04%). An Equal Error Rate of 0.64 % can be granted. The proposedmetric framework is shown to behave more fairly than classical likelihood ratiosin supporting the hypothesis of the defense vs that of the prosecution, thus o�eringa more reliable evaluation scoring. Possible applications are Speaker Veri�cationand Dysphonic Voice Grading.
Keywords: Phonation, Speaker Recognition, Voice Production, Speech Processing.
Resumo. A distorção de fonação deixa marcas relevantes no per�l biométrico deum falante. A produção de voz disfônica pode ser usada como caracterização bi-ométrica. Neste artigo, propõe-se a utilização de aspectos de fonação derivadosda parametrização da fonte glótica (FG), após a inversão do trato vocal, para ca-racterização de voz disfônica em tarefas de veri�cação de locutor. Os parâmetrosderivados da fonte glótical são combinados em um sistema de avaliação forensepara de�nir uma especi�cação métrica baseada em distância. Os segmentos defonação utilizados no estudo são derivados de elementos de preenchimento, vogaislongas e outros segmentos de fonação produzidos em conversas telefônicas espon-tâneas. Segmentos de fonação de um banco de dados telefônicos de 100 falantesnativos espanhóis do sexo masculino são combinados em uma tarefa de validação

Gómez, P. et al. - Using Dysphonic Voice to Characterize Speaker’s BiometryLanguage and Law / Linguagem e Direito, Vol. 1(2), 2014, p. 42-66
cruzada por 10 vezes para produzir o conjunto de medições de qualidade descritoneste artigo. Shimmer, correlato de onda mucosa, desequilíbrio de parâmetro bi-omecânico de cobertura da prega vocal e um subconjunto dos per�s de cepstraisde FG produzem taxas de precisão de até 99,57 para um largo intervalo (62,08-75,04%). Uma Taxa de Erros Iguais de 0,64% pode ser concedida. Demonstra-seque a estrutura métrica proposta comporta-se de forma mais justa do que a clás-sica razão de verossimilhança para apoiar a hipótese da defesa vs a do promotor,oferecendo assim um escore de avaliação mais con�ável. As aplicações possíveissão Veri�cação de Locutor e Graduação de Voz Disfônica.
Palavras-chave: Fonação, Reconhecimento de Falante, Produção de Voz, Processamento de Fala.
IntroductionVoice Pathology has been profoundly studied and characterized in the past decade (De-jonckere, 2010; Hakkesteegt et al., 2010; Roy et al., 2013). Most of the advances producedin the detection and grading of pathology can be applied in other �elds such as forensicspeaker recognition. In this article phonation features derived from the parameterizationof the glottal source after the vocal tract inversion is proposed for dysphonic voice cha-racterization in speaker veri�cation tasks (Gomez-Vilda et al., 2012), where the glottalsource can be seen as a correlate of pressure build up in the glottis.
Phonation is the activity of voice production as a consequence of vocal fold vibration.It is present in speech, in voiced sounds, although speech is composed of both voicedand voiceless sounds, and the latter sounds are not based on phonation. Phonation mustbe seen as a biometrical mark of the person, similar to other behavior-based activities,such as gait, or writing. It presents several advantages with respect to speech as a studysignal, in the sense that the vocal tract transfer function in speech is interfering withphonation biometry by introducing articulation features, which increment intra-speakervariability.
Phonation may be classi�ed into the following overlapping groups:
• Normophonic, which is de�ned by the presence of a stable fundamental fre-quency in sustained vowels, stable intensity and long phonation capability, ab-sence of roughness, absence of breathiness, and e�ortless voice production. Be-sides, it is characterized by clear and precise open and closed phases of the vocalfolds, large Maximum Flow Declination Rate, and good extension of harmonicspectrum, extending over 5 KHz. The instrumental exploration of the larynxmust not reveal organic or anatomical defects or lesions.
• Dysphonic, non organic, which is de�ned by the presence of perceptual acous-tical features related to unstable or asymmetric phonation, such as presence ofroughness, air in voice or strain, showing an irregular or too short vocal foldclosed phase. The extension of the harmonic spectrum may not reach 4 KHz.Nevertheless the instrumental exploration of the larynx does not reveal orga-nic defects or lesions, although anatomical defects may be present, as a certaindegree of asymmetry.
• Pathologic, organic, which is de�ned by perceptual phonation defects a�ectingstability of fundamental frequency and intensity, shorter phonation capability,and roughness, air in voice, weak voice, and a�ected short harmonic spectrum,
43

Gómez, P. et al. - Using Dysphonic Voice to Characterize Speaker’s BiometryLanguage and Law / Linguagem e Direito, Vol. 1(2), 2014, p. 42-66
usually not extending over 2 kHz. Instrumental exploration of the larynx willreveal speci�c defects or lesions, as nodules, polyps, cysts, edemae, granulomae,sulci, carcinomae, etc.
• Pathologic, neurological, which is de�ned by perceptual phonation defects asin the organic case, but in this group the instrumental inspection of the larynxwill not reveal speci�c organic defects or lesions, although vocal folds will notshow a regular vibration pattern, and many times vocal fold vibration asymme-try is present, a�ecting one of the vocal folds (unilateral paresis), or both vocalfolds. Other forms of irregularity may a�ect the stability of phonation (spasmo-dic dysphonia). Frequently the etiology of the irregularity remains unclear.
The burning question is to what extent dysphonic voice may be present in a givenspeaker. In other words, to what extent normophonic voice is the norm in a sample ofa general population. This extent is di�cult to assess, and depends on how strict thespeci�cation for the term normophonic is established. Besides, the phonation capabilityof a speaker will vary strongly during a lifetime, progressively degrading with age to be-come a presbyphonic voice during the third age in most of the population, characterizedby an increment in roughness, breathiness and asthenia, depicting a creaky phonationcondition. It must be taken into account that many people su�er from a higher degree ofphonation deterioration due to speci�c habits such as smoking, drinking or drug abuse,or to the consequence of larynx in�ammatory processes (�u, cough, and other respira-tory diseases), or simply from voice abuse (contact center professionals, actors, speakers,dealers, etc.). Thus, it may be said that phonation conditions are better during youth,and start to degrade with age. Therefore, it is really hard to establish the populationpercentage corresponding to each group.
It is very important to determine the characteristics of normophonic voice produc-tion, since even in that case, small irregularities may be expected in the main featuresmentioned, as stability in frequency and intensity, regular and symmetric fold vibration,perfect and complete open and closed phases, and timbre spectrum, making phonation aspeci�c personal print. Even under perfect phonation conditions population di�erencesexist, opening the possibility to use phonation features as biometrical marks.
The main phonation features resulting from biometrical di�erences are due to veryspeci�c physiological causes, and can be grouped into these two classes (Gómez et al.,2013):
• Vocal fold vibration asymmetry• De�cient glottal closure during the closed phase (contact phase)
The physiological reasons conditioning phonation features are summarized in Fi-gure 1.
The template in Figure 1.a shows the vocal folds as two vertical bands united in theanterior side of the cricoid process (upper part of each sketch), separated in the posteriorside (lower part of each sketch), leaving a space for the free �ow of air to and from lungs.In Figure 1.b the vocal folds are shown together closing the glottis (contact phase), dueto the action of the transversal and oblique laryngeal and crico-arytenoid muscles. The�ow of air is stopped. In Figure 1.c the vocal folds are still united in the posterior partof the glottis under the action of the laryngeal muscles, but the pressure built up in thelungs has taken them apart (abduction), leaving a glottal space through with air can
44

Gómez, P. et al. - Using Dysphonic Voice to Characterize Speaker’s BiometryLanguage and Law / Linguagem e Direito, Vol. 1(2), 2014, p. 42-66
Figura 1. Vocal fold simpli�ed situations: a) Open glottis in breathing; b) closed phase(contact phase) as part of the phonation cycle; c) open phase as part of the phonationcycle; d) de�cient closure in the posterior third of the glottis, showing a permanentgap; e) asymmetric contact defect; f) de�cient closure in the medial third, due to abilateral lesion (nodules). Contact defects during the contact phase may be producedby other lesions (unilateral or bilateral). In all the plots the anterior part of the glottisis depicted upwards. (Figures produced by authors.)
�ow from lungs to pharynx (open phase). The situations described in a), b) and c) areconsidered normal in the behavior of a healthy larynx. In the lower row some defectsare described related with the contact phase. For instance, in Figure 1.d both vocal foldsare not completely closed at the posterior side, therefore an air escape is to be expected.In Figure 1.e the incomplete closure is due to an asymmetry a�ecting mainly one of thevocal folds (unilateral paralysis). In Figure 1.f the contact is compromised by a bilaterallesion in the contact surface of the vocal folds, as in the case of nodules, for instance.The closure is not perfect and an escape of air is to be expected. Pictures of these contactdefects from actual endoscopic recordings taken during the contact phase are presentedin Figure 2.
The situations described in d), e) and f) produce observable correlates in the air �owand pressure build up in larynx, and propagate to the signal recorded by a microphoneas phonated speech. Therefore, the contact defects will leave a biometrical mark in thephonation of a speaker if any of these defects is present to a greater or lesser extent.The behavior of the biometrical mark may be inferred from Fant’s source-�lter modelillustrated in Figure 3 (Fant, 1997).
Voiced speech (phonation) is produced by a glottal excitation model, resulting fromvocal fold vibration. The pressure build up in the vocal folds (glottal source) propagatesthrough the vocal tract (or more properly, the oro-naso-pharyngeal tract) to reach themouth or nostrils (depending on nasalization) to be radiated as a signal Sr(n) reachinga microphone or other recording device. Voiceless speech is produced by frictional airturbulence (turbulent source) resulting from fast air�ow in speci�c parts of the vocaltract (vocal folds, pharynx, tongue, teeth, lips. . . ). Either glottal source, or turbulent
45

Gómez, P. et al. - Using Dysphonic Voice to Characterize Speaker’s BiometryLanguage and Law / Linguagem e Direito, Vol. 1(2), 2014, p. 42-66
Figura 2. Pictures illustrating contact defects: Left picture: de�cient closure in theposterior third of the glottis as a result of bilateral nodules. Middle picture: Unilateralcontact defect due to a right vocal foldReinke’s edema. Right picture: bilateral contactdefect in an hourglass pattern showing anterior and posterior gaps. Anterior sectionof larynx upwards (Photos provided by the ENT Services of Hospital UniversitarioGregorio Marañón of Madrid.)
Figura 3. Fant’s source-�lter model to explain speech production. (Figure producedby authors)
�ow, or both, will be the cause of the speech signal radiated. The resulting spectrum ofthe radiated signal (Figure 3, low row, right) will be the consequence of the applicationof the vocal tract transfer function (Figure 3, low row, middle) on the source spectrum(Figure 3, low row, left). Fant’s model inspires the methodology to reconstruct the glottalsource from phonated speech. The methodology consists in removing the in�uence ofthe radiation model and the vocal tract transfer function by inverse �ltering by di�erentmethods. The one used in the present study is described in Gómez-Vilda et al. (2009),and is summarized in Figure 4.
The speech signal s(n) is �rst processed (1) to eliminate the in�uence of radiationand other undesirable e�ects due to channel characteristics. The radiation-compensatedsignal sl(n) is �ltered by a lattice-ladder mirror �lter (2) which is designed to removepartially the in�uence of a hypothesized glottal source, generating a signal svi(n) whichis mainly characterized by the vocal tract. This signal is modeled (4) to obtain the inversesignature of the vocal tract, which will be applied to the radiation-compensated signalsl(n) to remove the in�uence of the vocal tract (5). The resulting signal sri(n) will be
46

Gómez, P. et al. - Using Dysphonic Voice to Characterize Speaker’s BiometryLanguage and Law / Linguagem e Direito, Vol. 1(2), 2014, p. 42-66
Figura 4. Methodology for the reconstruction of the glottal source from segments ofphonated speech by recursive inverse adaptive �ltering. (Figure produced by authors.)
dominated by the glottal features, and may be modeled (3) to produce a better inverseestimate of the glottal features, and injected in (2) to produce also a better estimate ofsvi(n). The recursion is iterated a low number of times, and the glottal residual sri(n)will be used to produce the glottal source by numerical integration. An example of theglottal source reconstruction is shown in Figure 5.
It may be seen that the reconstructed glottal residual sri(n) in Figure 5.b is the resultof removing vocal tract resonances found in the original speech signal s(n). In particu-lar the presence of the �rst resonance (formant) may be seen as a ringing (successiveoscillations) taking place during each of the 17 pseudo-periodical glottal cycles exten-ding over slightly more than 180 ms in Figure 5.a. The residual sri(n) is numericallyintegrated to produce the glottal source in Figure 5.c, which shows the main featuresof the pressure build up in the glottis. The main feature as far as the harmonic spectralcontents of speech are concerned, is the maximum �ow declination rate (MFDR), whichis the negative drop of pressure signaled by red asterisks due to the closing phase. Theglottal source is restored to its quiescent value (0) following a recovery pattern to reacha plateau, marking the duration of the contact phase. During the open phase, a pressureincrement can be appreciated to reach a maximum, after which a sharp drop to reachthe MFDR may be appreciated (closing phase). Finally in Figure 5.d a series of patternsshowing the successive glottal �ow cycles may be seen.
Once the glottal source has been reconstructed it is being parameterized accordingto di�erent techniques in the time as well as in the frequency domain. The parametersare evaluated for each of the phonation cycles in the speech segment being analyzed(typically between 50 and 200 ms long). For male voice, between 5-20 glottal cycles areto be found in such an interval. Cycle-synchronous estimations of each parameter arestored in an array, average values and standard deviations are also evaluated. In whatfollows a brief description of these techniques and the resulting parameters is given:
47
Gómez, P. et al. - Using Dysphonic Voice to Characterize Speaker’s BiometryLanguage and Law / Linguagem e Direito, Vol. 1(2), 2014, p. 42-66
Figura 5. Example of glottal source and �ow reconstruction from phonated speech:a) original speech signal (s); b) glottal residual sri(n), or derivative of the forwardpressure wave; c) reconstructed glottal source (correlate of the pressure build up inthe glottis); d) reconstructed glottal �ow. (Figure produced by authors.)
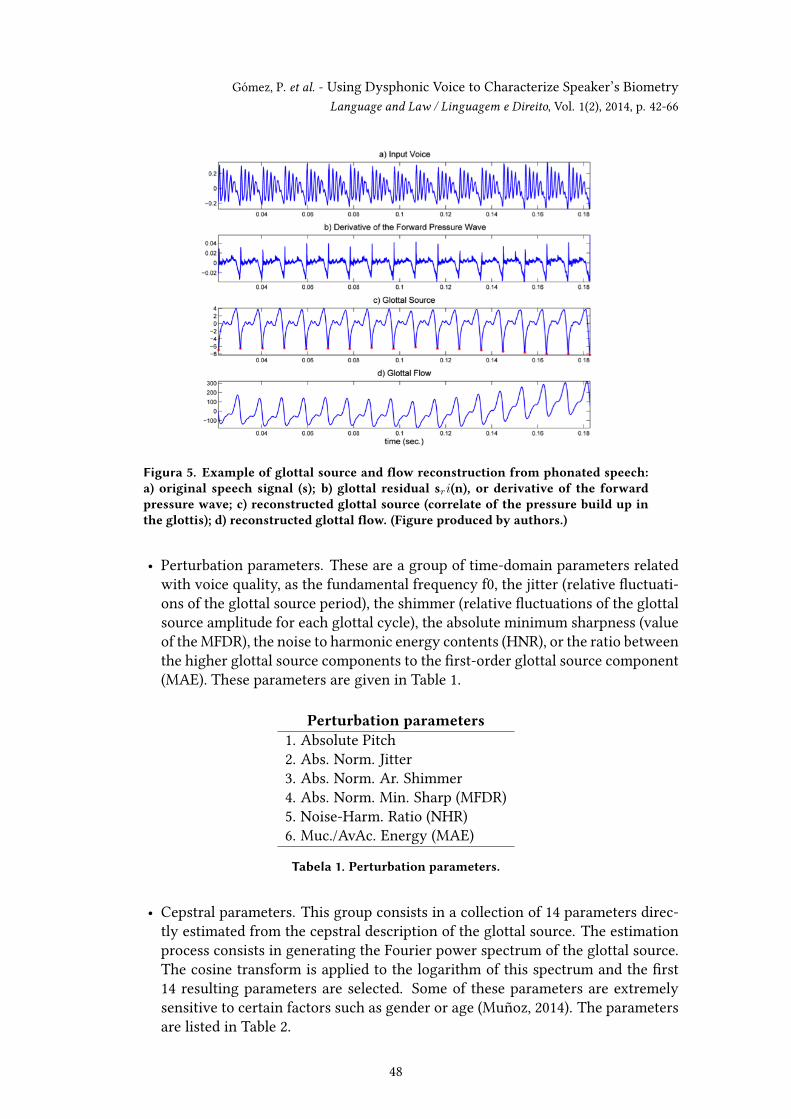
• Perturbation parameters. These are a group of time-domain parameters relatedwith voice quality, as the fundamental frequency f0, the jitter (relative �uctuati-ons of the glottal source period), the shimmer (relative �uctuations of the glottalsource amplitude for each glottal cycle), the absolute minimum sharpness (valueof the MFDR), the noise to harmonic energy contents (HNR), or the ratio betweenthe higher glottal source components to the �rst-order glottal source component(MAE). These parameters are given in Table 1.
Perturbation parameters1. Absolute Pitch2. Abs. Norm. Jitter3. Abs. Norm. Ar. Shimmer4. Abs. Norm. Min. Sharp (MFDR)5. Noise-Harm. Ratio (NHR)6. Muc./AvAc. Energy (MAE)
Tabela 1. Perturbation parameters.
• Cepstral parameters. This group consists in a collection of 14 parameters direc-tly estimated from the cepstral description of the glottal source. The estimationprocess consists in generating the Fourier power spectrum of the glottal source.The cosine transform is applied to the logarithm of this spectrum and the �rst14 resulting parameters are selected. Some of these parameters are extremelysensitive to certain factors such as gender or age (Muñoz, 2014). The parametersare listed in Table 2.
48

Gómez, P. et al. - Using Dysphonic Voice to Characterize Speaker’s BiometryLanguage and Law / Linguagem e Direito, Vol. 1(2), 2014, p. 42-66
Cepstral Parameters7. MWC Cepstral 18. MWC Cepstral 29. MWC Cepstral 310. MWC Cepstral 411. MWC Cepstral 512. MWC Cepstral 613. MWC Cepstral 714. MWC Cepstral 815. MWC Cepstral 916. MWC Cepstral 1017. MWC Cepstral 1118. MWC Cepstral 1219. MWC Cepstral 1320. MWC Cepstral 14
Tabela 2. Cepstral parameters.
• Spectral parameters. The spectral pro�le of the glottal source is conditioned bythe biomechanical behavior of the vocal folds, especially the visco-elastic linkbetween the fold body (musculus vocalis) and the epithelial cover and conjunc-tive tissues in Reinke’s space. The envelope of the harmonic spectrum of theglottal source shows peaks and valleys which are in�uenced by this biomecha-nical behaviour. Anomalous relations among these peaks and valleys may serveas biometrical markers. The �rst group of parameters given in Table 3 are am-plitude estimates of the peaks and valleys (21-27). The second group give theirrelative positions in frequency (28-32). Parameters 33 and 34 give the depth ofthe two �rst valleys relative to their frequency span (slenderness).
Spectral Parameters21. MW PSD 1st Max. ABS.22. MW PSD 1st Min. rel.23. MW PSD 2nd Max. rel.24. MW PSD 2nd Min. rel.25. MW PSD 3rd Max. rel.26. MW PSD End Val. rel.27. MW PSD 1st Max. Pos. ABS.28. MW PSD 1st Min. Pos. rel.29. MW PSD 2nd Max. Pos. rel.30. MW PSD 2nd Min. Pos. rel.31. MW PSD 3rd Max. Pos. rel.32. MW PSD End Val. Pos. rel.33. MW PSD 1st Min NSF34. MW PSD 2nd Min NSF
Tabela 3. Spectral parameters.
49

Gómez, P. et al. - Using Dysphonic Voice to Characterize Speaker’s BiometryLanguage and Law / Linguagem e Direito, Vol. 1(2), 2014, p. 42-66
• Biomechanical parameters. The spectral behavior of the glottal source is direc-tly related to the distribution of mass and visco-elasticity of the vocal fold bodyand cover. A methodology to estimate the distribution of mass and sti�ness ofeach structure is possible using spectral matching techniques (Gómez-Vilda et al.,2007). The most signi�cant estimates are the mass and sti�ness of the vocal foldbody and cover, the ratio of energy losses due to viscid and turbulent �ow beha-vior, and their respective unbalances. These are estimated using relative com-parisons of mass, sti�ness and losses from neighbor glottal cycles. The list ofestimated parameters is given in Table 4.
Biomechanical Parameters35. Body Mass36. Body Losses37. Body Sti�ness38. Body Mass Unbalance39. Body Losses Unbalance40. Body Sti�ness Unbalance41. Cover Mass42. Cover Losses43. Cover Sti�ness44. Cover Mass Unbalance45. Cover Losses Unbalance46. Cover Sti�ness Unbalance
Tabela 4. Biomechanical parameters.
• Temporal parameters. The glottal cycle is divided into a closed phase and anopen phase. The time instants associated with the start of the closed and openphase, as well as the time required to reach the quiescent pressure (recovery)and the maximum amplitude of the glottal source relative to the MFDR are esti-mated as important parameters in the time domain. Due to irregularities in theglottal source time pro�le, the recovery and open instants are estimated twice toproduce more robust results. The open and closed instants, as well as the startof the closing phase are also estimated on the �ow signal. The list of temporalparameters is given in Table 5.
• Glottal gap parameters. This set of parameters is designed to evaluate the contactdefects, directly on the �ow, calculating the ratio of air escape during the con-tact phase relative to the air escape during the open phase (59), or on the glottalsource, in which case the defects are di�erentiated as contact, adduction or per-manent ones, depending to which phase of the glottal cycle they a�ect. The listof the parameters is given in Table 6.
• Tremor parameters. The sti�ness of the vocal fold body (musculus vocalis) isdirectly in�uenced by the neuromotor action of the laryngeal muscles, therefore,many neurological pathologies may be characterized from the estimates of thissti�ness (parameter 37). Hypo-tonic or hyper-tonic deviations of this parameterare important correlates in Parkinson’s Disease, for instance, as well as tremor.
50

Gómez, P. et al. - Using Dysphonic Voice to Characterize Speaker’s BiometryLanguage and Law / Linguagem e Direito, Vol. 1(2), 2014, p. 42-66
Temporal Parameters47. Rel. Recov. 1 Time48. Rel. Recov. 2 Time49. Rel. Open 1 Time50. Rel. Open 2 Time51. Rel. Max. Ampl. Time52. Rel. Recov. 1 Ampl.53. Rel. Recov. 2 Ampl.54. Rel. Open 1 Ampl.55. Rel. Open 2 Ampl.56. Rel. Stop Flow Time57. Rel. Start Flow Time58. Rel. Closing Time
Tabela 5. Temporal parameters.
Glottal GAP Parameters59. Val. Flow GAP60. Val. Contact GAP61. Val. Adduction GAP62. Val. Permanent GAP
Tabela 6. Glottal GAP parameters.
A set of six parameters is devoted to track this disease. The �rst three give adescription of the tremor in terms of its autoregressive modeling (63-65). Thelast ones give the tremor frequency in cycles/s (66), the reliability of this estimate(67), or the tremor amplitude in root mean square relative to the vocal fold bodyaverage amplitude (68). The list of tremor parameters is given in Table 7.
Tremor Parameters63. 1st. Order Cyc. Coe�.64. 2nd. Order Cyc. Coe�.65. 3rd. Order Cyc. Coe�.66. Tremor Frequency67. Estimation Reliability68. Tremor rMS Amplitude
Tabela 7. Tremor parameters.
The interested reader can �nd a more detailed description of each parameter mea-ning and distribution in Gómez et al. (2013).
Materials and methodsThe purpose of the present research was to describe a methodology to parameterize theglottal source in terms of dysphonic voice and to study how to apply these parametersin speaker veri�cation tasks. For this purpose a database of GSM-quality recordingsfrom telephone conversations by 100 male speakers was used. Speech was recorded
51

Gómez, P. et al. - Using Dysphonic Voice to Characterize Speaker’s BiometryLanguage and Law / Linguagem e Direito, Vol. 1(2), 2014, p. 42-66
at 8 KHz 16 bits and mu-law. Each conversation lasted between 5 and 30 min., �llersand long vowels were extracted from them. These long vowels were samples of vowels[a], [æ], [ε] and [e]. For classi�cation purposes, the �rst two groups were labelled as/a/, whilst the last two groups were labelled as /e/. This last group covers most of the�llers which may be found in Spanish, consisting in lengthening of words as “de” or“que”, or spontaneous insertions of /e/. An average of 6-8 of these �llers may be foundin recordings of hesitating statements along a duration of 1-2 minutes. Fillers and longvowels were segmented as 100 ms fragments, and 68 parameters were obtained fromeach glottal cycle in the fragment. The resulting feature database is a matrix referred toas Zt.
Three experiments are described in this paper, the �rst oriented to provide full com-patibility of parameter distributions of phonations from /a/ against phonations from /e/.This experiment is described in this section. The second experiment is designed to selecta database of normative speakers from telephone quality recordings based in /e/ by con-trasting the available telephone recordings with a normative database from high qualityrecordings. The selected normative speakers will be used as a control group in futurework. The third experiment is designed to match telephone-quality /e/ recordings fromthe normative speakers against themselves to test the forensic matching capability ofthe methodology and to produce sensitivity and speci�city estimates for the matchingprotocol.
The �rst experiment consisted in confronting the distributions of each parameterin Zt=[Zta Zte] from the /a/-group Zta and the /e/-group Zte to check their degree ofequivalence. The null hypothesis consisted in assuming the equivalence of distributi-ons. The histograms for the fundamental frequency f0, jitter, shimmer, body mass andsti�ness, and cover mass and sti�ness are given in Figures 6 to 9.
Figura 6. Comparison of the histograms of f0 from the /a/-group vs the /e/-group: Thenull hypothesis cannot be rejected given the distribution overlap (Figure produced byauthors.)
The second experiment consisted in dividing the speakers in the database Zta intwo subsets of 50 speakers each (Ztan and Ztad) according to the degree of dysphoniapresent in their phonations confronting the whole speaker set with a normative set of50 normophonic speakers selected and inspected at the ear, neck and throat service ofHospital Gregorio Marañón in Madrid. Normophonic speakers were inspected by video-
52

Gómez, P. et al. - Using Dysphonic Voice to Characterize Speaker’s BiometryLanguage and Law / Linguagem e Direito, Vol. 1(2), 2014, p. 42-66
Figura 7. Comparison of the histograms of jitter and shimmer from the /a/-group vsthe /e/-group: The null hypothesis cannot be rejected given the distributions overlap.(Figure produced by authors.)
Figura 8. Comparison of the histograms of bodymass and sti�ness from the /a/-groupvs the /e/-group: The null hypothesis cannot be rejected given the distributions over-lap. (Figure produced by authors.)
Figura 9. Comparison of the histograms of cover mass and sti�ness from the /a/-group vs the /e/-group: The null hypothesis cannot be rejected given the distributionsoverlap. (Figure produced by authors.)
53
Gómez, P. et al. - Using Dysphonic Voice to Characterize Speaker’s BiometryLanguage and Law / Linguagem e Direito, Vol. 1(2), 2014, p. 42-66
endoscopy to discard any organic problem in their larynx, and their non-dysphonic con-dition was assessed by the GRBAS test (Hirano, 1981). Fragments of phonations of vowel/a/ lasting 200 ms from the normative set of speakers taken at 44100 Hz and 16 bits wereparameterized and used as a normative model (Zman) in the task of grading the /a/-groupfrom GSM-quality recordings.
The third experiment was to match the features from each speaker in the subset of 50normophonic males of the /e/-grou and telephone quality (Zten) against his own featureset as target, and against the other 49 as imposters using the matching methodologyto be described in what follows. The �llers from each speaker used in the matchingas questioned tokens and the target set used as suspects’ set were generated from twodi�erent recording sessions.
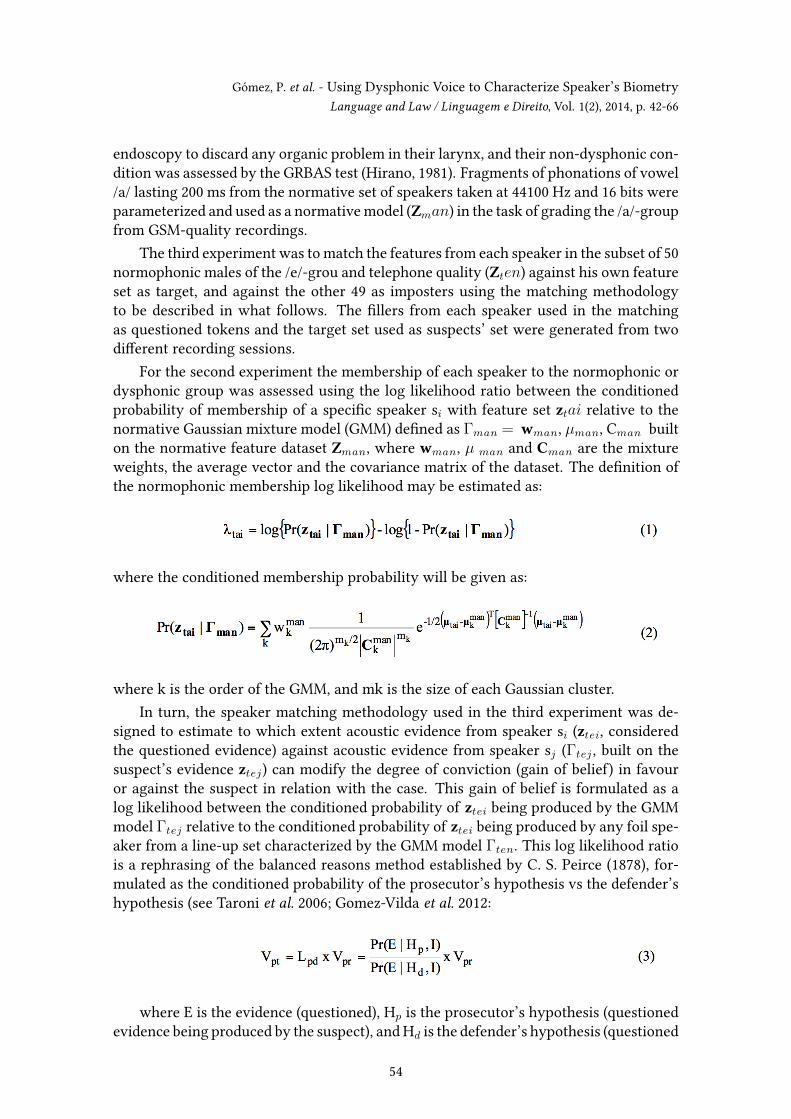
For the second experiment the membership of each speaker to the normophonic ordysphonic group was assessed using the log likelihood ratio between the conditionedprobability of membership of a speci�c speaker si with feature set ztai relative to thenormative Gaussian mixture model (GMM) de�ned as Γman = wman, µman, Cman builton the normative feature dataset Zman, where wman, µ man and Cman are the mixtureweights, the average vector and the covariance matrix of the dataset. The de�nition ofthe normophonic membership log likelihood may be estimated as:
where the conditioned membership probability will be given as:
where k is the order of the GMM, and mk is the size of each Gaussian cluster.In turn, the speaker matching methodology used in the third experiment was de-
signed to estimate to which extent acoustic evidence from speaker si (ztei, consideredthe questioned evidence) against acoustic evidence from speaker sj (Γtej , built on thesuspect’s evidence ztej) can modify the degree of conviction (gain of belief) in favouror against the suspect in relation with the case. This gain of belief is formulated as alog likelihood between the conditioned probability of ztei being produced by the GMMmodel Γtej relative to the conditioned probability of ztei being produced by any foil spe-aker from a line-up set characterized by the GMM model Γten. This log likelihood ratiois a rephrasing of the balanced reasons method established by C. S. Peirce (1878), for-mulated as the conditioned probability of the prosecutor’s hypothesis vs the defender’shypothesis (see Taroni et al. 2006; Gomez-Vilda et al. 2012:
where E is the evidence (questioned), Hp is the prosecutor’s hypothesis (questionedevidence being produced by the suspect), and Hd is the defender’s hypothesis (questioned
54

Gómez, P. et al. - Using Dysphonic Voice to Characterize Speaker’s BiometryLanguage and Law / Linguagem e Direito, Vol. 1(2), 2014, p. 42-66
evidence being produced by any other speaker). In this way the a priori probability Vpr
in favour of Hp will be ampli�ed or attenuated by the gain of belief Lpd (likelihood ratio)to produce the a posteriori probability Vpt. The log likelihood ratio may be estimated as:
and the conditioned probabilities evaluating the prosecutor’s and defender’s hypothesesare given as:
It must be noted that in the third experiment the questioned and the suspect evi-dence were derived from individual speakers in the /e/-group normative feature set Zten,whereas the line-up feature set was generated using the whole feature set Zten. The re-sults of the second and third experiments will be commented on in the section entitled“Validation and Sample Matching Results”.
Another relevant aspect has to do with the selection of the parameters consideredmost relevant for dysphonia assessment or speaker matching. This procedure will be apremise to be incorporated into any of these procedures prior to the conditional probabi-lity estimation. The feature selection carried out was based on the evaluation of Fisher’sdiscriminant ratios (Kim et al., 2005), de�ned as:
where µki and µkj are the sample averages of subsets i and j for parameter k, ζki and ζkjare the sample standard errors of subsets i and j, also for parameter k, and ni and nj arethe respective subset sample sizes. To select the most relevant features a comparison ofsubset distributions is carried out, and only the most relevant features are included inthe posterior analysis. An example is given in Figure 10.
Finally the issue of speaker match metrics is to be addressed. When estimating loglikelihood ratios following (4), (5) and (6), if feature datasets can be grouped in a lownumber of clusters, log likelihood ratios can be expressed in terms of normalized dis-tances among the questioned (test), suspect (control) and line-up (model) centroids, asshown in Figure 11.
55

Gómez, P. et al. - Using Dysphonic Voice to Characterize Speaker’s BiometryLanguage and Law / Linguagem e Direito, Vol. 1(2), 2014, p. 42-66
Figura 10. Parameter selection based on Fisher discriminant analysis: Upper tem-plate: boxplots of the most relevant parameters comparing the normophonic featuresubset (green) against the dysphonic one (red). It may be seen that most of the distri-butions show low overlap, and small extent (being the conditions to produce a largeFisher’s ratio as given by (7)). Lower template: Values of Fisher’s ratios. (Figure pro-duced by authors.)
Figura 11. 3D description of evidence matching from a practical case in terms of thethree most relevant features derived from Fisher’s analysis in Figure 10: The questi-oned evidence is grouped as the test subset (blue squares). The suspect’s evidence isgrouped as the control subset (red diamonds). The line-up data is grouped as the mo-del subset (green circles). Each subset centroid is signaled by a larger circle, diamondor square. A simple visual inspection allows inferring that the clusters of questionedand suspect evidence are much closer between themselves than to the line-up cluster.(Figure produced by authors.)
56

Gómez, P. et al. - Using Dysphonic Voice to Characterize Speaker’s BiometryLanguage and Law / Linguagem e Direito, Vol. 1(2), 2014, p. 42-66
The 3D plot may be seen as the expression of the projection from an 18-dimensionalvector space de�ned in terms of the 18 selected features to a 3-dimensional subspace interms of the 3 most relevant ones. Reducing clusters to centroids allows de�ning the loglikelihood as a normalized distance balance given by:
where DTM is the normalized distance between the centroids of the questioned evidenceset to the model set, and DTC is the distance between the centroids of the questionedand suspect evidence. The centroids of the three sample sets (test, control and model)de�ne the match triangle CTM as depicted in Figure 12.
Figura 12. Match triangle de�ned by the test, control and model centroids on the 2Dplane projection of a 3D description of evidence matching in similar terms to the onegiven in Figure 11. (Figure produced by authors.)
It may be seen that the centroids of clusters T (questioned), C (suspect) and M (line-up) de�ne a plane intersecting the three feature axes xi, xj and xk at the points I, J and K.This property allows summarizing the matching results in a balanced chart as the onegiven in Figure 13.
The Mahalanobis normalized distances between each two centroids C, T and M de-�ning the match triangle, MDTC, MDTM and MDCM as seen in Figure 13 can be usedto establish the relationship between questioned, suspect and model evidence. It is clearthat the vertical axis in the �gure is the place of all possible solutions which share thecondition of DT C=DTM , for which the log likelihood will be null (λpd=0: neutral deci-sion). The right hand plane de�ned by the vertical axis will de�ne the place of all possiblesolutions where DT C>DTM , therefore the log likelihood will be negative (λpd<0: deci-sion favoring the defender’s hypothesis). The left hand plane de�ned by DT C<DTM willcorrespond to positive log likelihood ratios (λpd<0: decision favoring the prosecutor’shypothesis). Nevertheless, the decision cannot be based on just crossing the vertical line
57

Gómez, P. et al. - Using Dysphonic Voice to Characterize Speaker’s BiometryLanguage and Law / Linguagem e Direito, Vol. 1(2), 2014, p. 42-66
Figura 13. Balanced chart summarizing the match between questioned and suspectevidence relative to the line-up model. (Figure produced by authors.)
to accept the prosecutor’s hypothesis, as this threshold would be unfair with respect tothe guarantees due to the legal defense of the suspect. A more conservative thresholddecision should be used. Accordingly with Daubert rules (see U.S. Supreme Court, 1993)accepting and evaluating the strength of evidence should be left to the Court. However,it is generally accepted by the European Network of Forensic Science Institutions thatthis kind of scale would be of useful application to grade the strength of the evidence tohelp the decision of the Court. A reasonable scale can be found in Lucy (2005), and isreproduced in Table 8.
There is another important detail regarding expression (8) and Figure 13, which con-cerns situations where DT C>>DCM and DTM>>DCM . This ill-conditioned case hap-pens when questioned and suspect evidence are far apart from the line-up data, andwould indicate a bad selection of the line-up. In this unfair situation accepting results inthe left hand side (DT C<DTM ) would break the guarantee of a fair evaluation, helpingto produce a decision in favor of the prosecutor’s hypothesis although the line-up hasnot been well selected. For this reason, the boundary signaled by the pink dash ellipsecorresponding to the place of the points meeting the condition:
has been de�ned as a protection boundary. No match should be accepted as valid if thequestioned centroid appears beyond the limits of the guarantee boundary thus de�ned.
Detection and Matching ResultsIn the present section an account of the results obtained for the second and third expe-riments, as described in the above section will be given. The summarized characteristicsand objectives of each experiment are given below.
Second experiment description:
58

Gómez, P. et al. - Using Dysphonic Voice to Characterize Speaker’s BiometryLanguage and Law / Linguagem e Direito, Vol. 1(2), 2014, p. 42-66
Range (decimal log) Range (natural log) Statementϑlg < 0 ϑln < 0 Likelihood unconditionally sup-
ports the hypothesis that the questio-ned and the suspect evidence have notbeen produced by the same speaker(favoring defender’s hypothesis)
0 ϑlg < 1 0 ϑlg < 2,3026 Likelihood weakly supports the hy-pothesis that the questioned and thesuspect evidence have been producedby the same speaker (favoring prose-cutor’s hypothesis)
1 ϑlg < 2 2,3026 ϑlg < 4,6052 Likelihood mildly supports the hy-pothesis that the questioned and thesuspect evidence have been producedby the same speaker (favoring prose-cutor’s hypothesis)
2 ϑlg < 3 4,6052 ϑlg < 6,9078 Likelihood moderately supports thehypothesis that the questioned andthe suspect evidence have been pro-duced by the same speaker (favoringprosecutor’s hypothesis)
3 ϑlg < 4 6,9078 ϑlg < 9,2103 Likelihood strongly supports the hy-pothesis that the questioned and thesuspect evidence have been producedby the same speaker (favoring prose-cutor’s hypothesis)
ϑlg ≥ 4 ϑlg ≥ 9,2103 Likelihood very strongly supportsthe hypothesis that the questionedand the suspect evidence have beenproduced by the same speaker (favo-ring prosecutor’s hypothesis)
Tabela 8. Strength of evidence according to Lucy (2005).
• Splitting the 100 male speakers into two equal-sized subsets according to theirnormophonic condition.
• Using a normative database validated by Hospital Gregorio Marañon in Madridwith samples of /a/ (50 male speakers).
• Log likelihood ratios according to (1) and (2) estimate the conditional probabilityof a given sample being normophonic or dysphonic (10-fold cross-validation, ta-king 47 subjects, leaving 3 in each set of normophonics and dysphonics per run).
Second experiment objectives:• Estimate the discrimination accuracy of the methodology and the most relevant
parameters.• Produce two reference subsets from GSM quality from the /e/-group of use in
Spanish.
59

Gómez, P. et al. - Using Dysphonic Voice to Characterize Speaker’s BiometryLanguage and Law / Linguagem e Direito, Vol. 1(2), 2014, p. 42-66
Second experiment results:• The normophonic vs dysphonic cumulants, sensitivity, speci�city and accuracy,
and Detection-Error Trade-o� plots are given in Figure 14.
Figura 14. a) False normal vs false dysphonic cumulants. b) Associated Tippet plots.c) Sensitivity, speci�city and accuracy for the second experiment. d) Detection-errortrade-o� curve. (Figure produced by authors.)
The detection procedure consists in generating a vector with the log likelihood ratiosgenerated for each sample, and their assumed condition of normophonic or dysphonic.The log likelihood span is normalized as a percentage, and a moving threshold scansit from 0 to 100%. For each value scanned the number of false normophonics (sam-ples annotated as dysphonic but quoted as normophonic because their log likelihood isover the threshold) and false dysphonics (samples annotated as normophonic but quo-ted as dysphonic because their log likelihood is under the threshold) is annotated andplotted. See that the number of false normophonics diminishes as the threshold movesrightwards in Figure 14.a to reach the point 1, where the number of false normophonicsis very low (only 3 cases out of 470 possible ones), whereas the number of false dyspho-nics is still 0. At point 8 this number starts raising to 4 out of 470, whereas the numberof false normophonics has decreased to 0, indicating that the optimal detection conditi-ons are somewhere between 1 and 8, keeping both false detections at a minimum valuesimultaneously. This fact indicates that there are two di�erent distributions for eachpopulation (false normophonics and false dysphonics), whose accumulated distributi-ons are given in Figure 14.b, known as Tippett plots. Based on these distributions, theplots in Figure 14.c give the well-known variables of sensitivity, speci�city and accuracy,according to the following relations:where TP, FP, TN and FN are the number of true dysphonics, false dysphonics, true nor-mophonics and false normophonics, respectively. These three functions are plotted inFigure 14.c, where the optimum detection point is the one where the accuracy is the ma-ximum. If the number of false dysphonics is plotted vs the number of false normophonics
60

Gómez, P. et al. - Using Dysphonic Voice to Characterize Speaker’s BiometryLanguage and Law / Linguagem e Direito, Vol. 1(2), 2014, p. 42-66
the result is the template in Figure 14.d, which is known as the detection-error trade-o�plot, because the speci�c situations combining false positives vs false negatives is con-fronted for a set of critical threshold values. The number of these situations is 8, andthey are signaled in the plot. In fact, apart from the two points already analyzed (1 and8), the rest of the cases is as follows:2. False dysphonics jump up to 1/470, false normophonics do not change.3. False dysphonics do not change, false normophonics drop to 2/470.4. False dysphonics jump to 2/470, false normophonics do not change.5. False dysphonics do not change, false normophonics drop to 1/470.6. False dysphonics jump to 3/470, false normophonics do not change.7. False dysphonics do not change, false normophonics drop to 0.
The optimal case is point 3, where the rates of false dysphonics and normophonicsare equal to 0.638% (equal error rate). The detection accuracy function is at its maximumvalue of 99.57% at this point, for a threshold range between 62.08% and 75.04%, whichimplies a reasonably wide noise margin.
Third experiment description:• Matching each normative speaker’s sample (questioned) against every other nor-
mative sample (suspect: one target sample vs 49 non-target samples). Eliminatingrepetitions, these settings imply 50 target detections vs 1,225 non-target detecti-ons.
• Using as model set (line-ups) the set of 50 normative speakers, to grant condition(9) as much as possible.
Third experiment objective:• Estimate the discrimination accuracy of the sample matching methodology in
target vs non-target detection tasks.Third experiment results:• False target vs false non-target detection cumulants, sensitivity, speci�city and
accuracy functions, and detection-error trade-o� plots given in Figure 15.As before, the detection procedure consists in generating a vector with the log li-
kelihood ratios (LLR) generated for each sample, and their assumed condition of targetor non-target. No normalization of the threshold span has been carried out in this case.The information provided by Figure 15 once the experimental conditions are �xed, canbe summarized as follows:
61

Gómez, P. et al. - Using Dysphonic Voice to Characterize Speaker’s BiometryLanguage and Law / Linguagem e Direito, Vol. 1(2), 2014, p. 42-66
Figura 15. a) False positive vs false negative cumulants. b) Associated Tippet plots.c) Sensitivity, speci�city and accuracy for the third experiment. d) Detection-errortrade-o� curve. (Figure produced by authors.)
a. The rate of false positives (in red) gives the evolution of the non-target cases detectedequivocally as targets, as the detection threshold for the log likelihood ratio is mo-ving from left to right. Given the relatively large number of non-target cases (1,225)the evolution of this curve is a smooth decay (inverted sigmoid), expressing that itsdistribution function will be bell-shaped. On the contrary the low number of targetcases (50) given by the blue curve shows slight jumps as the threshold is moving,incorporating new targets as if they were non-targets (false negatives). Both curvescross at the threshold value of 10.88. This is the point of maximal accuracy, on thesixth interval re�ected in 0, in the margin where the evidence supports strongly theprosecutor’s vs the defender’s hypothesis. The detection methodology is maximallyaccurate just at the beginning of that interval, availing the guarantee of the test. Thevalue of the accuracy function at that point is 99.29%.
b. The graphics given in template a) are given now as Tippett plots. They do not provideany more information to what has been commented up to now, except stressing thefact that the overlap between the two accumulated distributions is very low, grantingthat at the cross-point the residual tail probabilities (p-values) are under 0.02 and0.0057, well below the signi�cance level of 0.05.
c. The sensitivity (number of non-targets detected as targets over the total non-targets),speci�city (number of targets detected as non targets over the total targets) and accu-racy (number of the total targets and non-targets detected as such over the total cases)are plotted as a function of the threshold. The accuracy is very large for the marginof strong support of the prosecutor’s hypothesis vs the defender’s, with a maximumat 99.29% and not being below 96.08% in any case.
62
Gómez, P. et al. - Using Dysphonic Voice to Characterize Speaker’s BiometryLanguage and Law / Linguagem e Direito, Vol. 1(2), 2014, p. 42-66
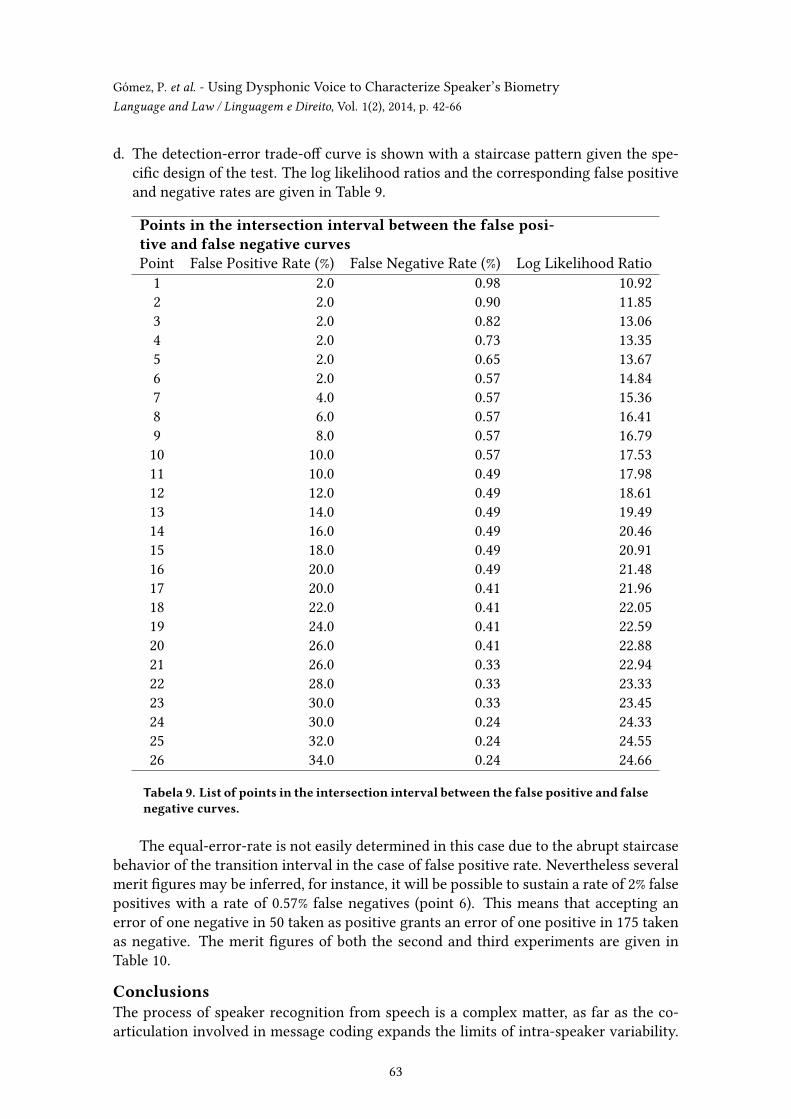
d. The detection-error trade-o� curve is shown with a staircase pattern given the spe-ci�c design of the test. The log likelihood ratios and the corresponding false positiveand negative rates are given in Table 9.
Points in the intersection interval between the false posi-tive and false negative curvesPoint False Positive Rate (%) False Negative Rate (%) Log Likelihood Ratio
1 2.0 0.98 10.922 2.0 0.90 11.853 2.0 0.82 13.064 2.0 0.73 13.355 2.0 0.65 13.676 2.0 0.57 14.847 4.0 0.57 15.368 6.0 0.57 16.419 8.0 0.57 16.7910 10.0 0.57 17.5311 10.0 0.49 17.9812 12.0 0.49 18.6113 14.0 0.49 19.4914 16.0 0.49 20.4615 18.0 0.49 20.9116 20.0 0.49 21.4817 20.0 0.41 21.9618 22.0 0.41 22.0519 24.0 0.41 22.5920 26.0 0.41 22.8821 26.0 0.33 22.9422 28.0 0.33 23.3323 30.0 0.33 23.4524 30.0 0.24 24.3325 32.0 0.24 24.5526 34.0 0.24 24.66
Tabela 9. List of points in the intersection interval between the false positive and falsenegative curves.
The equal-error-rate is not easily determined in this case due to the abrupt staircasebehavior of the transition interval in the case of false positive rate. Nevertheless severalmerit �gures may be inferred, for instance, it will be possible to sustain a rate of 2% falsepositives with a rate of 0.57% false negatives (point 6). This means that accepting anerror of one negative in 50 taken as positive grants an error of one positive in 175 takenas negative. The merit �gures of both the second and third experiments are given inTable 10.
ConclusionsThe process of speaker recognition from speech is a complex matter, as far as the co-articulation involved in message coding expands the limits of intra-speaker variability.
63

Gómez, P. et al. - Using Dysphonic Voice to Characterize Speaker’s BiometryLanguage and Law / Linguagem e Direito, Vol. 1(2), 2014, p. 42-66
Experiment Samples No. Tests Accuracy(%)
LLR EER p-values
First 50N + 50D 90 Samples vsModel x 10times cross-val.= 900
99.57 NA 0.638(3)
0.00638,0.00638
Second 50N + 50D 50 Samples vseach: 51∗50/2= 1275 (50 tar-get + 1225 non-target)
99.29 10.88 NA 0.02,0.0057
Tabela 10. Summary of results for the second and third experiments.
This problem can be alleviated if biometrical markers are de�ned in relation with phona-tion, as this phenomenon is less variable for a given speaker, depending only on phona-tory settings (creaky, modal, pressed, falsetto, etc). Phonation may experience changesfrom aging as well as from hormonal status, tobacco, drugs or alcohol consumption, vo-cal abuse, infections, allergies, other health status conditions, and even circadian cycles(phonation late in the evening is not the same as during the �rst hours after waking up).It must be assumed that no forensic voice analysis system can realistically manage allthis variability, as most of the times the questioned evidence is just a segment of poorquality conversation, and not much more. Regarding the modeling of suspect’s evidence,it would be possible sometimes to obtain speech samples under di�erent conditions andin di�erent sessions, but this is not possible most of the time. Our group has conductedmultisession tests in very speci�c collaborative situations such as twins’ voice studies(San Segundo and Gómez, 2013; San Segundo, 2014), but indeed that is not a realisticforensic scenario. Nevertheless, this factor has been taken into account as far as pa-rameter selection is concerned. Our study is based on 68 phonation parameters, fromwhich some are very variable with phonation modality and condition, while others arealmost invariant to the alterations described. The parameters used in the forensic pho-nation match have been previously selected according to prior knowledge: for instancejitter, shimmer, noise-harmonic ratios, certain cepstral parameters, glottal source spec-tral pro�le, closure and contact defects, and low order tremor are not very sensitive totemporal alterations, and can be safely used in these studies. Focussing on phonationbiometrical markers does not necessarily reduce the recognition capability of the metho-dology, as happens with �ngerprints. It is well known that �ngerprint matching does notuse the whole information available in a �ngerprint image; on the contrary, only spe-ci�c biometrical markers, known as minutias are involved in pattern matching. In thisway the process of �ngerprint matching becomes more e�cient, accurate, robust andless computationally expensive (Jain et al., 1997). The application of this deconstruc-tive methodology to speech implies focussing on phonated speech, rather than in thewhole set of voiced and unvoiced patterns. Furthermore, from phonated speech onlylong vowels close to the axis /a/-/e/ were considered in the present study. These aresome of the conclusions derived from the experimental setup used in the study:
64

Gómez, P. et al. - Using Dysphonic Voice to Characterize Speaker’s BiometryLanguage and Law / Linguagem e Direito, Vol. 1(2), 2014, p. 42-66
• The detection of dysphonic voicing from normophonic seems viable using para-meterizations of phonation based on the reconstruction of the glottal source.
• The sensitivity, speci�city and accuracy in detecting dysphonic phonation arelarge enough to grant using phonated segments of speech as long vowels and�llers in forensic voice matching over su�ciently wide detection spans.
• The parameterizations of /a/ and /e/ groups of vowels are interchangeable to apaired test extent, to be used in cross-matching tests with no signi�cant statisticaldi�erences.
• The accuracy of target vs non-target sample phonation matches grants the ap-plicability of these tests to real forensic cases.
• The margin of optimal log likelihood ratios granting the strength of phonationevidence over 4 in Lucy’s scale (Lucy, 2005) allows its applicability under robustconditions.
• The matching of questioned vs suspect’s evidence in reference to line-ups may besummarized in meaningful 2D plots of simple and easy interpretation, grantingthe reliability and security of the procedure regarding court standards.
• Hybridizing scores from speech and phonation standards as MFCC’s and glot-tal source derived parameters may attain competitive low equal error rates overtelephone-quality speech (Khoury et al., 2013).
The proposed methodology for voice pathology detection and monitoring, as well asfor forensic voice inspection is being used by police services in Spain and other academicand private institutions (Gomez-Vilda et al., 2012).
AcknowledgementsThis work is being funded by grant TEC2012-38630-C04-04 from Plan Nacional deI+D+i, Ministry of Economy and Competitivity of Spain.
ReferencesDejonckere, P. H. (2010). Assessment of voice and respiratory function. In M. Remacle
and H. E. Eckel, Eds., Surgery of Larynx and Trachea, 11–26. Berlin: Springer-Verlag.Gomez-Vilda, P., Olalla, R. M., Fernandez, L. M. M., Biarge, M. V. R., Mulas, C. M., Mar-
quina, A. A., Hierro, J. A. H. and Salinero, R. N. (2012). Distance metric in forensicvoice evidence evaluation using dysphonia-relevant features. In Proceedings of the VIMeeting of Biometric Recognition of Persons, 169–178: Ed. Universidad de Las Palmasde Gran Canaria.
Gómez, P., Rodellar, V., Nieto, V., Martínez, R., Alvarez, A., Scola, B., Ramírez, C., Poletti,D. and Fernández, M. (2013). BioMet®Phon: A system to Monitor Phonation Quality inthe Clinics. In Proceedings of the 5th International Conference on e-Health, Telemedicineand Social Medicine, 253–258, Nice, France.
Gómez-Vilda, P., Fernández-Baillo, R., Rodellar-Biarge, V., Lluis, V. N., Álvarez Marquina,A., Mazaira-Fernández, L. M., Martínez-Olalla, R. and Godino-Llorente, J. I. (2009).Glottal source biometrical signature for voice pathology detection. Speech Communi-cation, 51(9), 759–781.
Gómez-Vilda, P., Fernández-Baíllo, R., Nieto-Altuzarra, A., Díaz-Pérez, F., Fernández-Camacho, F. J., Rodellar-Biarge, V., Álvarez Marquina, A. and Martínez-Olalla, R.(2007). Evaluation of voice pathology based on the estimation of vocal fold biome-chanical parameters. Journal of Voice, 21(4), 450–476.
65
Gómez, P. et al. - Using Dysphonic Voice to Characterize Speaker’s BiometryLanguage and Law / Linguagem e Direito, Vol. 1(2), 2014, p. 42-66
Hakkesteegt, M. M., Brocaar, M. P. and Wieringa, M. H. (2010). The applicability of thedysphonia severity index and the voice handicap index in evaluating e�ects of voicetherapy and phonosurgery. Journal of Voice, 24(2), 199–205.
Hirano, M. (1981). Psycho-acoustic evaluation of voice. New York: Springer-Verlag.Jain, A., Hong, L. and Bolle, R. (1997). On-line �ngerprint veri�cation. IEEE Transactionson Pattern Analysis and Machine Intelligence, 19(4), 302–314.
Khoury, E., Vesnicer, B., Franco-Pedroso, J., Violato, R., Boulkcnafet, Z., Mazaira Fernan-dez, L. M., Diez, M., Kosmala, J., Khemiri, H., Cipr, T., Saeidi, R., Gunther, M., Zganec-Gros, J., Candil, R. Z., Simoes, F., Bengherabi, M., Alvarez Marquina, A., Penagarikano,M., Abad, A., Boulayemen, M., Schwarz, P., Van Leeuwen, D., Gonzalez-Dominguez,J., Neto, M. U., Boutellaa, E., Gomez Vilda, P., Varona, A., Petrovska-Delacretaz, D.,Matejka, P., Gonzalez-Rodriguez, J., Pereira, T., Harizi, F., Rodriguez-Fuentes, L. J.,El Shafey, L., Angeloni, M., Bordel, G., Chollet, G. and Marcel, S. (2013). The 2013speaker recognition evaluation in mobile environments. In Proceedings of the 6th IAPRInternational Conference on Biometrics, Madrid, Spain.
Kim, S. J., Magnani, A. and Boyd, S. (2005). Robust �sher discriminant analysis. InAdvances in Neural Information Processing Systems, 659–666. MIT Press.
Lucy, D. (2005). Introduction to Statistics for Forensic Scientists. Hoboken, NJ: Wiley.Muñoz, C. (2014). Speech signals Feature Extraction Model for a Speaker’s Gender andAge Identi�cation System. Phd thesis, Center for Biomedical Technology, UniversidadPolitécnica de Madrid, Madrid.
Peirce, C. S. (1878). The probability of induction. Popular Science Monthly, 12, 705–718.Roy, N., Barkmeier-Kraemer, J., Eadie, T., Sivasankar, M. P., Mehta, D., Paul, D. and Hil-
man, R. (2013). Evidence-based clinical voice assessment: A systematic review. Ame-rican Journal of Speech-Language Pathology, 22, 212–226.
San Segundo, E. (2014). Forensic speaker comparison of Spanish twins and non-twin si-blings: A phonetic-acoustic analysis of formant trajectories in vocalic sequences, glottalsource parameters and cepstral characteristics. Phd thesis, Universidad InternacionalMenéndez Pelayo.
San Segundo, E. and Gómez, P. (2013). Voice biometrical match of twin and non-twinsiblings. In Proceedings of MAVEBA 2013, 253–256, Florence, Italy: Firenze UniversityPress.
Taroni, F., Aitken, C., Garbolino, P. and Biedermann, A. (2006). Bayesian Networks andProbabilistic Inference in Forensic Science. Hoboken, NJ: Wiley.
U.S. Supreme Court, (1993). Daubert v. Merrell Dow Pharmaceuticals, Inc. 509 US 579,589”.
66
View publication statsView publication stats