Embed Size (px)
Citation preview

USING EMG SPECTRAL ANALYSIS AS A QUANTITATIVE MEASURE OF
MOTOR UNIT RECRUITMENT TO EVALUATE STROKE MOTOR RECOVERY
By
LINDSAY ANN MCMANUS
A THESIS PRESENTED TO THE GRADUATE SCHOOL OF THE UNIVERSITY OF FLORIDA IN PARTIAL FULFILLMENT
OF THE REQUIREMENTS FOR THE DEGREE OF MASTER OF SCIENCE
UNIVERSITY OF FLORIDA
2006

Copyright 2006
by
Lindsay Ann McManus

ACKNOWLEDGMENTS
I would like to thank my advisor and committee chairman, Dr. James Cauraugh, for
all of his guidance and support for the past two years. He helped to create an
environment here at the University of Florida that has utilized my strengths to their
highest potential. From teaching the undergraduate motor learning course to collecting
and analyzing data in the lab, Dr. Cauraugh has given me the chance to learn and
discover what interests me and what paths I will follow in the future. I also would like to
thank my other committee members, Dr. Chris Janelle and Dr. Mark Tillman, for their
suggestions and guidance through my thesis writing experience. In addition, I have to
say thank you to Steve Coombes who, first of all, made this thesis possible with his
LabView programming skills. Otherwise, I would never have been able to explore
something like spectral analysis. Steve has been a great person to work with in the lab,
share ideas with, and learn from. I know he will be a successful researcher one day and I
look forward to hearing about his innovative research in the future. Outside of the Motor
Behavior Lab, James Milford and Lori Gibbs have been very valuable resources for me
as a graduate student. I would like to thank James for all of his caring support from the
day I arrived all the way through my thesis writing and graduation. Lori has also been
extremely helpful in everything from helping me prepare classroom materials to
gathering paperwork for various tasks. Lastly, I would like to take the chance to thank
my family and friends for all of their love and support for the past two years. Some
friends are far away, but have given me the encouragement to pursue my degree. Other
iii

friends I have met here at UF and I will value their friendship for years to come. My
family has always told me to follow my dreams and encouraged me to keep going above
and beyond what is expected. And with their love and support, I think that I have truly
made the most of my time here. I will always be proud to be a Florida Gator!
iv
TABLE OF CONTENTS page
ACKNOWLEDGMENTS ................................................................................................. iii
LIST OF TABLES............................................................................................................ vii
LIST OF FIGURES ......................................................................................................... viii
INTRODUCTION AND REVIEW OF LITERATURE .....................................................1
Normal Motor Unit Recruitment ..................................................................................1 Recruitment Following Neurological Insult .................................................................3 Bilateral Training..........................................................................................................5 Coupled Bilateral Training and EMG-Triggered Stimulation Protocols......................7 Adding a Load to the Unimpaired Limb.......................................................................8 Spectral Analysis ..........................................................................................................8 Purpose .......................................................................................................................12 Hypotheses..................................................................................................................12
METHOD ..........................................................................................................................15
Subjects.......................................................................................................................15 Pretest-Posttest Instruments and Procedures ..............................................................16 Motor Recovery Protocols: Training Procedures .......................................................17 EMG Spectral Analysis ..............................................................................................18 Statistical Design and Analyses..................................................................................18
RESULTS ..........................................................................................................................20
Power Band 1 (1-3 Hz) and Power Band 2 (5-12 Hz)................................................20 Power Band 3 (15-30 Hz) ...........................................................................................20 Power Band 4 (30-55 Hz) ...........................................................................................22 Mean Peak Frequency.................................................................................................24 Force ...........................................................................................................................25
DISCUSSION....................................................................................................................28
APPENDIX. PILOT DATA .............................................................................................38
LIST OF REFERENCES...................................................................................................45
v

BIOGRAPHICAL SKETCH .............................................................................................50
vi

TABLE
Table page 4-1 Averages collapsed across subjects and groups. ......................................................36
vii

LIST OF FIGURES
Figure page 2-1 Subject performing the box and block test with his impaired right hand. .............16
3-1 Group × condition interaction in power band 3 (15-30 Hz). .................................21
3-2 Group × limb interaction in power band 3 (15-30 Hz). .........................................21
3-3 Limb × condition interaction in power band 4 (30-55 Hz)....................................23
3-4 Limb × condition × session interaction in power band 4 (30-55 Hz). ...................23
3-5 Mean peak frequency limb main effect. ................................................................24
3-6 Mean peak frequency group × limb interaction.....................................................25
3-7 Condition main effect. ...........................................................................................26
3-8 Limb main effect....................................................................................................26
3-9 Limb × condition interaction. ................................................................................27
4-1 Power spectrum. Frequency (Hz) on x-axis. Power (µV2) on y-axis. ..................31
4-2 Power spectrum. Frequency (Hz) on x-axis. Power (µV2) on y-axis. ..................31
4-3 Power spectrum. Frequency (Hz) on x-axis. Power (µV2) on y-axis. ..................32
4-4 Power spectrum. Frequency (Hz) on x-axis. Power (µV2) on y-axis. ..................32
4-5 Power spectrum. Frequency (Hz) on x-axis. Power (µV2) on y-axis....................33
4-6 Power spectrum. Frequency (Hz) on x-axis. Power (µV2) on y-axis. ..................33
A-1 Average power (subject 1102) in pre and posttests in unimanual condition. ........39
A-2 Average power (subject 1102) in pre and posttests in bimanual condition. ..........39
A-3 Average power (subject 2102) in pre and posttests in unimanual condition. ........40
A-4 Average power (subject 2102) in pre and posttests in bimanual condition. ..........40
viii

A-5 Mean peak frequency (subject 1102) in pre and posttests unimanual condition. ..41
A-6 Mean peak frequency (subject 1102) pre and posttests bimanual condition. ........42
A-7 Mean peak frequency (subject 2102) pre and posttests unimanual condition. ......42
A-8 Mean peak frequency (subject 2102) pre and posttests bimanual condition. ........43
A-9 Mean force (subject 1102) in posttests unimanual vs. bimanual conditions. ........44
A-10 Mean force (subject 2102) posttests unimanual vs. bimanual conditions. ............44
ix

Abstract of Thesis Presented to the Graduate School
of the University of Florida in Partial Fulfillment of the Requirements for the Degree of Master of Science
USING EMG SPECTRAL ANALYSIS AS A QUANTITATIVE MEASURE OF MOTOR UNIT RECRUITMENT TO EVALUATE STROKE MOTOR RECOVERY
By
Lindsay Ann McManus
August 2006
Chair: James Cauraugh Major Department: Applied Physiology and Kinesiology
After stroke, motor function is often reestablished abnormally in the paretic limb,
causing difficulty in daily tasks. The two primary purposes of this study were to apply
spectral properties, namely mean peak frequency shifts and changes in average power
over four frequency bins from surface EMG recordings, to describe motor unit
recruitment in the muscles of the wrist/finger extensors, and to correlate functional
improvements, namely increased force production, to improved motor unit recruitment
patterns.
Using data collected from 2002 through 2006 from two separate training protocols,
twenty five chronic patients were selected for analysis. The first protocol consisted of a
pretest, a 2 week (4 sessions) coupled bilateral training and active EMG-neuromuscular
stimulation protocol, and a posttest. The second group (Weighted) underwent a pretest
and posttest identical to previous group (Coupled), but participated in a coupled bilateral
x

training and active EMG-neuromuscular stimulation with an added weight on the affected
hand.
Separate analyses were conducted on the three dependent measures (average
power, mean peak frequency, and mean force) using a four-way mixed ANOVA.
Significant results were revealed in the low gamma power band, in addition to mean peak
frequency and mean force (p < 0.05). In the low gamma band, the unaffected limb in the
unimanual condition during the posttest exhibited significantly higher power than every
other combination of condition, limb, and session. Moreover, the unaffected limb
showed a significantly higher mean peak frequency than the affected limb. In addition,
the unaffected limb in the coupled group showed higher mean peak frequency than the
affected limb in the same group. The affected limb in the coupled group also displayed a
lower mean peak frequency than the unaffected limb in the weighted group. Analysis of
the force data revealed higher force when moving unimanually compared to moving
bimanually. As expected, the affected limb produced a lower amount of force compared
to the unaffected limb in both unimanual and bimanual conditions.
Findings support previous research stating that the unaffected limb exhibits higher
power than the affected limb, indicating that the unimpaired limb is able to harness larger
motor neurons in its recruitment strategy, thus leading to larger force production. Each
subject exhibited improvement in at least one category, number of blocks moved,
increased mean peak frequency, a change in power in the 30-55 Hz bands, or amount of
force produced. However, no single uniform characteristic of motor improvement was
shown by each stroke subject. The current findings indicate that the training is affecting
the stroke patients positively and merits further research
xi

INTRODUCTION AND REVIEW OF LITERATURE
Normal Motor Unit Recruitment
The principle of motor unit recruitment states that motor units, consisting of the
motor neuron and the muscle fibers it innervates, are progressively activated with
increasing strength of voluntary muscle contraction (Milner-Brown et al., 1973). The
central nervous system increases the strength of muscle contraction by increasing the
number of active motor units or increasing the firing rate of individual motor units. Both
of these mechanisms occur concurrently, though the recruitment of more motor units
takes precedence over an increase in firing rate until nearly all motor units are recruited.
Once this level is reached, motor units are driven to fire in their secondary range to rates
greater than 50 Hz (Petajan, 1991).
Motor units are recruited according to the order of their size. The first motor units
to fire are small in size, weak in force generation, and resistant to fatigue. Progressively
larger motor units with greater force production capabilities are recruited with increasing
strength of muscle contraction (Henneman et al., 1965). As large motor units are
activated, it is important to note that the smaller units are still firing, although the large
motor units assume primary responsibility for maximum force production. This
sequential recruitment order is known as the Henneman size principle and it results in a
smooth increase in muscle strength. Through their feline research paradigm, Henneman
and colleagues discovered that axon diameter, conduction velocity, and cell size all
increase with increased muscle contraction (Henneman et al., 1965). The three main
1
2
types of motor units include Type I fibers, described as slow twitch, small, fatigue-
resistant units which generate the least force and have the slowest contraction time, Type
IIa units that are fast-twitch, larger, fatigue-resistant units able to generate greater forces
and faster contraction times, and Type IIx units, known as the largest, fast-twitch, easily-
fatigable units capable of the greatest force production and fastest contraction time.
Motor unit recruitment sequences begin with Type I motor units and then sequentially
advance to Type IIa and finally Type IIx units for high force production. The late
recruited Type II fibers have larger diameters and thus generate higher motor unit action
potentials (MUAPs) than the smaller Type I fibers. This size principle is used in
electromyography (EMG) studies designed to analyze motor unit recruitment patterns by
using the amplitude of the MUAP to define the size of a specific motor unit (Ertas et al.,
1995).
A confluence of MUAPs traveling along the sarcolemmas of the muscle fibers
results in a muscle contraction. Myoelectric signals are formed on the basis of the
interference pattern among these MUAPs and are detected using EMG. The conductance
and resistance of the sarcolemma differ between fast- and slow-twitch fibers (Luff &
Atwood, 1972) and therefore, researchers postulate that different types of muscle fibers
generate different MUAPs. Myoelectric signals provide information about the form of
the MUAPs and are able to offer insight into the electrophysiology of the active muscle.
Signals measured using intramuscular EMG in animals have shown that faster motor
units generate higher frequencies in their power spectra (Wakeling & Rozitis, 2004).
However, evidence from surface EMG in humans has remained elusive on this topic.
Recent advances in EMG signal decomposition including wavelet techniques, Fourier

3
Transform methods, and simulations that accurately mimic human muscle behavior have
provided additional information not previously known, such as motor unit recruitment,
muscle fatigue factors, and biomechanical adaptations (Karlsson et al., 2000). For
example, when faster motor units are active, increases in mean and/or median
myoelectric frequency are observed in the EMG signal, thus suggesting that there is an
inherent property of the muscle fiber that can be distinguished within EMG signals
(Farina et al., 2002).
Recruitment Following Neurological Insult
After a motor neuron injury such as a stroke, the relationship between motoneuron
size and the number and size of the muscle fibers it innervates is usually lost or damaged.
Reorganization of this relationship at motor endplates occurs over time through axon
branching and neuromuscular activity (Nudo, 1999). This reorganization, known as
neuroplasticity, occurs as the nervous system attempts to repair damaged motor neurons.
Therefore, there must be persistent functional changes evident in the brain, and
consequently in motor unit activity, to represent this new organization. Using spectral
analysis to analyze MUAPs post-stroke and after bimanual coordination training will
offer insight into abnormal motor unit recruitment strategies post-stroke and aid in the
explanation of new strategies employed after a specific training protocol.
After a cerebrovascular accident (CVA), such as stroke, motor unit recruitment is
altered because of interrupted descending pathways as well as structural changes in the
muscle (Mazevet et al., 2003). Brain damage secondary to stroke results in corticospinal
and supraspinal motor pathway disruption and possibly leads to synaptic degeneration at
the segmental level (McComas et al., 1973). This loss of neural signaling at the
segmental level causes motor neuron loss and altered force control mechanisms. Muscle

4
impairment following stroke can result from several sources including loss of motor units
because of Wallerian degeneration (McComas et al., 1971). As a result of the Wallerian
degeneration, all of the muscles fibers previously innervated by the axon are denervated
and therefore, fewer motor units are available for muscle activation. Altered properties
of the motor unit affect recruitment through altered recruitment order, discharge rate,
and/or discharge pattern (Beaumont & Gardiner, 2002). This abnormal motor unit
recruitment in turn, impacts the level of impairment post stroke. For instance, in
neurologically healthy individuals, once the first recruited muscle unit reaches a firing
frequency of 10 Hz, a second unit begins firing to increase muscle force. However, after
stroke, this second unit is often missing or damaged and an increase in force can only be
achieved by increasing the firing rate of the first motor unit(s). This abnormal
recruitment and discharge pattern contributes to the inefficient and undesired movement
patterns often observed in stroke patients. Adding to the underlying cause of such
inefficient motor patterns is altered motor neuron pool excitability. Altered excitability
affects the probability of motor unit activation, and in turn allows expression of unwanted
or atypical coordination patterns (Morales et al., 1987).
Low tonic rates are indicative of slow motor units while fast motor units are
associated with higher, more phasic tonic rates (Denny-Brown, 1929; Granit et al., 1956).
The close matching of motoneurons and muscle properties with respect to firing rates was
first described by Kernell and colleagues in muscles of rats and cats (Granit et al., 1963)
and later in single motor units of rats (Gardiner and Kernell, 1990) and supports the idea
that motor unit recruitment and rate coding both contribute to voluntary force production
(Kernell, 1992). That is, the number of motor units that are recruited and the rate of

5
firing of the motoneurons both control force generation of the muscle during voluntary
movement. Olson and colleagues successfully reported that a progressive recruitment of
motor units occurs when increasing force is required of voluntary movements (Olson et
al., 1968). However, impaired voluntary muscle strength results from neurological insult
because of a loss of normal motor unit recruitment occurs because of Wallerian
degeneration, altered recruitment and discharge patterns, and altered motor neuron pool
excitability (Landau & Sahrmann, 2002).
Moreover, drawing consistent conclusions from research involving impaired
muscle control in hemiplegic subjects is difficult because of the inconsistencies across
studies. For example, a limited number of subjects, a wide variation of lesion duration,
and multiple causes of disability are prevalent in stroke motor recovery research.
Therefore, the question as to whether the lack of muscular control because of disruption
at the supraspinal level, intrinsic changes in the motor neuron pool, or changes in the
properties of the muscle itself remains unanswered. However, the literature does agree
on the principles that motor unit activation in hemiplegia subjects is non-uniform and
motor unit firing rates tend to decrease overall relative to the ipsilesional limb (Rose &
McGill, 1998). A consequence of this diminished activation and firing of motor units is a
decreased ability to produce voluntary contractions.
Bilateral Training
Promising results have been reported in functional motor improvement post-stroke
with bilateral training protocols. Mudie and Matyas (2000) demonstrated enhanced
upper limb performance after a three week protocol of bilateral isokinematic therapy
(BIT). Bilateral practice with both upper limbs successfully elicited improvements in
unilateral performance of the affected limb alone. Motor improvements after bilateral

6
training were greater than those in response to similar unilateral practice or practice
sessions that involved the nonparetic limb assisting the paretic limb in various tasks.
Significant increases in strength, range of motion, and functional motor ability were
reported by Whitall and colleagues (2000) following a six week bilateral training
protocol. In addition, Cauraugh and Kim (2002) demonstrated enhanced motor control
after EMG-triggered neuromuscular stimulation coupled with bilateral training. These
three studies provide support for a bilateral training technique because of the potential
effectiveness of the various protocols in improving motor ability of individuals post
stroke.
The neural mechanisms and pathways targeted by bilateral training protocols
remain uncertain; however, several possibilities have been proposed. One pathway
involves an interaction in the affected hemisphere between surviving neurons of
ipsilateral pathways and surviving neurons of the crossed corticospinal pathways, the
involvement of indirect pathways from the affected hemisphere, and a facilitation of
coupling or crosstalk from the unaffected hemisphere to ipsilateral pathways are all
possible neural mechanisms responsible for motor improvement exhibited after bilateral
training (Mudie & Matyas, 2000). The idea of the coupling principle between arms
harnesses existing coupling abilities and encourages recovery of function through
bilateral movements. For example, forcing the use of both upper extremeties, as opposed
to the paretic arm only, has the potential to yield additional benefits by accessing intact
pathways of the unaffected hemisphere and possible coupling mechanisms. Rose and
Winstein (2004) reported clear temporal coupling in bimanual conditions and found a
facilitation effect in 5 of 11 patients where the paretic limb exhibited a shorter movement

7
time in the bimanual condition. Further, Cunningham and colleagues (2002) reported
coupling in bimanual training citing smoother movement of the paretic limb when it was
coupled with the nonparetic limb in elbow extension movements. Together these studies
support neural coupling as a possible mechanism underlying bilateral training protocols.
Coupled Bilateral Training and EMG-Triggered Stimulation Protocols
In separate studies of EMG-triggered neuromuscular stimulation and bilateral
coordination training, motor improvements in hemiparetic subjects were observed
(Leonard, 1998; Popovic and Sinkjaer, 2001). These findings are based on accepted
motor control theories, including sensorimotor integration and dynamical systems, which
complement one another in that the body is viewed as a dynamic system executing
movements through an interaction of sensory input and motor actions based on a set of
imposed constraints. Both bilateral training and EMG-triggered neuromuscular
stimulation essentially activate the same central and peripheral neural mechanisms
associated with the pyramidal tract and provide a basis for combining the two protocols.
The combination of the two interventions has the potential to accelerate the progress of
motor recovery after stroke (Cauraugh & Kim, 2002).
Specifically, Cauraugh and Kim reported an increase in performance of a functional
task, decreased reaction times, and increased capability in the sustained force task for the
coupled bilateral training and EMG-triggered stimulation group compared to the
unilateral and control groups. The coupled intervention group exhibited motor
improvement in all three testing categories, exhibiting decreased hemiparesis because of
each subject’s expanded motor control repertoire (Cauraugh & Kim, 2002; Cauraugh,
2004).

8
Adding a Load to the Unimpaired Limb
Interlimb coupling is a potentially useful phenomenon in the context of stroke and
hemiplegia. It is beneficial to increase the symmetry between the impaired and
unimpaired limb through bilateral training in an effort to allow the unimpaired cortex to
facilitate the damaged cortex. Interlimb coupling increases with the frequency of the
movement, in addition to the torque requirements of the task (Walter and Swinnen,
1990). Therefore, through inertial loading of the unimpaired limb, torque is manipulated
and combined with the coupled bilateral training EMG-neuromuscular stimulation
protocol for one group in this study.
Spectral Analysis
Raw EMG signals offer valuable information, but in a relatively useless form.
Conclusions drawn from raw EMG signals cannot be quantitatively compared between
subjects, and therefore most analyses are purely qualitative. Pioneering EMG work
began in the 1950’s and has undergone much refinement, especially in the past 20 years
due to the advanced processing of computers and other instrumentation. The formal
quantitative analysis of MUAP signals is not as cumbersome or time-consuming as it was
in the past thanks to recent advances. Among these advances is the ability to use the Fast
Fourier Transform (FFT) filter to break the EMG signal into its frequency components
which are then graphed as a function of their probability of occurrence and used to
determine muscle activation and fatigue.
EMG signal analysis in the frequency domain involves parameters describing
specific aspects of the frequency spectrum of the signal. The two most common
parameters of the power density spectrum used to determine fatigue are mean and median
frequency because they are easily applicable and provide useful information about the

9
EMG signal. If the EMG spectrum has a normal distribution, these two frequencies will
be equivalent, but deviation from normality will result in differing values. Spectral shifts
in surface EMG recordings are attributed to the type of muscle fibers activated and are
therefore used to characterize motor unit recruitment. Investigation into these shifts has
been limited to changes in the mean and median frequency of the power spectrum
calculated through FFT (Basmajian & DeLuca, 1985).
The amplitude of the surface EMG is related to the recruitment and the discharge
rates of the active motor units. Because of this relationship, EMG amplitude is used as an
index of the level of activation provided by the spinal cord. Using FFT, the mean and
median frequencies of the EMG signal are identified and analyzed. Shifts in the mean or
median frequencies should reflect the recruitment of progressively larger and faster motor
units based on Henneman’s size principle. Stated differently, variation in muscle fiber
conduction velocity has been proposed as an index of motor unit recruitment according to
the size principle, and therefore should accurately illustrate motor unit recruitment
(Farina et al., 2004).
Data obtained from surface EMG techniques may not need to correlate directly
with traditional needle EMG data to be of value in the study of nerve and muscle
disorders. For instance, the decline in median frequency of the power spectrum with
fatigue or increasing force is a measure that has no single correlate in needle EMG
analysis. The combination of surface EMG and computerized signal processing has
allowed for nerve and muscle studies that had previously only been analyzed using
needle EMG technology. Toulouse and colleagues (1992) studied interference patterns in
persons with Guillain-Barré syndrome, a disorder characterized by deterioration in the

10
peripheral nervous system, and normal subjects. They found that surface EMG analysis
was useful in quantifying observed changes over the recovery period. In addition, Priez
et al. (2002) used surface EMG spectral analysis to discriminate between normal subjects
and those with muscular dystrophy. Further, the technique was successfully applied to
quantifying the severity of the disease. The information gathered by needle EMG is
invaluable and superior to surface EMG because of the specificity and accuracy of the
signals. However, researchers are encouraged to investigate the value of surface EMG
analysis and its ability to provide insight into the study of motor unit recruitment and
activity (Hogrel, 2005).
The lowest frequency at which motor units are modulated is 2 Hz. This “common
drive” is of central origin and has been found in muscles without muscle spindles
(DeLuca, 1985). However, it has only been demonstrated during isometric contractions,
where the force slowly increases or is constant (Farmer et al., 1993a). Low frequency
common drive persists after stroke, and this further supports the hypothesis that the
modulation is of central origin (Farmer et al., 1993b). The next phase of modulation in
motor unit firing occurs at a frequency of 5-12 Hz. To date, there is no convincing
evidence that this activity is directly controlled by the motor cortex, though peaks in this
frequency range have been reported in coherence spectra of the
magnetoencephalographic signal (MEG) from the motor cortex and EMG activity
(Salenius et al., 1997). The next motor unit activity frequencies include beta (15-30 Hz)
and low gamma (30-60 Hz) bands which are regulated by the motor cortex (Brown,
2000). Firing frequencies will vary based on the motor units, muscles, and persons. This
rate modulation depends on the intensity of descending motor input which is reinforced

11
by additional local and afferent inputs. Therefore, after stroke when conduction in the
central nervous system motor pathways is impaired, motor unit firing patterns are altered
(Gemperline et al. 1995).
Employing spectral analysis of muscle force as an estimator of motor unit activity
has shown that the activity spectra tends to shift to higher frequencies with increasing
force in normal subjects. Moritani and Muro (1986) reported increases in surface EMG
amplitude and mean power frequency with increasing force. They attributed these
changes to progressive increases in the motor unit firing frequency of initially recruited
motor units as well as newly recruited motor units. Thus, Moritani and Muro concluded
that surface EMG spectral analysis can provide a sensitive measure of motor unit activity
during force output. In addition to the normal motor unit activity recorded by surface
EMG, Homberg et al. (1986) selected patients with different motor dysfunctions to
illustrate how motor unit activity was reflected in the power spectra. They reported
decreased and increased firing rates, as well as abnormal synchronization across the
various motor dysfunctions.
Surface EMG has been shown to be a valuable tool in evaluating motor unit
activity. Although intracellular EMG technology is able to provide more detail and
insight into single motor unit recruitment, surface EMG data offers a significant means to
analyze muscle performance and fatigue. With the mathematical advances of spectral
analysis, it is now possible to assess EMG signals in their frequency domains and
investigate the effects of observed mean and median power shifts. Combining spectral
analysis and surface EMG technology is an interesting approach to analyzing motor unit
recruitment and, in turn, quantifying motor recovery after a nerve injury such as stroke.

12
Purpose
There were two primary purposes for this study: (1) to apply spectral properties,
namely mean peak frequency shifts and changes in average power over four frequency
bins from surface EMG recordings to describe motor unit recruitment in the muscles of
the wrist/finger extensors, and (2) to correlate functional improvements, namely
increased force production which has been previously reported (Cauraugh & Kim, 2002)
in stroke patients after bilateral training, to improved motor unit recruitment patterns.
Differences in the motor unit recruitment patterns of stroke subjects before and after
participation in a coupled EMG-neuromuscular stimulation and bilateral coordination
training protocol were analyzed. Recruitment patterns exhibited during a sustained
contraction task were quantified by the mean peak frequency and average power of EMG
recordings. Pre and post data were considered, in addition to unimanual (paretic limb
moving alone) versus bimanual (paretic and nonparetic limb moving together) testing
conditions.
Hypotheses
After participating in a motor recovery training protocol, force production of the
paretic limb is expected to increase. Several mechanisms may be responsible for this
increased force production. More specifically, increased force production occurs because
of either faster motor neuron firing rates, as measured by mean peak frequency, or
recruitment of larger, stronger motor neurons, quantified by average power. Overall, an
increase in mean peak frequency is expected in the posttest, which would indicate that
subjects are able to fire motor units at a faster rate than was possible before the coupled
protocol training. The increase in mean peak frequency is predicted to be greater in the
weighted group compared to the coupled group because of the increased torque demands.

13
In the range of 1-3 Hz, stroke patients should exhibit similar average power pre- and
post-training because this modulation has been reported to be preserved after stroke. If
frequencies in this lower band are preserved after infarct, then it is likely that they are not
controlled by the motor cortex and therefore possibly controlled at a sub-cortical level.
There is no convincing evidence for motor cortex control of the next frequency band, 5-
12 Hz, though peaks driven by the motor cortex have been reported. Hence, average
power of the paretic and nonparetic limbs should mirror each other closely and there will
be no significant differences between pre and posttests. In the next two bands, beta (15-
30 Hz) and low gamma (30-60 Hz), the paretic limb will exhibit a significantly lower
average power compared to the nonparetic limb. This modulation is controlled primarily
by the motor cortex which has been damaged by the stroke and therefore, unable to elicit
normal control over voluntary movements. The beta and low gamma bands are important
in higher aspects of motor control. After motor unit injury such as stroke, there is an
inability to shift to these higher frequencies and persons remain “locked” in a low
frequency mode (Myers et al., 2004). Bilateral training protocols aim to facilitate
crosstalk between the paretic and nonparetic limbs in an effort to increase the functional
ability of the paretic limb. Therefore, after two weeks (4 days) of bilateral coordination
training, motor unit recruitment in the paretic limb will improve in the beta and low
gamma bands. More specifically, it is hypothesized that the average power in the beta
and low gamma bands of the paretic limb will increase post-training in both the unilateral
and bilateral testing conditions with a larger increase in the bimanual condition compared
to the unimanual condition. A larger increase in average power in the beta and low
gamma bands for the bimanual condition will be the result of a facilitation effect from the

14
nonparetic hemisphere. A larger increase in power is also expected to be shown in the
beta and low gamma bands by the weighted group. The heightened torque demands of
the weighted group will harness greater interlimb coupling and result in higher average
power in the beta and low gamma bands. Post-training, the paretic limb will be able to
recruit larger motor units and fire at an increased frequency which has the potential to
lead to greater force production.
METHOD
Subjects
Chronic stroke subjects (N=15; 10 Left CVA, 5 Right CVA) were selected from
two coupled EMG-neuromuscular stimulation and bilateral training protocols from 2002-
2006. The number of participants was increased from 15 to 25 (N=25; 18 Left CVA, 7
Right CVA) because of an abundance of data, which also increases the power of the
results. Volunteer participants had a stroke at least 1 year ago and displayed mild to
moderate upper extremity chronic hemiparesis. Although participants were selected from
two different studies, each subject participated in the same pre and posttests and
participated in a coupled bilateral training and active neuromuscular stimulation protocol.
All subjects met six admission criteria: (1) diagnosis of at least 1 CVA and no more
than 2 CVAs on the same side of the brain; (2) an upper limit cutoff point of 80% motor
recovery, as assessed by rectified EMG activation patterns and sustained force
contractions during direct comparison of the impaired and unimpaired limbs; (3) a lower
limit cutoff point of 10° of voluntary wrist or finger extension against gravity from a 90°
flexed position; (4) absence of other neurological deficits, including a pacemaker; (5) no
use of drugs for spasticity; and (6) no enrollment in another motor recovery rehabilitation
protocol. Before testing began, subjects read and signed an informed consent form
approved by the Institutional Review Board.
15

16
Pretest-Posttest Instruments and Procedures
Motor functions of the upper extremity were evaluated with three categories of
measurement. The first category was a functional manual dexterity test termed the Box
and Block timed manipulation test. For 1 minute, subjects attempted to reach and grasp a
2.54-cm cube, transport it over a short barrier, release the block, and return to the original
side for another block. Figure 1-1 shows a subject performing the task (Cauraugh & Kim,
2002).
Figure 2-1. Subject performing the Box and Block test with his impaired right hand.
The other two categories of measurements were laboratory-based chronometric and
force generation tasks: (1) simple reaction time for speed of information processing and
rapid muscle onset and (2) sustained muscle contractions and force modulation (stability
control). Simple reaction time tests and sustained muscle contractions were performed by
the paretic limb alone, the nonparetic limb alone, and both limbs together in a
randomized order for each subject. The hands and arms were inserted into separate
devices so that isometric wrist/finger extension movements were executed against 11.4-kg
load cells. For both arms, force and EMG signals were recorded online. EMG activity of

17
the wrist/finger extensor muscles was recorded with surface electrodes (silver–silver
chloride electrodes with an epoxy-mounted preamplifier).
Only the surface EMG data collected during the sustained contraction task were
analyzed using spectral analysis. This was in an effort to target the motor unit
recruitment strategies post-stroke, which are more clearly represented during a sustained
contraction task.
Motor Recovery Protocols: Training Procedures
A treatment session started with stretching, and surface electrodes were attached to
the extensor communis digitorum and extensor carpi ulnaris muscles of the impaired
limb. The electrodes were connected to an Automove (AM 800) EMG Facilitation
Stimulator microprocessor, and when a target threshold level of EMG activity was
voluntarily achieved, the unit immediately provided a surface neuromuscular electric
stimulation (i.e., 1-second ramp up, 5 seconds of biphasic stimulation at 50 Hz, pulse
width of 200 µs, 1-second ramp down, and mA range of 16 to 29) that assisted the
muscles to execute a full range of motion. The initial threshold was set at 50 µV, and as
participants successfully achieved the target threshold level, the microprocessor unit
automatically increased the target level slightly higher. If the threshold level was not met,
then the unit decreased the threshold level closer to the amount of voluntary activity that
the individual could produce. Trials were separated by 25 seconds of rest.
During each day of training, subjects completed three sets of 30 successful EMG-
triggered neuromuscular stimulation trials (approximately 1 hour and 30 minutes)
according to the motor recovery protocol group assignments (i.e., bilateral or unilateral
movements). The 6 hours of training (4 days) were completed during 2 weeks. This
procedure was followed by one group (Coupled, N=16), while a second group (Weighted,

18
N=9) underwent the same routine with an additional weight on the unaffected limb. The
weight was approximately 100% of the unaffected hand’s mass. To accomplish this,
subjects wore a nylon glove with pockets sewn to the top and bottom where small metal
weights were placed.
EMG Spectral Analysis
Maximum sustained contractions were used to determine motor unit recruitment
patterns. EMG signals were recorded at a sampling rate of 1000 Hz from the wrist
extensor muscles, including the extensor carpi radialis longus, the extensor carpi ulnaris,
and the extensor carpi radialis brevis. Signals were then lowpass filtered with a 55 Hz
cutoff to avoid electrical outlet noise at 60 Hz. After cutting the first and last second off
of each trial to avoid any inconsistencies during the sustained contraction test, the power
spectrum of the EMG signal during 6 seconds of the sustained contraction phase was
calculated. The proportion of power in each of four frequency bins 1 to 3 Hz, 5 to 12 Hz,
15 to 30 Hz, and 30 to 55 Hz was calculated. These frequency bins were used because of
their established relation with population changes in motor unit activity (Myers et al.,
2004), although only signal frequencies below 55 Hz were analyzed to avoid interference
due to electrical outlet noise at 60 Hz.
A window of 1,024 data points with a 50% overlap was used in isometric actions to
calculate mean power frequency (MPF) and mean force (MF). Using the same FFT,
average power for each of the four frequency bands was calculated.
Statistical Design and Analyses
Separate analyses were conducted on the three dependent measures. The average
power for each frequency band was analyzed in a four-way mixed design ANOVA. The
between-subjects factors were training group (2: coupled, weighted) and limb (2: paretic,

19
nonparetic). The within-subjects factors were session (2: pretest, posttest) and impaired
limb testing condition (2: bimanual, unimanual). The same mixed-design was used to
analyze both mean power frequency and mean force.

RESULTS
The findings below include all of the experimental treatment data for 25 subjects.
All dependent variables were analyzed in a Group × Condition × Limb × Session (2 × 2 ×
2 × 2) mixed ANVOA with repeated measures on the last two factors. Subjects were
divided into two training groups, weighted and coupled, and performed wrist extension
movements in bimanual and unimanual conditions with both affected and unaffected
limbs. This process was followed in the pretest as well as the posttest. All statistical
tests were conducted with α set at 0.05. When appropriate, mean comparisons were
computed with Tukey’s HSD follow-up procedure.
Power Band 1 (1-3 Hz) and Power Band 2 (5-12 Hz)
No significant differences between groups or sessions in either power band were
exhibited. There were also no significant differences found between the affected and
unaffected limb in either the unimanual or bimanual condition in these lower two power
bands.
Power Band 3 (15-30 Hz)
No significant main effects were identified for Condition, Limb, or Session. The
analysis indicated a trend for a Group × Condition interaction (F (1, 23) = 3.804, p <
0.07) exhibited in Figure 3-1. Subjects in the coupled protocol group exhibited higher
power in the unimanual condition compared to subjects in the weighted group in both the
unimanual and bimanual conditions. In addition, the analyses also revealed a trend for a
Group × Limb interaction (F (1, 23) = 3.721, p < 0.07) as seen in Figure 3-2.
20

21
Power Band 3Group × Condition Interaction
0
0.0002
0.0004
0.0006
0.0008
0.001
0.0012
0.0014
0.0016
0.0018
0.002
Coupled Weighted
Bimaual Unimanual
Ave
rage
Pow
er µ
V2
Figure 3-1. Group × condition interaction in power band 3 (15-30 Hz).
Power Band 3Group× Limb Interaction
0
0.0005
0.001
0.0015
0.002
0.0025
Coupled Weighted
Affected Unaffected
Ave
rage
Pow
er µ
V2
Figure 3-2. Group × limb interaction in power band 3 (15-30 Hz).

22
The affected limb in the coupled group exhibited a higher power that was
statistically different from the unaffected limb in the coupled group as well as both the
unaffected and affected limbs in the weighted group. The power of the affected limb in
the weighted group was significantly lower than the affected limb in the coupled group in
addition to the unaffected limbs in both groups.
Power Band 4 (30-55 Hz)
Analyses indicated a trend for a Limb × Condition interaction (F (1, 23) = 3.616, p
< 0.07) displayed in Figure 3-3. The unaffected limb in the bimanual condition showed a
higher power than the affected limb in both unimanual and bimanual conditions. Further,
the mixed ANOVA revealed a significant three-way interaction among Limb × Condition
× Session (F (1, 23) = 4.417, p < 0.05) shown in Figure 3-4. The unaffected limb in the
unimanual condition during the posttest exhibited significantly higher power than every
other combination of condition, limb, and session; that is, the unaffected limb in the
bimanual condition in the pre and posttest and the affected limb in either the unimanual
or bimanual condition in the pre and posttest.

23
Power Band 4Limb × Condition Interaction
0
0.001
0.002
0.003
0.004
0.005
0.006
0.007
Bimanual Unimanual
Affected Unaffected
Ave
rage
Pow
er µ
V2
Figure 3-3. Limb × condition interaction in power band 4 (30-55 Hz).
Power Band 4Limb × Condition × Session Interaction
0
0.001
0.002
0.003
0.004
0.005
0.006
0.007
0.008
Pretest Posttest
Bimanual AffectedBimanual Unaffected
Unimanual AffectedUnimanual Unaffected
Ave
rage
Pow
er µ
V2
Figure 3-4. Limb × condition × session interaction in power band 4 (30-55 Hz).

24
Mean Peak Frequency
Analyses from the mixed ANOVA showed a significant main effect for Limb (F (1,
23) = 39.987, p < 0.001) shown in Figure 3-5. The unaffected limb showed a
significantly higher mean peak frequency than the affected limb. Further, a significant
Group × Limb interaction (F (1, 23) = 5.165, p < 0.04) was found (see Figure 3-6). For
the coupled group, the unaffected limb performed significantly higher in MPF than the
affected limb in the same group. Moreover, the affected limb in the coupled group
displayed a significantly lower MPF than the unaffected limb in the weighted group.
Mean Peak FrequencyLimb Main Effect
36.5
37
37.5
38
38.5
39
39.5
40
40.5
41
Affected Unaffected
Hertz
Figure 3-5. Mean peak frequency limb main effect.

25
Mean Peak FrequencyGroup × Limb Interaction
35
36
37
38
39
40
41
Coupled Weighted
Her
tz\
AffectedUnaffected
Figure 3-6. Mean peak frequency group × limb interaction.
Force
Analyses of the force data revealed a significant main effect for Condition (F (1,
23) = 8.749 p < 0.01). Subjects were capable of producing more force unimanually than
bimanually. Further, the mixed ANOVA exhibited a significant main effect for Limb (F
(1, 23) = 66.268, p < 0.0001). Comparing the two means indicated that the unaffected
limb produced more force than the affected limb. Lastly, a significant Limb × Condition
interaction (F (1, 23) = 8.708, p < 0.01) was found. Follow-up test revealed that the
affected limb in the bimanual condition produced a significantly lower amount of force
when compared to the unaffected limb in both unimanual and bimanual conditions. The
unaffected limb produced significantly less force bimanually than unimanually.
Significant main effects and interaction are displayed in Figures 3-7, 3-8, and 3-9
respectively.

26
ForceCondition Main Effect
6
6.2
6.4
6.6
6.8
7
7.2
7.4
Bimanual Unimanual
Kilo
gram
s
Figure 3-7. Condition main effect.
ForceLimb Main Effect
0
1
2
3
4
5
6
7
8
9
10
Affected Unaffected
Kilo
gram
s
Figure 3-8. Limb main effect.

27
ForceLimb × Condition Interaction
0
2
4
6
8
10
12
Bimanual Unimanual
Kilo
gram
s
AffectedUnaffected
Figure 3-9. Limb × condition interaction.

DISCUSSION
Wrist and finger extension control is one of the most difficult movements to regain
after stroke. Given that this control is the basis for many simple, everyday movements
such as picking up a cup or turning a doorknob, it is extremely important to understand
its rehabilitation and motor recovery. If researchers can identify the physiological basis
for regaining motor function in the wrist and fingers, then potentially, stroke therapy
could target these specific aspects of motor improvement, making therapy more effective
and efficient.
In accordance with the original hypotheses and previous research findings, there
were no significant differences between the unaffected and affected limbs in power bands
1 and 2 (1-3 Hz and 5-12 Hz), nor was a training effect found. These results support the
idea that the motor cortex does not control movements at low frequencies below 12 Hz
and that the firing frequencies in the 1-3 Hz and 5-12 Hz bands remain unchanged post
stroke (Myers et al., 2004).
However, increased power was expected after training in the 15-30 Hz and 30-55
Hz power bands as a result of motor cortex rehabilitation. Although the effect for session
was not significant, indicating that there were no differences between the pre and
posttests, other results were evident. The coupled protocol group exhibited a higher
power in the beta band (15-30 Hz) compared to the weighted group when moving
unimanually. More specifically, the affected limb in the coupled protocol group showed
a higher power than the unaffected limb in the same group as well as the affected and
28

29
unaffected limbs of the weighted group. These findings do not indicate that the coupled
training protocol is definitively more effective than the weighted protocol, but the
specific subjects in the coupled group responded to that treatment better. Additional
sources of variability include age, movement ability before training, and time since
stroke; each may influence the efficacy of the training program. Further, the left
hemisphere has been linked to bilateral movement control, so damage to this side may
affect training performances (Wyke, 1971). In fact, 18 of 25 subjects in the present study
suffered a left CVA, which may explain the absence of the statistically pretest-posttest
effect.
For the low gamma band (30-55 Hz), findings revealed a high correspondence with
the current hypotheses and previous publications. The unaffected limb exhibited higher
power than the affected limb, indicating that the unimpaired limb is able to harness larger
motor neurons in its recruitment strategy. The recruitment of larger motor neurons
theoretically leads to a larger force production, which is supported by this research. The
most force is produced by the unimpaired limb when moving unimanually in the posttest;
therefore inferring that the nonparetic hand tends to decrease its force production when
coupled with the paretic hand. Research has shown that the nonparetic limb matches the
movement time and trajectory of the paretic limb when moving together (Rose &
Winstein, 2004). In addition, the current results support previous research (Van Dieen et
al., 2003) in that the nonparetic limb attempted to match the paretic limb in force
production. Although the affected limb did not exhibit a significant change after the
coupled bimanual training protocol, in Figure 3-4, a trend for increased power in the low
gamma band exists for the affected limb in the bimanual and unimanual conditions,

30
though a steeper slope is exhibited in the bimanual condition. According to the
hypotheses, the affected limb was expected to display an increase in power with a larger
increase in the bimanual condition. Though Tukey’s HSD post-hoc analyses did not
reveal a significant increase, a trend for increased power in the low gamma band in the
affected limb is evident. This trend for increased in power in the low gamma band
translates into the ability to recruit larger motor neurons and therefore the potential to
produce larger amounts of force.
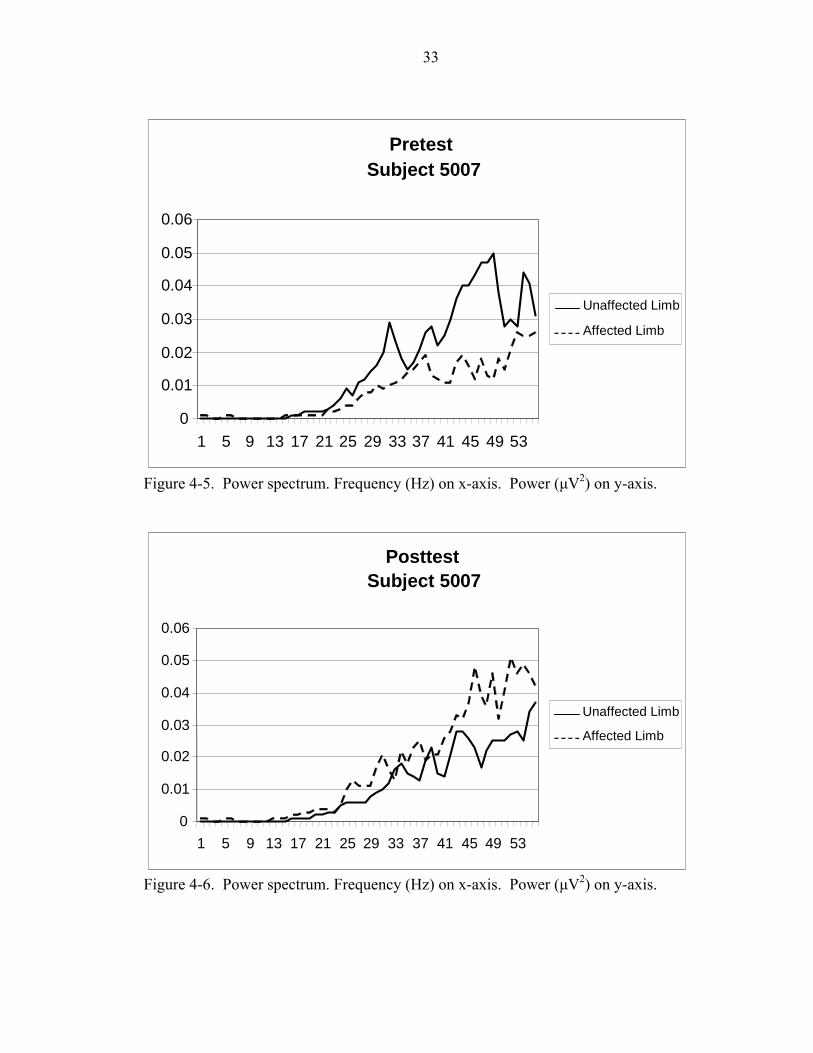
In an effort to explain the results revealed in the four power bands from 1-55 Hz,
the entire continuous power spectrum was examined (personal communication, J.
Garland, March 31, 2006). Instead of averaging power for each subject across a specific
power band, the continuous power spectrum may reveal phenomenon not evident in
averaging. After examining each subject’s power spectrum, results were inconclusive.
There were no trends for an increase or decrease in power in either limb. Subjects
showed increases in both limbs (Figures 4-1 and 4-2), decreases in both limbs (Figures 4-
3 and 4-4), and increases in one limb coupled with a decrease in the opposite limb
(Figure 4-5 and 4-6). Although each subject’s power spectrum displays a lower power in
the affected limb compared to the unaffected limb in the pretest, each subject responded
differently to the training which is clearly supported by the various power spectrum
results displayed in Figures 4-1, 4-2, 4-3, 4-4, 4-5, and 4-6.

31
PretestSubject 5003
0
0.02
0.04
0.06
0.08
0.1
0.12
0.14
1 5 9 13 17 21 25 29 33 37 41 45 49 53
Affected Limb
Unaffected Limb
Figure 4-1. Power spectrum. Frequency (Hz) on x-axis. Power (µV2) on y-axis.
PosttestSubject 5003
0
0.02
0.04
0.06
0.08
0.1
0.12
0.14
1 5 9 13 17 21 25 29 33 37 41 45 49 53
Affected Limb
Unaffected Limb
Figure 4-2. Power spectrum. Frequency (Hz) on x-axis. Power (µV2) on y-axis.

32
PretestSubject 5005
0
0.002
0.004
0.006
0.008
0.01
0.012
0.014
1 5 9 13 17 21 25 29 33 37 41 45 49 53
Unaffected Limb
Affected Limb
Figure 4-3. Power spectrum. Frequency (Hz) on x-axis. Power (µV2) on y-axis.
PosttestSubject 5005
0
0.002
0.004
0.006 0.008
0.01
0.012
0.014
1 5 9 13 17 21 25 29 33 37 41 45 49 53
Unaffected Limb
Affected Limb
Figure 4-4. Power spectrum. Frequency (Hz) on x-axis. Power (µV2) on y-axis.
33
PretestSubject 5007
0
0.01
0.02
0.03
0.04
0.05
0.06
1 5 9 13 17 21 25 29 33 37 41 45 49 53
Unaffected Limb
Affected Limb
Figure 4-5. Power spectrum. Frequency (Hz) on x-axis. Power (µV2) on y-axis.
PosttestSubject 5007
0
0.01
0.02
0.03
0.04
0.05
0.06
1 5 9 13 17 21 25 29 33 37 41 45 49 53
Unaffected Limb
Affected Limb
Figure 4-6. Power spectrum. Frequency (Hz) on x-axis. Power (µV2) on y-axis.

34
Efficiency is the conservation of effort to accomplish a given task goal involving an
interaction with the environment and more specifically, a ratio of the effective work
output and the energy input into any system (Hatfield & Hillman, 2001). Kraemer (1994)
expounded on this idea of efficiency using a muscle endurance training example, stating
that the level of motor unit activation needed to maintain a given submaximal force
decreases as the skill is acquired. Additionally, Kraemer argued that improved endurance
performance may result in neural activity changes and lead to more efficient performance
with lower energy expenditure. In the field of motor unit recruitment, DeVries and
Housh (1994) used EMG measurements to show a gradual decrease in motor unit
recruitment as a result of resistance training. Even the simplest central nervous system
involves many neuromuscular events overlapping in time. Kelso, Tuller, and Harris
(1983) suggested a need for an organizing principle to direct the proper timing and
activation of several sets of muscles for a coordinated action to occur. The precise
facilitation and inhibition that must take place in a coordinated movement is not simply
several actions at one joint, but a synergy of muscles and joints constrained to act as a
single unit. In other words, a complex action with many degrees of freedom is simplified
to a more efficient model by the central nervous system. According to an extension of
the general adaptation syndrome (GAS) proposed by Hans Selye (1976), when an
organism is initially confronted with a specific task, it generally responds in an inefficient
manner by firing both relevant and irrelevant neural pathways. As skill level increases,
the neural networks are able to suppress irrelevant pathways and coordinate a skillful
movement. This learning process is termed “pruning”, described as clipping away

35
ineffective pathways and clearly activating effective neural pathways which lead to
successful movements (Bell & Fox, 1996).
In the present pilot data, the average power decreases in the bimanual condition
which indicates that the system is not recruiting larger motor units to create more force.
Further, the system does not appear to be firing these motor units at a faster rate because
the MPF does not increase in the bimanual condition. Therefore, one interpretation is
that in the bimanual condition, the system is able to recruit more motor neurons of the
same size and fire at the same frequency as in the unimanual condition to create greater
force. In this method, smaller motor units are utilized to their fullest potential in an effort
to preserve energy because they are fatigue-resistant. Based on this analysis, it can be
concluded that after bimanual coordination training coupled with neuromuscular
stimulation, stroke subjects perform more efficiently by producing a greater amount of
force with less effort in a bimanual performance condition.
Overall, following a bimanual coordination protocol coupled with neuromuscular
stimulation, stroke subjects are able to produce greater force in both unimanual and
bimanual conditions. In addition, the system is more efficient when performing
bimanually as is evidenced by the decreased average power in the bimanual condition.
Although stroke subjects appear to respond uniquely to the training administered,
each group showed progress in the functional task, exhibiting a practical improvement.
The coupled training protocol group showed improved performance in the Box and Block
Test by increasing the average number of blocks moved by 8. Whereas, the weighted
protocol group improved its average number of blocks moved by 3. In addition, though
not statistically significant, there was an average increase when collapsing across subjects

36
in power bands 3 and 4, as well as MPF and force. These averages are shown in Table 4-
1.
Table 4-1. Averages collapsed across subjects and groups.
Dependent Measure Average Pretest Average Posttest Average Increase
Power Band 3 (µV2) 0.00135715
0.00190377 +0.00054662
Power Band 4 (µV2) 0.00350579 0.00456317
+0.00105738
Mean Peak Frequency (Hz) 37.93329836
38.02371529
+0.09041693
Force (kg) 4.76181822
4.78578040
+0.02396218
Each subject exhibited improvement in at least one category, number of blocks
moved, increased mean peak frequency, a change in power in the 30-55 Hz bands, or
amount of force produced. However, no single uniform characteristic of motor
improvement was shown by each stroke subject. Just as each stroke is unique and
variable, so is each patient’s rehabilitation and adaptation strategy. The short training
period and less intense training schedule, may not yield physiological changes in the
central nervous system or the muscles of the wrist and finger extensors as could be
expected with a more strenuous schedule. Physiological adaptations poststroke because
of a training regimen may only be evident through highly intensive therapy for a longer
period of time which was not administered in the present studies (Oullette et al., 2004).
However, the improvements shown by each subject in the present protocol support the
efficacy of both the weighted and coupled therapy. Whether range of motion, flexibility,
strength, or a combination of these and other factors, is improved is unclear; however, the
current findings indicate that the training is affecting the stroke subjects positively and
this merits further research. In addition to discovering the type of training best suited for
individual stroke survivors, it is also important to utilize spectral analysis as a

37
noninvasive method of investigating motor unit recruitment. Although it is imperative to
develop uniform subject groups when employing spectral analysis to eliminate strong
variations which hide significant changes in the motor unit recruitment pattern of
individuals, the analysis technique lends itself well to human trials because it uses surface
EMG recordings. The use of spectral analysis to evaluate stroke motor recovery is
important because is investigates recovery not a functional level, but at a physiological
level. Employing spectral analysis in the investigation of motor unit recruitment changes
in the stroke population is an important research avenue deserving of future attention.

APPENDIX PILOT DATA
Two subjects from a bimanual coordination training protocol were used as pilot
data. The data are presented for subjects 1102 and 2102 in both the unimanual and
bimanual conditions for pre- and post-tests. In the unimanual and bimanual conditions,
both subjects show an increase in average power in the beta and low gamma bands,
increased mean peak frequency, and increased force production in the paretic limb.
Increased average power is indicative of a larger reliance on Type II muscle fibers,
and thus an ability to recruit larger motor units (Bilodeau et al., 1995). Therefore, it can
be concluded that after participation in the bimanual training protocol, stroke subjects
improve their ability to capitalize on Henneman’s size principle to produce larger force
values. That is, they were able to recruit larger motor units that are capable of greater
force output. This is a critical finding which demonstrates the effectiveness of the
training protocol. The increased average power is displayed in the beta and low gamma
frequency bands which are controlled by the motor cortex. Therefore, a logical
conclusion is that bimanual coordination exercises coupled with neuromuscular
stimulation activates and strengthens the motor cortex. Figures A-1, A-2, A-3, A-4
display the increased average power in the beta and low gamma bands for subjects 1102
and 2102 pre and posttraining in the unimanual and bimanual conditions.
38

39
1102 Unimanual Condition
0
0.0005
0.001
0.0015
0.002
0.0025
1-3 Hz 5-12 Hz 15-30 Hz 30-55 Hz Frequency Bands
Ave
rage
Pow
er µ
V2
PretestPosttest
Figure A-1. Average power (subject 1102) in pre and posttests in unimanual condition.
1102 Bimanual Condition
0
0.0002
0.0004
0.0006
0.0008
0.001
0.0012
0.0014
1-3 Hz 5-12 Hz 15-30 Hz 30-55 Hz Frequency Bands
Ave
rage
Pow
er µ
V2
PretestPosttest
Figure A-2. Average power (subject 1102) in pre and posttests in bimanual condition.

40
2102 Unimanual Condition
0
0.002
0.004
0.006
0.008
0.01
0.012
0.014
1-3 Hz 5-12 Hz 15-30 Hz 30-55 Hz Frequency Bands
Ave
rage
Pow
er µ
V2
PretestPosttest
Figure A-3. Average power (subject 2102) in pre and posttests in unimanual condition.
2102 Bimanual Condition
0
0.001
0.002
0.003
0.004
0.005
0.006
1-3 Hz 5-12 Hz 15-30 Hz 30-55 Hz Frequency Bands
Ave
rage
Pow
er µ
V2
PretestPosttest
Figure A-4. Average power (subject 2102) in pre and posttests in bimanual condition.

41
Mean peak frequency (MPF) is indicative of the firing rate of individual motor
units (Bilodeau et al., 1995). Posttests reveal increased MPF for both subjects (see
Figures A-5, A-6, A-7, A-8). An increase in MPF also indicates more of a reliance on
Type II muscle fibers, just as increased average power shows. Hence, the same
conclusions can be deduced. After training, stroke subjects are not only using larger
motor units but also firing at higher frequencies which are the underlying mechanisms of
the increased force production.
1102 Unimanual Condition
39.5
39.6
39.7
39.8
39.9
40
40.1
40.2
40.3
40.4
Pretest Posttest
Mea
n Pe
ak F
requ
ency
(Hz)
Figure A-5. Mean peak frequency (MPF) for subject 1102 in pre and posttests in unimanual condition.

42
1102 Bimanual Condition
38.7
38.8
38.9
39
39.1
39.2
39.3
39.4
39.5
39.6
Pretest Posttest
Mea
n Pe
ak F
requ
ency
(Hz)
Figure A-6. Mean peak frequency (MPF) for subject 1102 pre and posttests in bimanual condition.
2102 Unimanual Condition
33.8
34
34.2
34.4
34.6
34.8
35
35.2
35.4
Pretest Posttest
Mea
n Pe
ak F
requ
ency
(Hz)
Figure A-7. Mean peak frequency (MPF) for subject 2102 pre and posttests in unimanual condition.

43
2102 Bimanual Condition
35.5
36
36.5
37
37.5
38
38.5
39
39.5
40
Pretest Posttest
Mea
n Pe
ak F
requ
ency
(Hz)
Figure A-8. Mean peak frequency (MPF) for subject 2102 pre and posttests in bimanual condition.
Research has demonstrated that in both the unimanual and bimanual conditions,
stroke subjects exhibit increased average power in the beta and low gamma bands,
increased mean peak frequency, and increased force production, all as expected. When
comparing the post-tests of the unimanual and bimanual conditions, a decrease in power
coupled with an increase in force production is observed (Figures A-9 and A-10). MPF
in these conditions stays essentially equal and therefore will not be considered a factor for
increasing the force in the bimanual condition. The justification for an increase in force
accompanied by a decrease in average power of the beta and low gamma bands can be
explained through a model of efficiency.

44
1102 Posttest
0
0.5
1
1.5
2
2.5
3
3.5
4
Unimanual Bimanual
Mea
n Fo
rce
(kg)
Figure A-9. Mean force (subject 1102) in posttests in the unimanual vs. bimanual conditions.
2102 Posttest
0
0.5
1
1.5
2
2.5
3
3.5
4
Unimanual Bimanual
Mea
n Fo
rce
(kg)
Figure A-10. Mean force (subject 2102) posttests in the unimanual vs. bimanual conditions.

LIST OF REFERENCES
Basmajian, J.V. and De Luca, C.V. Muscles alive. Baltimore, MD: Williams & Wilkins, 1985.
Beaumont E, Gardiner P. Effects of daily spontaneous running on the electrophysiological properties of hindlimb motoneurones in rats. J Physiol. 2002;540:129-38.
Bell, M. A., & Fox, N .A. Crawling experience is related to changes in cortical organization during infancy: Evidence from EEG coherence. Dev Psychobiol. 1996;29,551–561.
Bilodeau M, Cincera M, Gervais S, Arsenault AB, Gravel D, Lepage Y, McKinley P. Changes in the electromyographic spectrum power distribution caused by a progressive increase in the force level. Eur J Appl Physiol Occup Physiol. 1995;71(2-3):113-23.
Brown P. Cortical drives to human muscle: the Piper and related rhythms. Prog Neurobiol. 2000;60(1):97-108.
Cauraugh JH. Coupled rehabilitation protocols and neural plasticity: Upper extremity improvements in chronic hemiparesis. Restor Neurol and Neurosci. 2002;22:337-347.
Cauraugh JH, Kim SB. Two coupled motor recovery protocols are better than one: Electromyogram-triggered neuromuscular stimulation and bilateral movements. Stroke. 2002;33:1589.
Cauraugh JH, Summers JJ. Neural plasticity and bilateral movements: A rehabilitation approach for chronic stroke. Prog Neurobiol. 2005;75(5):309-20.
Cunningham CL, Stoykov ME, Walter CB. Bilateral facilitation of motor control in chronic hemiplegia. Acta Psychol. 2002;110: 321–337.
Cunningham CL, Stoykov MEP, Walter CB. Bilateral facilitation of motor control in chronic hemiplegia. Acta Psychol. 2002;110:321-337.
DeLuca CJ. Control properties of motor units. J Exp Biol. 1985;115:125-36.
Denny-Brown D. On the nature of postural reflexes. Proc. R. Soc. Lond. B Biol. Sci. 1929;104:252-301.
45

46
DeVries HA, Housh TJ. Physiology of exercise 5th Edition. Madison, Wisconsin: Brown and Benchmark, 1994.
Ertas M, Stalberg E, Falck B: Can the size principle be detected in conventional EMG recordings? Muscle Nerve. 1995;18(4):435-439
Farina D, Macaluso A, Ferguson RA, and De Vito G. Effect of power, pedal rate, and force on average muscle fiber conduction velocity during cycling. J Appl Physiol. 2004;97(6):2035-2041.
Farina D, Fosci M, Merletti, R. Motor unit recruitment strategies investigated by surface EMG variables. J Appl Physiology. 2002;92,235–247.
Farmer SF, Bremner FD, Halliday DM, Rosenberg JR and Stephens JA. The frequency content of common presynaptic inputs to motoneurones studied during voluntary isometric contractions in man. J Physiol. 1993a; 470:127–155.
Farmer SF, Bremner FD, Halliday DM, Rosenberg JR and Stephens JA. Changes in motor-unit synchronisation following central nervous lesions in man. J Physiol. 1993b;463:83–105.
Gardiner PF & Kernell D. The "fastness" of rat motoneurones: time-course of afterhyperpolarization in relation to axonal conduction velocity and muscle unit contractile speed. Pflugers Arch. 1990;415,762-766.
Gemperline JJ, Allen S, Walk D, Rymer WZ. Characteristics of motor unit discharge in subjects with hemiparesis. Muscle Nerve 1995;18:1101–14.
Granit R., Henatsch MD, and Steg G. Tonic and phasic ventral horn cells differentiated by post-tetanic potentiation in cat extensors. Acta Physiol Scand. 1956;37:114–126.
Granit R, Kernell D, and Shortess KS. Quantitative aspects of repetitive firing of mammalian motoneurons, caused by injected currents. J Physiol. 1963;168:911-931.
Hatfield BD, Hillman CH. The psychophysiology of sport: A mechanistic understanding of the psychology of superior performance. In R. Singer, H. Hausenblas, & C. Janelle (Eds.), Handbook of sport psychology. New York: Wiley & Sons, 2001;362-386.
Henneman E, Somjen G, Carpenter DO: Functional significance of cell size in spinal motoneurons. J Neurophysiol. 1965;28:560-80.
Hogrel JY. Clinical applications of surface electromyography in neuromuscular disorders. Neurophysiol Clin. 2005;35(2-3):59-71.

47
Homberg V, Reiners K, Hefter H, and Freund HJ. The muscle activity spectrum: spectral analysis of muscle force as an estimator of overall motor unit activity. Electroencephalogr Clin Neurophysiol. 1986;63:209-222.
Kamen G, DeLuca CJ. Firing rate interactions among human Orbicularis Oris motor units. Int J Neurosci. 1992;64:167–175.
Karlsson S, Yu J, and Akay M. Time–frequency analysis of myoelectric signals during dynamic contractions: a comparative study. IEEE Trans Biomed Eng. 2000;47: 228–237.
Kelso JAS, Tuller BH, Harris KS. A “dynamic pattern” perspective on the control and coordination of movement. In P. MacNeilage (Ed.), The Production of speech. New York: Springer-Verlag. 1983;137-173.
Kernell, D. Organized variability in the neuromuscular system: a survey of task-related adaptations. Arch ItalBiol.1992;130:19–66.
Kraemer, W. J. (1994). General adaptations to resistance and endurance training programs. In T. Baechle (Eds.), Essentials of strength training and conditioning (pp. 127-150). Champaign: Human Kinetics.
Landau WM, Sahrmann SA. Preservation of directly stimulated muscle strength in hemiplegia due to stroke. Arch Neurol. 2002;59(9):1453-7.
Leonard CT. The Neuroscience of human movement. St Louis, Mo: Mosby; 1998.
Luff AR. and Atwood HL. Membrane properties and contraction of single muscle fibres in the mouse. Am J Physiol. 1972;222,1435–1440.
Mazevet D, Meunier S, Pradat-Diehl P, Marchand-Pauvert V, and Pierrot-Deseilligny E. Changes in propriospinally mediated excitation of upper limb motoneurons in stroke patients. Brain. 2003;126(4):988-1000.
McComas AJ, Sica RE, Upton AR, and Aguilera N. Functional changes in motoneurones of hemiparetic patients. J Neurol Neurosurg Psychiatry. 1973;36:183-193.
McComas AJ, Fawcett PRW, Campbell MJ, Sica REP. Electrophysiological estimation of the number of motor units within a human muscle. J Neurol Neurosurg Psychiatry. 1971; 34:121-131.
Milner-Brown HS. Stein, RB, and Yemm R. Changes in firing rate of human motor units during linearly changing voluntary contractions. J Physiol. 1973;230:371–390.
Morales FR, Engelhardt JK, Soja PJ, Pereda AE, and Chase MH. Motoneuron properties during motor inhibition produced by microinjection of carbachol into the pontine reticular formation of the decerebrate cat. J Neurophysiol. 1987;57:1118-1129.

48
Moritani T, Muro M, and Nagata A. Intramuscular and surface electromyogram changes during muscle fatigue. J Appl Physiol. 1986;60:1179-1185.
Mudie MH, Matyas TA. Can simultaneous bilateral movement involve the undamaged hemisphere in reconstruction of neural networks damaged by stroke? Disabil Rehabil. 2000;22:23–37
Myers LJ, Erim Z, and Lowery MM. Time and frequency domain methods for quantifying common modulation of motor unit firing patterns. J Neuroengineering Rehabil. 2004;1:2.
Nudo RJ. Recovery after damage to motor cortical areas. Curr Opin Neurobiol. 1999;9:740–7.
Olson CB, Carpenter DO, and Henneman E. Orderly recruitment of muscle action potentials. Arch Neurol. 1968;19:591-597.
Ouellette MM, LeBrasseur NK, Bean JF, Phillips E, Stein J, Frontera WR, Fielding RA.Petajan JH. Stroke. 2004;35(6):1404-9.
Petajan, JH. AAEM minimonograph #3: motor unit recruitment. Muscle Nerve. 1991;14(6):489-502.
Priez A, Duchene J, Goubel F. Duchenne muscular dystrophy quantification: a multivariate analysis of surface EMG. Med Biol Eng Comput. 1992;30:283–291.
Popovic D, Sinkjaer T. Control of Movement in the Physically Disabled. London, UK: Springer-Verlag; 2001
Rose J, McGill KC. The motor unit in spastic cerebral palsy. Develop Med Child Neurol, 1998;40:270-277.
Rose DK, Winstein CJ. Bimanual training after stroke: are two hands better than one? Top Stroke Rehabil. 2004;11;20-30.
Salenius S, Portin K, Kajola M, Salmelin R and Hari R. Cortical control of human motoneuron firing during isometric contraction. J Neurophysiol. 1997;77:3401–3405.
Selye H. Stress in health and disease. Reading, MA: Butterworth. 1976.
Toulouse P, Carrault G, Le Rumeur E, Coatrieux JL: Surface electromyogram automatic analysis and Guillain-Barr‚ syndrome follow up. Electromyogr Clin Neurophysiol. 1992;32(1-2):51-62.
Van Dieen JH, Futoshi O, De Haan A. Reduced neural drive in bilateral exertions: A performance-limiting factor. Med Sci Sports Exerc. 2003;35(1):111-118.

49
Wakeling JM and Rozitis AI. Spectral properties of myoelectric signals from different motor units in the leg extensor muscles. J Exp Biol. 2004;207:2519-2528.
Walter CB, Swinnen JP. Kinetic attraction during bimanual coordination. J Mot Behav. 1990;22(4):451-73.
Whitall J, Waller S, Silver K, Macko R. Repetitive bilateral arm training with rhythmic auditory cueing improves motor function in chronic hemiparetic stroke. Stroke. 2000;31:2390–2395.
William M. Landau, MD; Shirley A. Sahrmann, PhD. Preservation of directly stimulated muscle strength in hemiplegia due to stroke. Arch Neurol. 2002;59:1453-1457.
Wyke, M. The effects of brain lesions on the performance of bilateral arm movements. Neuropsychologia. 1971;9:33–42.

BIOGRAPHICAL SKETCH
Lindsay McManus was born in North Carolina in 1982. She graduated with honors
from North Carolina State University with a Bachelor of Science degree in biomedical
engineering and biological engineering. During a summer internship in Cincinnati,
Lindsay joined a research team studying stroke and spinal cord injury recovery, which
eventually led her to the University of Florida in 2004. Lindsay has worked with Dr.
James Cauraugh in the Motor Behavior Laboratory investigating chronic stroke recovery
through bilateral training and EMG-neuromuscular stimulation. While at the University
of Florida, Lindsay also worked in the Biomechanics Laboratory with Dr. John Chow and
Dr. Mark Tillman. In addition, she was also an instructor for the undergraduate motor
learning/control course for four semesters. After graduating with a Master of Science
degree in August 2006, Lindsay plans to enter the field of medical devices and implants.
50