Embed Size (px)
Citation preview
1/24/2018
1
Using Excel to Troubleshoot EMIS Data
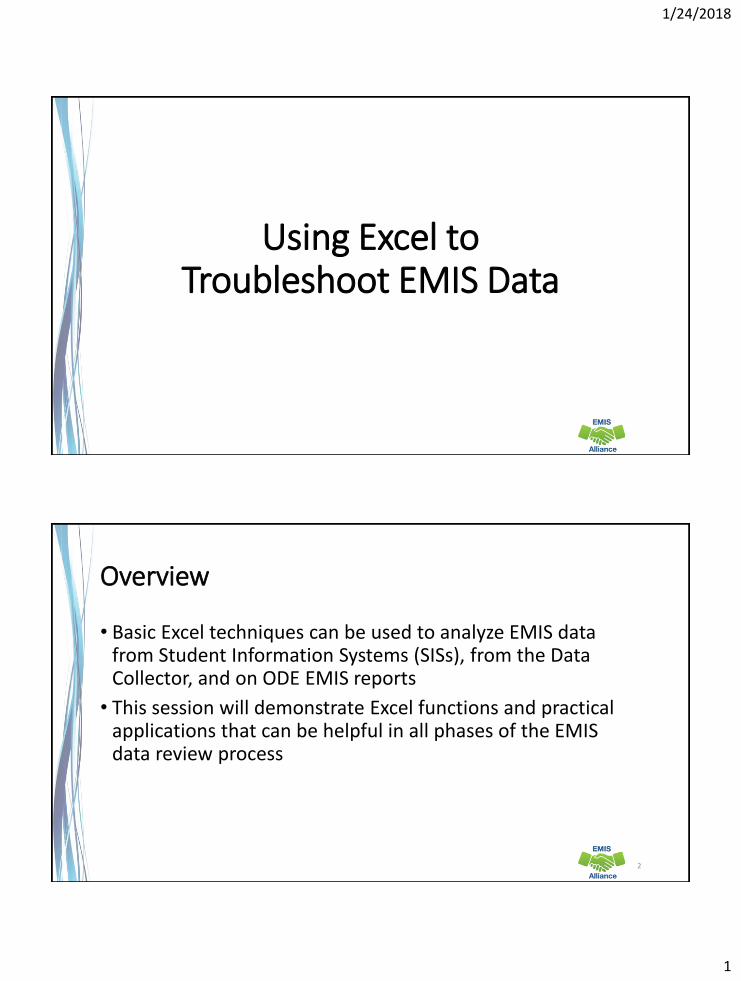
Overview
• Basic Excel techniques can be used to analyze EMIS data from Student Information Systems (SISs), from the Data Collector, and on ODE EMIS reports
• This session will demonstrate Excel functions and practical applications that can be helpful in all phases of the EMIS data review process
2
1/24/2018
2
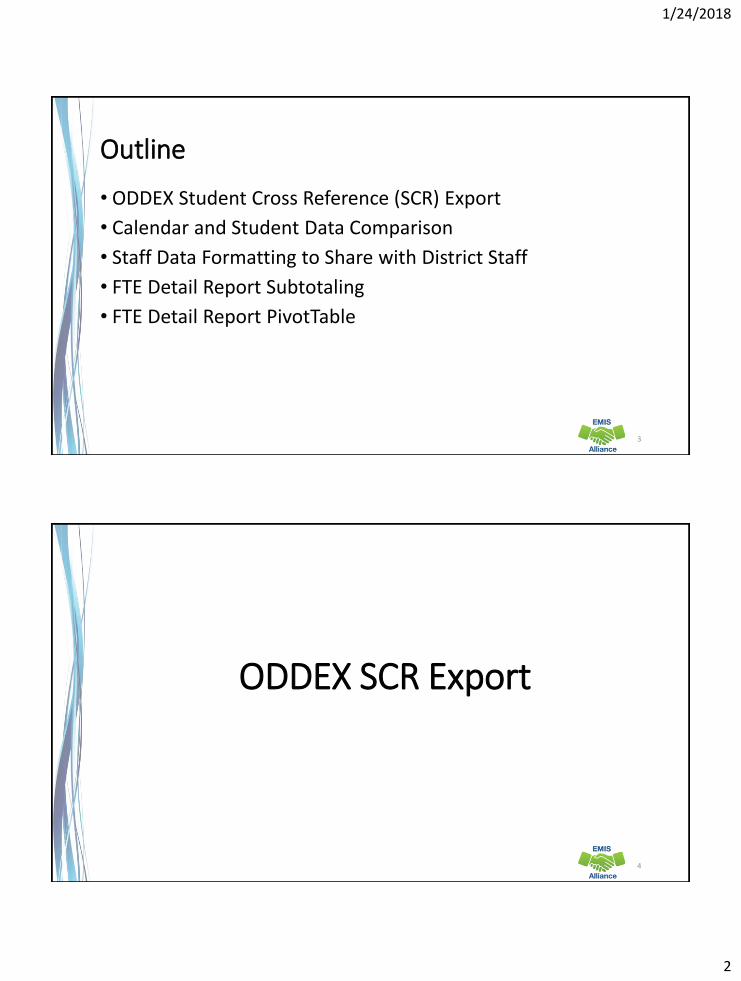
Outline
• ODDEX Student Cross Reference (SCR) Export
• Calendar and Student Data Comparison
• Staff Data Formatting to Share with District Staff
• FTE Detail Report Subtotaling
• FTE Detail Report PivotTable
3
ODDEX SCR Export
4
1/24/2018
3
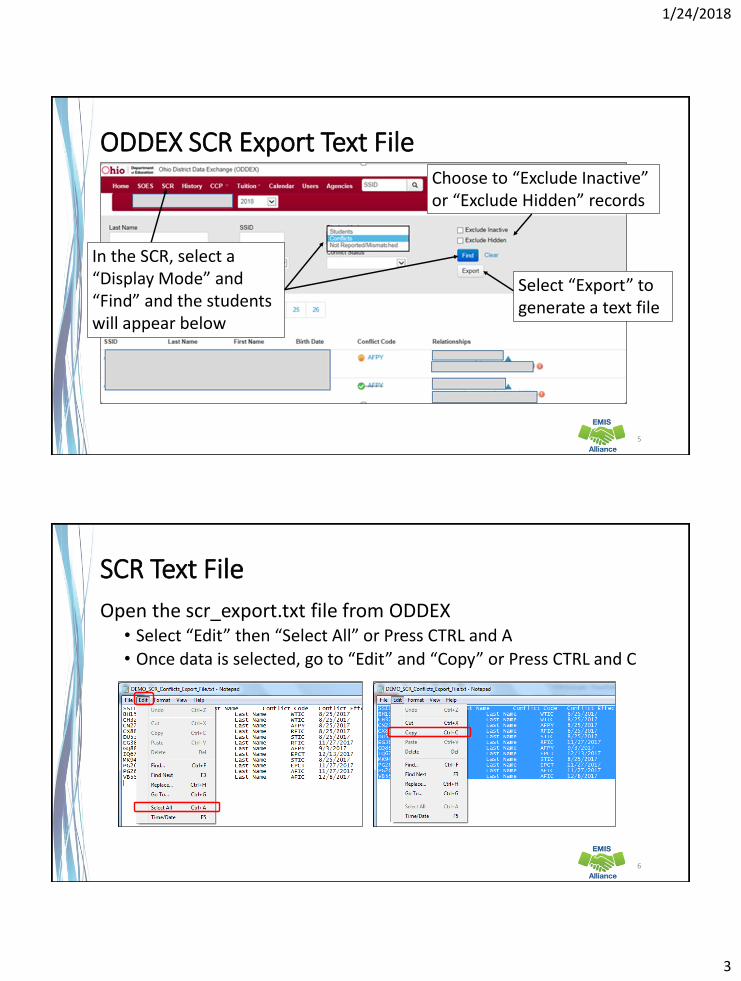
ODDEX SCR Export Text File
5
In the SCR, select a “Display Mode” and “Find” and the students will appear below
Choose to “Exclude Inactive” or “Exclude Hidden” records
Select “Export” to generate a text file
SCR Text File
Open the scr_export.txt file from ODDEX• Select “Edit” then “Select All” or Press CTRL and A
• Once data is selected, go to “Edit” and “Copy” or Press CTRL and C
6
1/24/2018
4
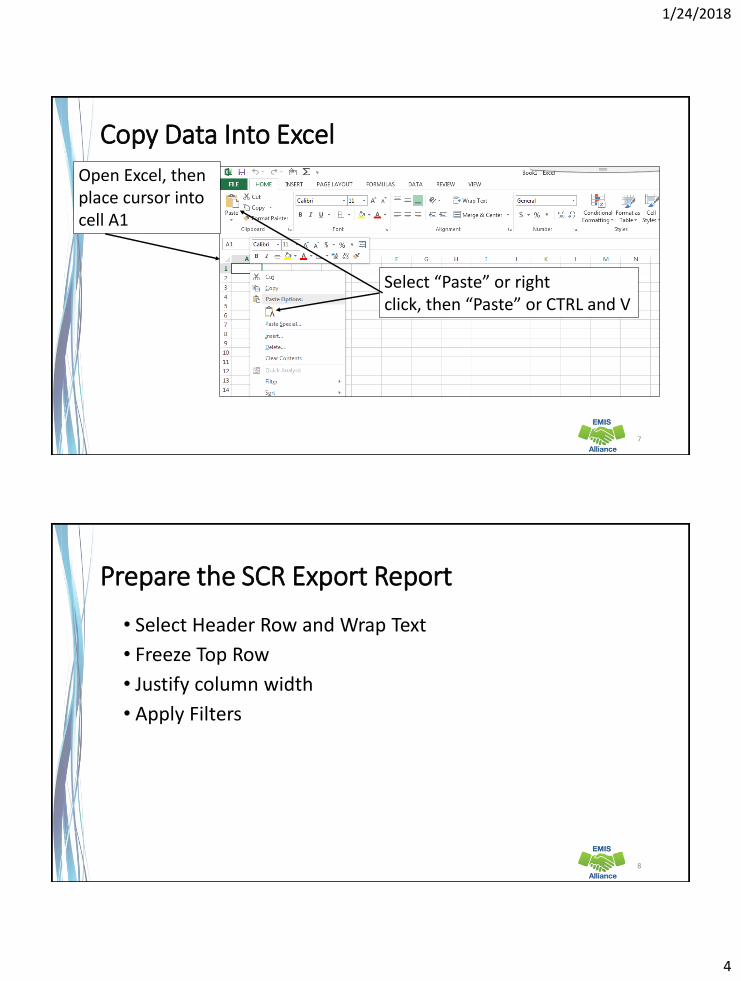
Copy Data Into Excel
7
Open Excel, then place cursor into cell A1
Select “Paste” or right click, then “Paste” or CTRL and V
Prepare the SCR Export Report
• Select Header Row and Wrap Text
• Freeze Top Row
• Justify column width
• Apply Filters
8
1/24/2018
5
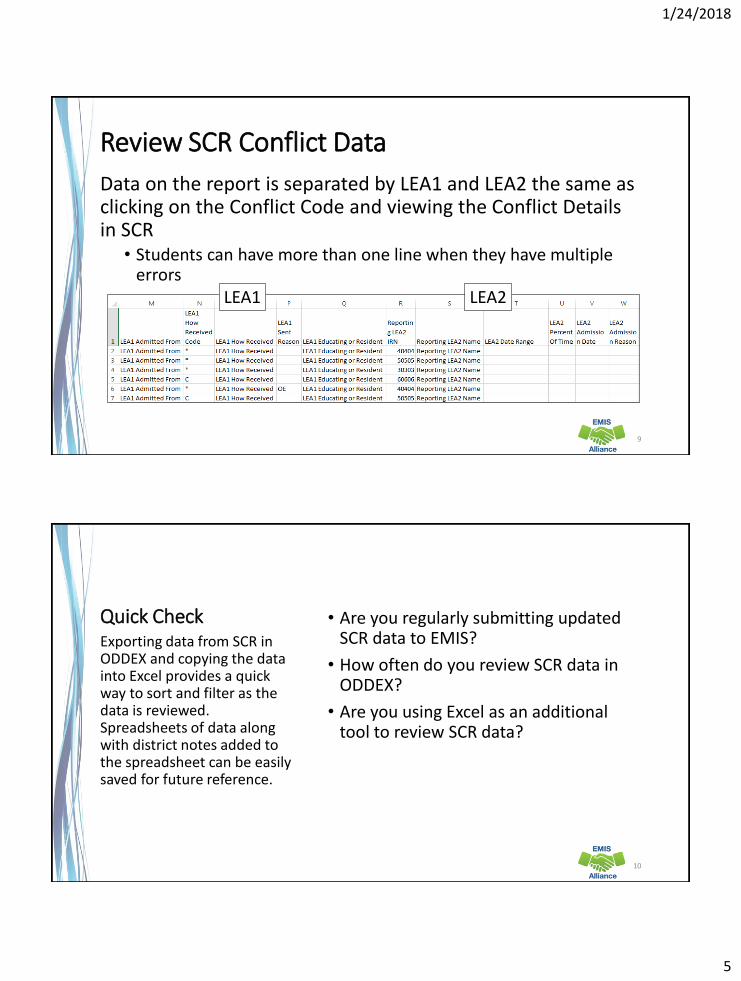
Review SCR Conflict Data
9
Data on the report is separated by LEA1 and LEA2 the same as clicking on the Conflict Code and viewing the Conflict Details in SCR
• Students can have more than one line when they have multiple errors
LEA1 LEA2
Quick Check • Are you regularly submitting updated SCR data to EMIS?
• How often do you review SCR data in ODDEX?
• Are you using Excel as an additional tool to review SCR data?
Exporting data from SCR in ODDEX and copying the data into Excel provides a quick way to sort and filter as the data is reviewed. Spreadsheets of data along with district notes added to the spreadsheet can be easily saved for future reference.
10
1/24/2018
6
Calendar and Student Data Comparison
11
Calendar Data and Student Data
• Calendar Collections contain calendar data and no student data
• Student Collections contain student Building IRNs, State Equivalent Grade Levels, and Attendance Patterns
• The data does not meet until the FTE Reports are generated
• Using Excel, the data can be compared to ensure that calendar data and student data align
12
1/24/2018
7
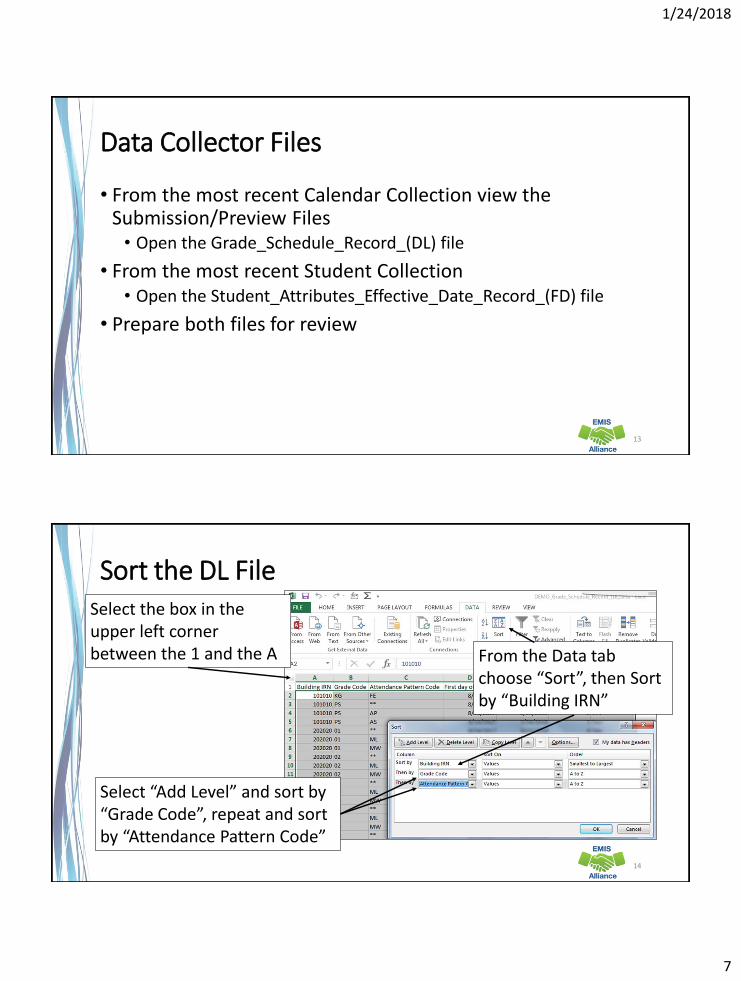
Data Collector Files
• From the most recent Calendar Collection view the Submission/Preview Files • Open the Grade_Schedule_Record_(DL) file
• From the most recent Student Collection• Open the Student_Attributes_Effective_Date_Record_(FD) file
• Prepare both files for review
13
Sort the DL File
14
Select the box in the upper left cornerbetween the 1 and the A From the Data tab
choose “Sort”, then Sort by “Building IRN”
Select “Add Level” and sort by “Grade Code”, repeat and sort by “Attendance Pattern Code”
1/24/2018
8
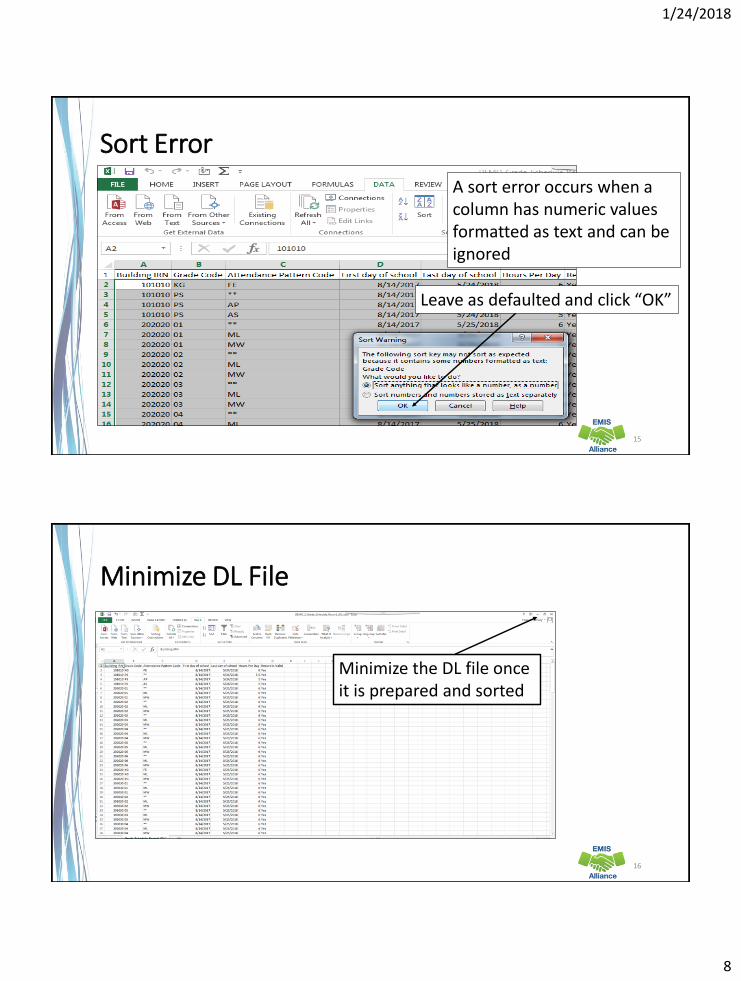
Sort Error
15
A sort error occurs when a column has numeric values formatted as text and can be ignored
Leave as defaulted and click “OK”
Minimize DL File
16
Minimize the DL file once it is prepared and sorted
1/24/2018
9
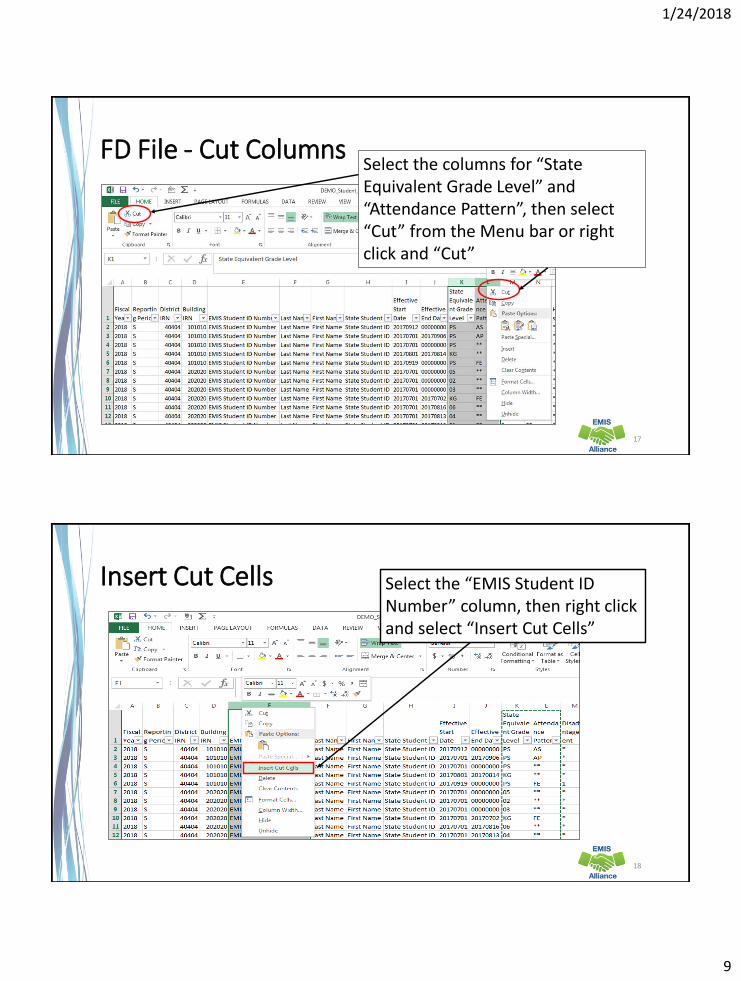
FD File - Cut Columns
17
Select the columns for “State Equivalent Grade Level” and “Attendance Pattern”, then select “Cut” from the Menu bar or right click and “Cut”
Insert Cut Cells
18
Select the “EMIS Student ID Number” column, then right click and select “Insert Cut Cells”
1/24/2018
10
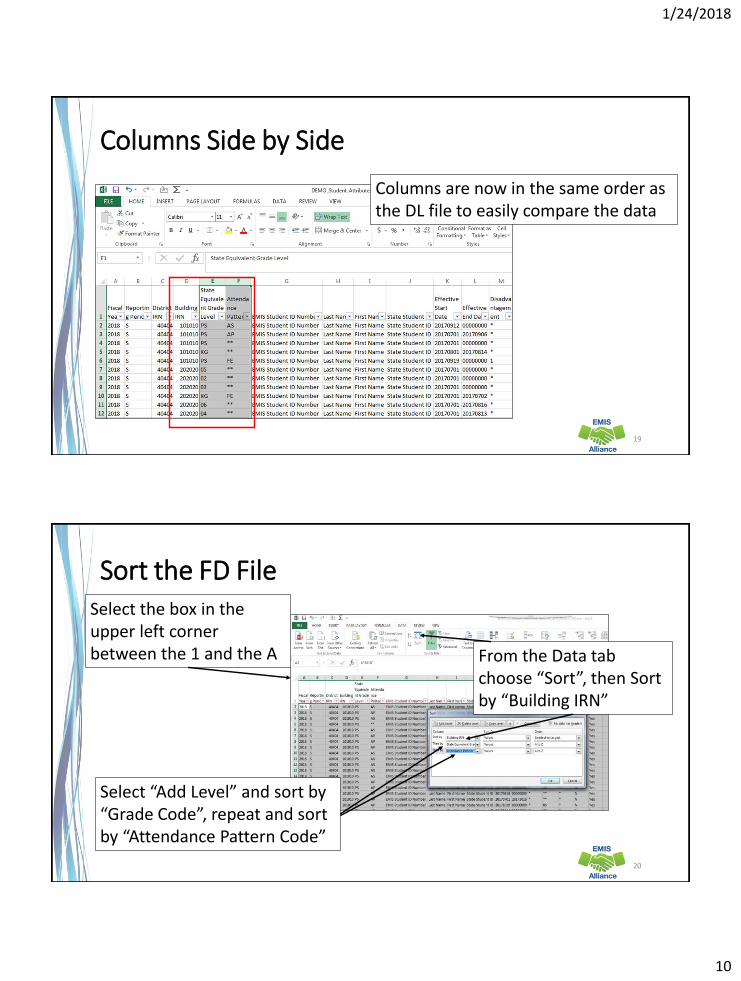
Columns Side by Side
19
Columns are now in the same order as the DL file to easily compare the data
Sort the FD File
20
Select the box in the upper left cornerbetween the 1 and the A From the Data tab
choose “Sort”, then Sort by “Building IRN”
Select “Add Level” and sort by “Grade Code”, repeat and sort by “Attendance Pattern Code”
1/24/2018
11
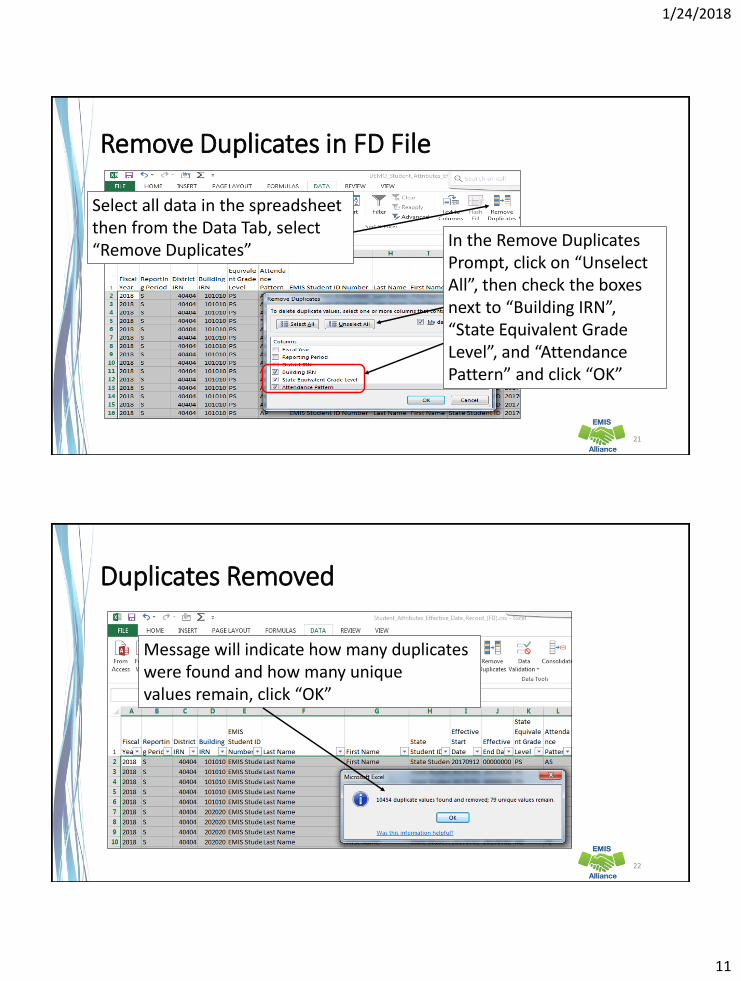
Remove Duplicates in FD File
21
Select all data in the spreadsheet then from the Data Tab, select “Remove Duplicates”
In the Remove Duplicates Prompt, click on “Unselect All”, then check the boxes next to “Building IRN”, “State Equivalent Grade Level”, and “Attendance Pattern” and click “OK”
Duplicates Removed
22
Message will indicate how many duplicates were found and how many unique values remain, click “OK”
1/24/2018
12
Compare the Data
• The two spreadsheets have unduplicated instances of Building IRN, Grade Level and Attendance Pattern
• Compare the two spreadsheets to verify that all combinations in the FD file appear in the DL file
• When Grade Level contains asterisks **, the asterisks should be treated as wildcards that can be matched against any grade level
• There could be DL records that are not represented in the FD file
23
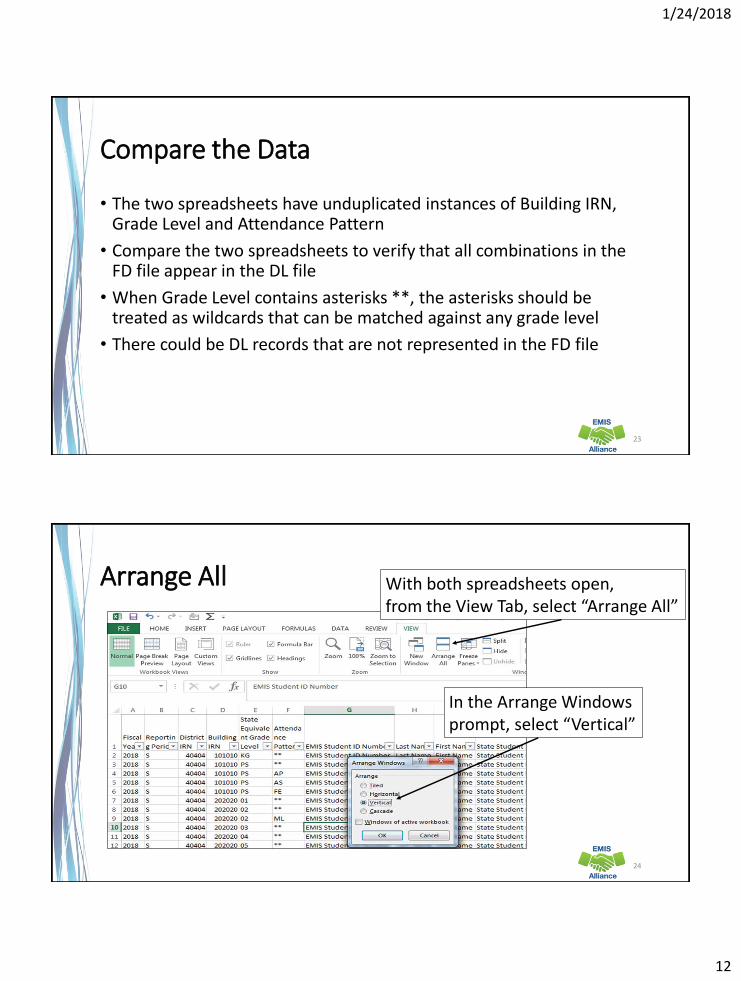
Arrange All
24
With both spreadsheets open, from the View Tab, select “Arrange All”
In the Arrange Windows prompt, select “Vertical”
1/24/2018
13
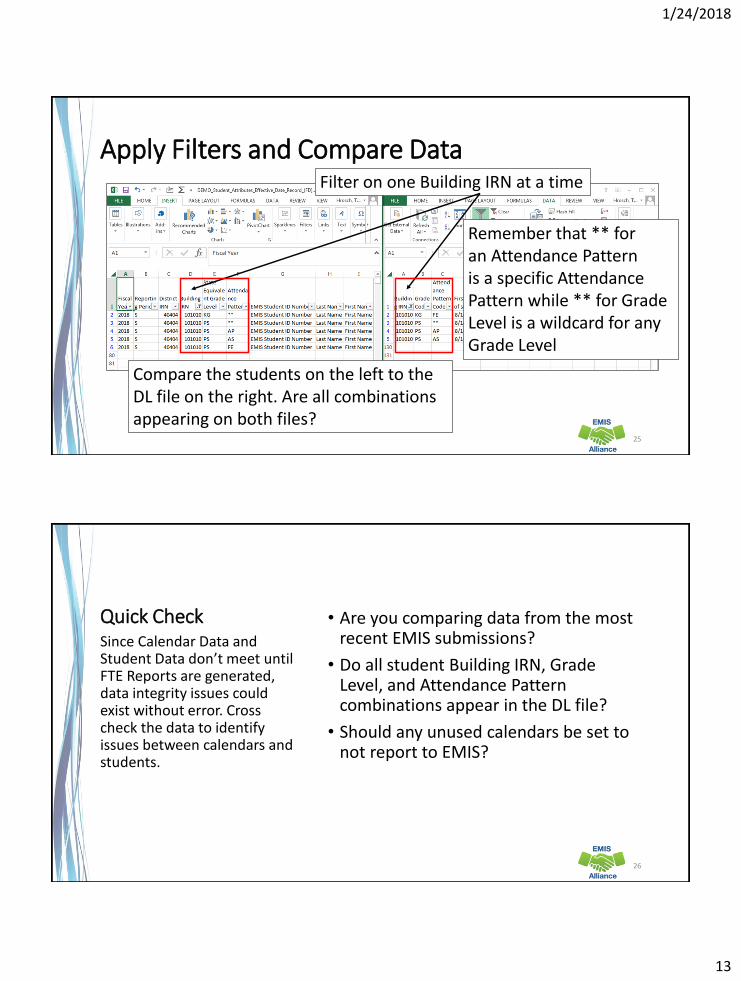
Apply Filters and Compare Data
25
Filter on one Building IRN at a time
Compare the students on the left to the DL file on the right. Are all combinations appearing on both files?
Remember that ** for an Attendance Pattern is a specific Attendance Pattern while ** for Grade Level is a wildcard for any Grade Level
Quick Check • Are you comparing data from the most recent EMIS submissions?
• Do all student Building IRN, Grade Level, and Attendance Pattern combinations appear in the DL file?
• Should any unused calendars be set to not report to EMIS?
Since Calendar Data and Student Data don’t meet until FTE Reports are generated, data integrity issues could exist without error. Cross check the data to identify issues between calendars and students.
26
1/24/2018
14
Staff Data Formatting to Share with District Staff
27
Sharing Staff Data
Staff EMIS data can come from a separate source system that is often managed by someone other than the EMIS Coordinator
• Sharing staff EMIS data can be a helpful when correcting and verifying the data
• Consider sharing • Level 1 Validations
• Submission Files
• Level 2 Reports
• Staff and Course sections of the EMIS Manual
28
1/24/2018
15
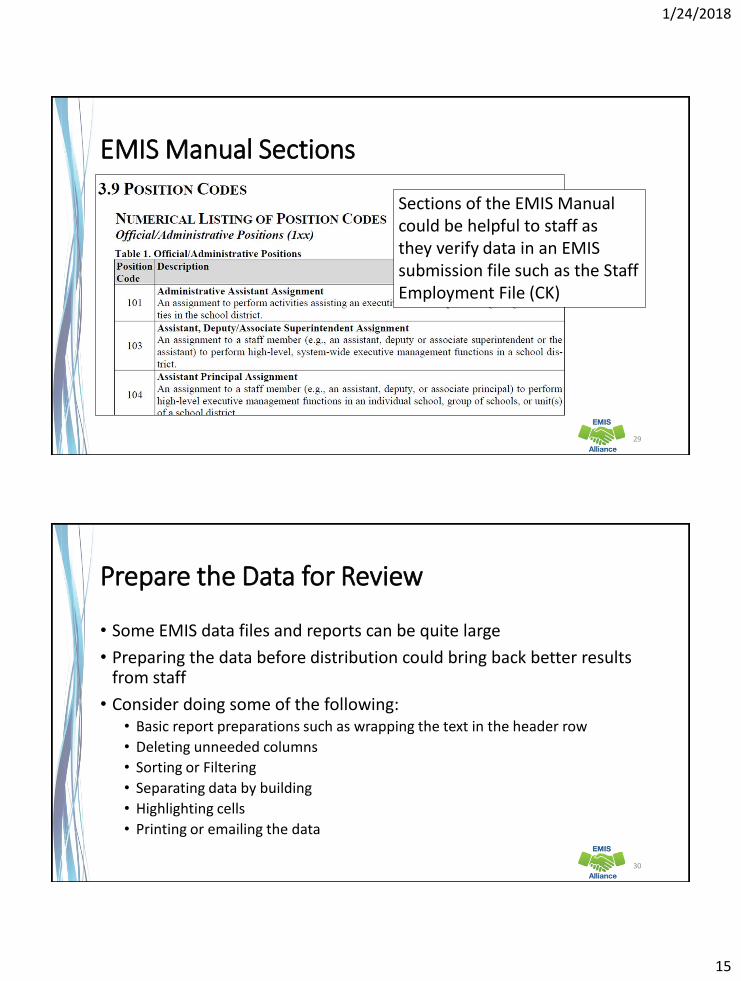
EMIS Manual Sections
29
Sections of the EMIS Manual could be helpful to staff as they verify data in an EMIS submission file such as the Staff Employment File (CK)
Prepare the Data for Review
• Some EMIS data files and reports can be quite large
• Preparing the data before distribution could bring back better results from staff
• Consider doing some of the following:• Basic report preparations such as wrapping the text in the header row
• Deleting unneeded columns
• Sorting or Filtering
• Separating data by building
• Highlighting cells
• Printing or emailing the data
30
1/24/2018
16
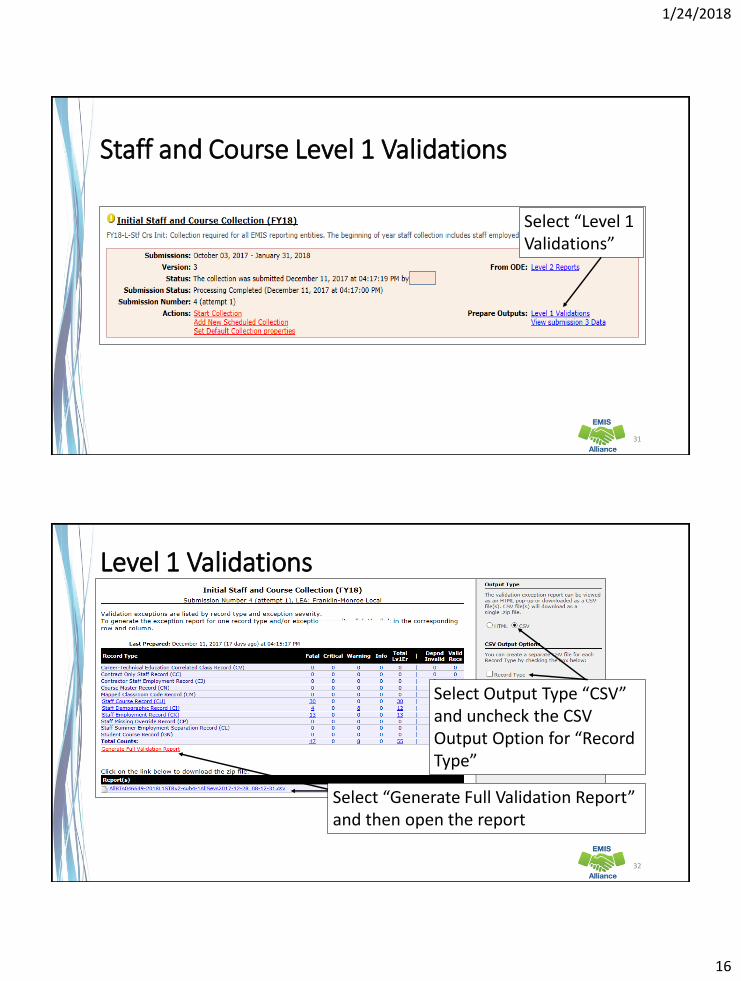
Staff and Course Level 1 Validations
31
Select “Level 1 Validations”
Level 1 Validations
32
Select Output Type “CSV” and uncheck the CSV Output Option for “Record Type”
Select “Generate Full Validation Report” and then open the report
1/24/2018
17
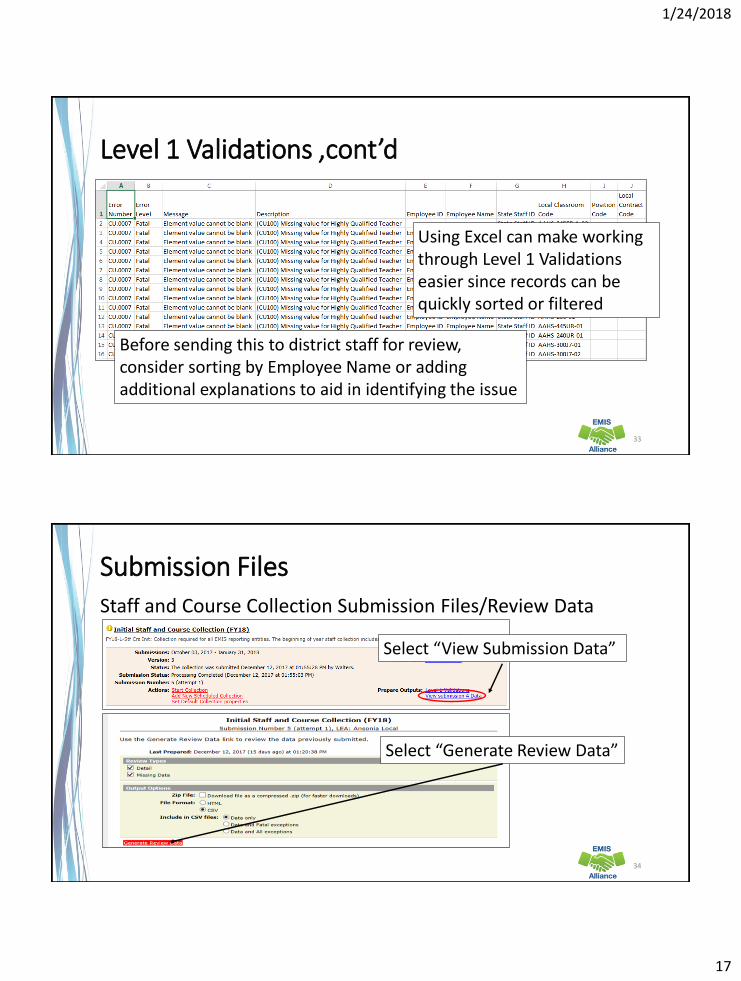
Level 1 Validations ,cont’d
33
Using Excel can make working through Level 1 Validations easier since records can be quickly sorted or filtered
Before sending this to district staff for review, consider sorting by Employee Name or adding additional explanations to aid in identifying the issue
Submission Files
Staff and Course Collection Submission Files/Review Data
34
Select “View Submission Data”
Select “Generate Review Data”
1/24/2018
18
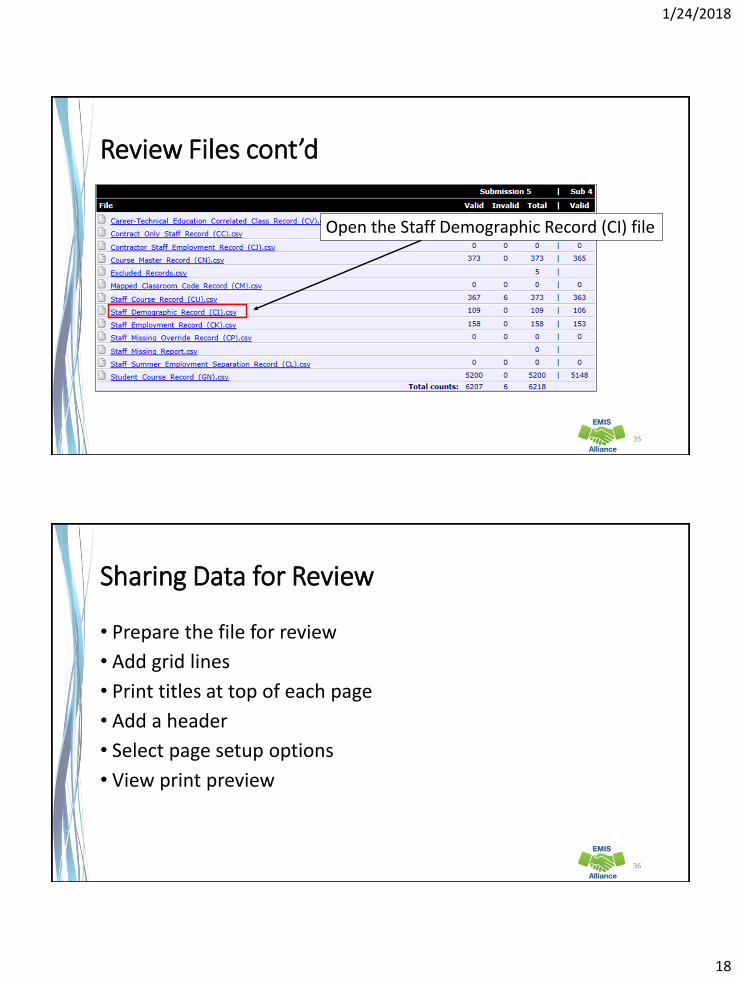
Review Files cont’d
35
Open the Staff Demographic Record (CI) file
Sharing Data for Review
• Prepare the file for review
• Add grid lines
• Print titles at top of each page
• Add a header
• Select page setup options
• View print preview
36

1/24/2018
19
Prepare the Staff Demographic File (CI)
Demographic file contains one line per staff member• Prepare your spreadsheet to be user friendly
37
Header data is wrapped, top row is frozen, all data is viewable
Select Cells with Data
38
Select Cell A1 and then hold CRTL and Shift keys down and then Right Arrow and the Down Arrow. This will select the rows and columns on your spreadsheet that contain data.
1/24/2018
20
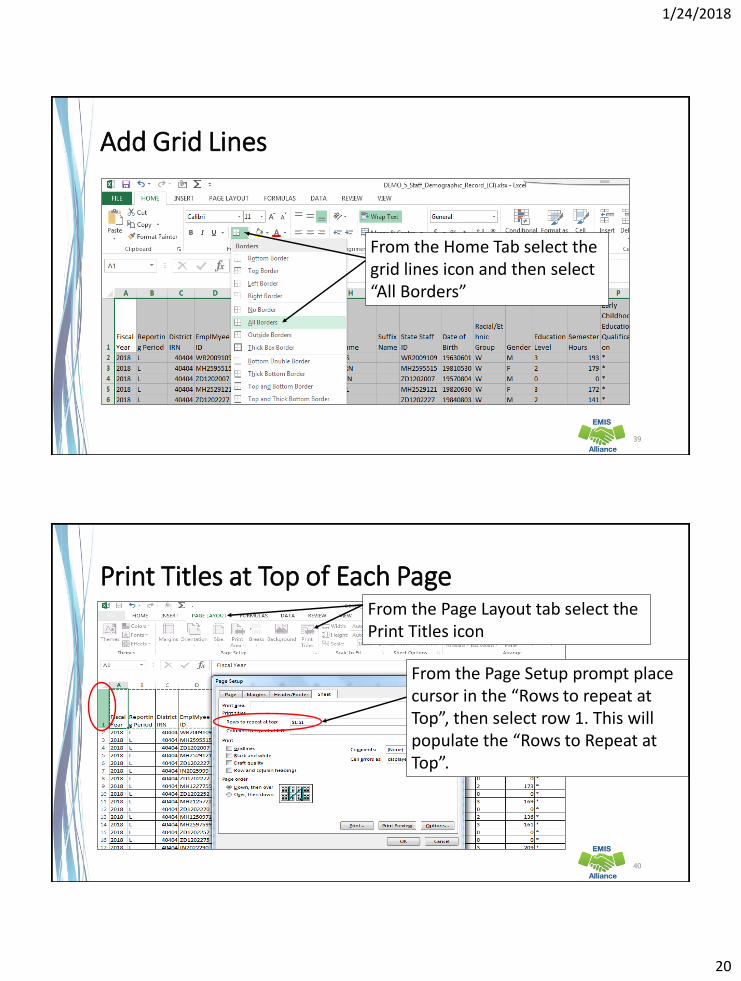
Add Grid Lines
39
From the Home Tab select the grid lines icon and then select “All Borders”
Print Titles at Top of Each Page
40
From the Page Layout tab select the Print Titles icon
From the Page Setup prompt place cursor in the “Rows to repeat at Top”, then select row 1. This will populate the “Rows to Repeat at Top”.
1/24/2018
21
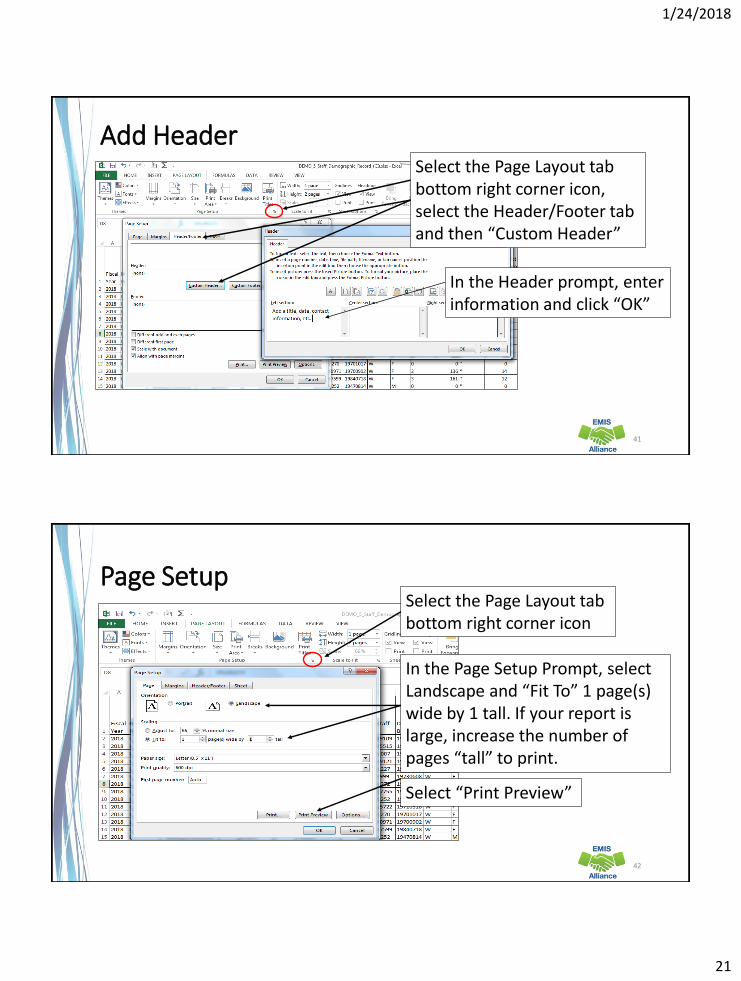
Add Header
41
Select the Page Layout tab bottom right corner icon, select the Header/Footer tab and then “Custom Header”
In the Header prompt, enter information and click “OK”
Page Setup
42
Select the Page Layout tab bottom right corner icon
In the Page Setup Prompt, select Landscape and “Fit To” 1 page(s) wide by 1 tall. If your report is large, increase the number ofpages “tall” to print.
Select “Print Preview”
1/24/2018
22
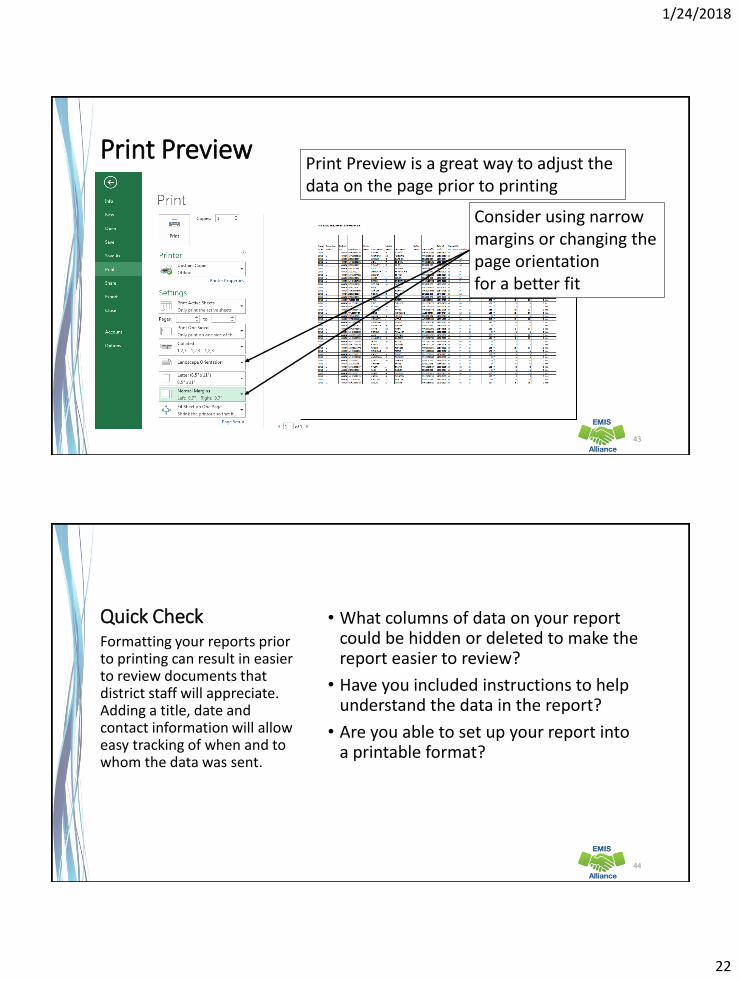
Print Preview
43
Print Preview is a great way to adjust the data on the page prior to printing
Consider using narrow margins or changing the page orientation for a better fit
Quick Check • What columns of data on your report could be hidden or deleted to make the report easier to review?
• Have you included instructions to help understand the data in the report?
• Are you able to set up your report into a printable format?
Formatting your reports prior to printing can result in easier to review documents that district staff will appreciate. Adding a title, date and contact information will allow easy tracking of when and to whom the data was sent.
44
1/24/2018
23
FTE Detail Report Subtotaling
45
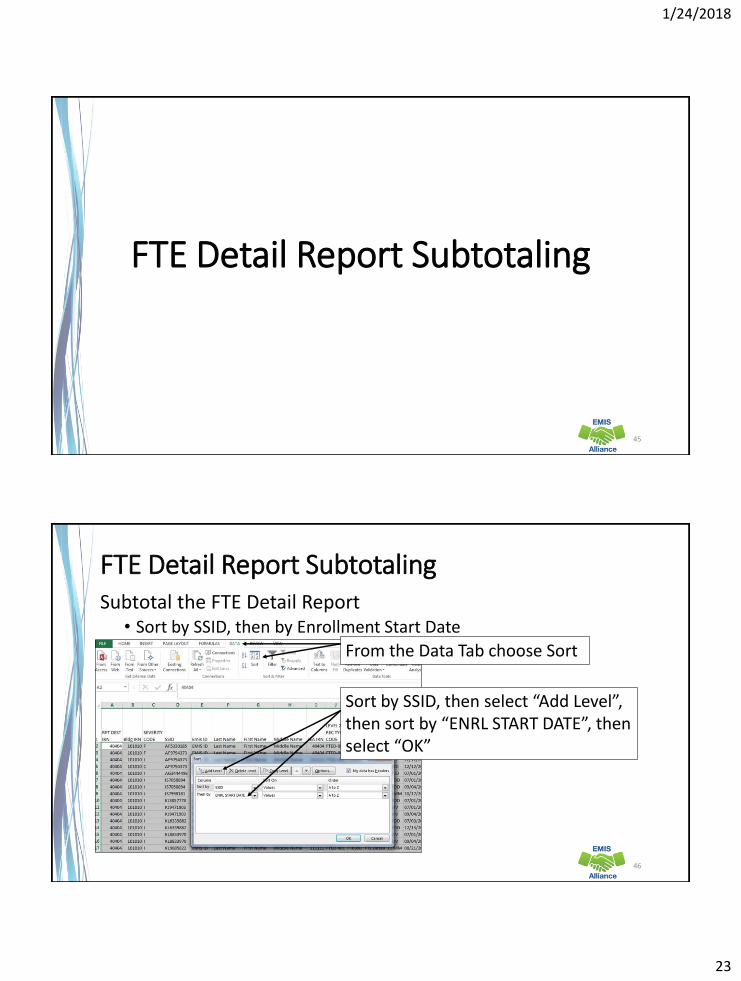
FTE Detail Report Subtotaling Subtotal the FTE Detail Report
• Sort by SSID, then by Enrollment Start Date
46
From the Data Tab choose Sort
Sort by SSID, then select “Add Level”, then sort by “ENRL START DATE”, then select “OK”
1/24/2018
24
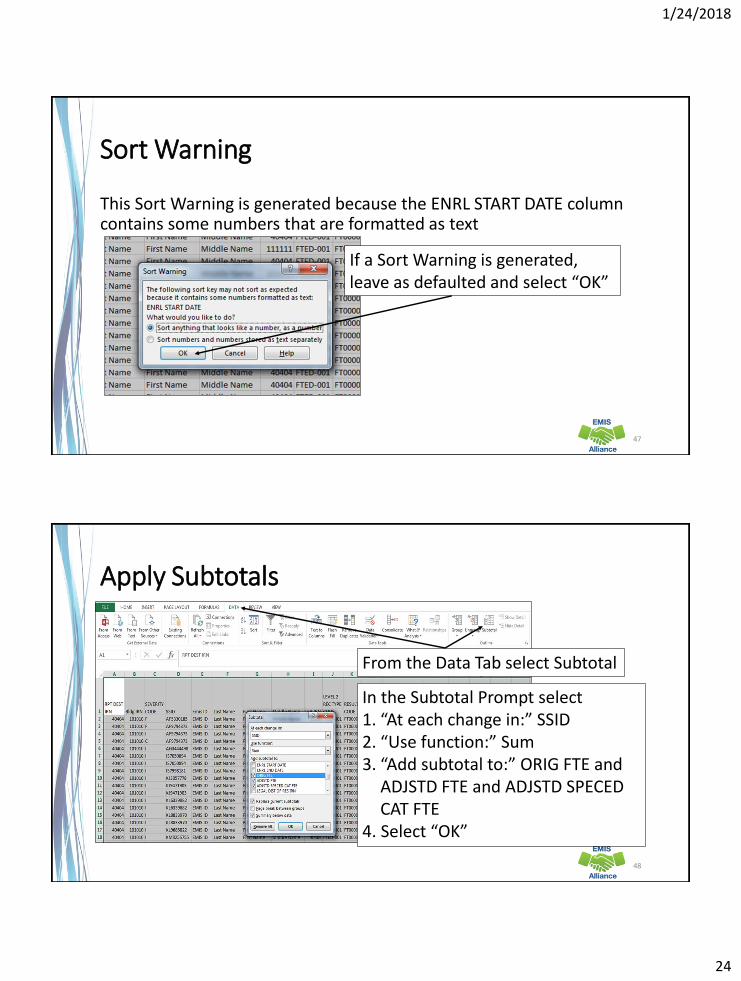
Sort Warning
This Sort Warning is generated because the ENRL START DATE column contains some numbers that are formatted as text
47
If a Sort Warning is generated, leave as defaulted and select “OK”
Apply Subtotals
48
From the Data Tab select Subtotal
In the Subtotal Prompt select1. “At each change in:” SSID2. “Use function:” Sum3. “Add subtotal to:” ORIG FTE and
ADJSTD FTE and ADJSTD SPECED CAT FTE
4. Select “OK”
1/24/2018
25
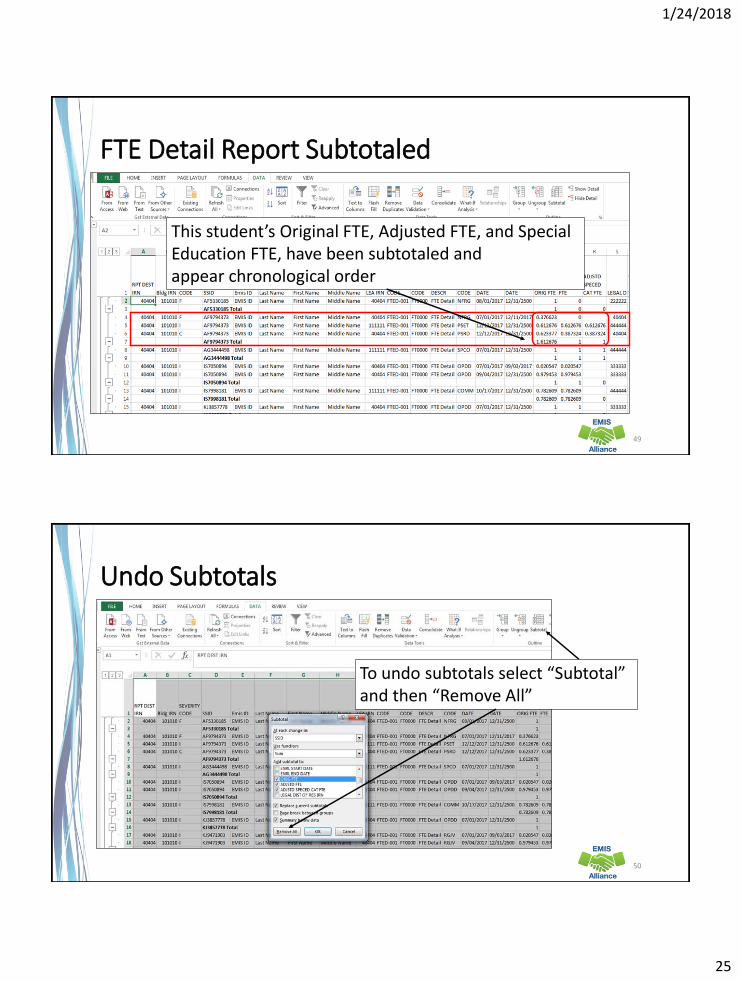
FTE Detail Report Subtotaled
49
This student’s Original FTE, Adjusted FTE, and Special Education FTE, have been subtotaled and appear chronological order
Undo Subtotals
50
To undo subtotals select “Subtotal” and then “Remove All”
1/24/2018
26
Quick Check • Are there students with Adjusted or Special Education FTEs that are less than the Original FTE?
• Are you using this report with your FTE Adjustment report to identify reasons for the adjustments?
• Are you saving your reports between reviews?
Subtotaling the FTE Detail Report provides a format for easier analysis of the data. Since many students have multiple FTEs calculated, using Excel to sum by student will allow the detail to be available while providing subtotals below each student.
51
FTE Detail Report PivotTable
52
1/24/2018
27
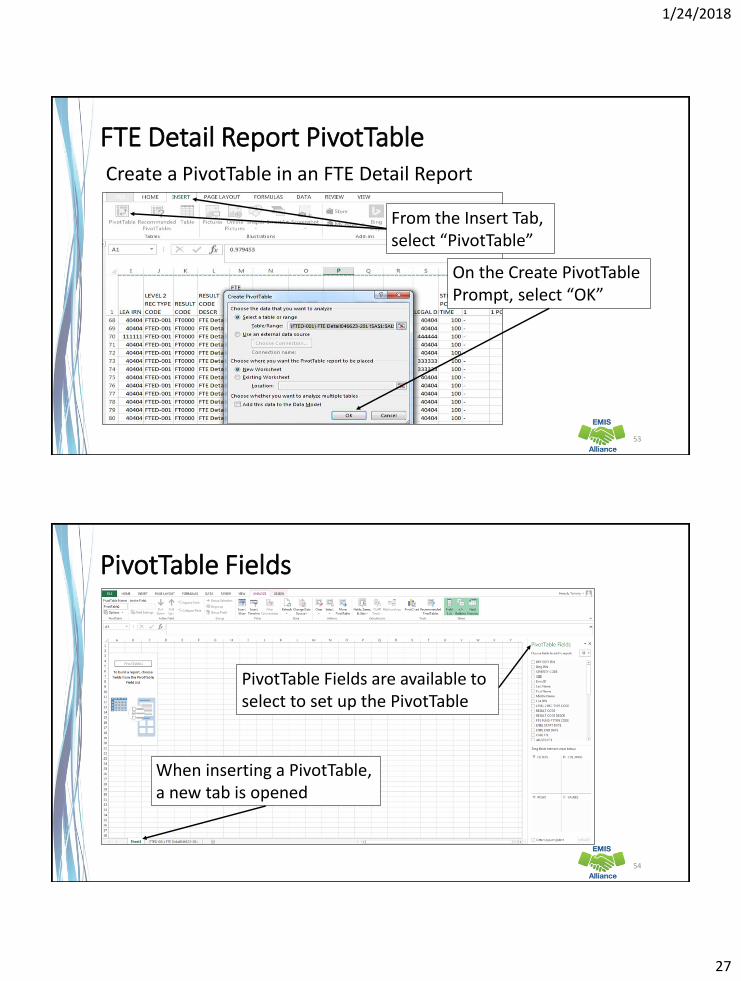
FTE Detail Report PivotTableCreate a PivotTable in an FTE Detail Report
53
From the Insert Tab, select “PivotTable”
On the Create PivotTable Prompt, select “OK”
PivotTable Fields
54
When inserting a PivotTable, a new tab is opened
PivotTable Fields are available to select to set up the PivotTable
1/24/2018
28
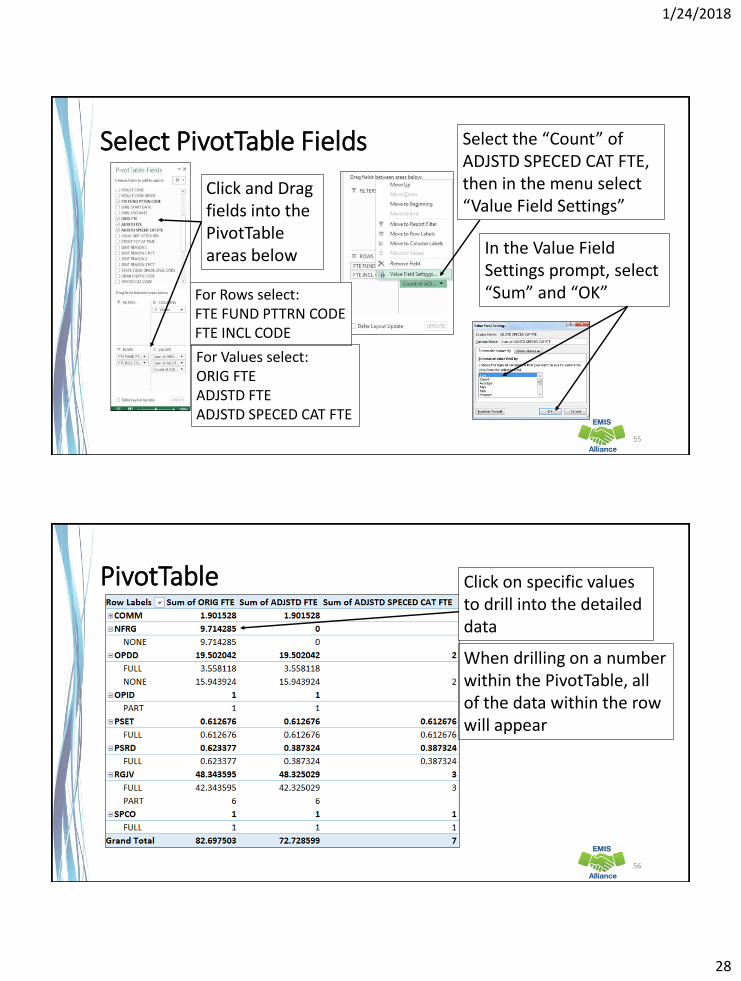
Select PivotTable Fields
55
Click and Drag fields into the PivotTable areas below
Select the “Count” of ADJSTD SPECED CAT FTE, then in the menu select “Value Field Settings”
In the Value Field Settings prompt, select “Sum” and “OK”For Rows select:
FTE FUND PTTRN CODEFTE INCL CODE
For Values select:ORIG FTEADJSTD FTEADJSTD SPECED CAT FTE
PivotTable
56
Click on specific values to drill into the detailed data
When drilling on a number within the PivotTable, all of the data within the row will appear
1/24/2018
29
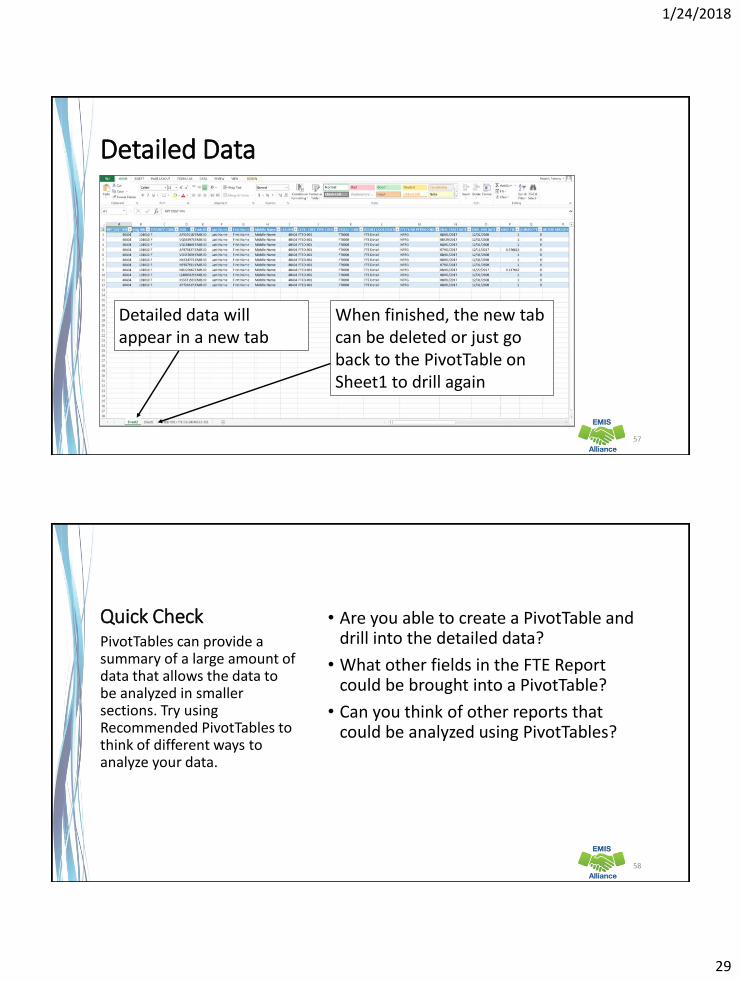
Detailed Data
57
Detailed data will appear in a new tab
When finished, the new tab can be deleted or just go back to the PivotTable on Sheet1 to drill again
Quick Check • Are you able to create a PivotTable and drill into the detailed data?
• What other fields in the FTE Report could be brought into a PivotTable?
• Can you think of other reports that could be analyzed using PivotTables?
PivotTables can provide a summary of a large amount of data that allows the data to be analyzed in smaller sections. Try using Recommended PivotTables to think of different ways to analyze your data.
58
1/24/2018
30
Summary
• Basic Excel techniques can be very useful when troubleshooting • EMIS data in the Student Information System
• EMIS reports
• preview/review files
• These techniques should be part of your everyday practices
59
Resources
• Microsoft Excel Help within Excel “?” Articles and Videos
• Google it
• Microsoft Excel Classes
• Your ITC
60

1/24/2018
31
61
Questions?