Embed Size (px)
Citation preview
Using Financial Modeling Techniques to Value and
Structure Mergers & Acquisitions
1

Learning Objectives
• Primary learning objective: Provide students with a basic understanding of how to use financial models to value and structure M&As
• Secondary learning objectives: Provide students with a knowledge of– How to estimate the value of synergy;– Commonly used relationships in building M&A
valuation models; and– How to use models to estimate the purchase price
range, initial offer price for a target firm, and to evaluate the feasibility of financing the proposed offer price. Sample Excel Model posted to website.
2

Education Links for Modeling
• http://www.financialtrainingassociates.com/merger-acquisition-course-training/modelling/
• http://www.euromoneytraining.com/Course/2256/Financial-Training-Asia/CourseInfo.html
• http://www.wallst-training.com/topics.html
3

M&A Model Building Process
• Step 1: Value acquirer and target as standalone
firms• Step 2: Value acquirer and target firms including
synergy• Step 3: Determine initial offer price for target
firm• Step 4: Determine the combined firms’ ability to
finance the transaction4

Step 1: Value Acquirer & Target as Standalone Firms
• Use the 5-forces model to understand determinants of profits and cash flow, SWOT– Customers (size, number, price sensitivity)– Current competitors (market share, differentiation)– Potential entrants (entry barriers, relative costs)– Substitutes (availability, prices, switching costs) Drug– Suppliers (size, number, uniqueness)
relative to industry participants.• Normalize 3-5 years of historical financial information• Project normalized cash flow based on expected
market growth and changes in profits/cash flow determinants.
5

Applying the 5-Forces Model to Project Acquirer and Target Firm Financial Performance
• How have the following factors affected revenue growth and profit margins in the acquirer and target firms’ industry historically?– Customers (size, number,
price sensitivity)– Current competitors (market
share, differentiation)– Potential entrants (entry
barriers, relative costs)– Substitutes (availability,
prices, switching costs)– Suppliers (size, number,
uniqueness)
• How will these factors change (if at all) to impact future revenue growth and profit margins of these firms?– Customers (size, number,
price sensitivity)– Current competitors (market
share, differentiation)– Potential entrants (entry
barriers, relative costs)– Substitutes (availability,
prices, switching costs)– Suppliers (size, number,
uniqueness)
Key questions:
1. How might changes in the bargaining power of customers and suppliers relative to the acquirer and target firms impact product pricing, costs, and profit margins?
2. How might substitutes and new entrants affect product pricing and profit margins? Issue in pharmaceutical industry. 6

Step 2: Value Acquirer & Target Firms Including Synergy
• Estimate – Sources and destroyers of value– Implementation costs incurred to realize
synergy – Review F/S Extraordinary Items• Consolidate acquirer and target projected
financials including the effects of synergy• Estimate net synergy (consolidated firms less
values of target and acquirer)
7

What is Synergy?
8

What is Synergy?
9

Illustrating Economies of ScopePre-Merger:• Firm A’s data processing
center supports 5 manufacturing facilities
• Firm B’s data processing center supports 3 manufacturing facilities
Post-Merger:• Firm A’s and Firm B’s data
processing centers are combined into a single operation to support all 8 manufacturing facilities
• By combining the centers, Firm A is able to achieve the following annual pre-tax savings:– Direct labor costs = $840,000.– Telecommunication expenses
= $275,000– Leased space expenses =
$675,000– General & administrative
expenses = $230,000
Key Point: Cost savings due to expanding the scope of a single center to support all 8 manufacturing facilities of the combined firms.
10

Illustrating Economies of ScalePeriod 1: Firm A (Pre-merger)
Assumptions:
• Price = $4 per unit of output sold
• Variable costs = $2.75 per unit of output
• Fixed costs = $1,000,000
• Firm A is producing 1,000,000 units of output per year
• Firm A is producing at 50% of plant capacity
Profit = price x quantity – variable costs
– fixed costs
= $4 x 1,000,000 - $2.75 x 1,000,000
- $1,000,000
= $250,000
Profit margin = $250,000 / $4,000,000 = 6.25%
Period 2: Firm A (Post-merger)
Assumptions:
• Firm A acquires Firm B which is producing 500,000 units of the same product per year
• Firm A closes Firm B’s plant and transfers production to Firm A’s plant
• Price = $4 per unit of output sold
• Variable costs = $2.75 per unit of output
• Fixed costs = $1,000,000
Profit = price x quantity – variable costs
– fixed costs
= $4 x 1,500,000 - $2.75 x 1,500,000
- $1,000,000
= $6,000,000 - $4,125,000 - $1,000,000
= $875,000
Profit margin = $875,000 / $6,000,000 = 14.58%
Key Point: Profit margin improvement due to spreading fixed costs over more units of output.
11

Adjusting Combined Acquirer/Target Company Projections For Estimated Synergy - Classic
Year 1 Year 2 Year 3 Year 4 Year 5
Net Sales1 $200 $220 $242 $266 $293
Cost of sales2 $160 $176 $194 $213 $234
Anticipated Cost Savings
Direct labor $2 $4 $6 $8 $8
Indirect labor $1 $2 $4 $4 $4
Purchased materials $2 $3 $5 $5 $5
Selling expenses $1 $3 $5 $5 $5
Total $6 $12 $20 $22 $22
Cost of sales (incl. synergy) $154 $164 $174 $191 $212
Cost of sales/Net sales 77.0% 74.6% 71.9% 71.8% 72.4%
1Combined company net sales projected to grow 10% annually during forecast period.2Cost of sales before synergy assumed to be 80% of net sales during forecast period.
12

Discussion Questions
1. How would you adjust the combined firm’s income statement for cost savings due to improved worker productivity? (Hint: Determine the line item most directly affected by the improvement in productivity.)
2. How would you adjust the combined firm’s income statement for additional revenue generated from cross-selling (i.e., Acquirer selling its products to the target’s customers and vice versa)?
3. How would you reflect the expenses incurred in implementing the worker productivity improvement and cross-selling programs on the combined firm’s income statement?
13
Step 3: Determine Initial Offer Price for Target Firm - Internal
• Estimate minimum and maximum purchase price range
• Determine amount of synergy willing to share with target shareholders = “ɑ”
• Determine appropriate composition of offer price
14

Calculating Initial Offer Price (PVIOP)
1. LOW PVMIN = PVT or PVMV, whichever is greater for a stock purchase (liquidation value of net acquired assets for an asset purchase)
2. HIGH PVMAX = PVMIN + PVNS, where PVNS = PVSOV – PVDOV
3. PVIOP = PVMIN + αPVNS, where 0 ≤ α ≤ 1
Offer price range = (PVT or MVT) < PVIOP < (PVT or MVT) + PVNS
Where PVMIN = PV minimum purchase price PVT = PV standalone value of target firm PVMV = Market value target firm PVMAX = PV maximum purchase price PVNS = PV of net synergy PVSOV = PV of sources of value PVDOV = PV of destroyers of value α = Portion of net synergy shared with target company shareholders
Offer price per share = PVIOP / Target’s fully diluted shares outstanding1
How is “α” determined? = Estimate or Negotiate
1Fully diluted shares outstanding includes basic shares plus shares resulting from exercising “in the money” options and conversion of convertible debt and preferred stock.
15
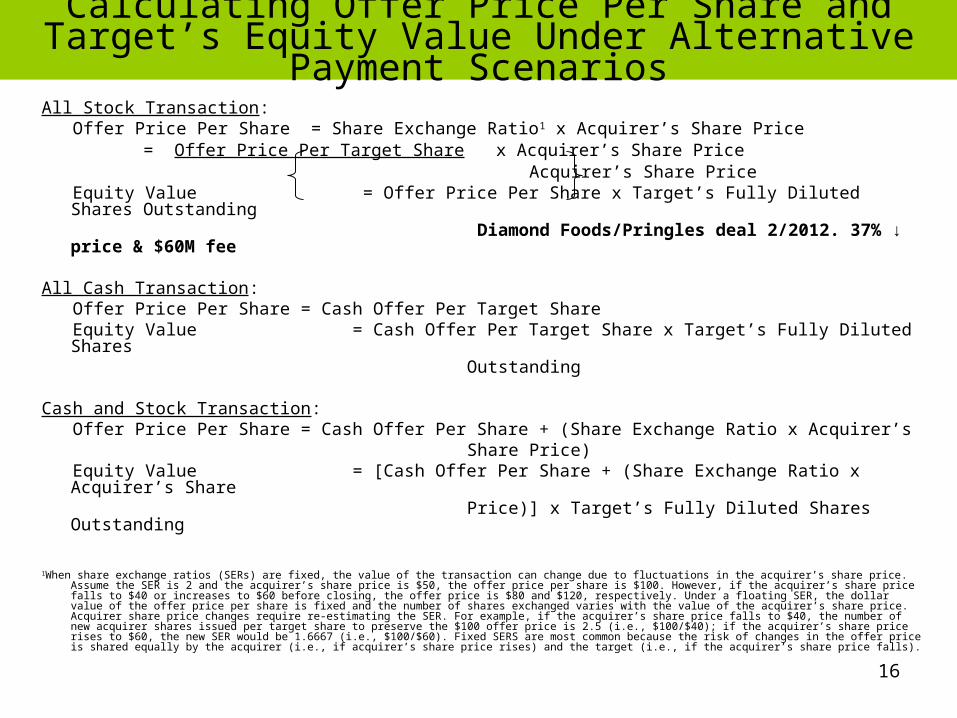
Calculating Offer Price Per Share and Target’s Equity Value Under Alternative Payment Scenarios
All Stock Transaction: Offer Price Per Share = Share Exchange Ratio1 x Acquirer’s Share Price
= Offer Price Per Target Share x Acquirer’s Share Price Acquirer’s Share Price Equity Value = Offer Price Per Share x Target’s Fully Diluted Shares Outstanding Diamond Foods/Pringles deal 2/2012. 37% ↓ price & $60M fee
All Cash Transaction: Offer Price Per Share = Cash Offer Per Target Share Equity Value = Cash Offer Per Target Share x Target’s Fully Diluted Shares Outstanding
Cash and Stock Transaction: Offer Price Per Share = Cash Offer Per Share + (Share Exchange Ratio x Acquirer’s Share Price) Equity Value = [Cash Offer Per Share + (Share Exchange Ratio x Acquirer’s Share Price)] x Target’s Fully Diluted Shares Outstanding
1When share exchange ratios (SERs) are fixed, the value of the transaction can change due to fluctuations in the acquirer’s share price. Assume the SER is 2 and the acquirer’s share price is $50, the offer price per share is $100. However, if the acquirer’s share price falls to $40 or increases to $60 before closing, the offer price is $80 and $120, respectively. Under a floating SER, the dollar value of the offer price per share is fixed and the number of shares exchanged varies with the value of the acquirer’s share price. Acquirer share price changes require re-estimating the SER. For example, if the acquirer’s share price falls to $40, the number of new acquirer shares issued per target share to preserve the $100 offer price is 2.5 (i.e., $100/$40); if the acquirer’s share price rises to $60, the new SER would be 1.6667 (i.e., $100/$60). Fixed SERS are most common because the risk of changes in the offer price is shared equally by the acquirer (i.e., if acquirer’s share price rises) and the target (i.e., if the acquirer’s share price falls).
16

Calculating the Target’s Fully Diluted Shares Outstandingand Adjusting Equity Value (If Converted Method)
Assumptions about Target Comment
Basic Shares Outstanding 2,000,000
In-the-Money Options1 150,000 Exercise Price = $15/share
Convertible Debt (Face value = $1000; convertible into 50 shares of common stock)
Preferred Stock (Par value = $20; convertible into one share of common at $24 per share
$10,000,000
$5,000,000
Implied conversion price = $20 (i.e., $1000/50)
Preferred shares outstanding = $5,000,000 / $20 = 250,000
Offer Price Per Share $30 Purchase price offered for each target share outstanding
Total Shares Outstanding2 = 2,000,000 + 150,000 + ($10,000,000/$1000) x 50 + 250,000 = 2,000,000 + 150,000 + 500,000 +250,000 = 2,900,000
Adjusted Target Equity Value3 = 2,900,000 x $30 -150,000 x $15 = $87,000,000 - $2,250,000 = $84,750,0001An option whose exercise price is below the market value of the firm’s share price.2Total shares Outstanding = Issued Shares + Shares from “in the money” options and convertible securities.3Purchase price adjusted for new acquirer shares issued for convertible shares or debt less cash received from “in the money” option holders.
17

Step 4: Determine Combined Firms’ Ability to Finance Transaction
• Estimate impact of alternative financing structures (e.g., debt/equity ratios)
• Select financing structure that– Meets acquirer’s required
financial returns and desired financial structure;
– Meets target’s primary financial and non-financial needs;
– Does not raise borrowing costs; and
– Is supportable by the combined firms’ operating cash flows.
18

Determining Dilution/Accretion by Calculating Post-Merger Earnings Per Share (EPS)
Will the transaction be transaction be dilutive or accretive to the acquirer’s EPS?
Acquirer is considering the acquisition of Target in which Target would receive $84.30 for each share of its common stock. Acquirer wishes to assess the impact of alternative forms of payment on post-merger EPS. Acquirer believes that any synergies in the first year following closing would be fully offset by costs incurred in combining the two businesses. Selected data are presented as follows:
Pre-Merger Data
Acquirer Target
Net Earnings
$281,500,000 $62,500,000
Shares Outstanding
112,000,000 18,750,000
EPS $2.51 $3.33
Market Price Per Share
$56.25 $62.50
19
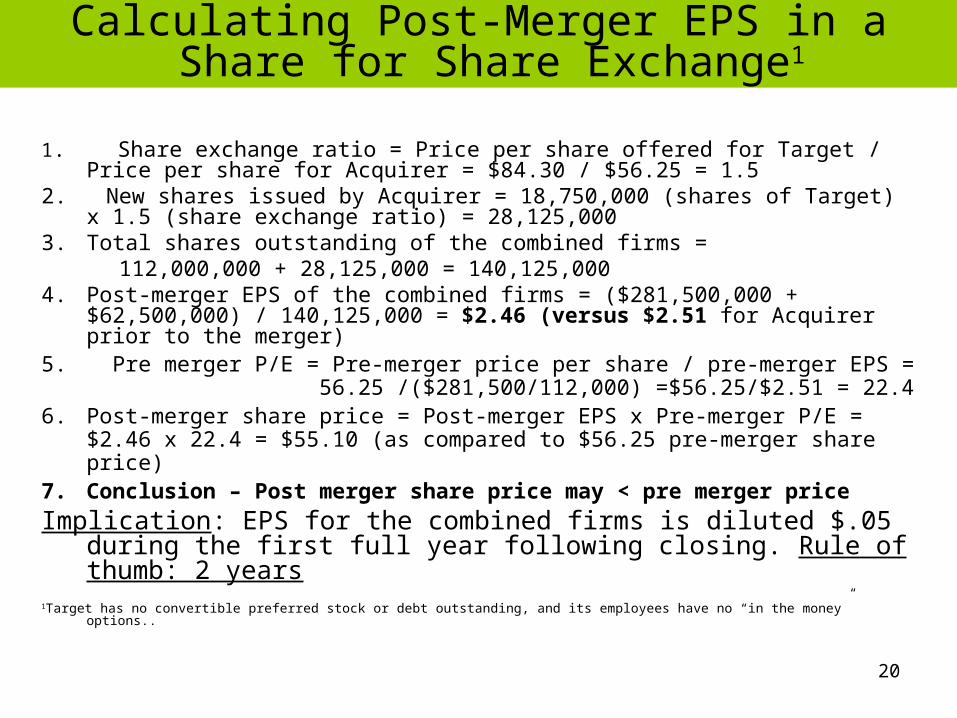
Calculating Post-Merger EPS in a Share for Share Exchange1
1. Share exchange ratio = Price per share offered for Target / Price per share for Acquirer = $84.30 / $56.25 = 1.5
2. New shares issued by Acquirer = 18,750,000 (shares of Target) x 1.5 (share exchange ratio) = 28,125,000
3. Total shares outstanding of the combined firms = 112,000,000 + 28,125,000 = 140,125,0004. Post-merger EPS of the combined firms = ($281,500,000 +
$62,500,000) / 140,125,000 = $2.46 (versus $2.51 for Acquirer prior to the merger)
5. Pre merger P/E = Pre-merger price per share / pre-merger EPS = 56.25 /($281,500/112,000) =$56.25/$2.51 = 22.4
6. Post-merger share price = Post-merger EPS x Pre-merger P/E = $2.46 x 22.4 = $55.10 (as compared to $56.25 pre-merger share price)
7. Conclusion – Post merger share price may < pre merger price
Implication: EPS for the combined firms is diluted $.05 during the first full year following closing. Rule of thumb: 2 years
1Target has no convertible preferred stock or debt outstanding, and its employees have no “in the money” options..
20

Calculating Post-Merger EPS in an All Cash Transaction
1. Purchase price = $84.30 x 18,750,000 = $1,580,625,0002. Assume Acquirer borrowed the entire purchase price at
8% interest with the principal repaid in 10 years3. Annual interest expense = .08 x $1,580,625,000 =
$126,450,0004. Post merger EPS of the combined firms = ($281,500,000
+ $62,500,000 - $126,450,000 (1 - .4)) / 112,000,000 = $2.39 (versus $2.51 for Acquirer before the merger)
Implication: EPS of the combined firms is diluted by $.12 during the first full year following closing due to the annual interest expense. After “tax shelter” interest.
1Assumes the firm’s marginal tax rate is 40 percent.
21

Calculating Post-Merger EPS in a Cash & Stock Transaction
Assume purchase price equals 1 share of Acquirer stock (i.e., $56.25) and $28.05 (i.e., $84.30 offer price - $56.25) in cash and that the cash portion of the purchase price is financed at 8% annual interest with the principal due in 10 years1
1. New shares issued by Acquirer = 18,750,000 (shares of Target)2. Total shares outstanding of the combined firms = 112,000,000 + 18,750,000 = 130,750,0003. Post-merger EPS of the combined firms = ($281,500,000 + $62,500,000 - $42,075,000 (1 - .4)) /
130,750,000 = $2.44 (versus $2.51 for Acquirer before the merger)
Implication: EPS of the combined firms is diluted by $.07 during the first full year following closing. Therefore, under these assumptions, EPS dilution is smallest in an all stock deal.
1Annual interest is computed as follows: .08 x $28.05 x 18,750,000 (Target shares) = $42,075,000
22

Using M&A Model Template1
• Model worksheet layout: Assumptions (top panel); historical period data (lower left panel); forecast period data (lower right panel).
• Displaying Microsoft Excel formula results on a worksheet:– On Tools menu, click Options, and then click the View Tab.– To display formulas in cells, select the formulas check box; to
display the formula’s results, clear the check box.• In place of existing historical data, fill in the data in cells not
containing formulas. Do not delete existing formulas in “historical period” unless you wish to customize the model.
• Do not delete or change formulas in the “forecast period” cells unless you wish to customize the model. To replace existing data, change the forecast assumptions at the top of the spreadsheet.
1 See Chapter 9 Readings on course website.
23

Model Balance Sheet Adjustment Mechanism Methodology
• Separate current assets into operating and non-operating assets.
• Operating assets include minimum operating cash balances and other operating assets (e.g., receivables, inventories, and assets such as prepaid items).1
• Current non-operating assets are investments (i.e., cash generated in excess of minimum operating balances invested in short-term marketable securities).
• The firm issues new debt whenever cash outflows exceed cash inflows.
• The firm’s investments increase whenever cash outflows are less than cash inflows.
1Minimum cash balances determined by analyzing the firm’s cash conversion cycle or by computing the average ratio of cash balances to net revenue over some prior period times current net revenue..
24

Model Balance Sheet Adjustment Mechanism Illustration
Assets Liabilities
Current Operating Assets
Cash Needed for Operations (C)
Other Current Assets (OCA)
Total Current Operating Assets (TCOA)
Short-Term (Non-Oper.) Investments (I)
Net Fixed Assets (NFA)
Other Assets (OA)
Total Assets (TA)
Current Liabilities (CL)
Other Liabilities (OL)
Long-Term Debt (LTD)
Existing Debt (ED)
New Debt (ND)
Total Liabilities (TL)
Shareholders’ Equity (SE)
Cash Outflows Exceed Cash Inflows: If (TA – I)>(TL – ND) + SE, ΔND > 0 (i.e., the firm must borrow), otherwise ΔND = 0
Cash Outflows Less Than Cash Inflows: If (TA – I) < (TL – ND) + SE, ΔI > 0 (i.e., the firm’s non-operating cash increases), otherwise ΔI = 0
Cash Outflows Equal Cash Inflows: If (TA – I) = (TL – ND) + SE = 0, ΔND=ΔI= 0
25

Estimating Interest Expense
IEXP = ((DEOY + DBOY)/2) x i, where DEOY = DBOY - DPRP
where
DEOY = End of year debt balance
DBOY = Beginning of year debt balance
DPRP = Annual principal repayment
IEXP = Dollar value of annual interest expense
i = Weighted average interest rate
26

Hints on Using Financial Models
• Ensure Excel’s Iteration Command is “on” to accommodate “circular references” inherent in financial models.– For example,
• To turn on the iteration command, – On the menu bar, click on Tools >>> Options >>> Calculations– Select Automatic and Iteration– Set maximum number of iterations to 100 and the maximum
amount of change to .01.
Cash & Investments x Interest Rate Affects Net Income
Net income Affects Cash & Investments
27