Embed Size (px)
Citation preview

The Qualitative Report The Qualitative Report
Volume 26 Number 6 Special Section 21
6-22-2021
Using Framework Analysis in Applied Qualitative Research Using Framework Analysis in Applied Qualitative Research
Laurie J. Goldsmith GoldQual Consulting and Simon Fraser University, [email protected]
Follow this and additional works at: https://nsuworks.nova.edu/tqr
Part of the Quantitative, Qualitative, Comparative, and Historical Methodologies Commons, and the
Social Statistics Commons
Recommended APA Citation Recommended APA Citation Goldsmith, L. J. (2021). Using Framework Analysis in Applied Qualitative Research. The Qualitative Report, 26(6), 2061-2076. https://doi.org/10.46743/2160-3715/2021.5011
This Special Section is brought to you for free and open access by the The Qualitative Report at NSUWorks. It has been accepted for inclusion in The Qualitative Report by an authorized administrator of NSUWorks. For more information, please contact [email protected].

Using Framework Analysis in Applied Qualitative Research Using Framework Analysis in Applied Qualitative Research
Abstract Abstract Framework analysis and applied qualitative research can be a perfect match, in large part because framework analysis was developed for the explicit purpose of analyzing qualitative data in applied policy research. Framework analysis is an inherently comparative form of thematic analysis which employs an organized structure of inductively- and deductively-derived themes (i.e., a framework) to conduct cross-sectional analysis using a combination of data description and abstraction. The overall objective of framework analysis is to identify, describe, and interpret key patterns within and across cases of and themes within the phenomenon of interest. This flexible and powerful method of analysis has been applied to a variety of data types and used in a range of ways in applied research. Framework analysis consists of two major components: creating an analytic framework and applying this analytic framework. This paper details the five steps in framework analysis (data familiarization, framework identification, indexing, charting, and mapping and interpretation) through conducting secondary analysis on this special issue’s common dataset. This worked example adds to the existing framework analysis methodology literature both through describing the analysis specifics and through highlighting the importance of multiple considerations of units of analysis. This paper also includes reflection on the myriad reasons that framework analysis is valuable for applied research.
Keywords Keywords analytic framework, applied qualitative research, framework analysis
Creative Commons License Creative Commons License
This work is licensed under a Creative Commons Attribution-Noncommercial-Share Alike 4.0 International License.
This special section is available in The Qualitative Report: https://nsuworks.nova.edu/tqr/vol26/iss6/21

The Qualitative Report 2021 Volume 26, Number 6, 2061-2076
https://doi.org/10.46743/2160-3715/2021.5011
Using Framework Analysis in Applied Qualitative Research
Laurie J. Goldsmith GoldQual Consulting & Faculty of Health Sciences
Simon Fraser University, Burnaby, British Columbia, Canada
Framework analysis and applied qualitative research can be a perfect match, in
large part because framework analysis was developed for the explicit purpose
of analyzing qualitative data in applied policy research. Framework analysis is
an inherently comparative form of thematic analysis which employs an
organized structure of inductively- and deductively-derived themes (i.e., a
framework) to conduct cross-sectional analysis using a combination of data
description and abstraction. The overall objective of framework analysis is to
identify, describe, and interpret key patterns within and across cases of and
themes within the phenomenon of interest. This flexible and powerful method
of analysis has been applied to a variety of data types and used in a range of
ways in applied research. Framework analysis consists of two major
components: creating an analytic framework and applying this analytic
framework. This paper details the five steps in framework analysis (data
familiarization, framework identification, indexing, charting, and mapping and
interpretation) through conducting secondary analysis on this special issue’s
common dataset. This worked example adds to the existing framework analysis
methodology literature both through describing the analysis specifics and
through highlighting the importance of multiple considerations of units of
analysis. This paper also includes reflection on the myriad reasons that
framework analysis is valuable for applied research.
Keywords: analytic framework, applied qualitative research, framework
analysis
Framework analysis and applied qualitative research can be a perfect match, in large
part because framework analysis was developed for the explicit purpose of analyzing
qualitative data in applied policy research. In the 1980s, co-creators Jane Ritchie and Liz
Spencer drew from multiple methods and traditions in qualitative research to develop
“Framework” (capitalization in original), an approach to qualitative data analysis that provides
targeted answers about specific populations and ease of application to policy and practice
(Ritchie & Spencer, 1994). Framework analysis—also known as “the framework approach,”
“the framework technique” and “the framework method”—is an inherently comparative form
of thematic analysis which employs an organized structure of inductively- and deductively-
derived themes (i.e., a framework) to conduct cross-sectional analysis using a combination of
data description and abstraction (Ritchie & Spencer, 1994; Spencer, Ritchie, Ormston, et al.,
2014). The overall objective of framework analysis is to identify, describe, and interpret key
patterns within and across cases of and themes within the phenomenon of interest through being
both grounded in and interpreting from the data (Gale et al., 2013; King & Brooks, 2018;
Ritchie & Spencer, 1994; Spencer, Ritchie, Ormston, et al., 2014).
Framework analysis consists of two major components: creating an analytic framework
and applying this analytic framework. These two major components occur through five steps:

2062 The Qualitative Report 2021
(1) data familiarization; (2) identifying a thematic framework; (3) indexing all study data
against the framework; (4) charting to summarize the indexed data; and (5) mapping and
interpretation of patterns found within the charts (Ritchie & Spencer, 1994). The hallmarks of
framework analysis are found in the last three steps, namely the emphasis on systematic and
comprehensive indexing across all the data (in step 3), the intentional organizing of the indexed
data into a matrix format (in step 4), and comparative analysis within this matrix format to
identify key patterns and abstractions (in step 5).
Framework analysis operates from a pragmatic epistemology and can be applied to a
variety of types of data and be employed for a variety of reasons (King & Brooks, 2018;
Spencer, Ritchie, Ormston, et al., 2014). Data types used in framework analysis have included
in-depth individual interviews, focus groups, observational data, policy documents, online
discussion board posts, photographs, and case studies (Johnston et al., 2014; Mason et al., 2018;
Ritchie & Spencer, 1994; Roberts, 2000; Robertshaw & Cross, 2019; Struik & Baskerville,
2014; Tallentire et al., 2015; Tishelman et al., 2016). Approaches to framework analysis in
applied research have varied from highly deductive analysis of fairly structured data (Pope et
al., 2000) to inductively-oriented theory-building work for knowledge users, such as policy
makers and health care providers (e.g., Goldsmith et al., 2017; Swallow et al., 2011).
There is growing interest in and use of framework analysis as a method of analysis,
particularly in health research (Dixon-Woods, 2011; King & Brooks, 2018; Parkinson et al.,
2016; Pope et al., 2019; Ward et al., 2013). One possible reason for framework analysis’
popularity is its potential for predictability and efficiency. When paired with a targeted research
question and similarly targeted data, framework analysis can be accomplished quickly (Pope
et al., 2000). The explicit steps already built into framework analysis can provide clear structure
for and boundaries on the analysis. Framework analysis’ straightforward and systematic
approach can also allow for easy entry for novice researchers and ease of use in multi-
disciplinary and mixed-methods research teams (Gale et al., 2013; Parkinson et al., 2016; Ward
et al., 2013).
Qualitative researchers use framework analysis for a variety of additional reasons
beyond ease of use. Framework analysis can be successfully used for analyzing large, complex
qualitative datasets, such as can occur in policy research across multiple jurisdictions or
geographies. Framework analysis can be used to methodically describe a population of interest
including the notable variation contained within that population. Researchers can also use
framework analysis to push beyond a thematic description of a phenomenon to the development
of multi-dimensional typologies or theory development. Regardless of the purpose for which
framework analysis is employed, systematic movement through the steps of framework
analysis naturally provides an explicit audit trail (Parkinson et al., 2016; Smith & Firth, 2011).
The methods and results of framework analysis can also be presented in transparent and
accessible ways for a variety of audiences, meeting the dependability and credibility needs of
applied researchers and applied research funders (Ritchie & Spencer, 1994).
While framework analysis can be simple and straightforward under the right conditions,
framework analysis is not inherently simple, quick or undemanding. Researchers undertaking
framework analysis, for instance, must be prepared to work both systematically and
dynamically (Ritchie & Spencer, 1994). As such, it is helpful for novice and early-career
researchers to understand the inner workings of framework analysis projects before taking on
the leadership of a framework analysis project. This understanding can be accomplished
through participating in framework analysis research led by an experienced qualitative
researcher (Gale et al., 2013) and through exposure to detailed examples of research using
framework analysis. This paper is an example of the latter form of support.
As is the case with other papers in this special issue, I analyzed the “postnatal care
referral behavior by Traditional Birth Attendants in Nigeria” dataset (hereafter abbreviated as

Laurie J. Goldsmith 2063
“the TBA dataset”; Chukwuma, Chinyere, et al., 2017). The TBA dataset consists of three
focus group transcripts documenting the perspectives of traditional birth attendants, hospital-
based health care providers, and women who delivered their babies using traditional birth
attendants (hereafter referred to as TBAs, formal health care providers, and TBA clients,
respectively). These focus groups explored group members’ attitudes around postnatal care and
the role of and relationships between TBAs and formal health care providers in prenatal care,
delivery, and postnatal care. Below I demonstrate the five steps in framework analysis through
working through the data from these three focus groups. This demonstration will include
showing how the three groups in the common dataset can be compared and contrasted in
framework analysis’ final step.
Undertaking Framework Analysis
Step 1: Data Familiarization
As the first step in the analysis, data familiarization provides the researcher with an
initial, purposeful understanding of the data. Through immersion in the data and making notes
about key ideas, the researcher begins to understand major themes in the data. Items that could
be major themes include topics or issues that relate to the research question(s) and recur across
the data. The data familiarization step continues until the researcher feels they have arrived at
a reasonable initial understanding of the data, including the breadth of variation within the data
(Spencer, Ritchie, O’Connor, et al., 2014).
If the research dataset is small—such as in this special issue’s shared dataset of three
focus groups—it is possible for the data familiarization step to include all study data. It is more
often, however, that the dataset volume or study timelines require purposeful sampling from
the study dataset for the data familiarization step (Ritchie & Spencer, 1994). (“Purposeful
sampling” in the data familiarization step is not in reference to the sampling strategy employed
in primary data collection but rather refers to choosing from among the already collected data,
regardless of the sampling strategy used to collect the initial data.) Had the TBA dataset
consisted of multiple focus groups with each stakeholder group, for example, the data
familiarization step might be accomplished through immersion with the richest focus group
from each stakeholder group.
To conduct the data familiarization step with the TBA dataset, I first reviewed all three
focus group transcripts looking for key ideas associated with postnatal care referral behavior
by TBAs—the stated focus of the original research (Chukwuma, Chinyere, et al., 2017;
Chukwuma, Mbachu, et al., 2017). I did not identify many key themes on this topic for large
portions of existing data as much of the focus group discussions in all three stakeholder groups
were about other aspects of the birth process (e.g., prenatal care and delivery, use of health
centres and hospitals, comparisons between TBAs and formal health care providers). In other
words, my first review of the data suggested that the focus groups contained more information
than multiple stakeholder perspectives on postnatal care referral behaviors of TBAs. I then
reset my expectations for the data and conducted a second data review simply looking for key
ideas around the experience of the birth process, the use of various types of providers for the
birth process, and how these various types of providers do and do not work together.
Coding can be a part of the data familiarization process, but it is not required. Some
researchers like to immediately start working with preliminary codes linked to data at this early
stage, even if they are later deleted or heavily reworked. Other researchers prefer to take notes
about their thoughts about and understanding of the data without explicitly linking these
thoughts to portions of the data. Understanding major themes in the data—the desired outcome
of the data familiarization stage—is not dependent on coding at this stage. For the TBA dataset,

2064 The Qualitative Report 2021
I accomplished data familiarization through making some notes by hand in the margins of a
printed version of the focus group transcripts and in an overall memo about what I was seeing
in the data. Key themes from the data familiarization step are shown in Table 1. This table also
include sample associated text by stakeholder group for a few of key themes to help the reader
understand the process.
Table 1
Data Familiarization (Step 1) in the TBA Dataset: Key themes and sample associated text for
a few key themes by stakeholder group for understanding the work and value of TBAs and
formal health care providers in the birth process
Key Themes TBAs Formal health care
providers
TBA clients
Barriers to care
during the birth
process
“The people that
usually go to the TBAs
are the indigent people,
or the people who have
tried the medications
from the health facility
and they are still not
fine, then probably they
were asked to try the
medication of the
TBA.”
“Sometimes, they do
not go [to the health
centre] because of
financial constraints. In
that case, you seek for
means to help her to go
to the health center.”
“[Women who have
given birth] also have
the right to go for
postnatal care at the
TBA homes where they
put to bed [i.e., gave
birth], because some of
them actually go to the
TBAs to deliver
because they do not
have the money, so
telling the person to pay
transport to go to the
health facility, the
person may not accept
with the excuse of the
health facility
collecting money from
her.”
“Some people live very
far from the health
facility, and not
everybody is mobile.
Not having means of
mobility can also make
the woman not to go for
postnatal care coupled
with unavailability of
money to transport
themselves to the
place.”
Role of TBA in
prenatal care
Role of TBA
during birth
Role of TBA
during postnatal
care
Problems with
TBA care
“Some of them here
[other TBAs] saying
that they do refer to the
health center do not
actually do that. The
woman will be dying in
pains and they will still
insist on trying
different concoction on
her till the situation is
irredeemable before she
“There was a woman
that gave birth at the
TBA and she started
having issues, but by
the time they could
bring her here, she has
died.”
“The TBA used the
same tools she used for
the HIV positive
“A woman might have
bleeding after delivery
at a TBA's, and they
don't have injections to
give the woman to stop
and before they will call
the doctor to come and
do that, the woman's
problem will intensify.
So it is better to deliver
in the hospital.”

Laurie J. Goldsmith 2065
will send her to the
health facility.”
mother to deliver the
other woman, and the
baby contaminated it
from there.”
Problems with
formal health care
provider care
[no relevant text] [no relevant text] “The reason while most
women do not like
going to the hospital is
that a health worker
there can even walk
pass you even while
you are there shouting
in pains.”
“The TBAs do not give
the women those
unnecessary tear that
the health workers
usually give to the
women in the hospital."
Current working
relationship
between TBAs and
formal health care
providers
Recommendations
for future working
relationship
between TBAs and
formal health care
providers
Step 2: Framework Identification
This second step moves the analysis from concrete descriptions of themes in the data
to the identification of more abstract concepts, with the objective of providing a framework, or
a structure for the analysis and the resulting interpretation. This framework or analytic structure
is usually built from a combination of a priori and emergent concepts and themes (Ritchie &
Spencer, 1994). These themes and concepts are then grouped, ranked, or otherwise ordered in
a way that helps the researcher address the focus of the study. Typically, frameworks are
composed of major themes and concepts (hereafter called components), which are supported
by other themes and concepts elaborating on or sub-dividing the major themes and concepts
(hereafter called sub-components). Like many other forms of qualitative analysis, the typical
framework structure can be thought of as a tree with many branches.
Also like many other types of qualitative analysis, the identifying the framework step
is an iterative process. An initial framework is tested against a manageable portion of the data
and refined as necessary to move from simple description to conceptual abstractions (Ritchie
& Spencer, 1994). Refinements can include renaming components, identifying new
components, deleting components, collapsing components, and reordering components.
Similar refinements can also occur at the sub-component level.
To identify the framework for the TBA dataset, I first reflected on the second, larger
lens I had used in the data familiarization step. I considered what the framework could look
like given the data at hand and the themes I had identified from my second data familiarization

2066 The Qualitative Report 2021
exercise. I decided that I would be able to build a framework which could use all three
stakeholder group perspectives to comment on an understanding of the work and value of TBAs
and formal health care workers in the birth process such that birth outcomes will be improved.
I opted to create the initial framework components using pen and paper as I was already
working that way in the previous data familiarization step.
The left column of Table 2 shows the initial framework components, which included a
rough ordering from practice inputs (i.e., women’s use of each type of provider) to reflections
on actual practice for both types of providers, considered first within a provider type and then
in combination in some way between the two provider types. Notice there are no sub-
components to this initial framework as I did not yet have a good enough understanding of the
data.
Table 2
Framework Identification (Step 2) in the TBA Dataset: Initial and revised framework for
understanding the work and value of TBAs and formal health care providers in the birth
process
Initial Framework Revised Framework
Reasons why women use TBAs rather than
formal health care providers
Reasons why women use TBAs rather than formal
health care providers
• TBAs more easily affordable than health center
• TBAs local while health center can be far away
• TBA practice preferred over formal health care
providers practice
• Formal health care providers’ treatment has not
worked
Reasons why women use formal health
care providers rather than TBAs
Reasons why women use formal health care
providers rather than TBAs
• Delivery too complex for TBA
Concerns about TBA practice Concerns about TBA practice
Concerns about formal health care
provider practice
Concerns about formal health care provider practice
Characteristics of positive work
relationships between TBAs and formal
health care providers
Characteristics of positive work relationships
between TBAs and formal health care providers
• Cooperation between TBAs and formal health
care providers
• TBAs supported by formal health care
providers
Characteristics of negative work
relationships between TBAs and formal
health care providers
Characteristics of negative work relationships
between TBAs and formal health care providers
• TBAs and health care providers working
against each other
• Women not supporting the two provider groups
working together
Suggestions for improving working relationships
Characterization of provider roles
• Jointly caring for women, with needed care
happening at appropriate place and provider
• TBAs are a less skilled and less knowledgeable
alternative to formal health care providers

Laurie J. Goldsmith 2067
I then worked through the three focus group transcripts, attaching text in the transcripts
to the draft framework using a computer-assisted qualitative data analysis software (CAQDAS)
program. I created new framework components when I encountered text that did not fit the
draft framework yet would be helpful for understanding the two provider types and the birth
process. I also created sub-components where I felt it would be helpful to develop a more
nuanced understanding of the data for this step. This approach resulted in the addition of sub-
components throughout the framework plus two additional framework components (right
column of Table 2). I considered whether I should reorder the components from the initial
framework but did not see an obvious new order. I also knew that I could revisit the
consideration of reordering through the next step.
Coding is a common part of the framework identification stage, although it is possible
to arrive at a well-functioning framework without having engaged in explicit coding work. The
emphasis at this stage is on completing the framework—the identification of the important
themes and concepts and the conceptual relationship they have to each other—rather than an
emphasis on how the important themes and concepts play out in the data. For identifying the
framework in the TBA dataset, I chose to engage in explicit coding as I wanted a stronger
handle on the data and the patterns within. I also chose to initiate this coding with a CAQDAS
program rather than via pen and paper as I expected I would want the flexibility to quickly
reorder, collapse, and split codes as my understanding of the data deepened. Had I been
involved in the study design and data collection phases of the TBA study, I might have started
the framework identification step with a strong grasp of the data and opted to complete the
entirety of this step using pen and paper and without much explicit coding work.
Step 3: Indexing
Once a reasonable framework has been identified, the next step in framework analysis
is to systematically apply the framework to all of the study data (Ritchie & Spencer, 1994).
This process is called indexing as it resembles the process used to create the index of a book
(Spencer, Ritchie, O’Connor, et al., 2014). The linking of study data and framework
components can be accomplished using any approach with which the researcher is comfortable
for coding data (e.g., pen and paper, using the comment function in a word processing program,
or a CAQDAS program). Many researchers with access to a CAQDAS program will opt to use
it at this stage to facilitate the data manipulation required in framework analysis’ subsequent
steps.
Before indexing can begin, the researcher must determine the appropriate way to link
framework components with applicable study data. There is no standard linking structure to
rely on like the page numbers in a book index. Rather, the study data are linked to framework
components via the appropriate units of analysis—namely, the entities or items which are the
focus of the study framework. For some frameworks, the data collection sampling units can
also be used as the units of analysis. Other frameworks operate at a different altitude with
respect to the study topic than was the case during the study’s initial design or data collection
phases, necessitating using units of analysis which differ from the data collection sampling
units. (See Goldsmith et al., 2017 for an example of framework analysis using units of analysis
which differ from the data collection sampling units.)
With respect to the TBA dataset, I indexed the data using two units of analysis: the
stakeholder group and the individual providers and clients. The stakeholder group was an
obvious unit of analysis as the framework emphasized understanding stakeholder group
perspectives. The data collection choice to hold separate focus groups for each stakeholder
group also meant for straightforward indexing by stakeholder group. Indexing the data by
individual providers and clients was more of an opportunistic choice as individuals were
2068 The Qualitative Report 2021
explicitly identified within each focus group and I could simultaneously index using both units
of analysis. If indexing using these two units of analysis could not have happened concurrently,
I likely would have only indexed the data by stakeholder group due to the emphasis on
stakeholder groups within the data and the framework.
The TBA dataset is an example where the units of analysis were identical to the data
collection sampling units as there was a similar focus between data collection and the resulting
framework. In contrast, had each focus group’s discussion concentrated on particular birth
stories, I might have decided that the birth stories were the appropriate unit of analysis to use
for the indexing step.
The indexing step also provides an important opportunity for framework revision as
applying the framework to all study data simultaneously necessitates assessing how well the
framework works with and for the study data. Framework testing and revision tasks in the
indexing step consist of affirming and amending the definitions and boundaries of each
framework component and sub-component and adding to framework sub-components to
accommodate new variation. The researcher may even encounter data in the indexing step for
which the framework does not work, requiring revisiting the overall structure and contents of
the framework. Regardless of what revisions are made, framework indexing and revision must
continue in an iterative process until all data are indexed on the final framework.
With respect to the TBA dataset, the small volume of data meant that indexing was
already accomplished through the previous two steps. By this point in time, I knew that the
framework worked for all the data and I made no revisions to the framework. This is an unusual
situation and readers should more often expect that indexing will be accomplished as a distinct
step after framework identification and the framework is likely to be refined during the
indexing step.
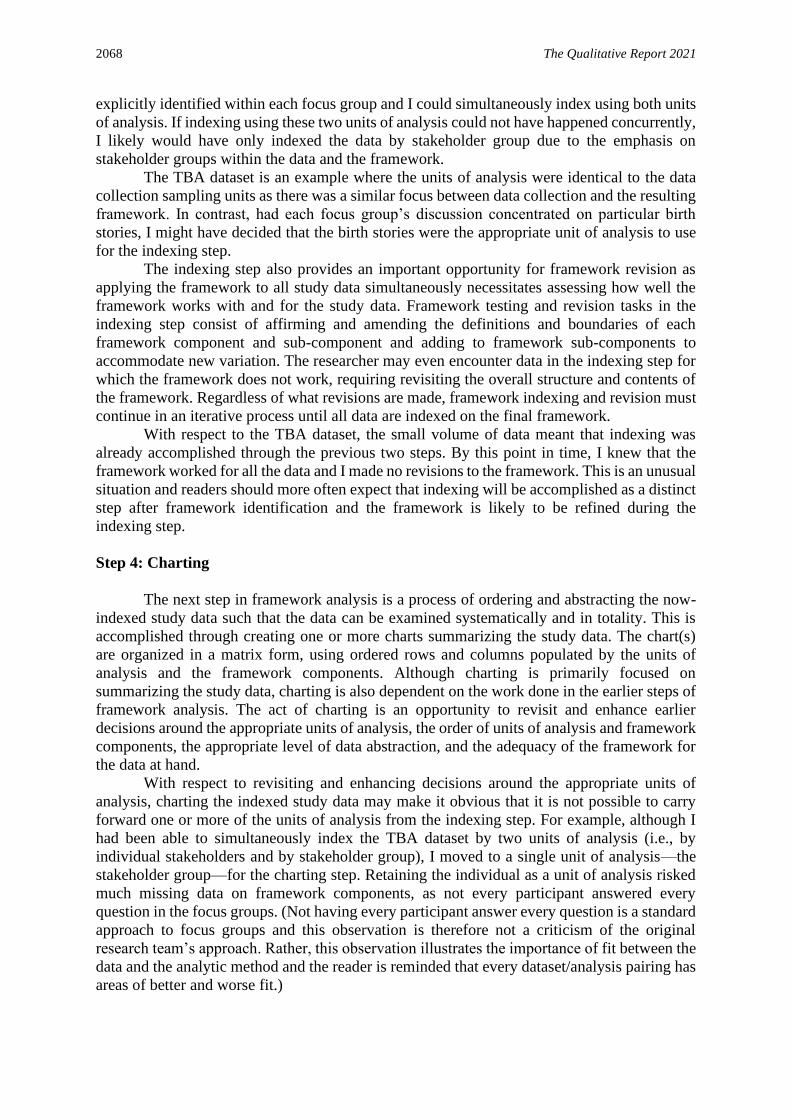
Step 4: Charting
The next step in framework analysis is a process of ordering and abstracting the now-
indexed study data such that the data can be examined systematically and in totality. This is
accomplished through creating one or more charts summarizing the study data. The chart(s)
are organized in a matrix form, using ordered rows and columns populated by the units of
analysis and the framework components. Although charting is primarily focused on
summarizing the study data, charting is also dependent on the work done in the earlier steps of
framework analysis. The act of charting is an opportunity to revisit and enhance earlier
decisions around the appropriate units of analysis, the order of units of analysis and framework
components, the appropriate level of data abstraction, and the adequacy of the framework for
the data at hand.
With respect to revisiting and enhancing decisions around the appropriate units of
analysis, charting the indexed study data may make it obvious that it is not possible to carry
forward one or more of the units of analysis from the indexing step. For example, although I
had been able to simultaneously index the TBA dataset by two units of analysis (i.e., by
individual stakeholders and by stakeholder group), I moved to a single unit of analysis—the
stakeholder group—for the charting step. Retaining the individual as a unit of analysis risked
much missing data on framework components, as not every participant answered every
question in the focus groups. (Not having every participant answer every question is a standard
approach to focus groups and this observation is therefore not a criticism of the original
research team’s approach. Rather, this observation illustrates the importance of fit between the
data and the analytic method and the reader is reminded that every dataset/analysis pairing has
areas of better and worse fit.)
Laurie J. Goldsmith 2069
Had the TBA dataset contain more data about the focus of the framework and had there
been more than one focus group per stakeholder group, I might have considered continuing
using the individual stakeholder as a second unit of analysis. This approach would be more
challenging, particularly around designing and reconciling one or more charts using two units
of analysis. This challenge might still be worth taking on as I could conduct more complex
analyses. With two units of analyses, I could compare and contrast charting patterns within
individual stakeholders, across individuals within the same focus group and stakeholder group,
and across stakeholder groups.
With respect to revisiting and enhancing the order of units of analysis and framework
components, charting demands an explicit order to the layout of rows and columns. The
researcher may not have needed to be concerned about imposing order on the units of analysis
before now—data may have been indexed in the order that individuals were interviewed, for
instance. And while framework components are more likely to already have order suggested
by the earlier framework identification and indexing steps, the act of charting can still push the
researcher to enhance the order of framework components. Regardless of the state of order of
units of analysis and framework components prior to this step, the researcher uses the research
questions and the developing analysis to ensure there is explicit and sufficient order to the units
of analysis and framework components on the chart(s). Imposing order can be simple, such as
grouping units of analysis by key characteristics. If the TBA dataset included multiple focus
groups for each stakeholder group, for instance, all focus groups for TBA clients could be
grouped together. Alternatively, imposing order can be more complex. For example, the order
used in charting can reflect structure and process, such as the order of the TBA dataset’s
framework components carried forward from the previous steps. These framework components
reflect the work of each type of health care provider in isolation followed by collaboration
between TBAs and formal health care providers.
Once the charting structure of the rows and columns is established, the researcher can
move onto populating the interior cells of the chart(s). This requires reviewing the data in its
indexed form (Spencer, Ritchie, O’Connor, et al., 2014) and determining or revisiting the
appropriate level of abstraction for the data. Some frameworks would have already demanded
data abstraction in the indexing step that can be appropriately carried forward into the charting
step. This can be the case when there are complex or voluminous data about framework
components or units of analysis. In contrast, when earlier steps have not already demanded
abstraction, the indexed study data are often too unwieldy to be used as-is for populating the
interior cells of the chart(s). Such data need to be summarized to ensure the data are more
graspable in chart form (Ritchie & Spencer, 1994). In the case of transcripts from individual
interviews or focus groups, for instance, all textual data associated with the intersection of a
row and column are summarized in the relevant cell. Charting not-previously-abstracted study
data may also suggest the need for additions to framework components or sub-components,
which may further require additional indexing work or the revisiting of earlier parts of the
chart(s).
Researchers use a variety of approaches to create the chart or charts for their framework
analyses. Some use pen and paper while others create charts using tables in word processing
computer programs or spreadsheet computer programs (e.g., Swallow et al., 2003). Others use
CAQDAS programs alone or in combination with aforementioned approaches to arrive at a
completed chart (see Goldsmith et al., 2017 for an example of the latter). To the best of my
knowledge, NVivo (version 9 and above) is the only CAQDAS program which facilitates the
entirety of framework analysis, including charting, and allows for retaining live links between
the cells in the chart and study data. (For worked examples of NVivo’s Framework Matrix
option, see Bonello & Meehan, 2019; Parkinson et al., 2016.)

2070 The Qualitative Report 2021
To create the chart for the TBA dataset, I reviewed the study data by framework
component and stakeholder group within the CAQDAS program and then manually entered
my summary of the data in the relevant cell on a table I created in a word processing program
(Table 3). The framework continued to work well for the TBA data, and no new framework
components or sub-components were added to the chart.
Table 3
Charting (Step 4) in the TBA Dataset: Example of data abstraction for a few key framework
components and sub-components by stakeholder group for understanding the work and value
of TBAs and formal health care providers in the birth process
TBAs Formal health
care providers
TBA clients
Reasons why
women use
TBAs rather
than formal
health care
providers
TBAs more
easily
affordable
than health
center
All focus group
participants
recognize that
health centre costs
and transportation
costs impede
women from using
health center
Health center
services more
expensive than
TBA services
Some focus group
participants
recognize that
women cannot
always afford to
pay health center
for services and/or
cannot afford
transportation costs
and therefore use
TBAs for delivery
All focus group
participants recognize
that health center costs
and transportation
costs impede women
from using health
center
Health center services
more expensive than
TBA services
TBAs do not ask for
money up front and
only ask for money if
birth is successful
Concerns about formal
health care worker practice
[no data] [no data]
Health center workers
do not support women
as women would like
to be supported (e.g.,
let them scream in
pain without
acknowledgement vs.
talking them through
pain); going to health
centre not a guarantee
against negative birth
outcomes
The charting step results in one or more charts, with the number of charts dependent on
the data and the researcher’s preferences. Where the data are not manageable in a single chart,
for example, the researcher may subdivide the data by framework components or by units of

Laurie J. Goldsmith 2071
analysis. For the TBA dataset, it was possible to use a single chart as the combination of each
framework and charted data could be reasonably assessed as a single whole.
Step 5: Mapping and Interpretation
The final step in framework analysis—mapping and interpretation—is where the
researcher combines the key learnings from the earlier steps, including hunches about patterns
to explore in the data, with comparisons across and within units of analysis and across and
within framework components. Comparisons of potential interest at this step include examining
variation across the entire dataset, examining variation within subgroups and subthemes, and
looking for clusters of data. The charts and other data are reviewed, recombined, collapsed, or
condensed as suggested by the study focus, data, and major patterns. The researcher is
ultimately trying to tell a compelling story about how the data are structured and patterned.
There is no single form of product from framework analysis. The results of mapping
and interpretation can be shown in a variety of ways, including identifying and describing key
concepts or the nature and range of particular phenomena; demonstrating associations across
units of analysis for key concepts or particular phenomena; explaining attitudes, experiences
and behaviors; and creating typologies (Ritchie & Spencer, 1994). This list should not be seen
as a complete list; the researcher is encouraged to be creative and follow the analysis to where
the researcher is led even if the approach is not listed above. (See Ritchie & Spencer, 1994, for
multiple varied examples of mapping and interpretation products).
With respect to conducting the mapping and interpretation step with the TBA data, I
wanted to summarize the comparisons across the three stakeholder groups while also reflecting
the strength of the signals from the data. I already had some thoughts about patterns in the
charted data—for example, during the charting step I noticed that the formal health care
providers’ discussion about TBA affordability was less nuanced than the discussion in the other
two stakeholder groups. I also imagined that one use of this analysis would be to identify areas
of silence and differing emphases such that future policy and education could be more targeted
and appropriate in design. I took the table from the charting step further by mapping the
presence and intensity of data associated with framework components and subcomponents.
This was not an attempt to simply reduce the focus group data to quantitative data by only
relying on the volume of data associated with each framework component and sub-component.
Rather, my measure of data intensity combined data volume with an assessment of the relative
presence of the component or sub-component across the focus group transcript (i.e., across
various focus group questions) and across focus group participants. Using data presence and
intensity for each cell was my attempt to show variation in the value and understanding of the
birth process work of the two provider groups from the three stakeholder perspectives.
A selection of this mapping of data intensity is shown in Table 4. There are striking
differences in the patterns across columns throughout the chart. TBA clients had a more intense
and complex discussion about why women use TBAs in comparison to the other two
stakeholder groups. TBA clients were also the only stakeholder group that expressed concerns
about the practice of formal health care workers. And while all stakeholder groups expressed
concerns about TBA practice, the formal health care workers spent more time discussing
concerns about TBA practice and provided more examples of poor care by TBAs than was the
case in the other two stakeholder groups. The formal health care workers were also out of step
with the other two stakeholder groups with respect to the two types of characterization of
provider roles in the data. Formal health care workers did not discuss a joint caring model and
were more intensely invested in a hierarchal model where TBAs are seen as less skilled and
less knowledgeable alternatives to themselves.

2072 The Qualitative Report 2021
Table 4
Mapping and Interpretation (Step 5) in the TBA Dataset: Example of data intensity mapping
for a few key framework components and sub-components by stakeholder group for
understanding the work and value of TBAs and formal health care providers in the birth
process
TBAs Formal health
care workers
TBA clients
Reasons why
women use TBAs
rather than formal
health care
providers
TBAs more easily
affordable than health
center
●●● ●● ●●●
TBAs local while health
center can be far away ● ● ●●●
TBA practice preferred
over formal health care
workers practice
Ø Ø ●●
Formal health care
workers’ treatment has not
worked
● Ø Ø
Concerns about TBA practice ● ●●● ●
Concerns about formal health care worker
practice Ø Ø ●●
Characterization
of provider roles
Jointly caring for women,
with needed care happening
at appropriate place and
provider
●●● Ø ●●●
TBAs are a less skilled and
less knowledgeable
alternative to formal health
care workers
● ●●● ●
Legend:
●●● indicates high intensity component or sub-component
●● indicates medium intensity component or sub-component
● indicates low intensity component or sub-component
Ø indicates no data present for this component or sub-component
These findings illustrated that the work and value of TBAs and formal health care
workers was seen quite differently by the three stakeholder groups. Before it is reasonable to
expect TBAs to refer to formal health care providers—the policy objective motivating the
original data collection (Chukwuma, Mbachu, et al., 2017)—this framework analysis suggests
that more attention should be paid to bringing the stakeholder groups’ perspectives into closer
alignment. Formal health care providers could be encouraged to recognize the value of the role
of TBAs in women’s birthing practices despite existing concerns about the practice of TBAs.
Another possible opportunity for changing practice patterns and decreasing concerns over TBA

Laurie J. Goldsmith 2073
practice suggested by this analysis is to approach TBAs as joint partners in care for pregnant
and postnatal women, which matches with the way that TBAs in this study predominantly
described their role as providers in the birth process.
The Value of Framework Analysis for Applied Research
Framework analysis allowed for ease of comparison across the three stakeholder groups
in the TBA dataset, although this comparative analysis was made more challenging by having
focus group guides which differed across the three stakeholder groups. Framework analysis’
demand for structure and order pushed the TBA dataset analysis beyond the simple listing of
themes, which further benefitted the comparison between stakeholder groups. The charting and
mapping demands of framework analysis also meant that each theme was reviewed for each
stakeholder group, highlighting variation between stakeholders and helping to surface policy-
relevant silences in the data. The results of this framework analysis then helped identify gaps
needing bridging before expecting stronger working relationships between TBAs and formal
health care workers.
The benefits of framework analysis’ order and structure can extend beyond the study
completion. As already mentioned in the introduction, the explicitness of the steps of
framework analysis provides an easily understandable audit trail and provides non-research
audiences access to the inner workings of the analysis. Such transparency can increase the
willingness of policy makers, the public, and other knowledge users to engage with and use the
research to understand and solve policy problems. Framework analysis’ transparency can also
be harnessed for future qualitative, quantitative, and mixed methods research. In the case of
the TBA data study setting, the results of this framework analysis could be returned to the three
stakeholder groups and used as a foundation for further discussion and work towards improving
the outcomes of the birth process. For example, all stakeholders could be asked to comment on
the silences identified in this framework analysis; future focus group guides could explore
whether and how the previously identified silences represented an artifact of data collection,
an invitation for new ways of thinking about the work and value of various stakeholders, or an
opportunity for additional learning about other stakeholders. Regardless of the veracity of the
previously identified silences, additional data would enhance our understanding of the role of
TBAs and others in the birth process and enhance opportunities to improve birth outcomes.
Framework Analysis in Primary and Secondary Data Collection
The above analysis of the TBA dataset demonstrates that framework analysis can be
accomplished in secondary data. The biggest challenge to this secondary data analysis was
identifying a research question which could be supported by this dataset. Had I been working
with primary data rather than secondary data, applying the first two steps of framework analysis
to the TBA dataset would have likely gone more quickly. Primary data would have had the
luxury of stronger alignment between the research question, data collection, and the analytic
approach. In turn, constructing the framework could have relied more on the structure already
present in the focus group guides (Ritchie & Spencer, 1994). I would have still needed to
conduct inductive work in building the framework (as is usually the case in building any
framework in framework analysis using qualitative data, even frameworks which are already
fairly prescribed by the study objectives) but such effort would likely be more in service of
deepening and broadening the structure rather than also needing to rely on inductive work to
create the initial framework structure.
Working with primary data and knowing that I was planning on doing framework
analysis would have also meant that I could have designed a TBA study to more strongly reflect

2074 The Qualitative Report 2021
the ability to and interest in comparing TBA, formal health care provider, and TBA client
perspectives on the same issues. The focus group guides, in particular, could have been
constructed such that the three stakeholder groups were asked the same battery of questions so
comparison between the three roles could been more straightforward. I might have further
decided to conduct more than one focus group for each stakeholder group, which would add to
the volume of data, likely provide more variation within each stakeholder group, and allow for
more grist for the analytic mill. Each TBA study focus group could have also included the
completion of a short survey to ensure each participant provided information about key
questions. This approach would allow for at least a partial shift of the unit of analysis to the
individual participant within the overall framework analysis. Although detailed explanation is
beyond the scope of this paper, it is important to point out to readers that properly planned
framework analysis using primary data collection can easily accommodate quantitative and
qualitative data and can be used to integrate the two data types.
A final way that primary data collection might have changed the use of framework
analysis in a TBA study is in the timing of the analysis and the potential for iterative data
collection and analysis. With primary data collection, framework analysis can begin once the
first piece of data has been collected. Data familiarization and the initial construction of the
framework can be shaped by the early data. Thoughts and hunches about framework
components and sub-components could then be tested in the field through new purposeful
sampling strategies and revisions to data collection tools such as focus group guides. In other
words, framework analysis can be accomplished and potentially strengthened through iterative
data collection and analysis, a possibility which only exists in primary data collection.
Conclusion
Using framework analysis with the TBA dataset provided systematic comparison
amongst the three stakeholder groups and indications of where better communications and
understandings had potential to improve TBA involvement in maternity care. The use of this
common dataset in this special issue of The Qualitative Report allows for comparing
framework analysis with other similar approaches, such as other forms of thematic analysis.
This paper’s detailing of framework analysis with the TBA dataset adds to the worked
examples already present in the framework analysis literature (e.g., Bonello & Meehan, 2019;
Parkinson et al., 2016; Swallow et al., 2011; Ward et al., 2013). This paper’s highlighting the
importance of multiple considerations of the units of analysis also adds to the existing
framework analysis methodology literature.
I add my voice to others in demonstrating that framework analysis is both a powerful
and flexible method for analyzing a variety of types of qualitative data, including secondary
data. The examples in this paper and elsewhere show that framework analysis has been
effectively used by solo researchers, by teams of qualitative researchers, and by multi-
disciplinary and mixed-methods research teams. There are myriad reasons for applied
researchers to use framework analysis, including transparency of process and a long and
successful track record for better understanding of policy issues and social problems to help
policy makers, service deliverers, and other knowledge users with improving program design
and decision making. Results from applied research studies using framework analysis have also
contributed to better theorizing about phenomena of interest and improvements in the design
of future research of any type, whether that future research is qualitative or quantitative, or
basic or applied. In sum, framework analysis has value to applied fields and beyond. I hope
this paper encourages applied researchers to consider using framework analysis and to employ
framework analysis with confidence and rigour.

Laurie J. Goldsmith 2075
References
Bonello, M., & Meehan, B. (2019). Transparency and coherence in a doctoral study case
analysis: Reflecting on the use of NVivo within a “framework” approach. The
Qualitative Report, 24(3), 483–498. https://doi.org/10.46743/2160-3715/2019.3823
Dixon-Woods, M. (2011). Using framework-based synthesis for conducting reviews of
qualitative studies. BMC Medicine, 9(1), 39. https://doi.org/10.1186/1741-7015-9-39
Chukwuma, A., Chinyere, M., Cohen, J., McConnell, M., & Bossert, T. (2017). Data for: “A
qualitative study of perspectives on postnatal care referrals by traditional birth
attendants in Ebonyi State, Nigeria.” (QDR 10078) [Data Set]. Qualitative Data
Repository. https://doi.org/10.5064/F67H1GGS
Chukwuma, A., Mbachu, C., Cohen, J., Bossert, T., & McConnell, M. (2017). “Once the
delivery is done, they have finished”: A qualitative study of perspectives on postnatal
care referrals by traditional birth attendants in Ebonyi state, Nigeria. BMC Pregnancy
and Childbirth, 17(1), 429. https://doi.org/10.1186/s12884-017-1616-x
Gale, N. K., Heath, G., Cameron, E., Rashid, S., & Redwood, S. (2013). Using the framework
method for the analysis of qualitative data in multi-disciplinary health research. BMC
Medical Research Methodology, 13, 117. https://doi.org/10.1186/1471-2288-13-117
Goldsmith, L. J., Kolhatkar, A., Popowich, D., Holbrook, A. M., Morgan, S. G., & Law, M. R.
(2017). Understanding the patient experience of cost-related non-adherence to
prescription medications through typology development and application. Social
Science & Medicine, 194(Supplement C), 51–59.
https://doi.org/10.1016/j.socscimed.2017.10.007
Johnston, L. M., Matteson, C. L., & Finegood, D. T. (2014). Systems science and obesity
policy: A novel framework for analyzing and rethinking population-level planning.
American Journal of Public Health, 104(7), 1270–1278.
https://doi.org/10.2105/AJPH.2014.301884
King, N., & Brooks, J. (2018). Thematic analysis in organisational research. In C. Cassell, A.
Cunliffe, & G. Grandy (Eds.), The Sage handbook of qualitative business and
management research methods: Methods and challenges (pp. 219–236). Sage.
https://doi.org/10.4135/9781526430236.n14
Mason, W., Mirza, N., & Webb, C. (2018). Using the framework method to analyze mixed-
methods case studies. Sage. https://doi.org/10.4135/9781526438683
Parkinson, S., Eatough, V., Holmes, J., Stapley, E., & Midgley, N. (2016). Framework analysis:
A worked example of a study exploring young people’s experiences of depression.
Qualitative Research in Psychology, 13(2), 109–129.
https://doi.org/10.1080/14780887.2015.1119228
Pope, C., Ziebland, S., & Mays, N. (2019). Analysis. In C. Pope & N. Mays (Eds.), Qualitative
research in health care (4th ed., pp. 111–134). Wiley-Blackwell.
Pope, C., Ziebland, S., & Mays, N. (2000). Analysing qualitative data. British Medical Journal,
320(7227), 114–116.
Ritchie, J., & Spencer, L. (1994). Qualitative data analysis for applied policy research. In A.
Bryman & R. Burgess (Eds.), Analyzing qualitative data (pp. 305–329). Routledge.
Roberts, N. (2000). Wicked problems and network approaches to resolution. International
Public Management Review, 1(1), 1–19.
Robertshaw, D., & Cross, A. (2019). Experiences of integrated care for dementia from family
and carer perspectives: A framework analysis of massive open online course discussion
board posts. Dementia, 18(4), 1492–1506. https://doi.org/10.1177/1471301217719991
Smith, J., & Firth, J. (2011). Qualitative data analysis: The framework approach. Nurse
Researcher, 18(2), 52–62. https://doi.org/10.7748/nr2011.01.18.2.52.c8284

2076 The Qualitative Report 2021
Spencer, L., Ritchie, J., O’Connor, W., Morrell, G., & Ormston, R. (2014). Analysis in practice.
In J. Ritchie, J. Lewis, C. M. Nicholls, & R. Ormston (Eds.), Qualitative research
practice: A guide for social science students and researchers (2nd ed., pp. 295-345).
Sage.
Spencer, L., Ritchie, J., Ormston, R., O’Connor, W., & Barnard, M. (2014). Analysis:
Principles and processes. In J. Ritchie, J. Lewis, C. M. Nicholls, & R. Ormston (Eds.),
Qualitative research practice: A guide for social science students and researchers (2nd
ed., pp. 269-290). Sage.
Struik, L. L., & Baskerville, N. B. (2014). The role of Facebook in crush the crave, a mobile-
and social media-based smoking cessation intervention: Qualitative framework analysis
of posts. Journal of Medical Internet Research, 16(7), e170.
https://doi.org/10.2196/jmir.3189
Swallow, V., Lambert, H., Santacroce, S., & Macfadyen, A. (2011). Fathers and mothers
developing skills in managing children’s long-term medical conditions: How do their
qualitative accounts compare? Child: Care, Health and Development, 37(4), 512–523.
https://doi.org/10.1111/j.1365-2214.2011.01219.x
Swallow, V., Newton, J., & Lottum, C. V. (2003). How to manage and display qualitative data
using ‘Framework’ and Microsoft® Excel. Journal of Clinical Nursing, 12(4), 610–
612. https://doi.org/10.1046/j.1365-2702.2003.00728.x
Tallentire, V. R., Smith, S. E., Skinner, J., & Cameron, H. S. (2015). Exploring patterns of
error in acute care using framework analysis. BMC Medical Education, 15(1), 3.
https://doi.org/10.1186/s12909-015-0285-6
Tishelman, C., Lindqvist, O., Hajdarevic, S., Rasmussen, B. H., & Goliath, I. (2016). Beyond
the visual and verbal: Using participant-produced photographs in research on the
surroundings for care at the end-of-life. Social Science & Medicine, 168, 120–129.
https://doi.org/10.1016/j.socscimed.2016.09.012
Ward, D. J., Furber, C., Tierney, S., & Swallow, V. (2013). Using framework analysis in
nursing research: A worked example. Journal of Advanced Nursing, 69(11), 2423–
2431. https://doi.org/10.1111/jan.12127
Author Note
Laurie J. Goldsmith, PhD, is the Founder and Principal of GoldQual Consulting, a
qualitative and mixed methods health services research company, and an Adjunct Professor in
Simon Fraser University’s Faculty of Health Sciences. Her research interests include access to
health care and documenting and advancing the use of research methods. Please direct
correspondence to [email protected].
Copyright 2021: Laurie J. Goldsmith and Nova Southeastern University.
Article Citation
Goldsmith, L. (2021). Using framework analysis in applied qualitative research. The
Qualitative Report, 26(6), 2061-2076. https://doi.org/10.46743/2160-3715/2021.5011