Embed Size (px)
Citation preview
International Journal of Science, Technology and Society 2016; 4(2-1): 1-7
http://www.sciencepublishinggroup.com/j/ijsts
doi: 10.11648/j.ijsts.s.2016040201.11
ISSN: 2330-7412 (Print); ISSN: 2330-7420 (Online)
Using GIS to Select Ideal Sites for Municipal Wastes Transfer Station: Case Study of Embu Municipality
Dickson Kinoti Kibetu1, Daniel Muchiri
2
1Department of Arts and Humanities, Chuka University, Chuka, Kenya
2Department of Spatial Planning, Galaxy Geo Services, Embu, Kenya
Email address: [email protected] (D. K. Kibetu), [email protected] (D. Muchiri)
To cite this article: Dickson Kinoti Kibetu, Daniel Muchiri. Using GIS to Select Ideal Sites for Municipal Wastes Transfer Station: Case Study of Embu
Municipality. International Journal of Science, Technology and Society. Special Issue: Applied Geographic Information Systems.
Vol. 4, No. 2-1, 2016, pp. 1-7. doi: 10.11648/j.ijsts.s.2016040201.11
Received: June 30, 2015; Accepted: August 21, 2015; Published: January 20, 2017
Abstract: In Kenya, many local authorities face uphill challenges in dealing with wastes especially volume reduction and
proper disposal. There is minimal solid waste segregation and recycling further compounding the problem of open dumping.
The study’s objective was to identify suitable areas to consider for the construction of a multi-purpose waste transfer and
recovery facility within Embu municipality. There was also a need to popularize waste bulking and improve on ways of
compiling waste data which was lacking in their municipal waste management system. The study used a mixed approach
design encompassing ground surveys, interviews, questionnaires, data modeling and Analysis. In this case study, Geographic
Information System (GIS) was used to evaluate Population, land use and proximity to waste receptacles as impact factors
influencing waste management in this town. GIS-based analysis identified Kangaru, Blue valley, Majengo and Itabua Wards as
suitable areas for the construction of waste transfer station. The identified regions contained a total area of 0.15km2 of suitable
sites from the initial 0.40km2 identified as Preliminary sites. These wards had motor able roads, with agricultural land use and
were within the town suburbs. GIS provided appropriate tools for compilation, analysis and management of information related
to generation, collection and disposal of Municipal Wastes. The study recommends the adoption of an integrated waste
management approach where public views and the use of geospatial tools are incorporated in all aspects of municipal waste
management.
Keywords: Waste Transfer Station, Geographic Information Systems (GIS), Municipal Solid Wastes (MSW)
1. Introduction
1.1. Background Information
Economic growth, urbanization and industrialization are
contributing to the rise of Solid waste menace in Kenya’s
urban areas. Mixing up of wastes has continued to pose a
challenge on volume reduction and waste segregation. Source
reduction and recycling also play an integral role in any
community’s total waste management system (US.EPA,
2000). Therefore, if most Municipal Solid wastes were
segregated, reduced or recycled, a significant amount could
be diverted from dumpsites and instead turned into revenue
generation materials.
All these activities would minimize the quantity as well as
the weight of the wastes ending up in the disposal sites
therefore reducing the costs of transportation as well as
disposal. The Municipal Solid Waste can be defined as
discards routinely collected from homes, businesses,
institutions, and the nonhazardous discards from industries
(Lund, Herbert F, 1992). Usually municipal waste is the most
widespread waste stream in developing world today requiring
major financial and logistical resources to collect, recycle
and dispose.
On a global scale, municipal solid waste is increasing,
calling for the current recycling levels to be raised further
(Global Market waste report, 2007). A need for commercial
infrastructure to support recycling and even a need to reduce
the amount of wastes produced at the source underpins the
value of a Waste Transfer Station in an expanding
municipality like Embu.
2 Dickson Kinoti Kibetu and Daniel Muchiri: Using GIS to Select Ideal Sites for Municipal Wastes Transfer Station:
Case Study of Embu Municipality
1.2. Importance of Waste Transfer Stations in Solid Waste
Management
These are facilities where municipal solid waste is
unloaded from collection vehicles and briefly held while it is
reloaded onto larger long-distance transport vehicles for
shipment to landfills or other treatment or disposal facilities
(National Environmental Justice Advisory Council, 2000).
By combining the loads of several individual waste
collection trucks into a single shipment, communities can
save on money for the labour and operating costs of
transporting the waste to a remote disposal site. They can
also reduce the total number of trips traveling to and from the
disposal site. Wastes transfer stations reduces on labour, fuel
and collection costs by consolidating solid waste collection
and disposal points, minimizes the cost of hauling waste to
distant disposal sites (Solid Waste Association of North
America. 2000). Generally around the world, Wastes transfer
Stations are becoming popular especially in the United States
of America because such facilities have the benefits of
reducing overall traffic by consolidating smaller loads into
larger vehicles, they offer flexibility in waste handling and
disposal options, help reduce air pollution, fuel consumption
and road wear by consolidating trash into fewer vehicles,
Allow for screening of waste for special handling and giving
citizens facilities where they can drop-off generated waste
and recyclables (US.EPA, 1995).
In any community’s waste management system, waste
transfer stations now links waste collection program and
disposal facility emphasizing the crucial role of such
facilities play in any local or regional waste management
system. Currently, Embu municipality is experiencing a lot of
recycling activities both in plastics and old metals. As an
initiative to encourage recycling, minimize illegal dumping
and offer convenient, cost effective place for people to drop
off wastes, there is a need to set up such a facility where
wastes is first collected and consolidated before finally
transported to the recycling plants or the landfills. Wastes
transfer stations also can serve as wastes drop-off stations
and or Material Recovery Facilities (MRFs). As an approach
to support the Embu urban community waste reduction and
raise the current recycling levels, a waste transfer Station was
considered appropriate given the population growth and
uncontrolled urban waste stream.
1.3. Study Area
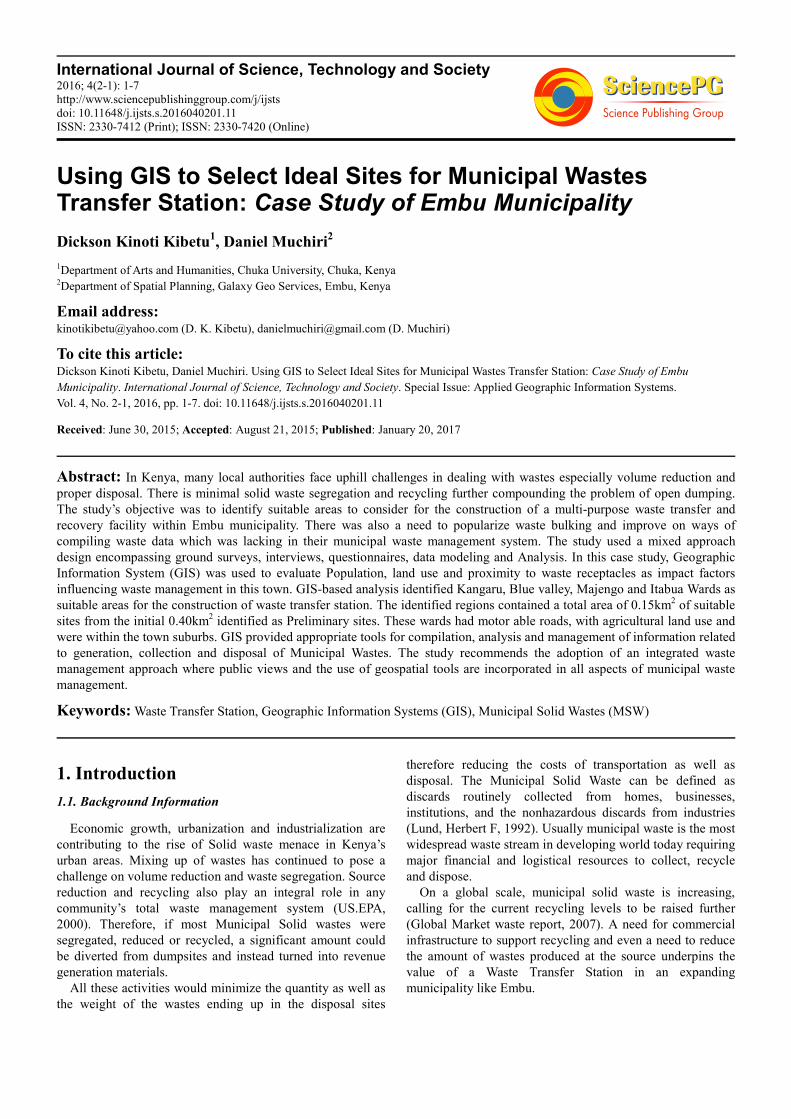
Embu town lies between Latitude 0° 32’ 24’’and 0° 32’
46’’ South, Longitude 37° 27’ 01’’and 37° 27’ 31’’ East. The
township occupies a total area of 80 square kilometers and is
approximately 150 kilometers North East of Nairobi. The
area receives on average annual rainfall of 1495mm with two
rainy seasons corresponding to April and October. The
temperature ranges from 12°C to 27°C with the coldest and
hottest months being July and March respectively. Embu
township municipality has seven electoral wards namely;
Njukiri, Majengo, Itabua, Matakari, Kamiu, Kangaru and
Blue valley (figure 1). The township has a population of
about 150000 persons according to the Kenya National
Bureau of Statistics census report of 2009.
(Source: Author)
Figure 1. A map of Embu Township Municipality Wards.

International Journal of Science, Technology and Society 2016; 4(2-1): 1-7 3
1.4. Current Waste Situation and Management Practices
Embu Municipal Solid Wastes is composed mainly of
organic matter, debris, metals, plastics, ash, papers and non-
hazardous medical wastes from the chemists and clinics
operating in the municipality. Embu town is a home to many
businesses, government departments and non-governmental
organizations. This contributes waste inputs from
commercial, residential and service oriented sources.
The current garbage collection services do not extensively
cover all the source points especially the residential estates
but only the town center. The town has huge piles of wastes
openly dumped along the road reserves, front yards and open
spaces as shown in palte 1. The existing temporary waste
receptacles are small and cannot handle the increasing
garbage load leading to open littering (plate 2).
Plate 1. Open Dumping on streets.
Plate 2. A waste receptacle in town center.
The objective of the study was to identify most suitable
areas within the municipality where all generated wastes
from the township could be temporary stored for separation,
sorting and bulking before final disposal and even recycling.
As the municipality expand, the volume of the waste stream
has increased tremendously leading to mixing of wastes
which would otherwise been separated for sale as recyclables
to generate revenue for supporting waste management
practice.
2. Determining Transfer Station Size and
Capacity
2.1. Nature of the Waste Transfer Station
The proposed transfer station is meant to serve the Embu
municipal solid wastes especially from the demolition and
construction, Yard and household trash. In line with this, the
facility would be planned to accept wastes from both private
and the public sources. In the choice of a more convenient
transfer station to adequately cater for the wastes from wards,
service area, amount of wastes generated, vehicles for
haulage, arrival and offloading duration and the existing
waste management facilities were considered. In this case
study, a direct dump station with a capacity of 70 tons per
day was adopted.
2.2. Calculating Optimum Holding Capacity
The formula was used to calculate the load capacity of the
desirable waste transfer station was the one adopted from
decision-Makers Guide to Solid Waste Management.
C = Nn x Pt x F x 60 x HW / [(Pt/Pc) x (W/Ln) x Tc] + B
Where; C is Station capacity (tons/day)
Pc is Collection vehicle payloads (tons)
W is Width of each dumping space (feet)
HW is Hours per day that waste is delivered
Tc is Time to unload each collection vehicle (minutes)
F Peaking factor (ratio of number of collection vehicles
received during an average 30 minute period to the number
received during a peak 30minute period)
Pt is Transfer trailer payload (tons)
B is Time to remove and replace each loaded trailer
(minutes)
Nn is Number of hoppers
Ln is Length of each hopper
(Source: Decision-Makers Guide to Solid Waste
Management, Second Ed, p. 4-23)
3. GIS and Solid Waste Management
3.1. Overview of Geographic Information Systems
Applications in Waste Management
Most literature reveal that GIS has been widely used in the
solid waste management. Several GIS integrated systems
have been implemented in the areas of suitability analysis,
planning and optimal garbage trucks routing studies. For
example, appropriate landfill sites selection (Ramuu &
Kennedy 1994, Kao & Lin 1996, Haastrup et al. 1998, Leao
et al. 2001, Ramasamy et al. 2002, Al-Jarrah & Abu-Qdais
2006), the location of recycling drop-off stations (Chang et
al. 2000), the precise estimation of solid waste generation
using the local population density and income group

4 Dickson Kinoti Kibetu and Daniel Muchiri: Using GIS to Select Ideal Sites for Municipal Wastes Transfer Station:
Case Study of Embu Municipality
distribution (Vijay et al. 2005).
For this reason, GIS has found more use because it can
handle different data formats simultaneously. In the planning
and management of Solid waste, varied data sets need to be
aggregated together to help in integrated understanding of the
fuzzy patterns of wastes generation. Based on this, GIS can
give analytical perspective of the existing situation and a
future trend can be predicted to help in the long can term
planning of waste management. In this study, GIS was be
used to integrate several datasets in a layer based approach
and help narrow down the search for suitable areas where a
municipality transfer facility could be constructed.
3.2. Site Selection Criteria
Identifying the most appropriate site for the location of any
waste management facility is usually challenging and time
consuming. In this case study, where the need was to identify
suitable areas from many wards in a municipality, several factors
such as Population, Slope, road networks and administrative
policies were considered most important. The criteria for
selection used was based on the area’s specifications with the
following variables having the most weight:
3.2.1. Topography
Usually a relatively gentle landscape was used because
such areas allow quick drainage and minimize construction
costs associated with the excavation and erection of retaining
walls. Similarly completely flat areas were avoided since
they were found not conducive especially if the Transfer
stations were multilevel buildings requiring vehicle access at
several levels of the facility would need a ramp to be
constructed. Therefore a slope of not less than 15% and not
greater than 25% were considered as gentles slopes
appropriate because of the existing area’s relief.
3.2.2. Space
The ability for expansion was not ignored because the
volume of wastes will keeping on increasing as more
residential and commercial buildings are constructed to cater
for the increasing housing demand for the area’s urban
population. Basing on the data gotten from daily collections
records at the cleansing department, monthly waste
projections were calculated for plan for a site which could
offer big roads for vehicles allowing incoming and outgoing
traffic to occupy space inside the facility’s compound and not
waiting along the public roads. To enhance the separation
from sensitive adjoining land uses, adequate open spaces are
considered to buffer the impacts of traffic noise expected to
be generated from the facility.
3.2.3. Transportation Routes
Access routes to and from the waste transfer Station
should help significantly minimise risks of accidents, Air
emissions and noise. In order to ensure efficient waste
collection, it was found that the proposed transfer station
should be located within the reach of most waste collection
routes preferentially less than 16 kilometers from the edge all
collection routes.
3.2.4. Land Use
The areas with minimal residential activities and more of
industrial use were considered appropriate as candidate sites
for the facility. Because the areas lie within a municipality,
Zoning ordinances and designated land uses were considered.
To reduce protests from the adjacent communities and
mitigate conflicting industrial uses, stakeholders drawn from
the township’s diverse population were consulted in
identifying areas not likely to suffer from clustering and
encroachment. Using the existing land use zonings from the
department of physical planning, areas finally accepted as
ideal sites were screened and found to meet the council by
law on zoning and could have minimal impacts on the
surrounding people.
4. Data and Materials
Mainly primary data was used in this study in the form of
cadastral maps and attribute data. Catalinx Spatial Builder
was used for digitization and Vectorisation of the township
cadastre map while Idrisi Kilimanjaro was used for spatial
modeling and analysis.
4.1. Methodology
This study used both qualitative and quantitative data. The
Methodology adopted for this case study included Ground
based analysis, Data modeling and Analysis within GIS
Environment. Questionnaires were used to collect data about
the residents’ opinions on the municipal council’s input to the
solid waste management.
Questionnaires sought to know the respondents’ area of
resident, their conversant with the municipal council’s
bylaws and what they thought could be done to avert the
problems of waste disposal. Personal face to face interviews
were also used. Four interviews were carried out on district
environmental officer, cleansing superintendent, public
health officer and physical planning officer of Embu. Several
open observations were done by visiting the waste loading
and offloading areas, the dump site, the waste receptacles and
residential estates. Photographs taken from the sites formed
the basis for understanding and analysing the current waste
situation in the selected estates.
GIS was used in modeling, analysis and a decision support
system. GIS modeling and analysis were carried out using
Idrisi Kilimanjaro. Spatial data was generated through
digitization of a cadastral sheet of the scale 1:50000 for
Embu municipality boundary (figure 2.) This was done in
Catalinx Spatial Builder software to generate coverage for
the study area. Attribute data for the layers were developed
from primary data, the municipal council of Embu strategic
plan and the cadastre sheet of the study area.
The data in the form of maps are entered and then each
positive attribute or exclusionary criteria for siting transfer
stations was layered on top of other input maps to narrow
down potential site locations. The resultant maps show the
relationship between input maps layers which were subjected
to evaluate based on the existing municipality by laws.

International Journal of Science, Technology and Society 2016; 4(2-1): 1-7 5
Figure 2. Cadastral sheet of Embu Township Municipality.
4.2. Modeling and Analysis Within a GIS Platform (Idrisi
Kilimanjaro)
The study area’s cadastre sheet was obtained from the
physical planning department in Embu. It was scanned and
then geo-referenced in UTM Zone 37 South, Arc1960 datum
and spheroid of Clarke 1880 in Catalinx Spatial Builder
software. Features of interest developed from the cadastre
Sheet include roads, wards and contours. These spatial
features were digitized from the cadastre sheet. Other
attribute information was gotten from the Municipal Council
of Embu strategic plan 2007/2012.
Most of the attribute information was collected from the
field survey. The resultant products were municipality land
use map, roads networks, population and slope layers for use
in spatial analysis. For ease of analysis, rasterisation was
done on the vector layers were exported to Idrisi32 and
converted to Raster. Buffering was used to calculate the
zones beyond the existing receptacles and roads. Query by
attribute was used to identify the land uses existing in a given
area. Then Reclassification was used to create Boolean
images with the suitable land uses assigned a value of 1 and
Non-suitable areas a value of 0.
Positional coordinates were collected in the field using
Juno SD GPS receiver. Boolean images for each of the layers
were created and then overlaid to give a suitability map of
each layer.
Then the resultant map layers were overlaid together to get
preliminary sites for consideration. The final suitability map
was gotten by ranking the sites basing on then council
bylaws.
Figure 3. Conceptualized GIS methodology used in this study.
6 Dickson Kinoti Kibetu and Daniel Muchiri: Using GIS to Select Ideal Sites for Municipal Wastes Transfer Station:
Case Study of Embu Municipality
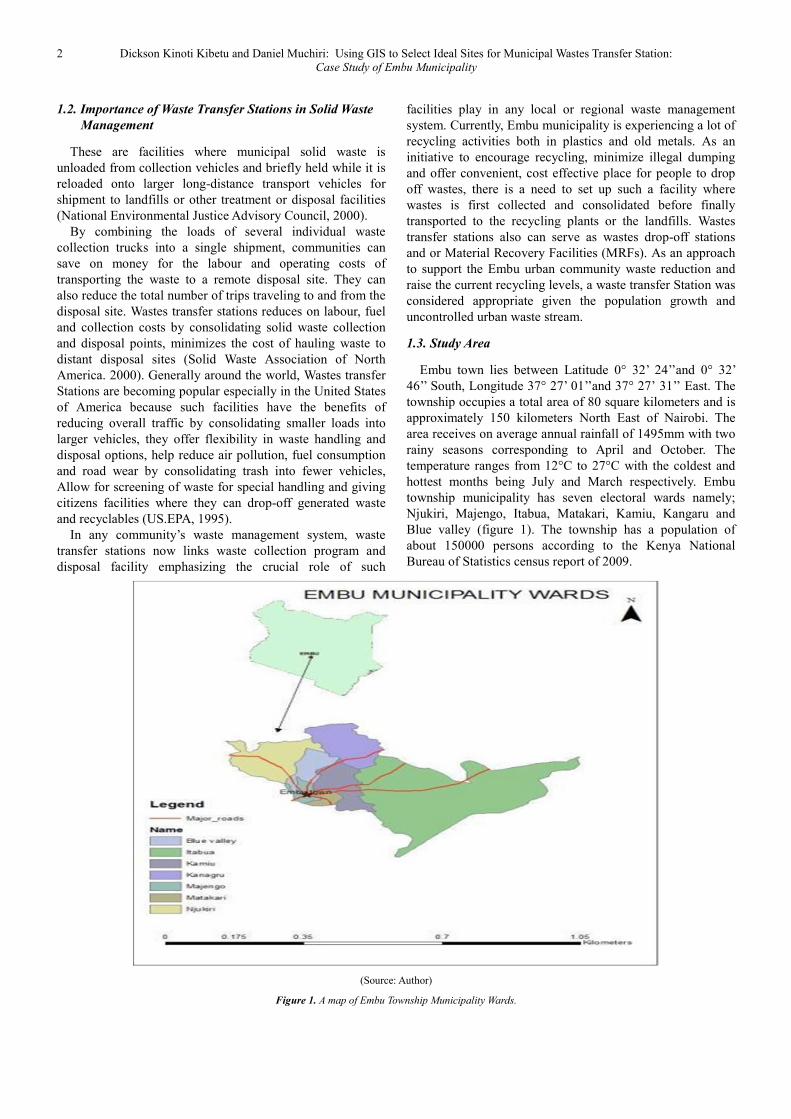
The various layers were converted into raster before
analysis. Roads were buffered at 50 meters from the road
edge to find suitable areas along the roads. Population layers
were created from the wards population data obtained from
the District Population office. The population for each
location was summed up to give the wards total population.
Then reclassification was done after querying to identify
those wards with a population of over 10,000 as a threshold
for densely Populated wards. Land uses were also
reclassified based on the council codes and those used in a
study done by Tardos Zain (2009).
Figure 4. Modeling and Analysis done with Idrisi Macro-modeler tool.
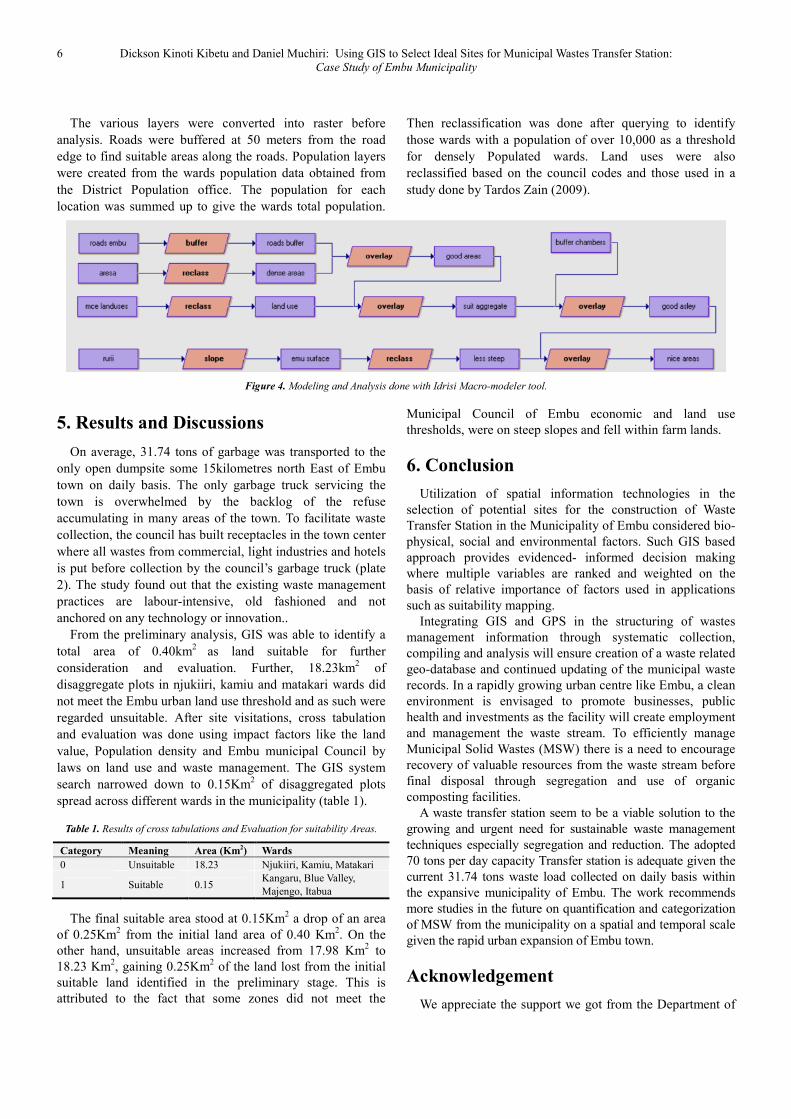
5. Results and Discussions
On average, 31.74 tons of garbage was transported to the
only open dumpsite some 15kilometres north East of Embu
town on daily basis. The only garbage truck servicing the
town is overwhelmed by the backlog of the refuse
accumulating in many areas of the town. To facilitate waste
collection, the council has built receptacles in the town center
where all wastes from commercial, light industries and hotels
is put before collection by the council’s garbage truck (plate
2). The study found out that the existing waste management
practices are labour-intensive, old fashioned and not
anchored on any technology or innovation..
From the preliminary analysis, GIS was able to identify a
total area of 0.40km2
as land suitable for further
consideration and evaluation. Further, 18.23km2 of
disaggregate plots in njukiiri, kamiu and matakari wards did
not meet the Embu urban land use threshold and as such were
regarded unsuitable. After site visitations, cross tabulation
and evaluation was done using impact factors like the land
value, Population density and Embu municipal Council by
laws on land use and waste management. The GIS system
search narrowed down to 0.15Km2 of disaggregated plots
spread across different wards in the municipality (table 1).
Table 1. Results of cross tabulations and Evaluation for suitability Areas.
Category Meaning Area (Km2) Wards
0 Unsuitable 18.23 Njukiiri, Kamiu, Matakari
1 Suitable 0.15 Kangaru, Blue Valley,
Majengo, Itabua
The final suitable area stood at 0.15Km2 a drop of an area
of 0.25Km2 from the initial land area of 0.40 Km
2. On the
other hand, unsuitable areas increased from 17.98 Km2 to
18.23 Km2, gaining 0.25Km
2 of the land lost from the initial
suitable land identified in the preliminary stage. This is
attributed to the fact that some zones did not meet the
Municipal Council of Embu economic and land use
thresholds, were on steep slopes and fell within farm lands.
6. Conclusion
Utilization of spatial information technologies in the
selection of potential sites for the construction of Waste
Transfer Station in the Municipality of Embu considered bio-
physical, social and environmental factors. Such GIS based
approach provides evidenced- informed decision making
where multiple variables are ranked and weighted on the
basis of relative importance of factors used in applications
such as suitability mapping.
Integrating GIS and GPS in the structuring of wastes
management information through systematic collection,
compiling and analysis will ensure creation of a waste related
geo-database and continued updating of the municipal waste
records. In a rapidly growing urban centre like Embu, a clean
environment is envisaged to promote businesses, public
health and investments as the facility will create employment
and management the waste stream. To efficiently manage
Municipal Solid Wastes (MSW) there is a need to encourage
recovery of valuable resources from the waste stream before
final disposal through segregation and use of organic
composting facilities.
A waste transfer station seem to be a viable solution to the
growing and urgent need for sustainable waste management
techniques especially segregation and reduction. The adopted
70 tons per day capacity Transfer station is adequate given the
current 31.74 tons waste load collected on daily basis within
the expansive municipality of Embu. The work recommends
more studies in the future on quantification and categorization
of MSW from the municipality on a spatial and temporal scale
given the rapid urban expansion of Embu town.
Acknowledgement
We appreciate the support we got from the Department of

International Journal of Science, Technology and Society 2016; 4(2-1): 1-7 7
physical planning of Embu district for giving us the cadastre
sheet of the study area, Department of Geomatic Engineering
and Geospatial Information Systems (GEGIS) at Jomo
Kenyatta University of Agriculture and Technology for the
Trimble Juno SB GPS receivers and for allowing us to use
their GIS and Remote Sensing lab for doing spatial analysis
of our data.
References
[1] National Environmental Justice Advisory Council. (2000) A Regulatory Strategy for Siting and Operating Waste Transfer Stations, (EPA500-R-00-001). Washington, DC.
[2] Solid Waste Association of North America. (2000) Certification Course Manual: Managing Transfer Station Systems. SWANA. Washington, DC.
[3] U.S. EPA, Office of Solid Waste and Emergency Response. 1995. Decision-Maker’s Guide to Solid Waste Management, Second Edition (EPA 530-R-95-023). Washington, DC.
[4] Global Waste Management Market Assessment (2007), Key Note Publications Ltd, March 1, 2007, 166 Pages - Pub ID: KEYL1470786
[5] Ramuu, N. & Kennedy, W. (1994) Heuristic algorithm to locate solid waste disposal site. Journal of Urban Planning and Development, 120, 14–21.
[6] Vijay, R., Gupta, A., Kalamdhad, A. S. & Devotta, S. (2005) Estimation and allocation of solid waste to bin through geographical information systems. Waste Management & Research, 23, 479–484.
[7] Haastrup, P., Maniezzo, V., Mattarelli, M., Mazzeo Rinaldi, F., Mendes, I. & Paruccini, M. (1998) A decision support system for urban waste management. European Journal of Operational Research, 109, 330–341.
[8] Leao, S., Bishop, I. & Evans, D. (2001) Assessing the demand of solid waste disposal in urban region by urban dynamics modeling in a GIS environment. Resources, Conservation and Recycling, 33, 289–313.
[9] Ramasamy, S. M., Kumanan, C. & Palanivel, K. (2002) GIS-based solutions for waste disposals: www.gisdevelopment.net/applications/miscallaneous/ misc030.htm (Oct. 26, 2014)
[10] Al-Jarrah, O. & Abu-Qdais, H. (2006) Municipal solid waste landfill siting using intelligent system. Waste Management, 26, 299–306.
[11] Chang, N. & Wei, Y. L. (2000) Siting recycling drop-off stations in urban area by genetic algorithm-based fuzzy multi objective nonlinear integer programming modeling. Fuzzy Sets and Systems, 14, 133–149.
[12] Tadros, Zain (2009) some aspects of solid waste disposal site selection: the case of Wadi Madoneh, Jordan', International Journal of Environmental Studies, 66: 2, 207-219.