Embed Size (px)
Citation preview
Using Health Informatics for Population Management
AMGA
Dennis Schneider, M.D. – CMO
Colorado Springs Health Partners, PC
Overview
Population Management Approach
Population Management Infrastructure
Analytic Tools
Outreach examples /results
Next steps
Lessons of population management
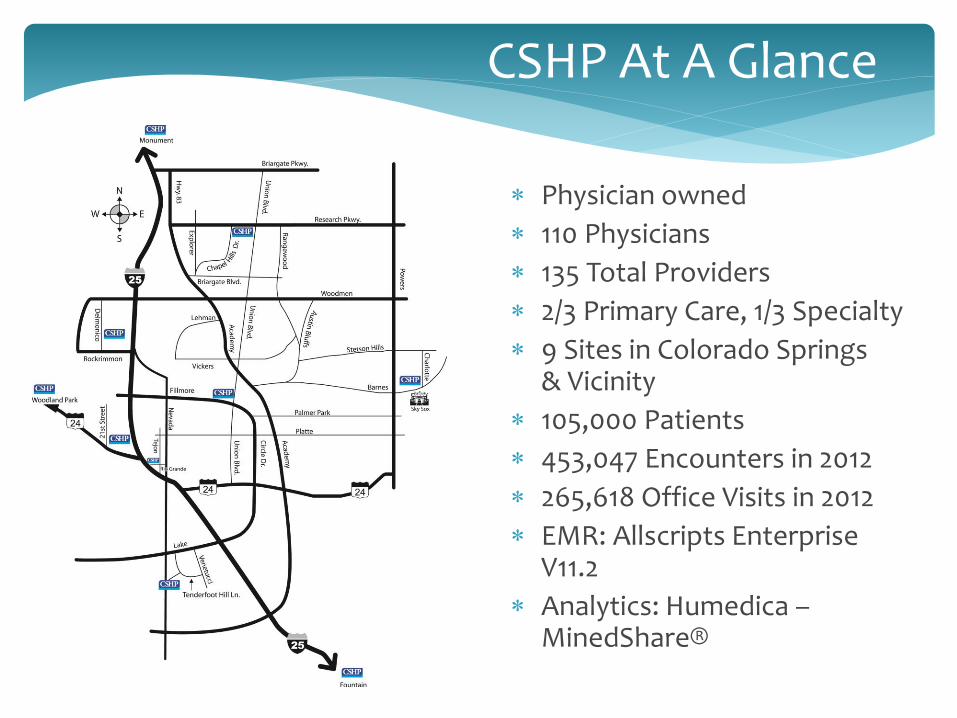
Physician owned
110 Physicians
135 Total Providers
2/3 Primary Care, 1/3 Specialty
9 Sites in Colorado Springs & Vicinity
105,000 Patients
453,047 Encounters in 2012
265,618 Office Visits in 2012
EMR: Allscripts Enterprise V11.2
Analytics: Humedica –MinedShare®
CSHP At A Glance
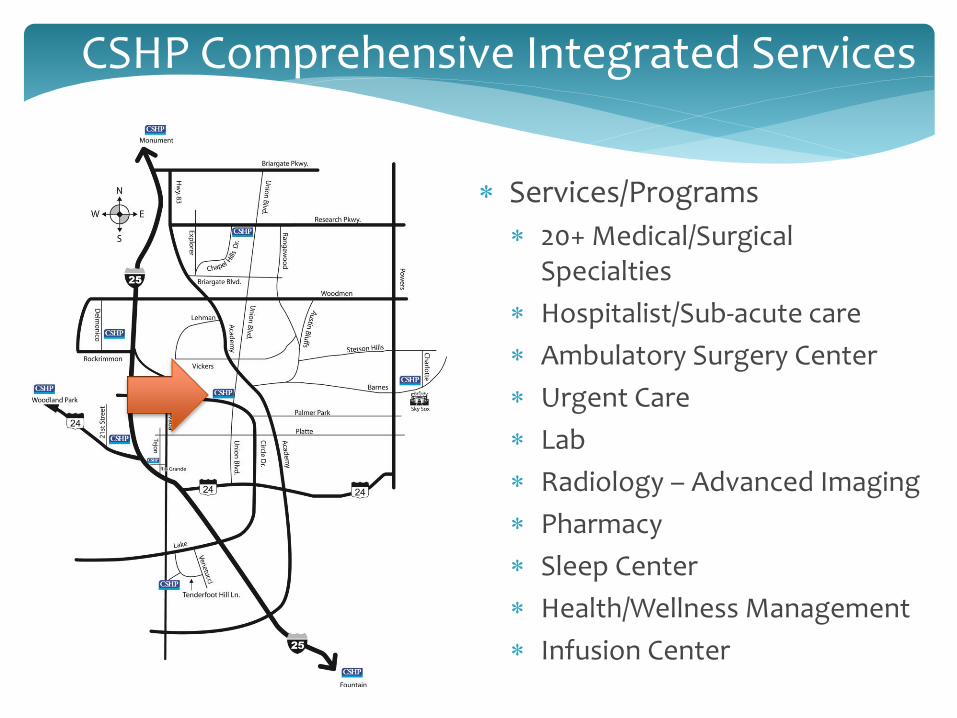
Services/Programs
20+ Medical/Surgical Specialties
Hospitalist/Sub-acute care
Ambulatory Surgery Center
Urgent Care
Lab
Radiology – Advanced Imaging
Pharmacy
Sleep Center
Health/Wellness Management
Infusion Center
CSHP Comprehensive Integrated Services
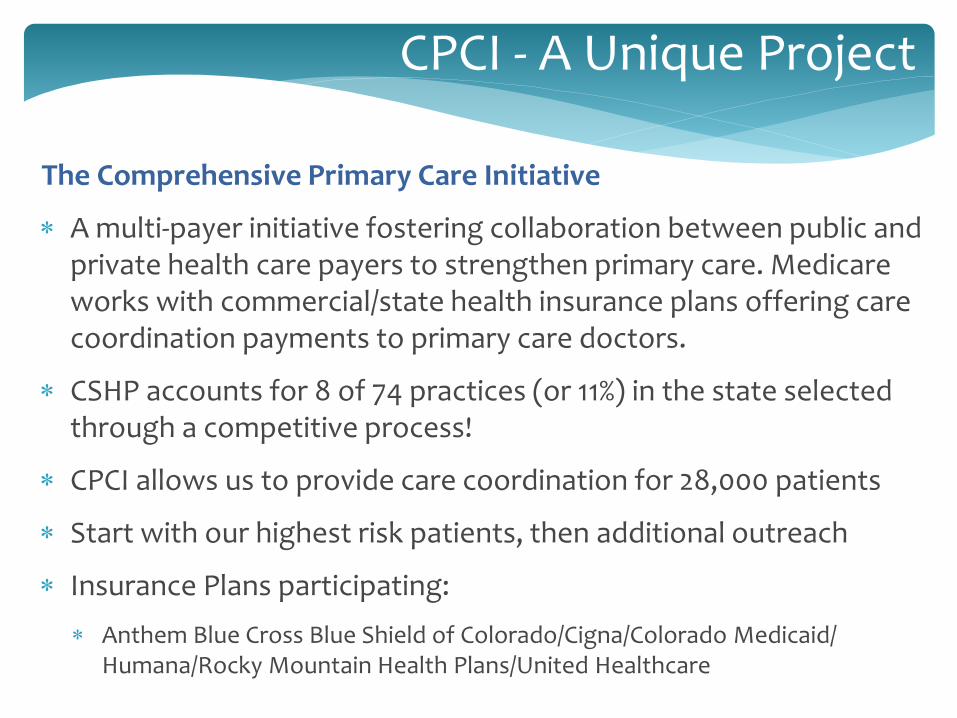
The Comprehensive Primary Care Initiative
A multi-payer initiative fostering collaboration between public and private health care payers to strengthen primary care. Medicare works with commercial/state health insurance plans offering care coordination payments to primary care doctors.
CSHP accounts for 8 of 74 practices (or 11%) in the state selected through a competitive process!
CPCI allows us to provide care coordination for 28,000 patients
Start with our highest risk patients, then additional outreach
Insurance Plans participating:
Anthem Blue Cross Blue Shield of Colorado/Cigna/Colorado Medicaid/ Humana/Rocky Mountain Health Plans/United Healthcare
CPCI - A Unique Project
Population Management is a Journey not a Destination
What is Population Management?

“Managing the complete health needs of not only the patients you see but also the
ones that you don’t see.”
Population Health Management Simple Definition
How Do You DO Population Management?
1. Define
2. Assign
3. Analyze
4. Focused outreach
Population Health Management 4 Basic Steps
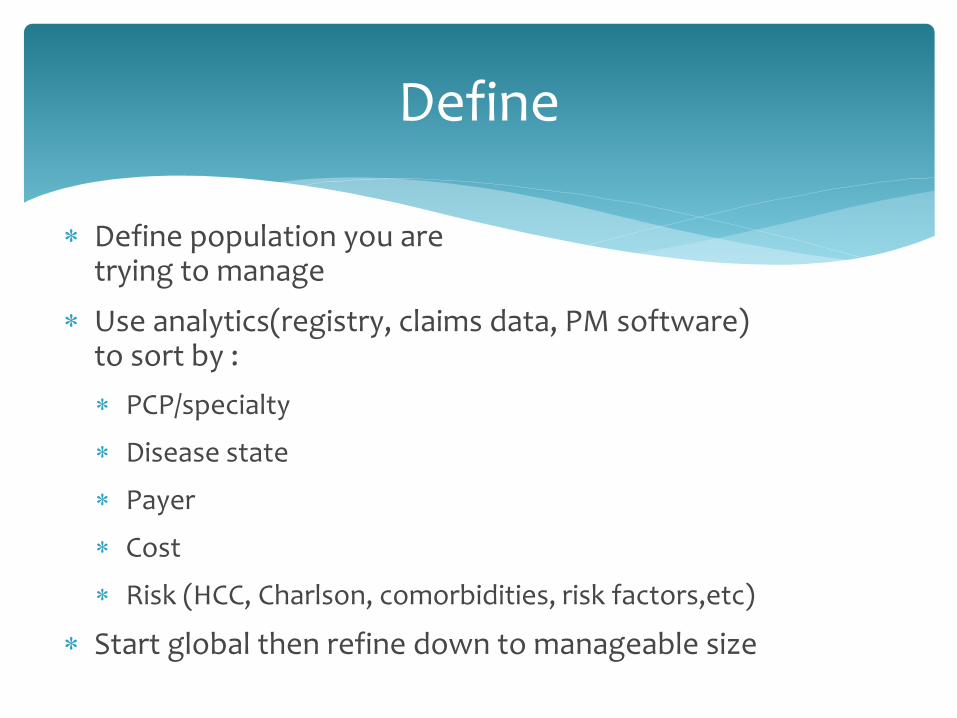
Define population you are trying to manage
Use analytics(registry, claims data, PM software) to sort by :
PCP/specialty
Disease state
Payer
Cost
Risk (HCC, Charlson, comorbidities, risk factors,etc)
Start global then refine down to manageable size
Define
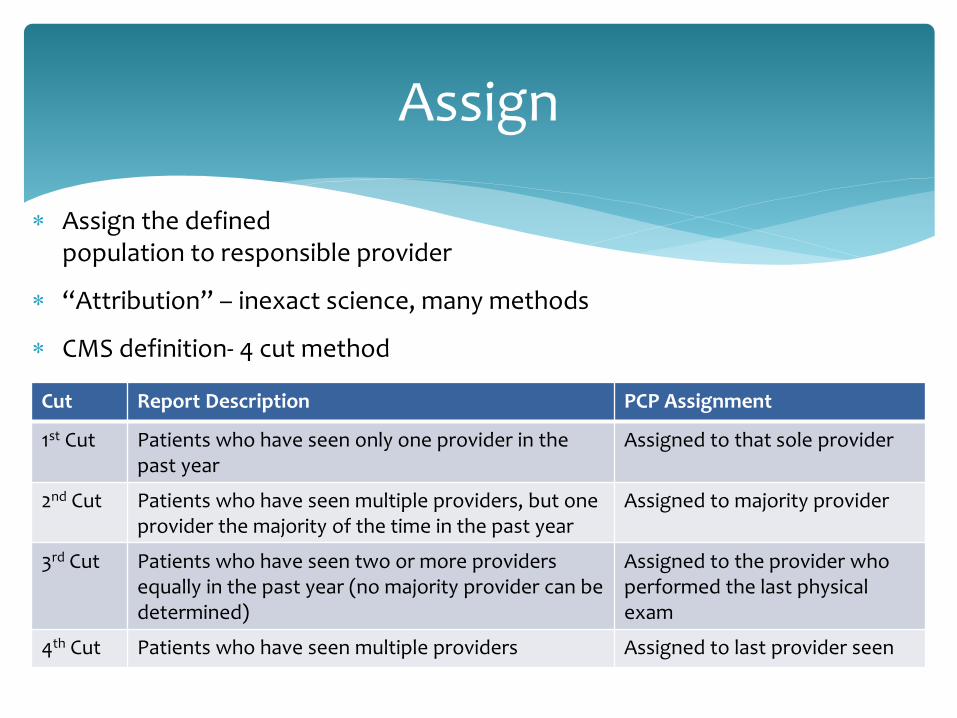
Assign the defined population to responsible provider
“Attribution” – inexact science, many methods
CMS definition- 4 cut method
Assign
Cut Report Description PCP Assignment
1st Cut Patients who have seen only one provider in the past year
Assigned to that sole provider
2nd Cut Patients who have seen multiple providers, but one provider the majority of the time in the past year
Assigned to majority provider
3rd Cut Patients who have seen two or more providers equally in the past year (no majority provider can be determined)
Assigned to the provider who performed the last physical exam
4th Cut Patients who have seen multiple providers Assigned to last provider seen
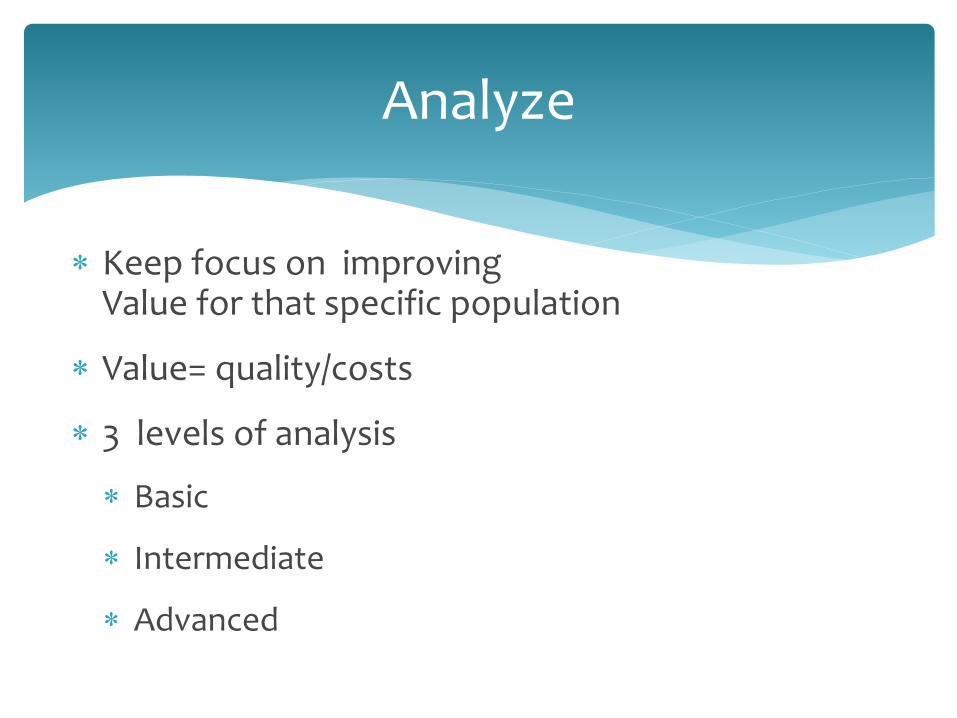
Keep focus on improving Value for that specific population
Value= quality/costs
3 levels of analysis
Basic
Intermediate
Advanced
Analyze
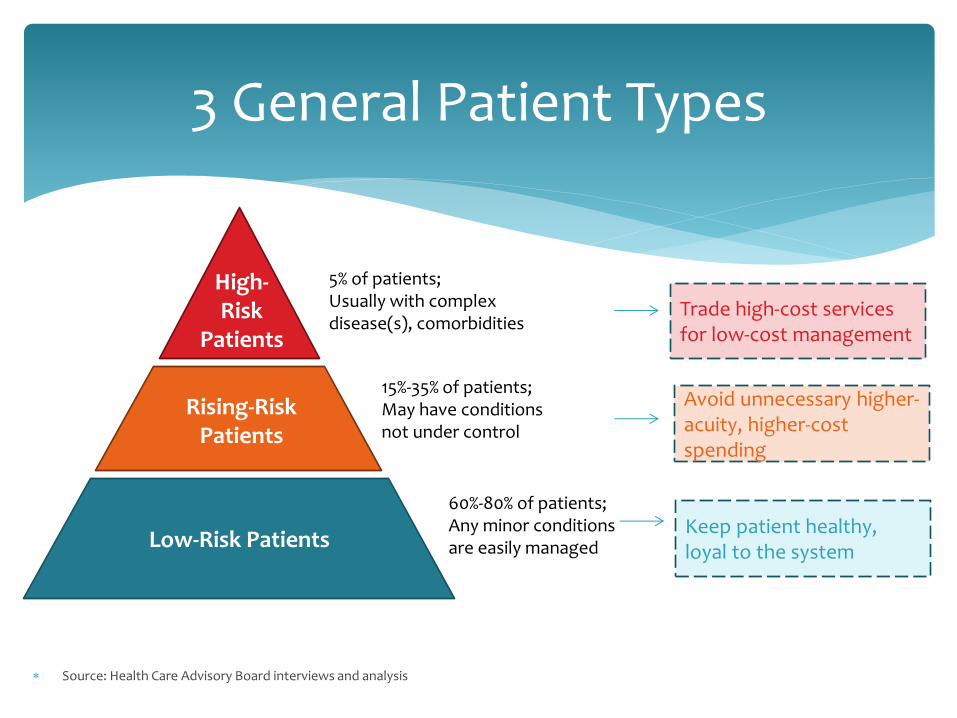
Source: Health Care Advisory Board interviews and analysis
3 General Patient Types
High- Risk
Patients
Rising-Risk Patients
Low-Risk Patients
5% of patients; Usually with complex disease(s), comorbidities
15%-35% of patients; May have conditions not under control
60%-80% of patients; Any minor conditions are easily managed
Trade high-cost services for low-cost management
Avoid unnecessary higher-acuity, higher-cost spending
Keep patient healthy, loyal to the system
Customized campaigns- Critical elements
Specific populations-manageable sizes
Specific clinical targets/goals-keep simple
Reasonable timeframes for completion
Measure Patient/Provider response rate
Measure/Report impact of campaign
Focused Outreach
“Gaps in care”
Includes preventative measures (screenings, immunizations, etc)
Disease specific metrics (A1c ,BP, LDL , etc)
Coding/documentation gaps (RAF scores, accurate dx for analytics year to year)
ANALYSIS BASIC
Cost/claims data
High-utilizers
Disease Specific cohorts(CHF,DM,COPD)
Comorbidities
Risk profiles (HCC codes, Charlson scores)
Analysis Intermediate
Disease specific predictive analytics (CHF, COPD,DM)
Risk Factor Based Population Stratification(BMI,Smoking, etc)
Value matrix-integrating quality and cost into analysis simultaneously; “quality at what cost”
Analysis Advanced
Which comes first?
Population management infrastructure vs clinical analytic tools
We chose infrastructure
Followed PCMH concepts
Putting Clinical Information Into Action
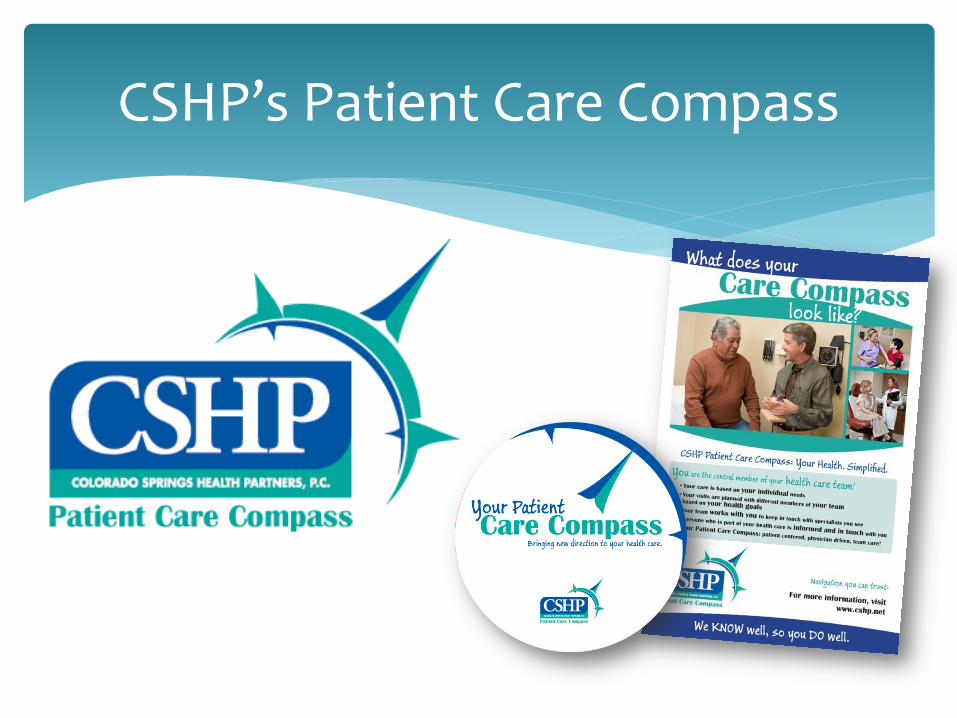
CSHP’s Patient Care Compass
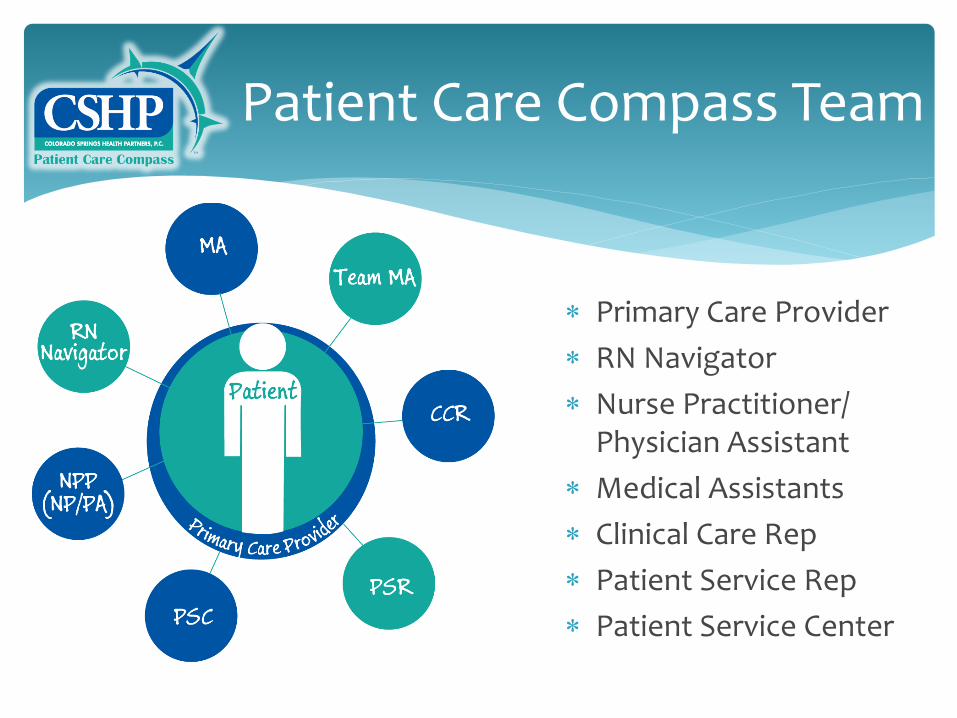
Patient Care Compass Team
Primary Care Provider
RN Navigator
Nurse Practitioner/ Physician Assistant
Medical Assistants
Clinical Care Rep
Patient Service Rep
Patient Service Center
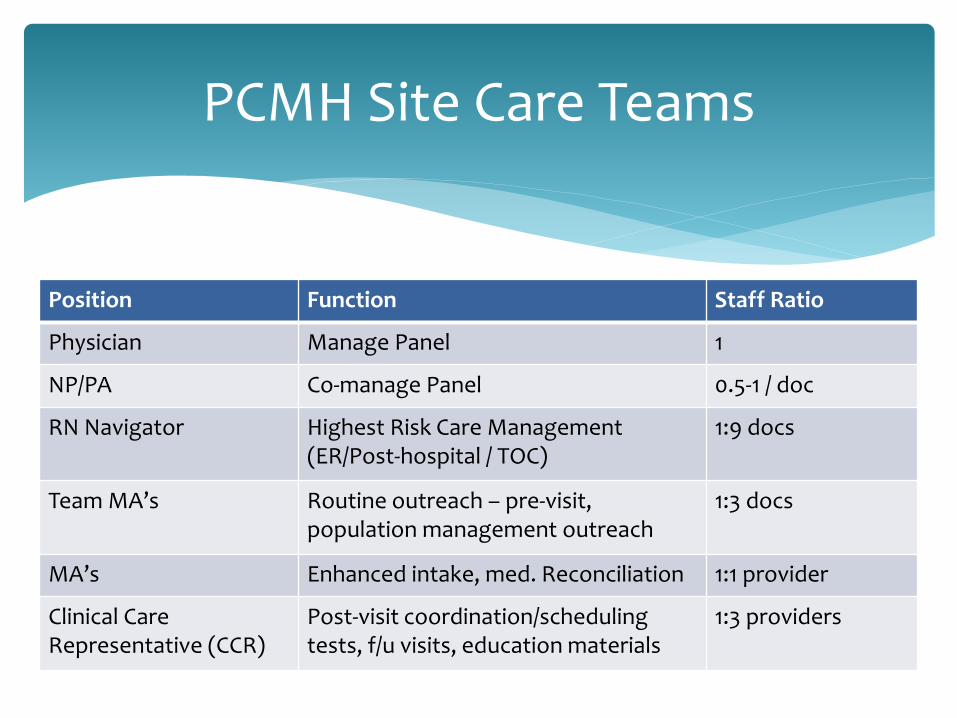
Position Function Staff Ratio
Physician Manage Panel 1
NP/PA Co-manage Panel 0.5-1 / doc
RN Navigator Highest Risk Care Management (ER/Post-hospital / TOC)
1:9 docs
Team MA’s Routine outreach – pre-visit, population management outreach
1:3 docs
MA’s Enhanced intake, med. Reconciliation 1:1 provider
Clinical Care Representative (CCR)
Post-visit coordination/scheduling tests, f/u visits, education materials
1:3 providers
PCMH Site Care Teams
New department – Headed by CMO
Staff- Director,1 clinical data analyst, 2 report writers
Primary role -Population Data Analytics/ Data reports
Secondary role –assist COO in redesign of workflows for efficient use of resources to do population management
Clinical Innovation Department (CID)
Analytic Tools Data, Data Everywhere
Payer claims data/reports
Precision BI- basic registry/ inquiry based reports
Humedica MinedShare® –main analytic tool

Humedica
Web based
Extensive data validation process
Discrete EMR data extraction with natural language processing
Can be used by trained clinicians not only IT
Gaps in care
Generates patient specific “worklists”
Disease specific predictive modeling
Anceta collaborative user group and benchmarking
© 2013 Humedica, Inc., All Rights Reserved 27
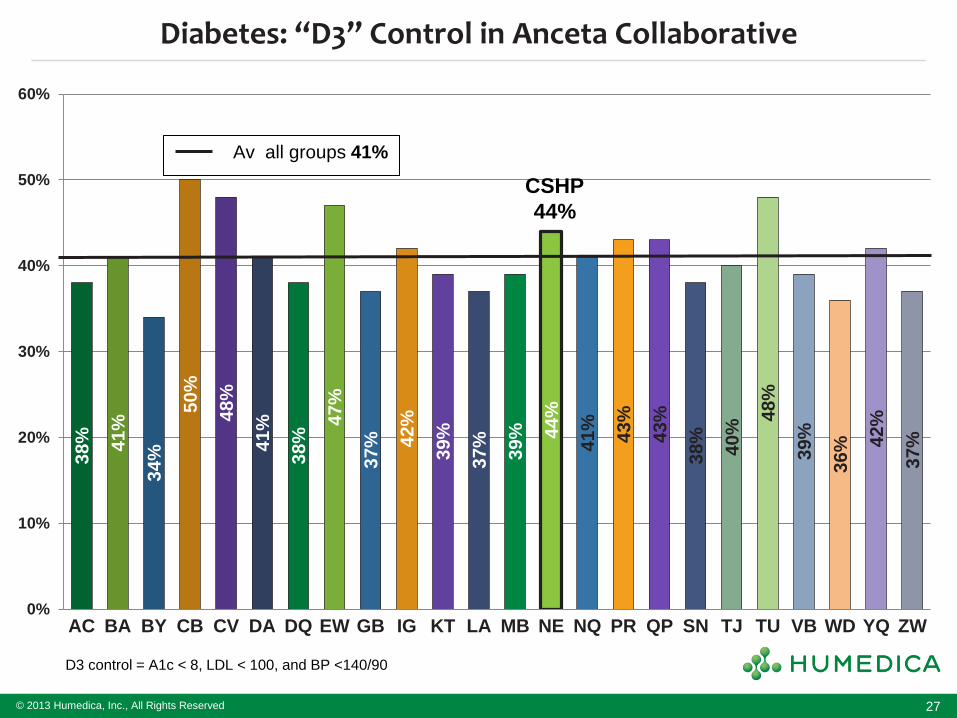
Diabetes: “D3” Control in Anceta Collaborative
D3 control = A1c < 8, LDL < 100, and BP <140/90
38%
41%
34%
50%
48%
41%
38%
47%
37%
42%
39%
37%
39%
44%
41%
43%
43%
38%
40%
48%
39%
36%
42%
37%
0%
10%
20%
30%
40%
50%
60%
AC BA BY CB CV DA DQ EW GB IG KT LA MB NE NQ PR QP SN TJ TU VB WD YQ ZW
CSHP
44%
Av all groups 41%
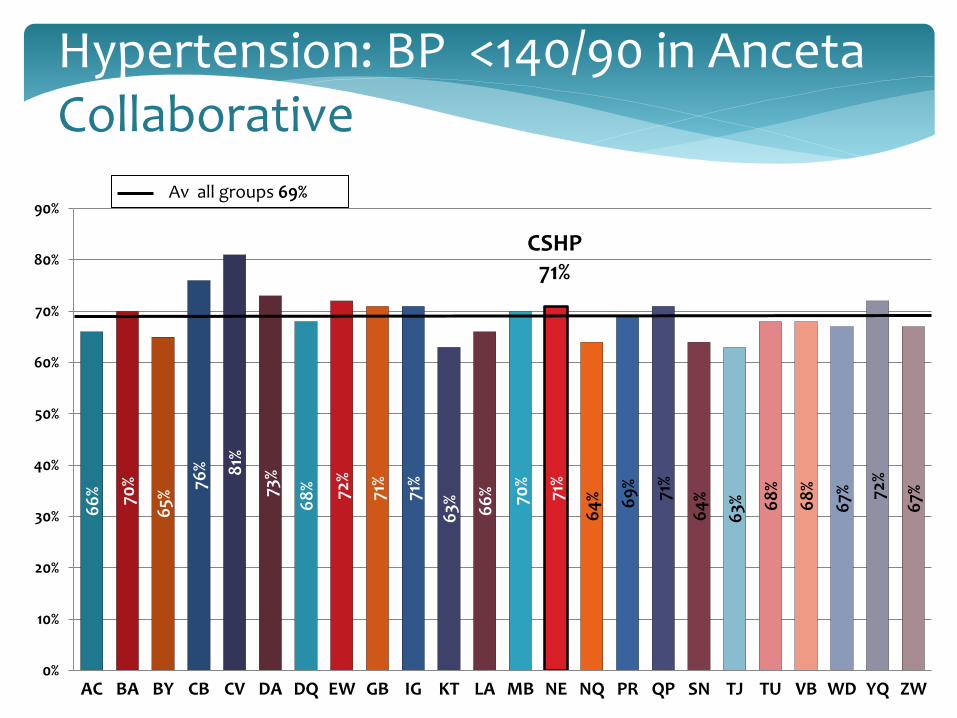
Hypertension: BP <140/90 in Anceta Collaborative
66
%
70%
65%
76%
81%
73%
68
%
72%
71%
71%
63%
66
%
70%
71%
64
%
69
%
71%
64
%
63%
68
%
68
%
67%
72%
67%
0%
10%
20%
30%
40%
50%
60%
70%
80%
90%
AC BA BY CB CV DA DQ EW GB IG KT LA MB NE NQ PR QP SN TJ TU VB WD YQ ZW
CSHP 71%
Av all groups 69%
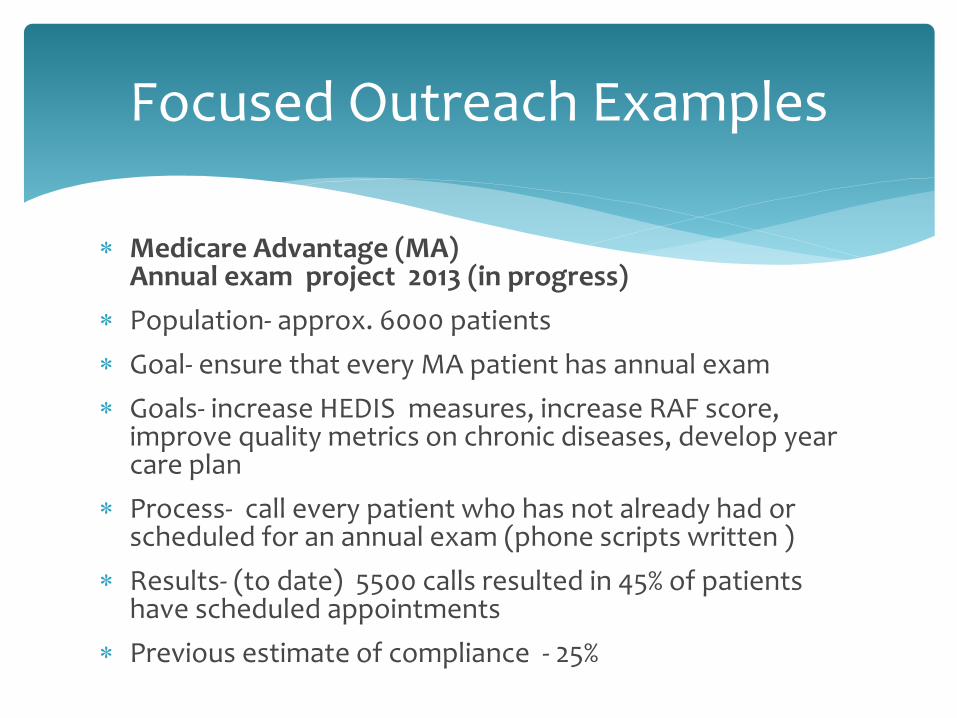
Focused Outreach Examples
Medicare Advantage (MA) Annual exam project 2013 (in progress)
Population- approx. 6000 patients
Goal- ensure that every MA patient has annual exam
Goals- increase HEDIS measures, increase RAF score, improve quality metrics on chronic diseases, develop year care plan
Process- call every patient who has not already had or scheduled for an annual exam (phone scripts written )
Results- (to date) 5500 calls resulted in 45% of patients have scheduled appointments
Previous estimate of compliance - 25%
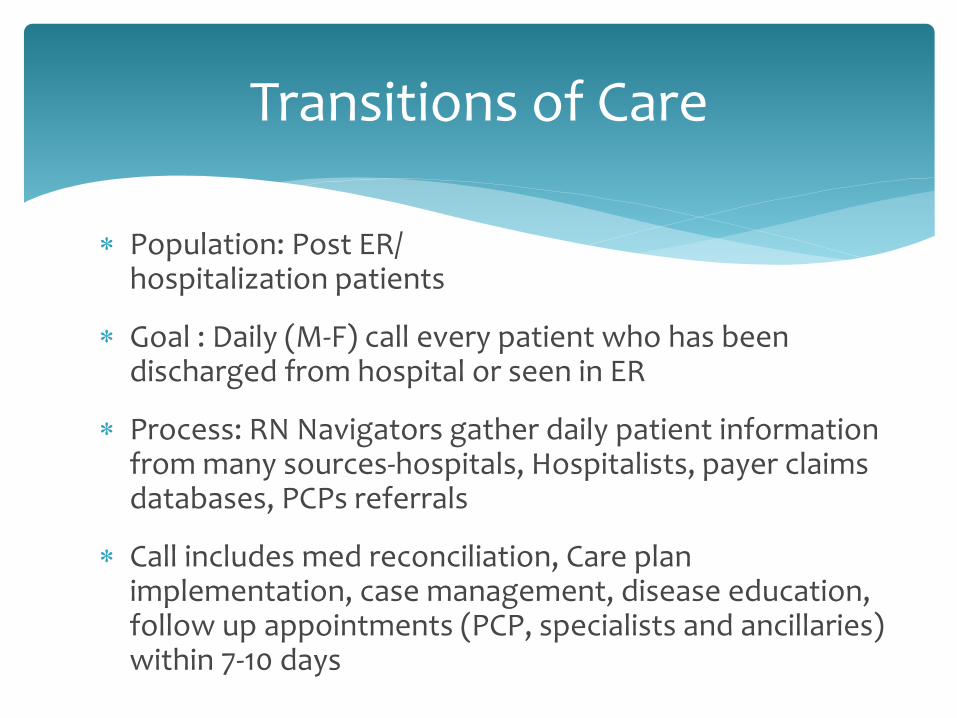
Population: Post ER/ hospitalization patients
Goal : Daily (M-F) call every patient who has been discharged from hospital or seen in ER
Process: RN Navigators gather daily patient information from many sources-hospitals, Hospitalists, payer claims databases, PCPs referrals
Call includes med reconciliation, Care plan implementation, case management, disease education, follow up appointments (PCP, specialists and ancillaries) within 7-10 days
Transitions of Care
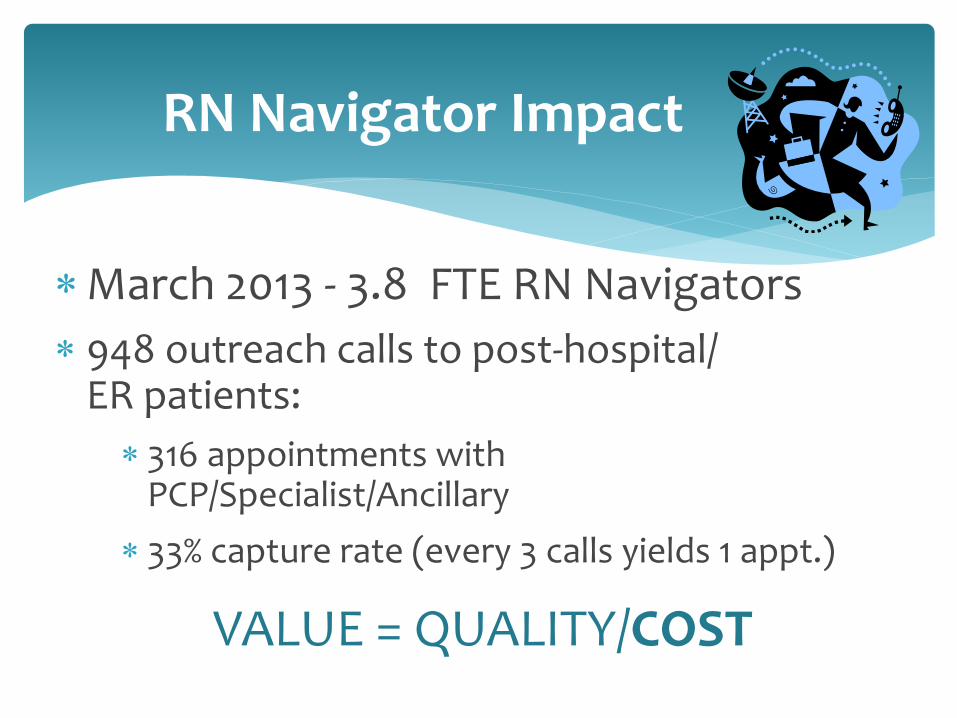
March 2013 - 3.8 FTE RN Navigators
948 outreach calls to post-hospital/ ER patients:
316 appointments with PCP/Specialist/Ancillary
33% capture rate (every 3 calls yields 1 appt.)
RN Navigator Impact
VALUE = QUALITY/COST
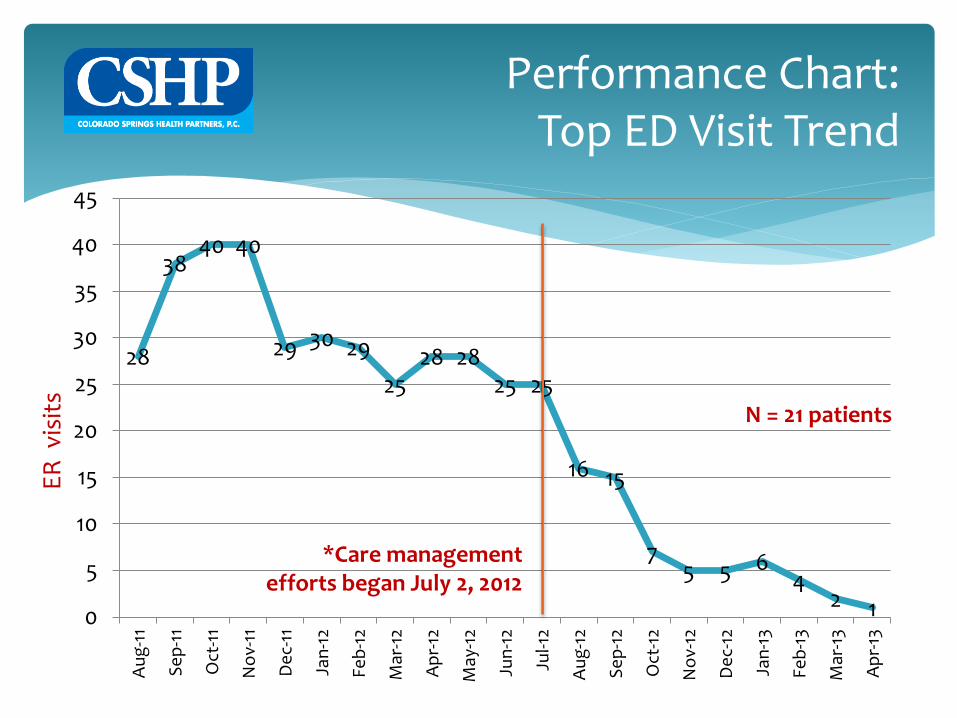
Performance Chart: Top ED Visit Trend
28
38 40 40
29 30 29
25 28 28
25 25
16 15
7 5 5 6
4 2 1 0
5
10
15
20
25
30
35
40
45
Au
g-1
1
Se
p-1
1
Oct
-11
No
v-11
De
c-11
Jan
-12
Feb
-12
Mar
-12
Ap
r-12
May
-12
Jun
-12
Jul-1
2
Au
g-1
2
Se
p-1
2
Oct
-12
No
v-12
De
c-12
Jan
-13
Feb
-13
Mar
-13
Ap
r-13
*Care management efforts began July 2, 2012
ER
vis
its
N = 21 patients
Individual/Site PCP BP performance report
Retraining all MAs on proper BP measurement technique
Adopting BP med algorithm
Outreach calls to identified patients out of control
Defined goal of minimum 5% improvement over baseline with some compensation at risk
Hypertension Measure UP/Pressure Down Campaign
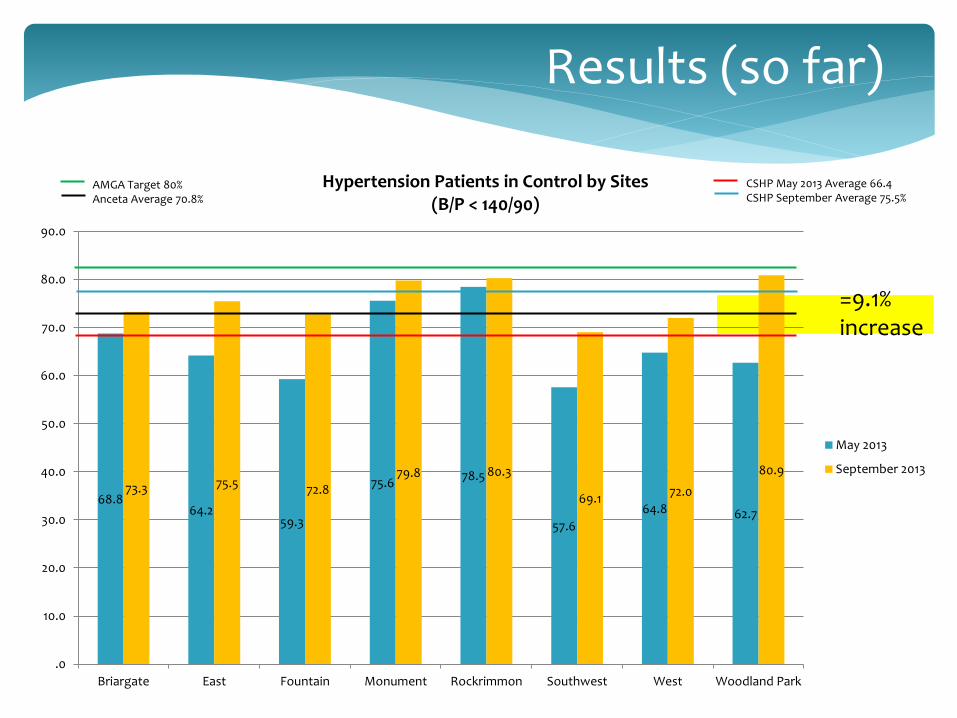
Results (so far)
68.8 64.2
59.3
75.6 78.5
57.6
64.8 62.7
73.3 75.5 72.8
79.8 80.3
69.1 72.0
80.9
.0
10.0
20.0
30.0
40.0
50.0
60.0
70.0
80.0
90.0
Briargate East Fountain Monument Rockrimmon Southwest West Woodland Park
Hypertension Patients in Control by Sites (B/P < 140/90)
May 2013
September 2013
AMGA Target 80% Anceta Average 70.8%
CSHP May 2013 Average 66.4 CSHP September Average 75.5%
=9.1% increase
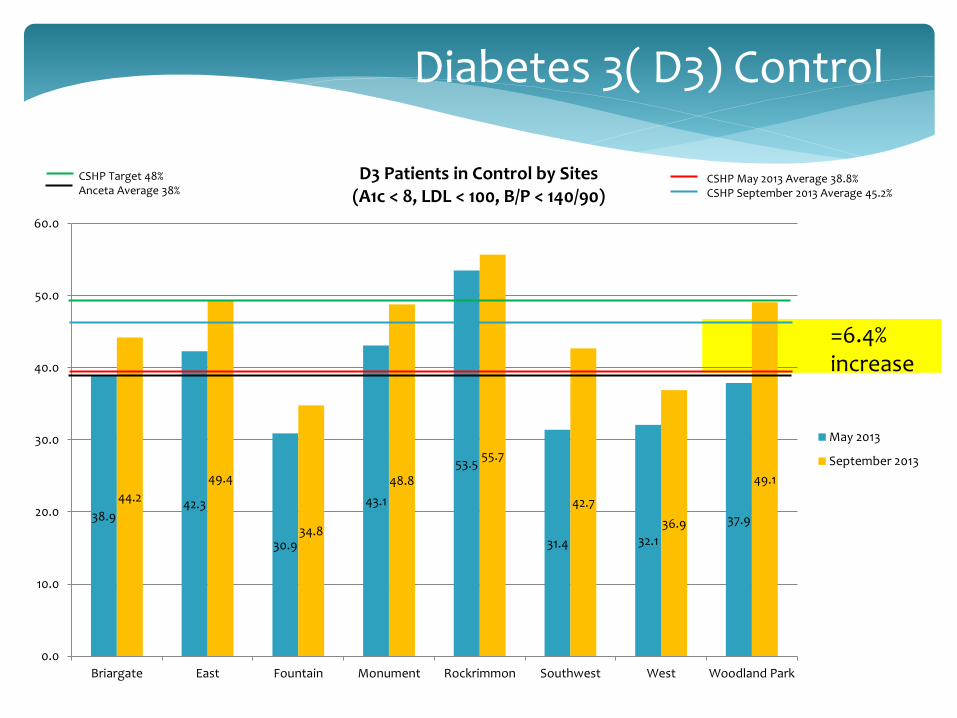
Diabetes 3( D3) Control
38.9 42.3
30.9
43.1
53.5
31.4 32.1
37.9
44.2
49.4
34.8
48.8
55.7
42.7
36.9
49.1
0.0
10.0
20.0
30.0
40.0
50.0
60.0
Briargate East Fountain Monument Rockrimmon Southwest West Woodland Park
D3 Patients in Control by Sites (A1c < 8, LDL < 100, B/P < 140/90)
May 2013
September 2013
CSHP Target 48% Anceta Average 38%
CSHP May 2013 Average 38.8% CSHP September 2013 Average 45.2%
=6.4% increase
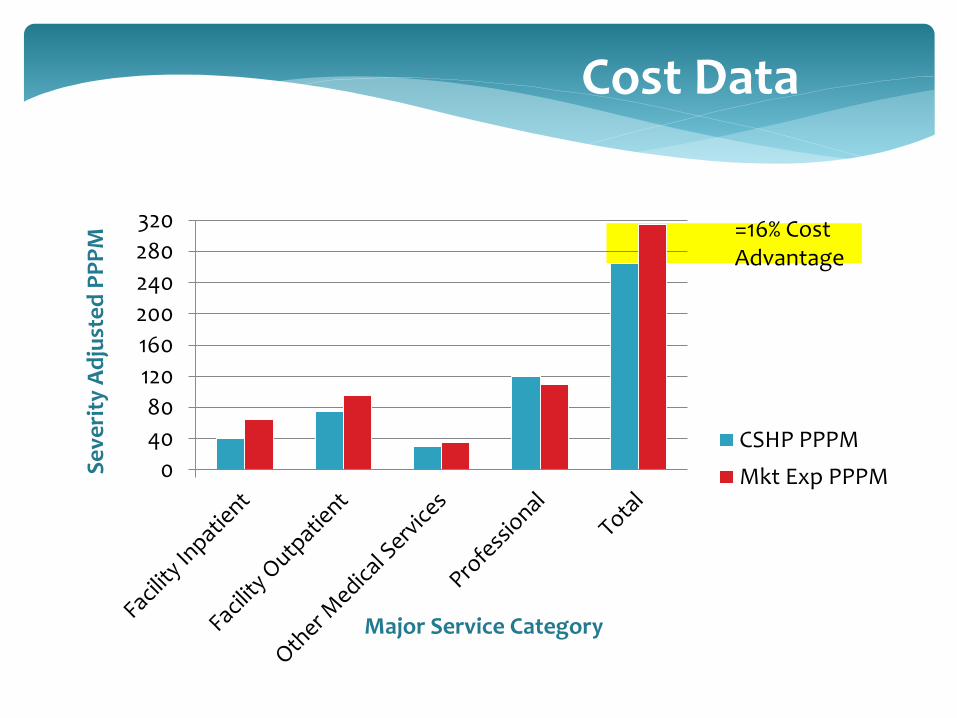
0
40
80
120
160
200
240
280
320
CSHP PPPM
Mkt Exp PPPMSe
veri
ty A
dju
ste
d P
PP
M
Major Service Category
Cost Data
=16% Cost Advantage
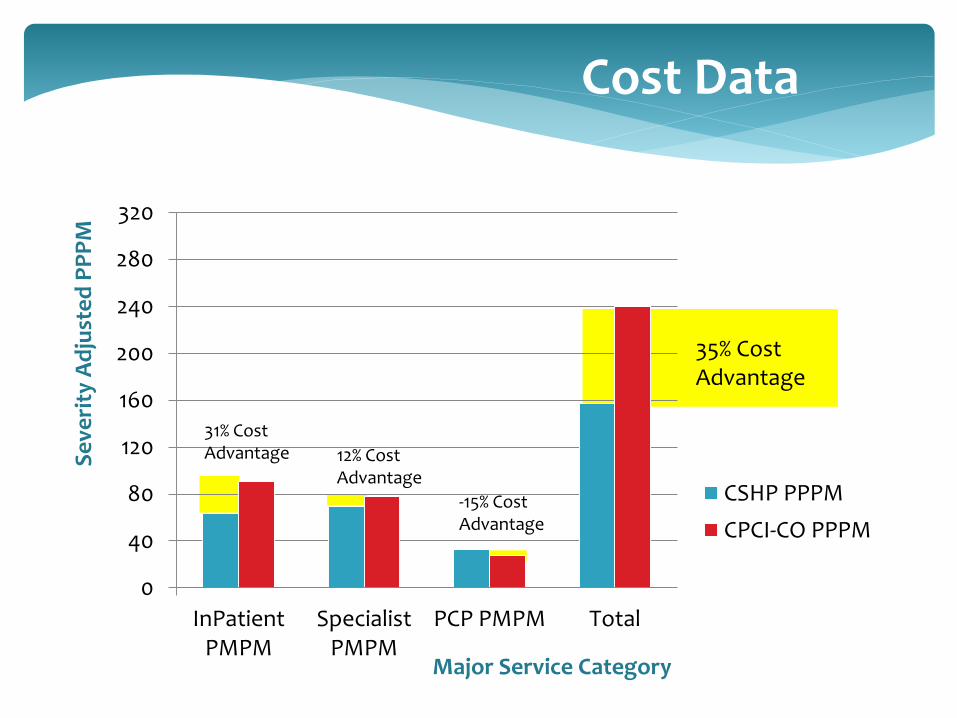
0
40
80
120
160
200
240
280
320
InPatientPMPM
SpecialistPMPM
PCP PMPM Total
CSHP PPPM
CPCI-CO PPPM
Se
veri
ty A
dju
ste
d P
PP
M
Major Service Category
35% Cost Advantage
31% Cost Advantage 12% Cost
Advantage
-15% Cost Advantage
Cost Data
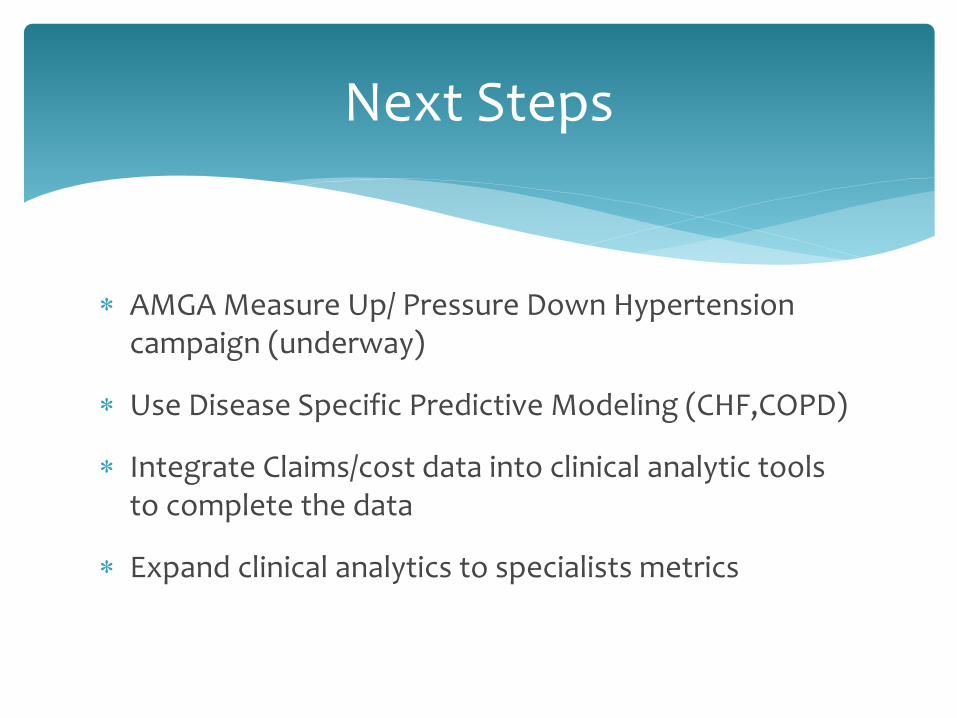
Next Steps
AMGA Measure Up/ Pressure Down Hypertension campaign (underway)
Use Disease Specific Predictive Modeling (CHF,COPD)
Integrate Claims/cost data into clinical analytic tools to complete the data
Expand clinical analytics to specialists metrics
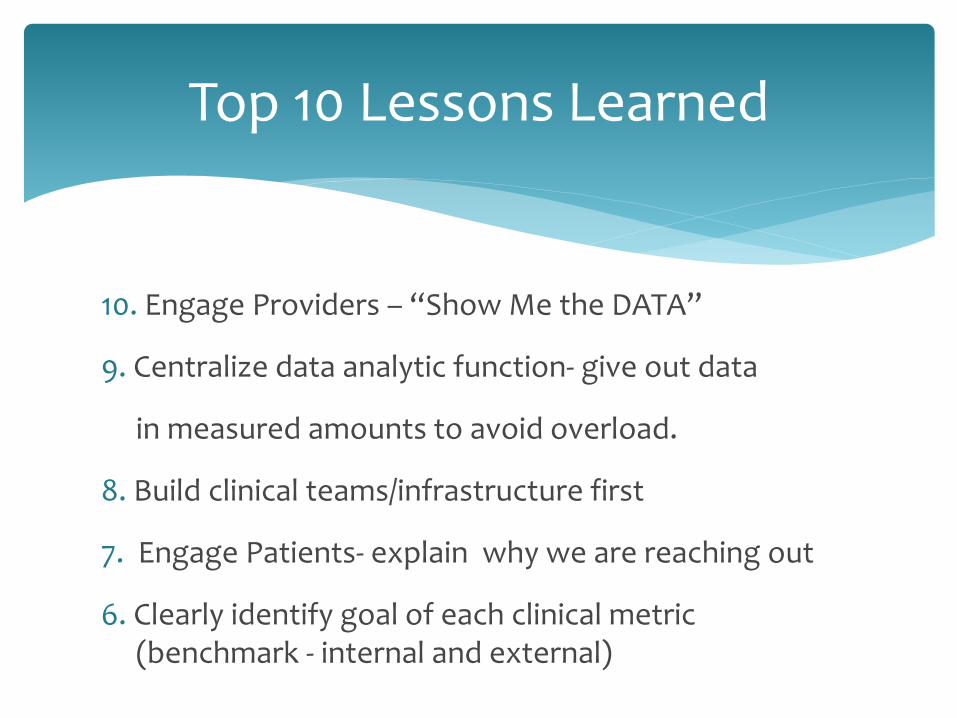
Top 10 Lessons Learned
10. Engage Providers – “Show Me the DATA”
9. Centralize data analytic function- give out data
in measured amounts to avoid overload.
8. Build clinical teams/infrastructure first
7. Engage Patients- explain why we are reaching out
6. Clearly identify goal of each clinical metric (benchmark - internal and external)
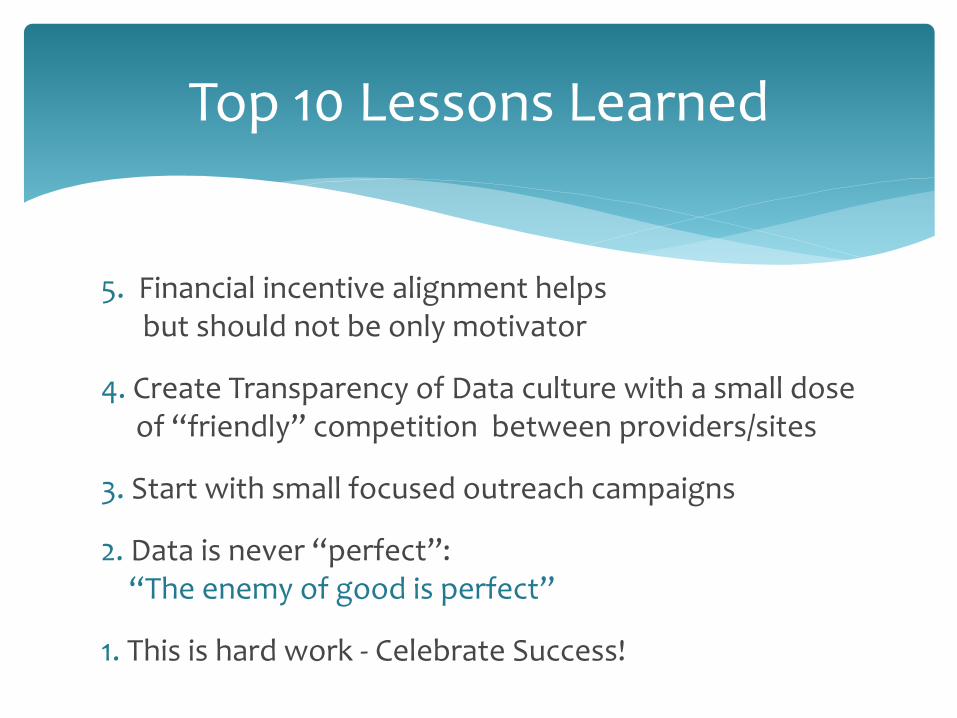
5. Financial incentive alignment helps but should not be only motivator
4. Create Transparency of Data culture with a small dose of “friendly” competition between providers/sites
3. Start with small focused outreach campaigns
2. Data is never “perfect”: “The enemy of good is perfect”
1. This is hard work - Celebrate Success!
Top 10 Lessons Learned

QUESTIONS?
THANK YOU!