Embed Size (px)
Citation preview
Corporate Headquarters: Evotec AG, Manfred Eigen Campus, Essener Bogen 7, 22419 Hamburg, Germany Email: [email protected] Web: www.evotec.com
High Density Multi Electrode Array: a new tool to monitor seizure-like activity
evoked by different convulsant drugs
1Sessolo M., 1Ugolini A., 2Maccione A., 2Gandolfo M., 1Corsi M., 1Virginio C.
1Aptuit Srl, an Evotec Company, Verona, Italy; 23Brain AG, Wadenswil, Switzerland
Epilepsy is a neurological disorder characterized by recurrent and sustained neuronal discharges. Different
approaches have been used to evoke seizure-like activity but chemoconvulsants are the most used. In this work, we
challenged mouse hippo-cortical slices with different compounds. Activity evoked by acute application of these
compounds was monitored through high-density multi electrode array (HD-MEA) in order to characterize in time and
space seizure like activity. In particular we challenged slices with kainic acid (KA, 10 µM) and the high-selective
agonist (RS)-2-Amino-3-(3-hydroxy-5-tert-butylisoxazol-4-yl) propanoic acid (ATPA, 10 µM) in order to acivate kainate
receptors. Furthermore, we compare the effect of these compounds with the convulsant 4-aminopyridine (4-AP, 100
µM), the voltage-dependent potassium channels blocker.
Introduction The aim of this work is to characterize different patterns of seizure like activity evoked by different
compounds with HD-MEA.
All three compounds tested can activate cortico-hippocampal slices
but with different outcomes.
Although active in cortex, consecutive applications of 10 µM kainic
acid evoke a poor seizure-like activity in hippocampus.
100 µM 4-AP effect is characterized by high variability in both cortex
and hippocampus.
Consecutive 10 µM ATPA applications evoke reproducible seizure-like
activity in both hippocampus and cortex.
ATPA represents a useful tool to investigate the effect of new molecule
in acute seizure-like activity.
Take home message
040.04
Seizure-like activity evoked by acute application of 4AP (100 µM) in mice hippocampus and cortex
0
200
400
600
800
1000
# a
cti
ve c
han
nels
1st
cm
pd
ap
plicati
on
0
2
4
6
8
10
# e
ven
t /
min
1st
cm
pd
ap
plicati
on
0
100
200
300
400
500
Half a
cti
ve c
han
nels
tim
e (
s)
1st
cm
pd
ap
plicati
on
0
20
40
60
80
100
en
erg
y /
min
1st
cm
pd
ap
plicati
on
5
0 1st 2nd 3rd 4th
number of cmpd application
norm
aliz
ed v
alu
e
10
0 1st 2nd 3rd 4th
number of cmpd application
norm
aliz
ed v
alu
e
3
0 1st 2nd 3rd 4th
number of cmpd application
norm
aliz
ed v
alu
e
6
0 1st 2nd 3rd 4th
number of cmpd application
norm
aliz
ed v
alu
e
0
400
800
1200
# a
cti
ve c
han
nels
1st
cm
pd
ap
plicati
on
0
2
4
6
8
10
# e
ven
t /
min
1st
cm
pd
ap
plicati
on
0
100
200
300
400
500
Half a
cti
ve c
han
nels
tim
e (
s)
1st
cm
pd
ap
plicati
on
0
50
100
150
200
en
erg
y /
min
1st
cm
pd
ap
plicati
on
60
0 1st 2nd 3rd 4th
number of cmpd application
norm
aliz
ed v
alu
e
10
0 1st 2nd 3rd 4th
number of cmpd application
norm
aliz
ed v
alu
e
6
0 1st 2nd 3rd 4th
number of cmpd application
norm
aliz
ed v
alu
e
3
0 1st 2nd 3rd 4th
number of cmpd application
norm
aliz
ed v
alu
e
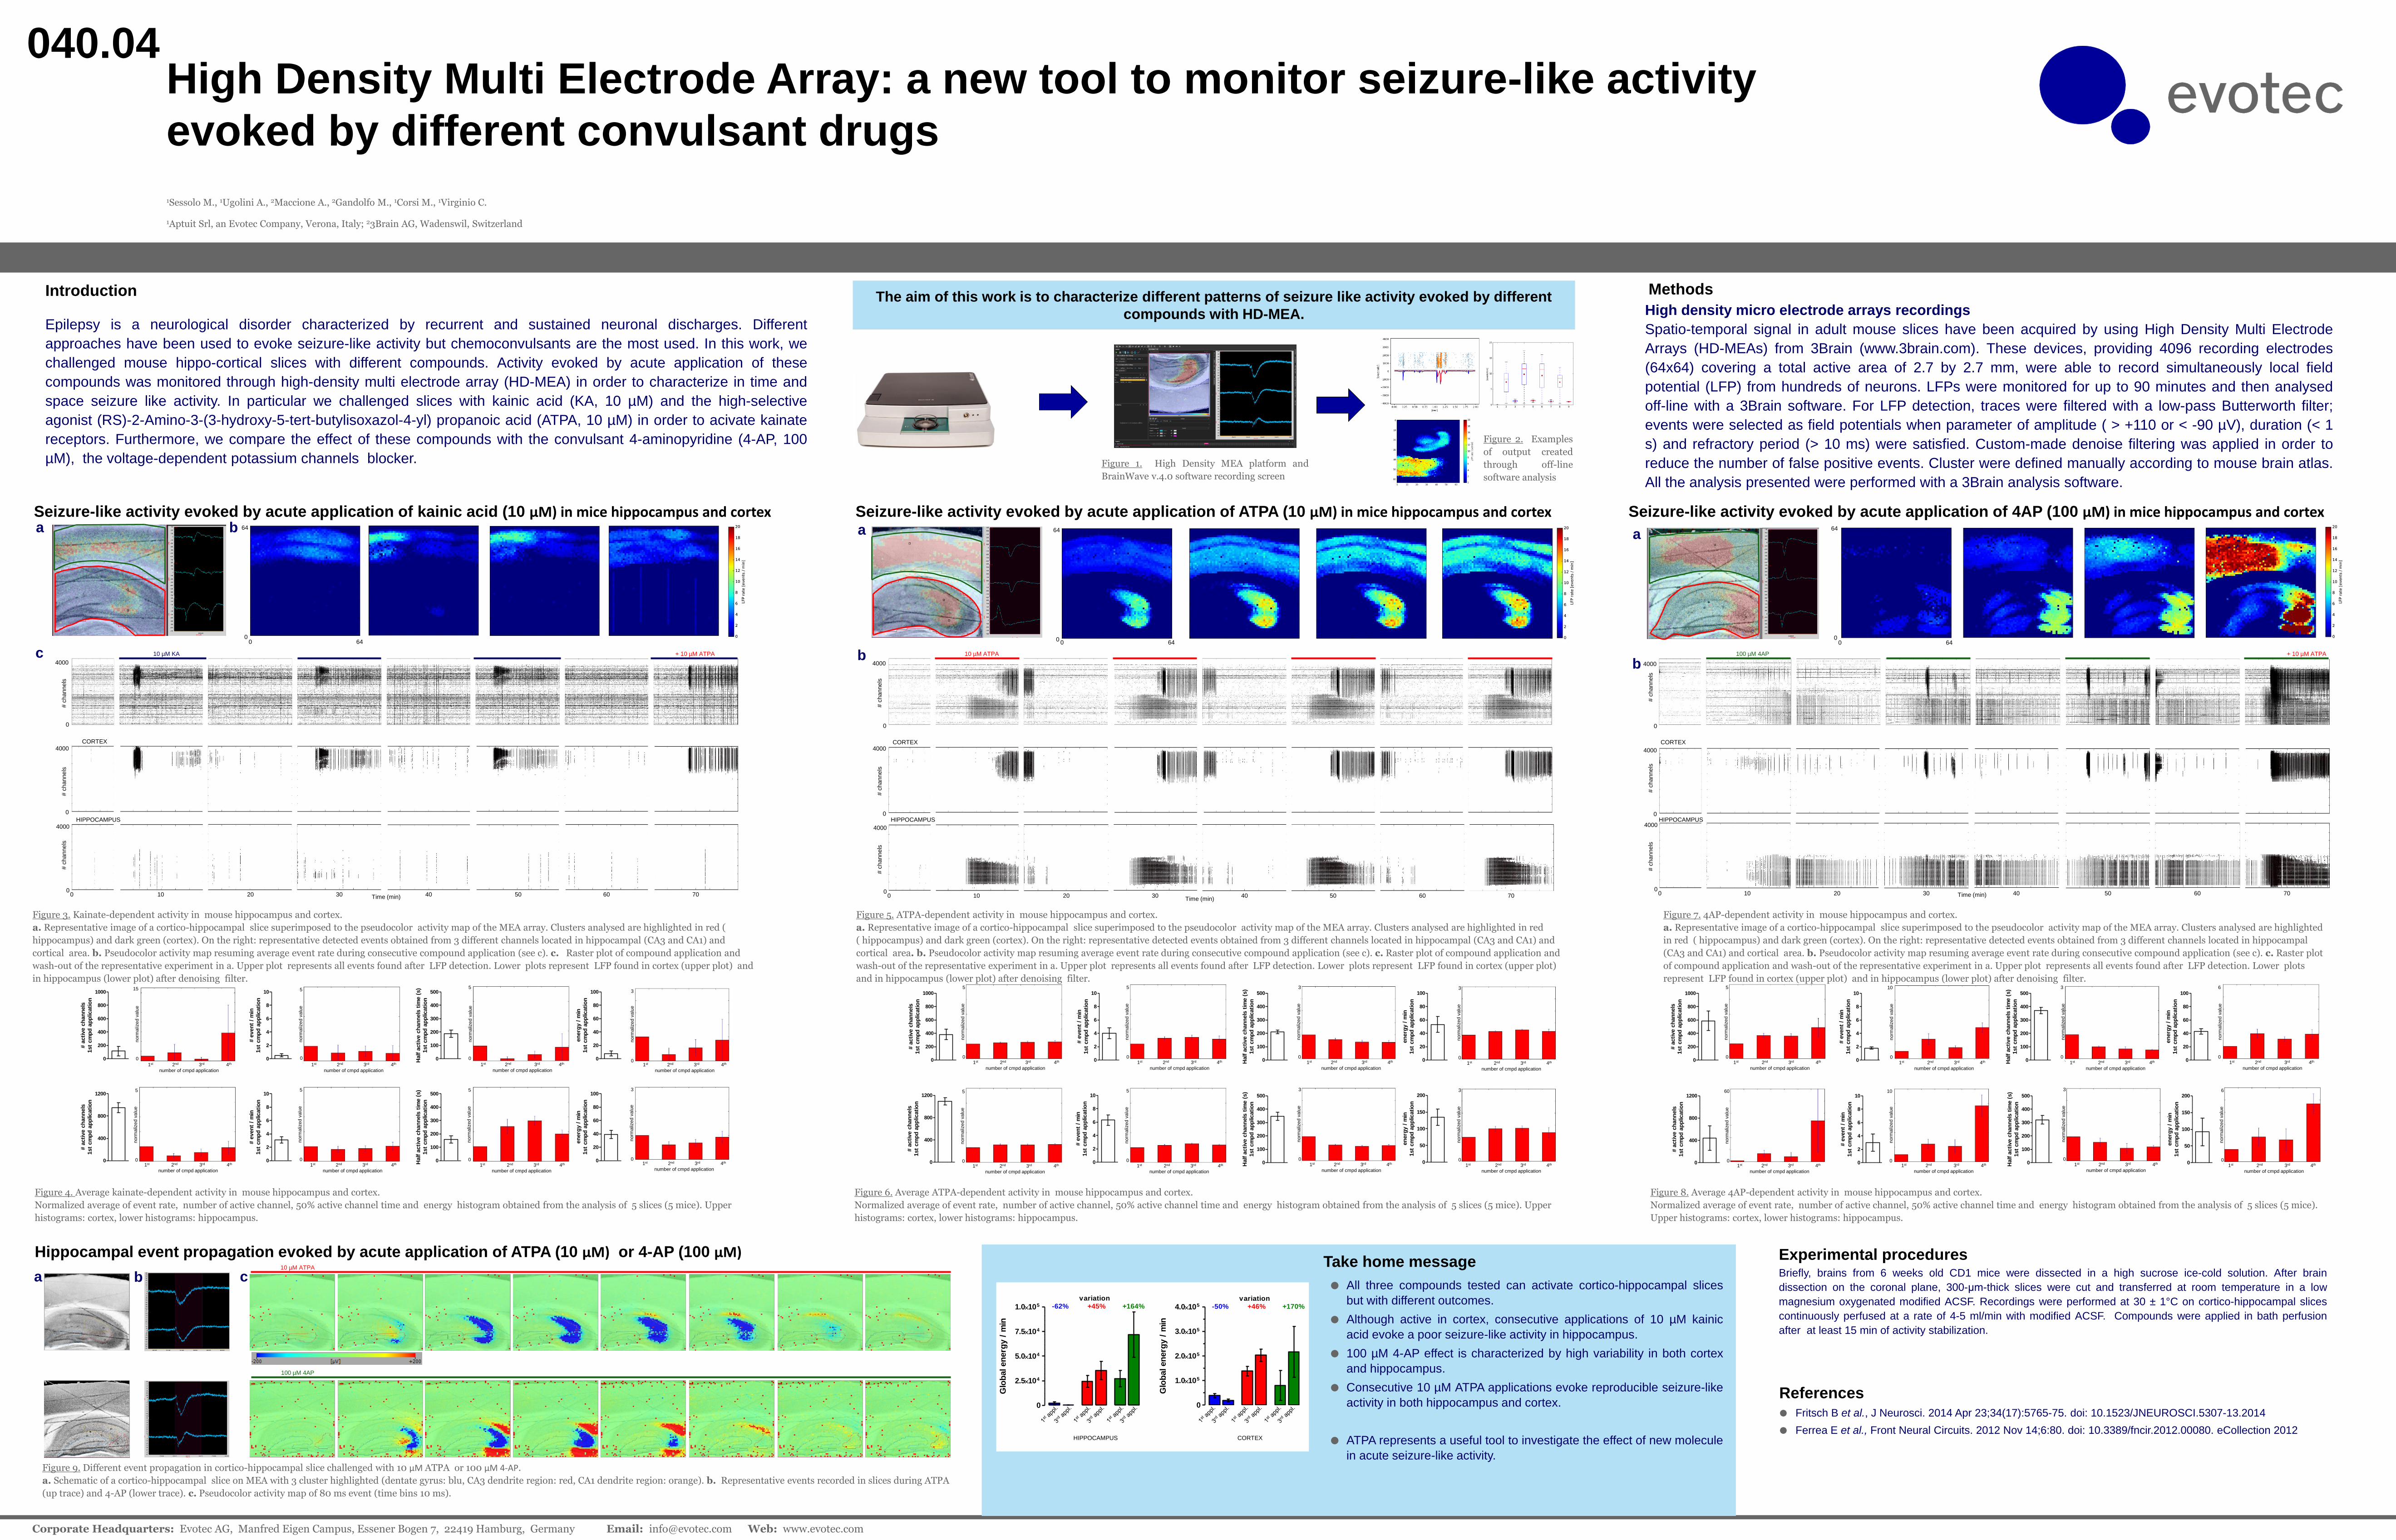
Figure 7. 4AP-dependent activity in mouse hippocampus and cortex.
a. Representative image of a cortico-hippocampal slice superimposed to the pseudocolor activity map of the MEA array. Clusters analysed are highlighted
in red ( hippocampus) and dark green (cortex). On the right: representative detected events obtained from 3 different channels located in hippocampal
(CA3 and CA1) and cortical area. b. Pseudocolor activity map resuming average event rate during consecutive compound application (see c). c. Raster plot
of compound application and wash-out of the representative experiment in a. Upper plot represents all events found after LFP detection. Lower plots
represent LFP found in cortex (upper plot) and in hippocampus (lower plot) after denoising filter.
Figure 8. Average 4AP-dependent activity in mouse hippocampus and cortex.
Normalized average of event rate, number of active channel, 50% active channel time and energy histogram obtained from the analysis of 5 slices (5 mice).
Upper histograms: cortex, lower histograms: hippocampus.
0
4000
100 µM 4AP + 10 µM ATPA
# c
hannels
0
4000
# c
hannels
CORTEX
Time (min) 0 10 20 30 40 50 60 70 0
4000
# c
hanne
ls
HIPPOCAMPUS
0
400
800
1200
# a
cti
ve c
han
nels
1st
cm
pd
ap
plicati
on
0
2
4
6
8
10
# e
ven
t /
min
1st
cm
pd
ap
plicati
on
0
100
200
300
400
500
Half a
cti
ve c
han
nels
tim
e (
s)
1st
cm
pd
ap
plicati
on
0
20
40
60
80
100
en
erg
y /
min
1st
cm
pd
ap
plicati
on
5
0 1st 2nd 3rd 4th
number of cmpd application
norm
aliz
ed v
alu
e
5
0 1st 2nd 3rd 4th
number of cmpd application
norm
aliz
ed v
alu
e
3
0 1st 2nd 3rd 4th
number of cmpd application
norm
aliz
ed v
alu
e
5
0 1st 2nd 3rd 4th
number of cmpd application
norm
aliz
ed v
alu
e
0
200
400
600
800
1000
# a
cti
ve c
han
nels
1st
cm
pd
ap
plicati
on
0
2
4
6
8
10
# e
ven
t /
min
1st
cm
pd
ap
plicati
on
0
100
200
300
400
500
Half a
cti
ve c
han
nels
tim
e (
s)
1st
cm
pd
ap
plicati
on
0
20
40
60
80
100
en
erg
y /
min
1st
cm
pd
ap
plicati
on
15
1st 2nd 3rd 4th
number of cmpd application
norm
aliz
ed v
alu
e
5
1st 2nd 3rd 4th
number of cmpd application
norm
aliz
ed v
alu
e
5
1st 2nd 3rd 4th
number of cmpd application
norm
aliz
ed v
alu
e
3
0 1st 2nd 3rd 4th
number of cmpd application
norm
aliz
ed v
alu
e
0 0 0
Figure 3. Kainate-dependent activity in mouse hippocampus and cortex.
a. Representative image of a cortico-hippocampal slice superimposed to the pseudocolor activity map of the MEA array. Clusters analysed are highlighted in red (
hippocampus) and dark green (cortex). On the right: representative detected events obtained from 3 different channels located in hippocampal (CA3 and CA1) and
cortical area. b. Pseudocolor activity map resuming average event rate during consecutive compound application (see c). c. Raster plot of compound application and
wash-out of the representative experiment in a. Upper plot represents all events found after LFP detection. Lower plots represent LFP found in cortex (upper plot) and
in hippocampus (lower plot) after denoising filter.
Figure 4. Average kainate-dependent activity in mouse hippocampus and cortex.
Normalized average of event rate, number of active channel, 50% active channel time and energy histogram obtained from the analysis of 5 slices (5 mice). Upper
histograms: cortex, lower histograms: hippocampus.
0
4000
10 µM KA + 10 µM ATPA
# c
hannels
0
4000
# c
hannels
CORTEX
Time (min) 0 10 20 30 40 50 60 70 0
4000
# c
hannels
HIPPOCAMPUS
0 64 0
64
Seizure-like activity evoked by acute application of ATPA (10 µM) in mice hippocampus and cortex
0
200
400
600
800
1000
# a
cti
ve c
han
nels
1st
cm
pd
ap
plicati
on
0
2
4
6
8
10
# e
ven
t /
min
1st
cm
pd
ap
plicati
on
0
100
200
300
400
500
Half a
cti
ve c
han
nels
tim
e (
s)
1st
cm
pd
ap
plicati
on
0
20
40
60
80
100
en
erg
y /
min
1st
cm
pd
ap
plicati
on
5
0 1st 2nd 3rd 4th
number of cmpd application
norm
aliz
ed v
alu
e
5
0 1st 2nd 3rd 4th
number of cmpd application
norm
aliz
ed v
alu
e
3
0 1st 2nd 3rd 4th
number of cmpd application
norm
aliz
ed v
alu
e
3
0 1st 2nd 3rd 4th
number of cmpd application
norm
aliz
ed v
alu
e
0
400
800
1200
# a
cti
ve c
han
nels
1st
cm
pd
ap
plicati
on
0
2
4
6
8
10
# e
ven
t /
min
1st
cm
pd
ap
plicati
on
0
100
200
300
400
500
Half a
cti
ve c
han
nels
tim
e (
s)
1st
cm
pd
ap
plicati
on
0
50
100
150
200
en
erg
y /
min
1st
cm
pd
ap
plicati
on
5
0 1st 2nd 3rd 4th
number of cmpd application
norm
aliz
ed v
alu
e
5
0 1st 2nd 3rd 4th
number of cmpd application
norm
aliz
ed v
alu
e
3
0 1st 2nd 3rd 4th
number of cmpd application
norm
aliz
ed v
alu
e
3
0 1st 2nd 3rd 4th
number of cmpd application
norm
aliz
ed v
alu
e
Figure 5. ATPA-dependent activity in mouse hippocampus and cortex.
a. Representative image of a cortico-hippocampal slice superimposed to the pseudocolor activity map of the MEA array. Clusters analysed are highlighted in red
( hippocampus) and dark green (cortex). On the right: representative detected events obtained from 3 different channels located in hippocampal (CA3 and CA1) and
cortical area. b. Pseudocolor activity map resuming average event rate during consecutive compound application (see c). c. Raster plot of compound application and
wash-out of the representative experiment in a. Upper plot represents all events found after LFP detection. Lower plots represent LFP found in cortex (upper plot)
and in hippocampus (lower plot) after denoising filter.
Figure 6. Average ATPA-dependent activity in mouse hippocampus and cortex.
Normalized average of event rate, number of active channel, 50% active channel time and energy histogram obtained from the analysis of 5 slices (5 mice). Upper
histograms: cortex, lower histograms: hippocampus.
Time (min)
0
4000
10 µM ATPA
# c
hannels
0
4000
# c
hannels
CORTEX
0 10 20 30 40 50 60 70 0
4000
# c
hannels
HIPPOCAMPUS
0 64 0
64
0 64 0
64
Seizure-like activity evoked by acute application of kainic acid (10 µM) in mice hippocampus and cortex
Figure 1. High Density MEA platform and
BrainWave v.4.0 software recording screen
Methods
High density micro electrode arrays recordings
Spatio-temporal signal in adult mouse slices have been acquired by using High Density Multi Electrode
Arrays (HD-MEAs) from 3Brain (www.3brain.com). These devices, providing 4096 recording electrodes
(64x64) covering a total active area of 2.7 by 2.7 mm, were able to record simultaneously local field
potential (LFP) from hundreds of neurons. LFPs were monitored for up to 90 minutes and then analysed
off-line with a 3Brain software. For LFP detection, traces were filtered with a low-pass Butterworth filter;
events were selected as field potentials when parameter of amplitude ( > +110 or < -90 µV), duration (< 1
s) and refractory period (> 10 ms) were satisfied. Custom-made denoise filtering was applied in order to
reduce the number of false positive events. Cluster were defined manually according to mouse brain atlas.
All the analysis presented were performed with a 3Brain analysis software.
Hippocampal event propagation evoked by acute application of ATPA (10 µM) or 4-AP (100 µM)
Figure 9. Different event propagation in cortico-hippocampal slice challenged with 10 µM ATPA or 100 µM 4-AP.
a. Schematic of a cortico-hippocampal slice on MEA with 3 cluster highlighted (dentate gyrus: blu, CA3 dendrite region: red, CA1 dendrite region: orange). b. Representative events recorded in slices during ATPA
(up trace) and 4-AP (lower trace). c. Pseudocolor activity map of 80 ms event (time bins 10 ms).
10 µM ATPA
100 µM 4AP
Briefly, brains from 6 weeks old CD1 mice were dissected in a high sucrose ice-cold solution. After brain
dissection on the coronal plane, 300-μm-thick slices were cut and transferred at room temperature in a low
magnesium oxygenated modified ACSF. Recordings were performed at 30 ± 1°C on cortico-hippocampal slices
continuously perfused at a rate of 4-5 ml/min with modified ACSF. Compounds were applied in bath perfusion
after at least 15 min of activity stabilization.
Experimental procedures
Fritsch B et al., J Neurosci. 2014 Apr 23;34(17):5765-75. doi: 10.1523/JNEUROSCI.5307-13.2014
Ferrea E et al., Front Neural Circuits. 2012 Nov 14;6:80. doi: 10.3389/fncir.2012.00080. eCollection 2012
References
Figure 2. Examples
of output created
through off-line
software analysis
a
c
a c
a
b
a
b
0
1.0105
2.0105
3.0105
4.0105
variation-50% +46% +170%
Glo
bal en
erg
y /
min
0
2.5104
5.0104
7.5104
1.0105
variation-62% +45% +164%
Glo
bal en
erg
y /
min
HIPPOCAMPUS CORTEX
b
b