Embed Size (px)
Citation preview

University of South CarolinaScholar Commons
Faculty Publications Library and Information Science, School of
5-2000
Using Implicit Feedback for User Modeling inInternet and Intranet SearchingJinmook KimUniversity of South Carolina - Columbia, [email protected]
Douglas W. Oard
Kathleen Romanik
Follow this and additional works at: https://scholarcommons.sc.edu/libsci_facpub
Part of the Library and Information Science Commons
This Paper is brought to you by the Library and Information Science, School of at Scholar Commons. It has been accepted for inclusion in FacultyPublications by an authorized administrator of Scholar Commons. For more information, please contact [email protected].
Publication InfoPublished in Technical Report: CLIS-TR-00-01, 2000, pages 1-21.© 2000 Technical Report: CLIS-TR-00-01, College of Library and Information Services, University of Maryland, College Park, MD

1
CLIS-TR-00-01 May 2000
Using Implicit Feedback for User Modeling in Internet and Intranet Searchingϕ
Jinmook Kim,* Douglas W. Oard,* and Kathleen Romanik=
*College of Library and Information ServicesUniversity of Maryland, College Park, MD 20742-4345
{jinmook, oard}@glue.umd.edu
=powerize.com901 Elkridge Landing Road, Suite 350
Linthicum, MD [email protected]
Abstract
Powerize Server 1.0, developed by Powerize.com, is a content-based information filtering andretrieval system that presently uses a manually constructed user model known as a search profile.User modeling captures a user’s information needs. A user model can be constructed explicitlyby the user or implicitly by exploiting feedback from the user about which documents arerelevant. Implicit feedback can be inferred from user behavior without any additional work on thepart of the user. The study reported in this paper investigates a way of implementing the implicitfeedback technique of user modeling for the Powerize Server 1.0. Previous studies on Internetdiscussion groups (USENET news) have shown reading time to be a useful source of implicitfeedback for predicting a user’s preferences. In this study, we examined: 1) whether reading timeis useful for predicting a user’s preferences for academic or professional journal articles, and 2)whether printing behavior adds anything to what we already know from reading time. Twoexperiments were conducted with undergraduate students using professional articles from thetelecommunications and pharmaceutical industries. The results of the experiments showed thatreading time could be used to predict the relevancy of documents, although the threshold onreading time required to detect relevant documents would be higher than for USENET newsarticles. The experiments also showed that printing behavior adds to what can be inferred fromreading time. All the documents that were printed in the experiments were relevant, but thereading time for many of these documents was below the mean reading time for all documentsread. This result implies that the use of printing behavior with reading time could increase theprecision and recall ratios for detecting relevant documents. Suggestions for incorporating theresults of the study into the Powerize Server were made in conclusion. This paper also reportsdetailed technical descriptions of the experiment design, including research problem,experimental system, and data collection.
ϕ The research reported herein was supported in part by the Maryland Industrial Partnerships program andpowerize.com

2
1. Introduction
Millions of people around the world, playing their roles as both the providers and users ofinformation, are connected to the Internet. As the information on the Internet is increasing andchanging, people are now faced with the problem of finding useful information within thepanoply of sources available to them. It is the classic needle in the haystack problem, and thereare now even too many haystacks. Information filtering is a process of finding the needle in thechanging haystacks.
Information filtering systems, like retrieval systems, are designed to help users find theinformation they need and present it to the users in a timely manner. Although the distinctionbetween information retrieval and filtering is often not clear, they can be differentiated using theconcepts of “push” and “pull.” Information retrieval is a “pull” service that users search forinformation they need from the system, whereas information filtering is a “push” service that thesystem finds new information and presents it to the user. Existing information filtering systemscan be classified into two forms: content-based and social (which is also called collaborative).Content-based filtering systems select documents based on the characteristics of the document,whereas social filtering systems choose documents based on ratings and annotations from otherusers (Sheth, 1994). In this report we focus on content-based filtering systems.
Individual users seeking information may have different needs and preferences. Usermodeling, which captures the different needs of individual users, is a central component that afiltering system must have to perform the task of providing a personalized information service forits user. Current filtering systems have adopted one of two approaches for user modeling: explicituser modeling and implicit user modeling. Explicit user models are relatively simple toimplement because they are constructed explicitly by the user. Implicit user models, by contrast,exploit feedback about desirable and undesirable documents from the user to develop or improvethe user model. In some application it may be impractical for users to give explicit feedback,since this would take time away from their tasks. Implicit feedback, inferred on the basis of userbehavior, offers the potential to reduce this cognitive load. It is thus a natural source to considerwhen constructing an implicit user model for text filtering systems (Stevens, 1993; Morita &Shinoda, 1994; Konstan et al., 1997; Nichols, 1997; Oard & Kim, 1998).
Powerize Server , developed by powerize.com, is a content-based text retrieval andfiltering system that searches multiple internal and external information sources simultaneouslyand presents the retrieved documents to the user in a customized publication that can be viewedwith a Web browser. Powerize Server presently uses an explicit user model. Once a user sets upa search profile, she can choose to save the profile and have it re-executed on a regular schedule.In this report, we explore the value of alternate sources of implicit feedback that could be used toimprove this initial user model over time. The behaviors that are measured should, of course, beboth easily observed and useful as sources of insight into a user’s preferences. Previous studieson Internet discussion groups (USENET news) have found that predictions based on reading timecan be about as accurate as those based on explicit ratings (Morita & Shinoda, 1994; Konstan etal, 1997). In this report we describe the results of experiments that examined: i) whether readingtime is also useful for predicting explicit ratings for academic or professional journal articles, andii) whether retention behavior adds anything to what we already know from reading time.
Once a user model has been created by any means, it can be used to predict the value tothe user of future documents found by the Powerize Server. This knowledge, then, can be used inseveral components of the system:• To identify specific information sources that should be searched for potentially useful
documents,• To decide whether or not to select a document for inclusion in the publication that is
presented to the user,

3
• To rank the documents, which will determine where they are placed in the publication, and• To decide whether or not to produce a summary of a document.
With the ability to refine a user model using implicit feedback, Powerize Server couldprovide users with a more personalized information system. We expect that powerize.com may beable to use the results of our experiments to improve the effectiveness of the Powerize Server .
2. Background
2.1 Content-Based Filtering
Content-based filtering systems represent and detect documents based on information that isderived from document contents. Many techniques from information retrieval, therefore, can beapplied to designing and implementing content-based filtering systems. A content-based filteringsystem consists of four processes: profile processing, document processing, detection processing,and evaluation processing. Figure 1 shows what tasks each process performs and how theyinteract with each other.
Figure 1. Content-based filtering system model
Profile processing refers to defining the information needs and modifying profilerepresentations for each user. An information seeking process begins with a user who has aninformation need. In an automated system, the information need must be transformed into a querythat consists of search terms. Once the query is formed, a representation of the query is requiredso that the system can find relevant documents. An explicit profile describing the user interests istypically initially acquired from the user. The profile can then be automatically modified usinginformation obtained from evaluation processing.
Document processing refers to representing each document in a collection. A systemsearches for information that satisfies the user’s needs by comparing their profile with arepresentation of each document in the collection. In content-based information filtering systems,
ProfileProcessing
DetectionProcessing
DocumentProcessing
EvaluationProcessingDocuments
TrainingInstances
Document Actions(Select, save, delete, etc.)
ProfileRepresentation
DocumentRepresentation Document
List
User

4
documents are typically represented based on the occurrences of individual words (and perhapsphrases). Weights reflecting the importance of each term can be based on the number of timesthat the term occurs in the document, the length of the document, and the number of documents inwhich the term appears.
The set of documents best matching the user’s needs is found through detectionprocessing. Once both user needs and documents have been represented, the system finds relevantdocuments by comparing the user profile with the document representations. There are three maintechniques that can be used in the detection processing: Boolean matching, the vector spacemethod, and probabilistic matching. In Boolean systems, which are based on searching for anexact match between the profile and the document, a given document either satisfies a Booleanexpression or it does not. Boolean systems have the advantage that users familiar with Booleanlogic can generally understand the relationship between the profile and the documents that aredetected. Boolean systems, however, provide little basis for ranking the retrieved documents,since they operate on the basis of the presence or absence of terms. Two common approaches toranked output generation are the vector space method and probabilistic matching. In the vectorspace method, both the document and query are represented as vectors in a high-dimensionalvector space formed by computing a weight for each term, and then using those weights as thecoordinates of the document in the vector space. Similarity measurements between the documentand query are then based on either the Euclidean distance or the angle between the vectors. Thisdesign reflects the intuition that the documents with vectors that are nearest the profile vector aremost likely to address topics that are similar to those that are desired (Korfhage, 1997). Theprobabilistic method, by contrast, seeks to estimate the probability that a document satisfies theinformation need represented by the profile. It is thus in some sense a generalization of the exactmatch idea, in which the system seeks to rank order documents by the probability that they satisfythe information need rather than by making a sharp decision (Turtle and Croft, 1990).
Evaluation processing seeks to gather evidence about the user’s satisfaction with thedocuments that are provided by the system. Users will typically examine the set of documentsthat result from detection processing and select documents that are interesting to them. Evaluationprocessing begins with this selection process, which itself is a source of implicit evidence aboutthe desirability of the selected document. Evaluation processing can include the observation ofexamination, retention, and reference behavior, inference of implicit ratings based on thoseobservations, and collection of explicit ratings from the user. The process is iterative, feedingback to profile processing.
2.2 Sources for User Preference: Explicit and Implicit Feedback
Explicit feedback takes place when ratings are collected directly from the user in an informationfiltering system. SIFT, Tapestry, and GroupLens are some examples of information filteringsystems that use explicit feedback (Yan & Garcia-Molina, 1995; Goldberg et al, 1992; Konstan etal., 1997). Although explicit feedback is easily implemented, the increased cognitive loadassociated with explicitly assessing the usefulness of individual documents could serve as adisincentive in some applications. This, in turn, can limit the opportunities for profile learning,and thus the usefulness of the entire filtering system.
Implicit feedback may, of course, bear only an indirect relationship to the user’sassessment of the usefulness of any individual document. But because it is easily collected, itcould ultimately have even more potential to support profile processing than explicit feedback.InfoScope, which was a system for filtering Internet discussion groups (USENET News), utilizedboth implicit and explicit feedback for modeling users (Stevens, 1993). InfoScope used threesources of implicit evidence about the user’s interest in each message: whether the message wasread or ignored, whether it was saved or deleted, and whether or not a follow up message was

5
posted. In his study, Stevens observed that implicit feedback was effective in tracking long-terminterests because it operates constantly without being intrusive.
Morita and Shinoda proposed a profile processing technique to accumulate a user’spreference for information based on behavior monitoring (Morita and Shinoda, 1994). Anexperiment over a six-week period with eight users was conducted to determine whether a user’spreference for Internet discussion group (USENET news) articles was reflected in the time spentto read those articles. The result of the experiment showed a strong positive correlation betweenreading time and explicit feedback provided by those users on a four-level scale: “A; veryinteresting,” “B; interesting,” “C; neither interesting nor not-interesting,” and “F; not interesting.”They also discovered that interpreting as ‘interesting’ articles that the reader spent more than 20seconds reading actually produced better recall and precision in a text filtering simulation thanusing documents explicitly rated by the user as interesting.
GroupLens also addressed the potential benefit of implicit feedback (Konstan et al.,1997), although in this case it was used with social filtering. An experiment was done in 1996,using a limited number of Internet discussion groups (USENET news), to apply a news readersoftware for a user to enter explicit ratings and receive predictions. Over a seven-week trial, 250registered users submitted a total of 47,569 ratings and received over 600,000 predictions for22,862 different articles. Specially modified news browsers were provided that accepted explicitratings and displayed predictions on a 1-5 scale where 1 was described as “this item is really bad”and 5 as “this article is great, I would like to see more like it.” Their study showed thatpredictions based on time spent reading are nearly as accurate as predictions based on explicitnumerical rating. They also suggested further actions, such as printing, saving, forwarding,replying to, and posting a follow up message to an article, as sources for implicit ratings.
Nichols presented a list of potential types of user behaviors that could be used as sourcesfor implicit feedback, such as purchase, assess, repeated use, print/save, delete, refer, reply, mark,examine/read, glimpse, associate, and query (Nichols, 1997). Among the actions he presented, the‘refer’ behavior contains all those instances where one information item links to another item,including traditional academic citations as well as hyperlinks on Web pages or the threaded linksbetween USENET news articles. Citation indexing has been well studied in the field ofinformation retrieval, and this appears to be a promising source for implicit feedback in someapplications.
Category Observable Behavior
Examination
SelectionDurationEdit wearRepetitionPurchase (object or subscription)
Retention
Save a reference or save an object - with or without annotation - with or without organizationPrintDelete
ReferenceObject->Object (forward, reply, post follow up)Portion->Object (hypertext link, citation)Object->Portion (cut & paste, quotation)
Table 1. Observable behaviors for implicit feedback

6
Recently, Oard and Kim surveyed the state of the art in implicit feedback techniques withan eye toward their potential use for information filtering (Oard & Kim, 1998). Based on thesources of implicit feedback presented by Nichols, they identified three broad categories ofpotentially useful observations: examination, retention, and reference. Table 1 shows theidentified observable behaviors under each category, and each is discussed in detail in thefollowing section.
2.3 Observable Behaviors for Implicit Feedback
The category of "examination" in Table 1 consists of such user behaviors as selection, duration,edit wear, repetition, and purchase. Information systems often provide brief summaries of severalpromising documents using some sort of interface, and “selection” of individual objects forfurther examination can thus provide the first cue about a user’s interests. "Duration" is ageneralized term for reading time, which can accommodate other modalities such as audio andvideo. Hill et al. (1992) defined “edit wear” as an analogue to the useful effects of uneven wearthat physical materials accumulate over time that provide other users with cues that help discoveruseful materials and useful items within those materials. In text browsing, for example, edit wearmight be measured by using dwell times at specific locations in the text to characterize scrollingbehavior. Examination may extend beyond more than a single interaction between user andsystem, which is described as “repetition.” Finally, when information access is priced on a per-item basis, purchase decisions offer extremely strong evidence of the value ascribed to an object.Similar information would be available at a somewhat coarser scale when users purchasesubscription access to certain types of content (e.g., subscription to a separately priced cabletelevision channel).
The category of “retention” is intended to group those behaviors that suggest somedegree of intention to make future use of an object. Bookmarking a web page is a simpleexample of such a behavior, and “save a reference” is a generalized term that can accommodate awider range of actions such as construction of symbolic links within a file system. Rucker &Polanco (1997), for example, constructed a recommender system using bookmark lists. Savingthe object itself is the obvious alternative, something Stevens (1993) used as a source of implicitfeedback. In either case, the object may be saved with or without some form of annotation. Forexample, web browsers typically default to using the page title in the bookmark list, but usersmay optionally provide a more meaningful entry if they desire. Although numerous confoundingfactors would likely be present, it may be possible to infer something about the value a userplaces on an individual page by whether or not they go to the trouble of constructing aninformative bookmark entry. Similarly, users may choose to save a reference or an object in anexplicitly organized fashion or in the default manner. “Print” has been grouped with retentionbecause of the permanence of the printed page, but users may also print document or images tofacilitate examination because paper still has some decided advantages over electronic displays inmany applications. Printing overlaps with the next category (reference) as well, since users mayprint a document or image with the intention of forwarding them to another individual orincluding portions in another document. Nevertheless, printing is often associated with a desirefor retention, so we find this grouping useful. As with examination, it may be possible to infersomething about the portions of a document that the user finds most valuable from the portionswhich he or she chooses to print. Finally, the retention category is distinguished by the possibilityof directly observing evidence of negative evaluations as well. When retention is a defaultcondition, as in some electronic mail systems, a decision by the user to delete an object mightsupport an inference that the deleted object is less valued than other objects that are retained.
Each activity in the “refer to” category has the effect of establishing some form of linkbetween two objects. Forwarding a message, for example, establishes a link between the newmessage and the original. Similarly, replying individually or posting a follow up message to some

7
form of group venue such as a mailing list establishes the same sort of link. Goldberg et al. (1987)described a simple example of this in which users could construct an electronic mail filter todisplay messages that their colleagues had taken the time to reply to. Hypertext links from oneweb page to another and bibliographic citations in academic papers create links from a portion ofan object (characterized, perhaps, by some neighborhood around the link itself) to another object,although the refinement to a portion of a document has not been exploited often. Brin & Page(1998) provide an example of how hypertext links might be used, although their focus is onpopulation statistics rather than individual preferences. Garfield (1979) describes the design ofretrieval systems that are based on bibliographic citations. Alternatively, selective inclusion ofanother document, using either cut-and-paste or a quotation, creates a link from an informationobject to a portion of another.
3. Experiment Design
Although some preliminary studies on the use of implicit feedback have been done, we knowlittle about the utility of observable behaviors other than reading time and citations for buildinguser models. We thus chose to focus on retention behavior, asking in particular whether retentionbehavior added additional information that could not be inferred from examination behavior.
3.1 Overview
Figures 2a and 2b show alternative strategies for using observations to predict which futuredocument a user will wish to see. Figure 2a depicts a modular strategy in which the inferencestage seeks to produce ratings similar to those that a user would have explicitly assigned, and thenthe prediction stage uses those estimated ratings to predict future ratings. Konstan et al. (1997)adopted this perspective when evaluating how well observed reading time predicted explicitratings for individual articles. Figure 2b shows an alternative strategy in which past observationsare used to predict user behavior in response to new information, and then the inference stageseeks to estimate the value of that new information based on the predicted behavior. Stevens(1993) implemented a simple version of the strategy. He predicted the examination duration for anew USENET news article based on the examination durations for similar articles in the past andthen constructed content-based queries that would select articles with long predicted examinationdurations. This essentially amounts to a degenerate inference stage in which desirability isassumed to increase monotonically with examination duration.
Figure 2a. Rating estimation strategy Figure 2b. Predicted observations strategy
We seek to predict ratings for new documents following the strategy shown in Figure 2a.Of the observable behaviors identified in Table 1 we have chosen to focus on reading time andprinting behavior in this study. Table 2 shows the applicability of each observable behavior to the
Inference
Prediction
Observations
Estimated ratings
Predicted ratings
Prediction
Inference
Observations
Predicted observations
Predicted ratings

8
Powerize Server application and provides an indication of the ease with which that behavior canbe observed. Selection, reading time, repetition, saving and printing are appropriate to thisapplication and measurable without modifying a Web browser, so that is the list from which weselected observable behaviors to explore. Since this was our first experimental study of the utilityof implicit feedback, we tried to keep the experiment design relatively simple by choosing oneexamination behavior and one retention behavior. Reading time was the obvious choice for theexamination behavior, both because it has been studied in other applications and because it caneasily be measured with reasonable accuracy by instrumenting the web server. This avoided theneed to obtain explicit ratings as ground truth for articles that users did not select, which wouldhave been needed if selection behavior were to have been used. It also allowed us to develop aprotocol in which each user participated in only a single session, avoiding the multiple sessionthat would have been needed to study repetition behavior. We chose printing over savingbehavior for similar reasons, since users would have no motivation to save articles unlessmultiple sessions were scheduled. Printing behavior was somewhat more difficult to measurethan reading time because the server is not normally aware of printing behavior in Web-basedapplications. A modification on the Powerize Server was required to accomplish this.
Category Observable BehaviorApplicability to
Powerize Server 1.0Ease of
Measurement**Selection Yes 1Reading time Yes 1Scrolling behavior Sometimes* 3
Examination
Repetition Yes 1Save Yes 2Print Yes 2Delete N/ARetentionPurchase N/AForward Yes 3Reply N/APost follow up N/AHypertext link N/ACitation N/ACut & Paste Yes 3
Reference
Quotation N/A * Scrolling behavior is not applicable when the length of articles is not long enough to do scrolling. ** Ease of Measurement: “1” indicates that it is measurable without modifying a Web browser/Powerize Server,
“2” indicates that it is measurable by modifying either a Web browser or Powerize Server, “3” indicates that it is not measurable without modifying a Web browser. “N/A” indicates that it is not applicable to Powerize Server™ , thus not measurable.
Table 2. Observable behaviors using Powerize Server™
3.2 Hypotheses
The main goals for the current study were to:• Determine whether reading time and printing behavior are good sources for implicit feedback
that could substitute for explicit ratings in the context of filtering academic and professionaljournal articles, and
• Discover the relationship(s) that may exist between reading time, printing behavior, andexplicit ratings.
9
Research hypotheses include the following:a. Users will spend more time on reading relevant documents than on non-relevant ones.b. A combination of reading time and printing behavior will be more useful for predicting
explicit ratings than using reading time alone.
3.3 Experimental System
Powerize Server is a Windows NT Web server-based text retrieval and filtering system thatenables users to search distributed heterogeneous information sources. Profiles are used toperiodically monitor specific sources for new information. Our experiment was done using thePowerize Server 1.0. Users interact with Powerize Server 1.0 through two principal interfaces:Publications and Studio. The Studio interface allows users to select and manage profiles, and thePublications interface is used to browse documents retrieved by the system.
The Studio interface includes five collections of profiles known as “wizard packs:”General, Pharmaceutical, Aerospace, Telecommunications, and Energy. Each wizard pack isdesigned to serve the needs of a group of users. For example, the Pharmaceutical wizard pack isintended for users in the pharmaceutical industry. The Pharmaceutical and Telecommunicationswizard packs were used in our experiment. Each wizard pack consists of several “wizards,” andeach wizard is designed to help the user complete a particular task. For example, there is acompetitive intelligence wizard to help users find information about a competitor. Each wizard isfurther divided into “topics,” which are collections of profile templates designed to retrieveinformation about a particular subject. For example the competitive intelligence wizard containstopics such as “ Mergers and Acquisitions” and “Financial Information.” Each profile templateencodes the structure of a query for a set of information sources. Users create actual profiles byselecting templates and providing search terms such as a drug or company name. By usingtemplates, users can create powerful queries without being familiar with the individualinformation sources or their query interfaces.
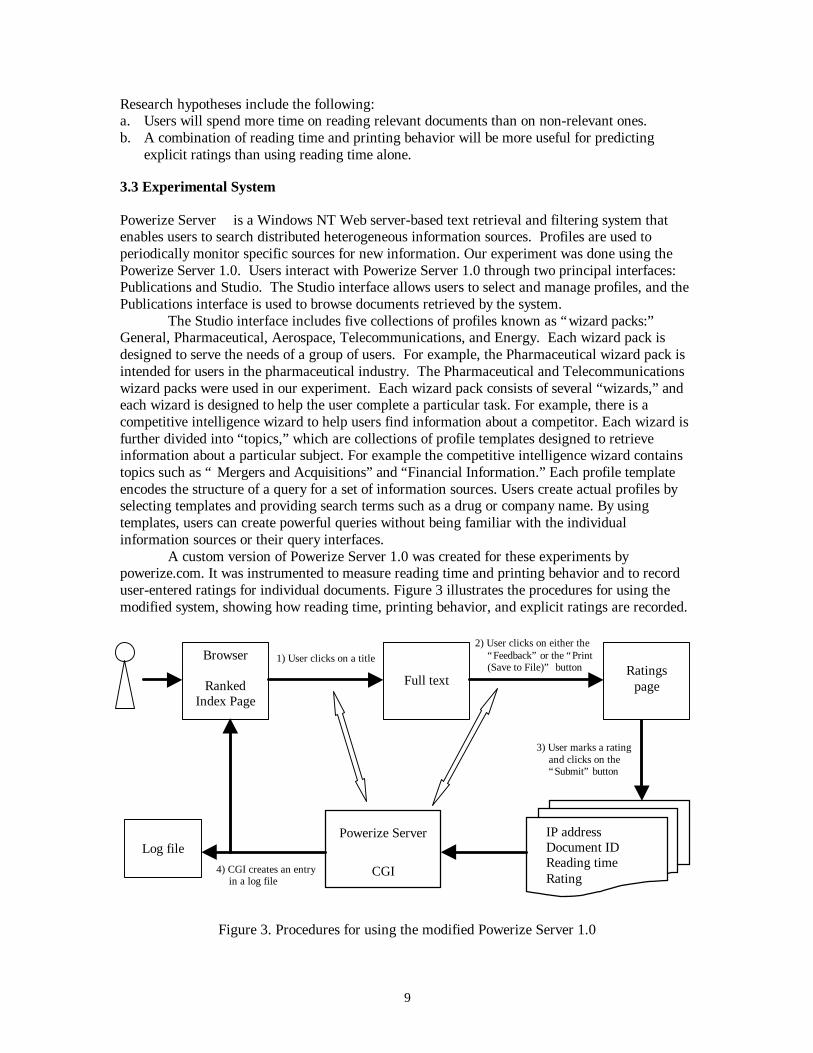
A custom version of Powerize Server 1.0 was created for these experiments bypowerize.com. It was instrumented to measure reading time and printing behavior and to recorduser-entered ratings for individual documents. Figure 3 illustrates the procedures for using themodified system, showing how reading time, printing behavior, and explicit ratings are recorded.
Figure 3. Procedures for using the modified Powerize Server 1.0
IP addressDocument IDReading timeRating
Powerize Server
CGI
Browser
RankedIndex Page
Full textRatings
page
1) User clicks on a title 2) User clicks on either the
“Feedback” or the “Print(Save to File)” button
3) User marks a ratingand clicks on the“Submit” button
Log file 4) CGI creates an entry
in a log file

10
Powerize Server 1.0 retrieves a maximum of 20 articles for a topic, and users view titlesand summaries of individual articles in a ranked list known as an “index page” in the Publicationsinterface. In our experiment, a user examined the index page to determine which articles theywished to read. When they clicked on the title of an article for further examination, the systemprovided the full text of the article, records the time at which reading began, and provided“Feedback” and “Print (Save To File)” buttons at the top of the page. After reviewing the full textof the article, the user had to select either “Feedback” or “Print (Save To File),” either of whichwould record the time at which reading was completed and then displayed a “Ratings” page. Ifthe user selected “Print (Save To File),” a copy of the file would be retained in a file on theserver. The server was generally not located in the same room as the experimental subjects. Thisdesign allowed the desired files to be printed by an assistant during the experiment using anyavailable printer at the experiment site. Explicit ratings were collected on the following scale:“no comment,” “no interest,” “low interest,” “modest interest,” and “high interest.” When theuser clicked on the “Submit” button after assigning a rating, the system made an entry in a log filethat contained the IP address of the user’s machine, the reading time, a unique documentidentifier, whether or not the user chose to print the document, and the rating assigned by theuser. Clicking the “Submit” button also took the user back to the index page.
3.4 Pilot Study
A pilot study was conducted to validate the experimental procedures in November, 1998. Specialconsideration was given to data collection procedures in order to determine whether the systemcould collect and process the required information. The correctness of reading timemeasurements was also examined. We were able to collect all the required data, but had aproblem with measuring both the reading time and user actions when a subject accidentallyclicked on the “Back,” “Forward,” and “Print” buttons on the browser. Hiding the standard toolbar on the browser solved this problem in subsequent experiments.
The pilot study was done using only "Pharmaceutical Wizards," with 4 students whowere taking a microbiology course, (MICB 443, Drug Action and Design) at the University ofMaryland. A total of 21 instances of reading time and rating were gathered from the pilot study.They showed the expected pattern of increasing reading time with increasing rating. The datacollected from the pilot study also suggested that printing behavior might prove useful. Every oneof the 9 cases in which printing was requested was rated as relevant, and any obvious way ofusing reading time alone to make predictions would have missed some of those cases.
3.5 Subjects and Topic Creation
Two experiments were conducted. Eight students, junior undergraduate students taking aGemstone honors seminar (GEMS 396, Team Project Seminar II) at the University of Maryland,participated in the first experiment using the telecommunications wizards. The students wereengaged in research for a group project that required examining new products, services, andtechnologies for wireless Personal Communications Systems (PCS). Conversations were heldwith the students and their instructor several weeks before the experiment to learn about theirinformation needs. Search topics were then created using the telecommunications wizards onPowerize Server 1.0 before the experiment. A total of 97 articles were retrieved using 5 topics:digital PCS, Iridium, Teledesic, Nextel i1000, and Ricochet. All of the selected informationsources were from Dialog.
The second experiment, using pharmaceutical wizards, was done with students taking azoology course (ZOOL 422, Mammalian Physiology) and the associated lab (ZOOL 423,Mammalian Physiology Laboratory) at the University of Maryland. The experiment wasconducted during one of the regular ZOOL 423 lab sessions. There were 87 participants in the

11
experiment, and all were either seniors or advanced juniors at the University. An interview withthe instructor was conducted several weeks before the experiment and the instructor selectedsearch terms that were designed to provide the students with information that would be related towhat they were learning in the two courses. Search topics were then created using thepharmaceutical wizards on Powerize Server 1.0 prior to the experiment. A total of 96 articleswere returned using 5 topics: beta blockers, antihypertensives, ACE inhibitors, positive intropicagents, and cardiac sympathomimetics. Again, all of the selected information sources were fromDialog.
3.6 Experimental Procedures
The experiment with the Telecommunications user group took place in a single session at acomputer lab on March 2, 1999. Microsoft Internet Explorer 4.0 was used. The tool bar withstandard buttons on the browser was hidden by the investigator to prevent subjects frominadvertently clicking on the browser’s back, forward, and print buttons, since the pilot study hadrevealed that clicking on those buttons caused problems with measuring both the reading time anduser actions. Subjects were also asked not to make the tool bar visible and not to use thosebrowser functions during the experiment. The investigator then provided subjects with a briefdescription of the study at the beginning of the experiment. A demonstration was given by theinvestigator to show subjects how to browse articles using Powerize Server 1.0 using their Webbrowser. Subjects were then asked to do a trial using a different set of articles that was retrievedonly for demonstration purposes before they did the actual session using the telecommunicationswizard. The experiment was completed in one hour: 15 minutes of introduction, including thedemo and the trial, and 45 minutes for the actual experiment.
The experiment with the group using Pharmaceutical Wizards was done in seven sessionsbetween March 29 and April 2, 1999 at a single computer lab on campus. Sessions 1 and 2 wereadministered following the same procedure that the Telecommunications user group used, exceptthat they were done in 45 minutes instead of one hour so only 30 minutes was available for theactual experiment. There were 19 subjects in each session, and it turned out that the speed of thesystem was unacceptably slow, resulting in unreliable measurements of reading time. Thisproblem had not been foreseen in the pilot study or in the first experiment because no more than 8subjects had previously participated at one time. To minimize the impact of this problem,students were paired in groups of two for sessions 3 through 7. One student in each group wasassigned to do the browsing, while the other observed the session. In this way, all of the studentsin each lab period were able to participate in some way, but our measurements would (hopefully)still reflect the reactions of a single student. To minimize the potential effect on reading timecaused by having two subjects on a machine, students were asked not to talk to each other duringthe experiment.
4. Data Collection
Data were collected from the two experiments as mentioned in Section 3.6. The system gatheredthe following information: reading time, user actions, and explicit ratings for each article thatusers examined. Reading time in this study was computed based on the following formula:
Reading Time = Clock time when user clicked on a title − Clock time when user clicked on either the “Feedback” or the “Print (Save To File)” button.
Table 3 shows a sample of the data that were collected in a log file for the experiment.The table shows the reading time for the article with document ID CNT282 to be 45 seconds(10:39:34 – 10:38:49). The “F” in the User Action column indicates that the user on the machine

12
with IP address 100.2.200.101 clicked on the “Feedback” button after viewing the articleidentified by CNT282. A “P” in the User Action column indicates that a user clicked on the“Print (Save To File)” button, as shown for CNT284. Finally, explicit ratings were collected forevery article that users selected. Ratings were recorded on a 5 point scale: “NA” for nocomments, “00” for no interest, “01” for low interest, “02” for moderate interest, and “03” forhigh interest. In Table 3, the user with IP address 100.2.200.102 provided a rating of “03” for thearticle identified by CNT284.
IP Address Time Reading Time User Action Doc. ID Rating
100.2.200.101100.2.200.101100.2.200.101
10:38:4910:39:3410:39:40
45 FCNT282CNT282CNT282 NA
100.2.200.102100.2.200.102100.2.200.102
10:40:3010:41:3610:42:14
66 PCNT284CNT284CNT284 03
Table 3. Examples of data collected
5. Data Analysis
A total of 122 cases out of 130 ratings collected from the eight subjects in the first experiment(with the Telecommunications wizard) were considered valid for purposes of data analysis. Allfive cases collected from one subject were excluded from the data analysis because they missedthe first half of the experiment. Two other cases were excluded because they were detected asoutliers based on the standardized residual scores for reading time. One case was excludedbecause it had a rating of “no comments.” Figure 4 shows the descriptive data analysis for theTelecommunications user group. An increase in reading time, in general, can be observed as thevalue of the rating gets higher on the scatterplot. The rating of “00,” indicating “no interest,” hadthe lowest mean reading time, and “02,” representing “moderate interests,” had the highest meanreading time. It seemed that subjects were able to identify highly relevant articles more quicklythan those that they rated moderately relevant.
0
20
40
60
80
100
120
140
160
180
00 01 02 03 04Rating
Rea
ding
Tim
e
Telecommunications WizardsRating
# of Case Mean Reading Time
00010203
20313437
32.8542.8457.7450.24
Total 122 47.60
Figure 4. Descriptive data analysis for the Telecommunications user group

13
In the second experiment (the Pharmaceutical user group) there were 7 sessions. Insessions 1 and 2, 36 subjects provided 166 ratings, but data from those two sessions were notused in this study because of the slow system response time described in Section 3.6. A total of532 ratings were gathered from 49 subjects that participated in sessions 3, 4, 5, 6, and 7. A totalof 153 cases out of the 532 ratings gathered were considered as valid for data analysis in thisstudy, in part because it was discovered after the experiments that only 25 of the 96 articlespresented to each subject had abstracts (none had full text). The 363 ratings that were given forthe 71 articles that lacked abstracts were excluded from the data analysis because we did not feelthat the bibliographic citations alone could provide an adequate basis for assessment by the users.Three cases that were detected as outliers and 13 cases with “no comments” were also excludedfrom the data analysis. The scatterplot in Figure 5 presents the distribution of 153 valid cases, andthe associated table shows both the number of cases and the mean reading time for each rating.
5.1 Reading Time as a Source for Implicit Feedback
In both experiments, we noted a decline in mean reading time between articles rated asmoderate interest and those rated as high interest. In fact, a consistent decline in reading time inthe second experiment was evident as interest increased. This suggests that we will likely not beable to reliably distinguish between degrees of interest using reading time, so we converted theratings to a binary scale: “00” to “non-relevant” and “01, 02 and 03” to “relevant” for oursubsequent analysis in both experiments.
Figure 6 presents the descriptive data analysis on reading time with this binary ratingscale for data collected from the experiment with the Telecommunications user group. Anincrease in mean reading time was observed from non-relevant to relevant documents on thegraph. Ratings made on non-relevant documents and on relevant documents were normallydistributed below and above the mean reading times of 32.85 and 50.49 seconds, respectively.
An Independent-Samples t-test, comparing the mean reading time on relevant documentswith non-relevant ones, was done to test our first hypothesis. A statistically significant differencebetween the two mean reading times was found at α = .05. We therefore conclude that users tendto spend a longer time reading relevant articles than non-relevant articles, which is a consistentresult with the two previous studies by Morita and Shinoda (1994) and by Konstan et al. (1997).Morita and Shinoda, in their study in 1994, concluded that preference of a user for an article wasthe dominating factor that affected time spent reading it, and they suggested using a threshold onreading time to detect relevant articles. Their results showed that 30 % of interesting articles
0
2040
60
80100
120
140
160180
200
00 01 02 03 04
Rating
Rea
ding
Tim
e
Pharmaceutical WizardsRating
# of Case Mean Reading Time
00010203
29514528
42.9755.1452.0051.50
Total 153 51.25
Figure 5. Descriptive data analysis for the Pharmaceutical user group

14
could be retrieved with precision of 70 % by using a threshold of 20 seconds. A much higherthreshold would be required in our first experiment to reach a similar recall level. This comportswith our intuition, since Morita and Shinoda used Usenet news articles, while our study wasconducted with academic and professional journal articles. Several factors, such as the length ofthe article, levels of difficulty for understanding the contents, and differences in language skills,could affect the reading time. Subjects in our study, for example, might require longer readingtime to understand the content of an article because none of them were experts in the field.Figure 7 shows the recall and precision for different ranges of reading time. For example, therecall and precision that would result from treating articles with reading time of at least 40seconds as relevant were 0.418 and 0.894, respectively.
Figure 7. Recall and precision on different reading times (Telecommunications user group)
Rating # of Case
Non-relevantRelevant
20102
Total 122
0
20
40
60
80
100
120
140
0 10 20 30 40 50 60 70 80 90 100+
Reading Time
Num
ber
of A
rtic
les
All articles
Relevant articles
Non-relevantarticles
.75
.80
.85
.90
.95
1.00
.0902 .1148 .1557 .1967 .2623 .3197 .4180 .5492 .7131 .7131
Pre
cisi
on
RecallReading Time 100+ 90+ 80+ 70+ 60+ 50+ 40+ 30+ 20+ 10+
Average reading time for all articles(Precision: .9111, Recall: .4020)
Figure 6. Number of articles on different reading time (Telecommunications user group)
Average reading time for non-relevant articles(32.85 seconds)
Average reading time for all articles(47.60 seconds)
Average reading time for relevantarticles (50.49 seconds)

15
Figure 8 shows the descriptive data analysis for our experiment with the Pharmaceuticaluser group. There was a 10.22 second difference between the mean reading times on relevant andnon-relevant documents, but no statistical significance was found at α = .05, based on theIndependent-Samples t-test. The mean reading time on relevant documents was 53.19 seconds,which was close to the one (50.49 seconds) for the Telecommunications user group in our firstexperiment. The mean reading time on non-relevant documents, however, was 42.97 seconds,which was 10.12 seconds more than was observed with the Telecommunications user group. Wesuspect that this unexpected outcome resulted at least in part from the different setting in whichwe paired two students together. As we mentioned in Section 3.6, one student in each group wasobserving the session, while the other was browsing retrieved articles. In this case, the studentdoing the browsing might have sometimes chosen to wait until the other student had alsoexamined the article before clicking on the feedback button.
Figure 8. Number of articles on different reading time (Pharmaceutical user group)
Although the difference between the mean reading times was not found to be statisticallysignificant, the overall pattern is similar to that which we observed with the Telecommunicationsuser group. The increase in mean reading time between non-relevant and relevant articles isshown on the graph in Figure 8. A total of 56 of the 124 articles reported as relevant had areading time of more than 51.26 seconds, which was the mean reading time for all documents,while 10 out of 29 non-relevant articles were found in that range. Figure 9 presents the observedrecall and precision for different ranges of reading time. For example, the recall and precisionthat would be achieved if documents with the reading time of at least 40 seconds were consideredrelevant was 0.444 and 0.83, respectively.
Rating # of Case
Non-relevantRelevant
29124
Total 1530
20
40
60
80
100
120
140
160
180
0 10 20 30 40 50 60 70 80 90 100+
Reading Time
Num
ber
of A
rtic
les
All articles
Relevant articles
Non-relevant articles
Average reading time for non-relevantarticles (42.97 seconds)
Average reading time for all articles(51.26 seconds)
Average reading time for relevantarticles (53.19 seconds)

16
Figure 9. Recall and precision on different reading time (Pharmaceutical user group)
5.2 Printing Behavior as Evidence of Interest
Printing behavior was examined in this study with the hope that it may provide us with clues thatcan predict explicit ratings beyond those clues given by reading time. There were a number ofrelevant documents that could not be discriminated from non-relevant ones using only readingtime in Figures 6 and 8. For example, using 47.60 and 51.26 seconds as thresholds for cutting offnon-relevant documents in Figures 6 and 8 will also throw 61 out of 102 (59.80 %) and 68 out of124 (54.84 %) relevant documents away, respectively. Can printing behavior provide a clue fordetecting those relevant documents that would have been thrown away using reading time alone?
Unfortunately, only two cases of printing behavior were available from the data collectedfrom the experiment with the Telecommunications user group, as shown in Table 4. Nomeaningful interpretation on the data collected could be made with only two cases. We believethat the low frequency of the printing behavior was because subjects in the experiment did nothave a practical information need. All subjects in the experiment with the Telecommunicationsuser group were doing a group project that required writing a term paper for their class. They,however, performed their own information searches by the time they attended our experiment,which may have reduced their desire to have information on the topic.
There were 16 cases of printing behavior for the experiment with the Pharmaceutical usergroup. Although no statistical significance was found between the mean reading times forrelevant and non-relevant documents with this user group, an increase in reading time from non-relevant to relevant documents was observed that could be used as a source for predicting explicitratings. Using the reading time alone as the source for implicit feedback, however, could notdetect those relevant documents that fell under the threshold reading time. Our second goal was toexamine how many more relevant documents could be detected by using the printing behaviorthan using reading time alone.
In Table 4, the mean reading time for 16 cases with printing behavior was 45.25 seconds,which was 2.28 seconds more than the mean reading time for non-relevant documents (42.97sec.), but 6.01 seconds less than the one for all articles (51.26 sec.). In many cases, articles that
.75
.80
.85
.90
.95
1.00
.1046 .1176 .1503 .2484 .3007 .3791 .4444 .5621 .6731 .7647
Pre
cisi
on
100+ 90+ 80+ 70+ 60+ 50+ 40+ 30+ 20+ 10+RecallReading Time
Average reading time for all articles(Precision: .8485, Recall: .3660)

17
were printed were highly relevant, and users seemed to discriminate them quickly from non-relevant ones, which resulted in reducing the reading time. Printing behavior thus provides auseful clue for predicting explicit ratings over reading time, in that it can detect relevantdocuments below an established threshold of reading time. As in the pilot study, every printeddocument was judged to be relevant, and 10 out of 16 printed documents had a reading time ofless than the mean reading time for all documents (51.26 seconds). Using printing behavior couldidentify those 8 relevant documents with short reading times.
Telecommunications Wizards Pharmaceutical WizardsCase Reading Time Rating Reading Time Rating
123456789
10 11 12 13 14 15 16
15681
0302
100585343381210067664836353281711
03030303030302020202020202020101
Mean 118.50 45.25
Table 4. Case summaries for Print/Save behavior
6. Implications for the Powerize Server
The Powerize Server could exploit user modeling to perform two functions: source selection anddocument selection. In this section we describe how the results of these experiments could beused as a basis for document selection. The key idea is to use observable behavior (selection,examination and retention, in this case) in conjunction with computationally tractablerepresentations for the associated documents as a basis for machine learning. Sourcecharacterization is presently an open research question, so improving the performance of thesource selection model would present challenges that we are not presently prepared to address.
In supervised machine learning, the algorithm is trained by presenting a sequence oftraining instances that represent items of interest, and each training instance is associated with anexample of the appropriate response to that item. When working with text, the most commonrepresentation for the training instances is a vector of weights, with one weight for each importantterm in the collection. With only positive training instances, the most important terms aregenerally taken to be those that are relatively rare, and hence highly selective. When negativetraining instances are also available, the important terms are generally taken to be those that bestdiscriminate between the positive and negative training examples. Generally, a weight is
18
assigned to each term, with terms that don’t appear in a particular document being assigned aweight of zero. The desired response is generally a number (typically either binary-valued orreal-valued and normalized to be between zero and one) that indicates the desirability of theassociated document. Once training is complete, the machine learning algorithm is supplied withinstances for which the appropriate response is not known and predicted responses are generated.Real-valued estimates of desirability can be used to rank a set of documents, while binary-valuedestimates are well suited for use in systems that group documents in other ways. Either approachis easily supported, although some machine learning techniques are better suited to one and someare better suited to the other. Straightforward variants of this general paradigm can accommodateinitial information (such as the profiles generated by the Powerize Server’s present wizard packs)and can interleave training instances with instances for which predictions are required.
Given the nature of our results, assembling suitable training instances is fairlystraightforward. For each of our experiments, there was a reading time beyond which thedocument was assured to be of interest (77 seconds and 120 seconds respectively), and printingalso provided reliable evidence of interest. Combining the two sources of evidence wouldproduce 100% precision with about 15% recall in each case. We defer for the moment thequestion of how an appropriate threshold on reading time might be discovered. Examination ofFigures 4 and 5 makes it clear that no similar strategy could reliably detect undesirabledocuments from among those that the user has selected for examination. If experience shows thatthe density of desirable articles among those that were presented to the user but not selected forexamination is relatively low, we could choose a random sample of the highly ranked butunexamined documents as undesirable documents. Otherwise, it would be safer to choosedocuments below the lowest-ranked examined document as being representative of the set ofundesirable documents. Such a set of desirable and undesirable documents would provide aparticularly useful basis for training because the documents are exactly those that the system isotherwise unable to distinguish. By the time the user has examined 100 documents (a few hourswork), we can expect to have a set of (for example) 15 positive training examples and 15 negativetraining examples.
Oard (1997) identified six machine learning techniques that have been used for documentselection in information filtering applications: rule induction, instance based learning, statisticalclassification, regression, neural networks and genetic algorithms. Stevens (1993) observed thatrule induction is an attractive choice for interactive applications because the compact set of rulesthat results could be presented to the user. In general, other machine learning techniques producefairly opaque representations that fail to leverage the user’s potential participation in the process.Rule induction produces only binary-valued results, however, so integration of this technique intoa ranked retrieval system does pose some challenges. A simple approach to rule induction wouldbe to search the space of disjunctive normal forms (disjunctions of conjunctions) over terms foran expression that balances predictive accuracy on the training set with a preference for shortBoolean formulae (to avoid overfitting to the training set). Several complete systemsimplementing more sophisticated and efficient approaches to performing rule induction ondocument vectors have been developed. One of the most widely used is the RIPPER system fromAT&T research.1
Although rule induction can be performed without the user’s direct involvement,allowing the user to accept, modify or reject the rules could provide more rapid convergence on agood rule set. Furthermore, the utility of the training instances can be indirectly inferred from theuser’s acceptance or rejection of proposed rules. For example, rule rejection would provideevidence that the reading time threshold should be increased, while acceptance of a proposed rulewould provide evidence that the threshold is at a safe value and that it might be possible to lower
1 Information about RIPPER is available at http://www.research.att.com/~wcohen/ripperd.html.

19
it if more positive training instances are desired. Rule induction is generally robust in the face ofa few inappropriately labeled training instances, so in practice the optimal reading time thresholdmay actually be below the perfect-classification thresholds described above.
Implementation of rule induction based on implicit feedback within the Powerize Servershould be relatively straightforward. Powerize Server already caches the full text of thedocuments, so vector representations are easily constructed. Selection behavior and reading timeare easily observed when users interact with documents stored on the Powerize Server, althoughthe inability to observe scrolling behavior (which would require browser modifications) may addsome noise to the observations because a relatively brief shift in attention to another task might beconfused with a long (but reasonable) reading time. Retention behavior can be observed byimplementing server-side personal document storage and printing functions. Positive examplescould be obtained by collecting a reading time distribution over the course of a few days,rejecting outliers (which would likely result from distraction of situated users by other tasks), andthen adopting the 90th percentile of the remaining reading times as a fairly conservative threshold.Negative training examples could be assembled from highly scored articles that the user failed toexamine. The most important terms could then be calculated using a chi-squared measure todetermine which terms distinguish best between the two sets. Feature vectors constructed usingthese terms could then be presented to a program such as RIPPER, with the resulting rule set usedto identify the most promising documents from among those found by the Powerize Server. Theresults could be displayed in a number of ways, but one straightforward technique would be to listthe results of such “Personal Powerization” in a separate window, using the original rank orderingas a basis for sorting those documents.
Although this broad implementation strategy is clear, some interesting design issuesremain to be resolved. Stevens (1993) implemented one approach for proposing new rules tousers, but the user interface design space for this task is rather large and generally unexplored.Similarly, it might be necessary to try a few threshold adaptation strategies in order to strike asuitable balance between responsive learning and overcorrecting. Finally, an unobtrusive explicitfeedback function might also prove useful as a way of allowing users to help customize theirsystem more quickly than implicit feedback alone would permit, and inclusion of such acapability would further leverage the investment in the incorporation of machine learningtechnology. The design outlined above can easily incorporate explicit feedback as an additionalsource of evidence, but we are not aware of any prior work on the unification of implicit andexplicit feedback, so there may be some interesting lessons to be learned along the way. Insummary, incorporation of implicit feedback into the Powerize Server would entail a modestdevelopment effort, and some field testing of alternative approaches would likely be necessaryduring the development process.
7. Conclusion
We have shown that documents selected by the user from the Powerize Server have a goodchance (typically 85% or better) of being of interest, that reading time provides additionalevidence about the user’s interest, and that retention behavior (printing, in our experiments)provides still further evidence of interest. These results have important practical implications forthe development of personalized filtering systems, and we have illustrated how this informationcan be used to adapt a filter to an individual user’s preferences. Because implicit feedback can becollected ubiquitously, vastly more evidence about user interests can be collected in this way thanwould likely be obtained through reliance on explicit feedback alone. Using this evidence, it thusbecomes possible to realize the vision of building truly personalized information systems thatseamlessly adapt as their users’ interests change.
20
Acknowledgements
The authors wish to thank Nick Carmello of powerize.com for modifying Powerize Server 1.0,Professors William Higgins and Carol Pontzer at the University of Maryland for working closelywith us to find subjects for our experiments and to craft meaningful tasks for them to perform,and our volunteer participants, without whom our research would not have been possible. Thiswork has been supported in part by the Maryland Industrial Partnerships program andpowerize.com.
References
Brin, S. and Page, L. (1998) The anatomy of a large-scale hypertextual Web search engine. Dept.of Computer Science, Stanford Univ.
Garfield, E. (1979) Citation indexing: Its theory and application in science, technology, andhumanities. New York: Wiley-Interscience.
Goldberg, D., Nichols, D., Oki, B. M, and Terry, D. (1992) Using collaborative filtering to weavean information Tapestry. Communication of the ACM, December, 35(12): 61-70.
Hill, W.C., Hollan, J. D., Wrobelwski, D. and McCandless, T. (1992) Read wear and edit wear. InProceedings of ACM Conference on Human Factors in Computing Systems, CHI ’92: 3-9.
Konstan, J. A., Miller, B. N., Maltz, D., Herlocker, J. L., Gordon, L. R., and Riedl, J. (1997)GroupLens: Applying collaborative filtering to Usenet News. Communication of the ACM,March, 40(3), 77-87.
Korfhage, R. R. (1997) Information Storage and Retrieval. John Wiley & Sons, Inc., New York;NY.
Morita, M and Shinoda, Y. (1994) Information filtering based on user behavior analysis and bestmatch text retrieval. Proceedings of the Seventeenth Annual International ACM-SIGIRConference on Research and Development in Information Retrieval, pp. 272-281.
Nichols, D. M. (1997) Implicit ratings and filtering. In Proceedings of the 5th DELOS Workshopon Filtering and Collaborative Filtering, Budapest, Hungary 10-12, ERCIM.http://www.ercim.org/publication/ws-proceedings/DELOS5/index.html
Oard, D. W. (1997) The state of the art in text filtering. User Modeling and User-AdaptedInteraction, 7(3), 141-178..
Oard, D.W., and Kim, J. (1998) Implicit Feedback for Recommender System. In AAAI Workshopon Recommender Systems, Madison, WI: 81-83. http://www.glue.umd.edu/~oard/research.html
Rucker, J. and Polanco, M. J. (1997) Personalized Navigation for the Web. Communications ofthe ACM, March, 40(3): 73-89.
Sheth, B. D. (1994) “A learning approach to personalized information filtering.” Master’s thesis,Massachusetts Institute of Technology, Department of Electrical Engineering and ComputerScience. http://lcs.www.media.mit.edu/groups/agents/publications/
21
Stevens, C. (1993) Knowledge-based assistance for accessing large, poorly structuredinformation spaces. Ph.D. thesis, University of Colorado, Department of Computer Science,Boulder. http://www.holodeck.com/curt/mypapers.html
Turtle, H. And Croft, W.B. (1990) Inference networks for document retrieval. In J.-L. Vidick(ed.) : Proceedings of the 13th International Conference on Research and Development inInformation Retrieval, pp.1-24.
Yan, T.W. and Garcia-Molina, H. (1995) SIFT – A too for wide-area information dissemination.In Proceedings of the 1995 USENIX Technical Conference, pp.177-186.ftp://db.stanford.edu/pub/yan/1994/sift.ps