Embed Size (px)
Citation preview

Using innovation Using innovation survey data to survey data to
evaluate R&D policy in evaluate R&D policy in FlandersFlanders
Additionality researchAdditionality research
Kris Aerts Dirk CzarnitzkiKris Aerts Dirk Czarnitzki
K.U.Leuven K.U.Leuven Steunpunt O&O StatistiekenSteunpunt O&O Statistieken
BelgiumBelgium
2
ContentsContents
1.1. IntroductionIntroduction
2.2. Literature reviewLiterature review
3.3. Evaluation of the Flemish R&D policyEvaluation of the Flemish R&D policy
4.4. ConclusionConclusion

1. Introduction1. Introduction
4
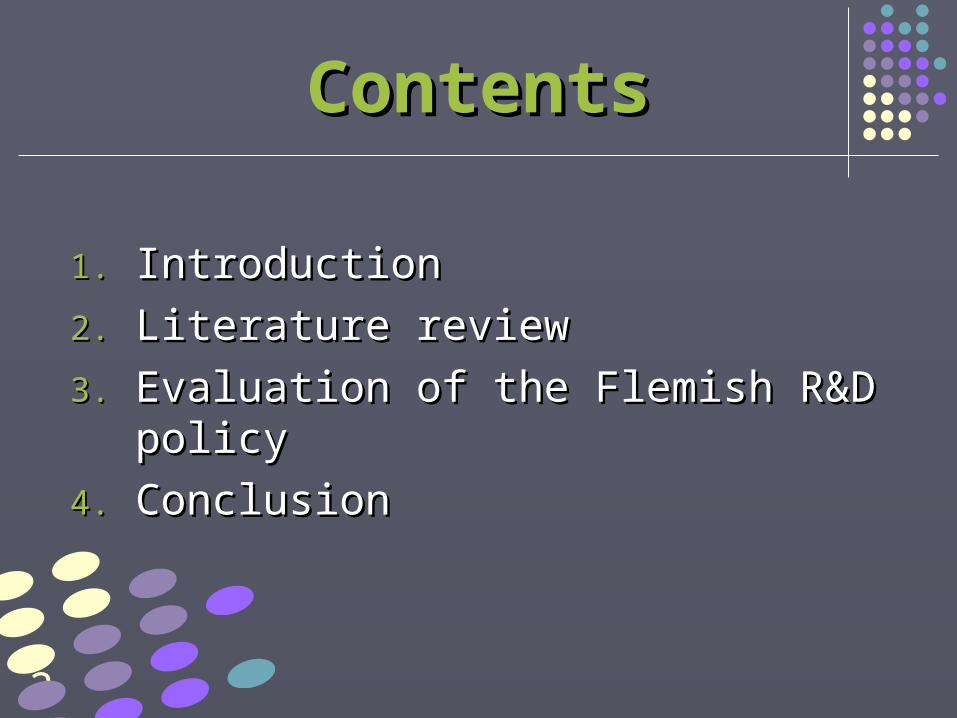
R&D in EuropeR&D in Europe
Barcelona target:Barcelona target:2010: 3% of GDP2010: 3% of GDPEUEU R&D R&D
1/3 public 2/3 private funding1/3 public 2/3 private funding
But:But:private R&D private R&D ~ public good ~ public good
positive externalities!positive externalities!
subsidies!subsidies!

5
Subsidies: economic dilemmaSubsidies: economic dilemma
Crowding out effect?Crowding out effect?public grants - private investmentpublic grants - private investment
Empirical analysis Empirical analysis relationship between R&D subsidies and R&D
activities
treatment effects analysistreatment effects analysis
FlandersFlanders

2. Literature 2. Literature reviewreview

7
Literature reviewLiterature review
► Blank & Stigler (1957)Blank & Stigler (1957)► David et al. (2000)David et al. (2000)► Klette et al. (2000)Klette et al. (2000)
InconclusiveInconclusive
BUT:BUT:Selection biasSelection bias “picking the winner” “picking the winner”
strategystrategy
8
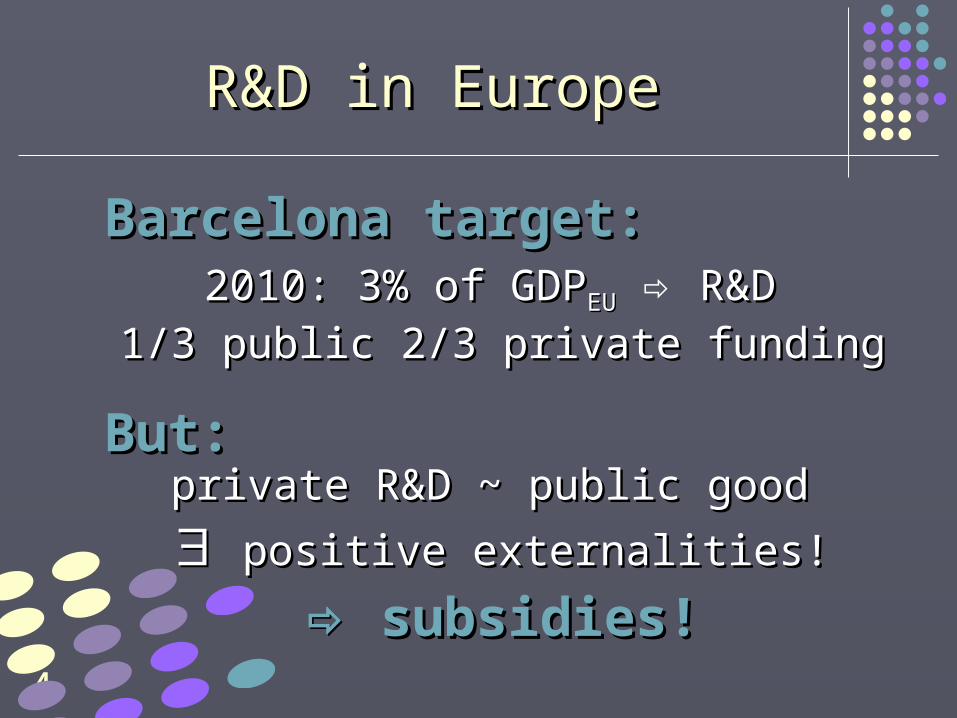
Selection biasSelection bias
REAL QUESTION:REAL QUESTION:““How much would the recipients have invested if How much would the recipients have invested if
they had not participated in a public policy they had not participated in a public policy scheme?” scheme?”
Matching estimatorMatching estimator1.1. Probit model on participation dummyProbit model on participation dummy
2.2. Regression of R&D activity Regression of R&D activity (including selection correction: accounting for different (including selection correction: accounting for different propensities of firms to be publicly funded)propensities of firms to be publicly funded)
Selection modelSelection model
9
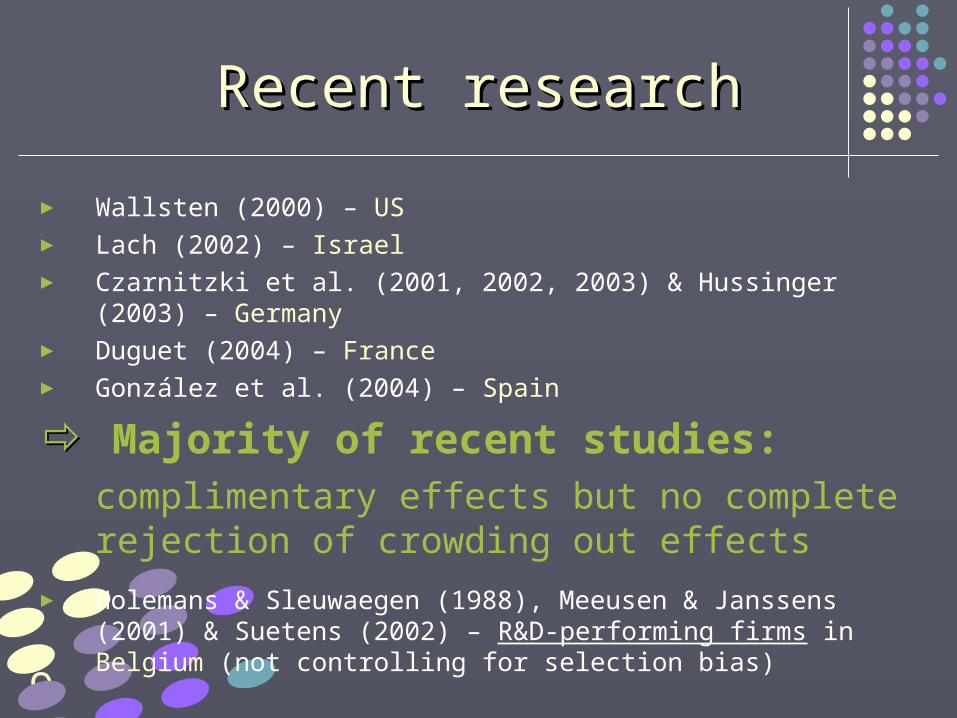
Recent researchRecent research
► Wallsten (2000) – US► Lach (2002) – Israel► Czarnitzki et al. (2001, 2002, 2003) & Hussinger (2003) –
Germany► Duguet (2004) – France► González et al. (2004) – Spain
Majority of recent studies: complimentary effects but no complete rejection of crowding out effects
► Holemans & Sleuwaegen (1988), Meeusen & Janssens (2001) & Suetens (2002) – R&D-performing firms in Belgium (not controlling for selection bias)
3. Evaluation of the 3. Evaluation of the Flemish R&D policyFlemish R&D policy
11
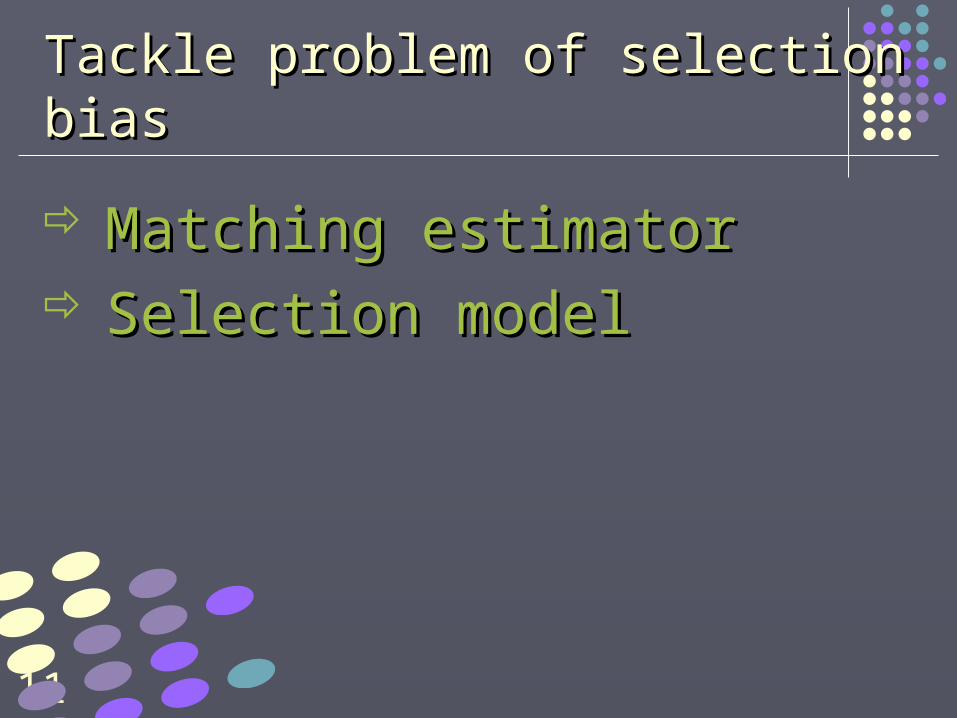
Tackle problem of selection biasTackle problem of selection bias
Matching estimatorMatching estimator Selection modelSelection model
12
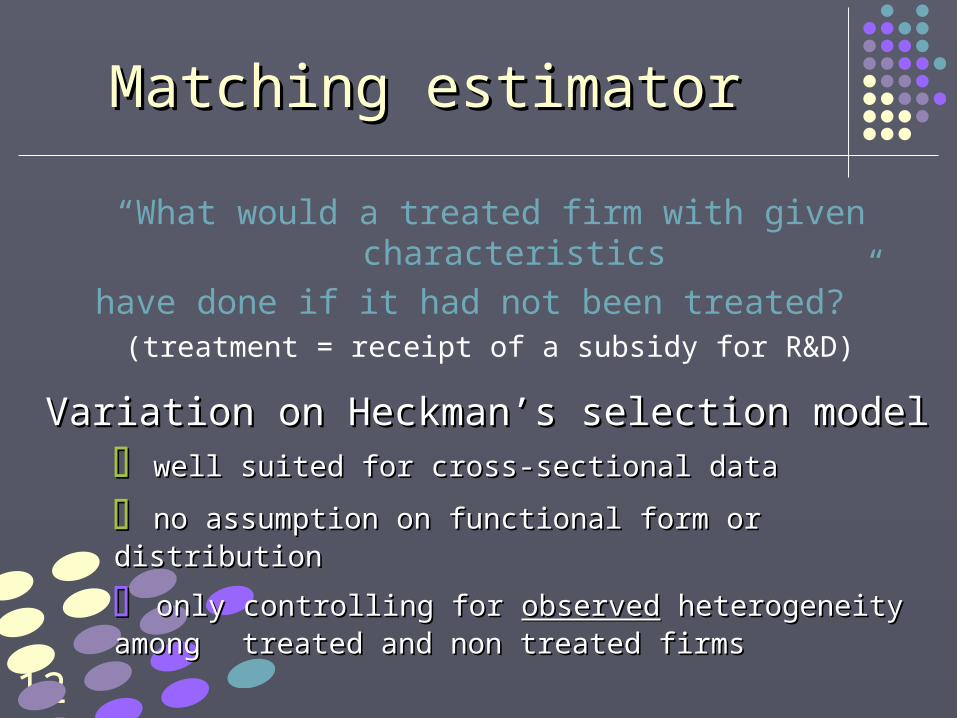
Matching estimatorMatching estimator
“What would a treated firm with given characteristics
have done if it had not been treated?” (treatment = receipt of a subsidy for R&D)
Variation on Heckman’s selection model Variation on Heckman’s selection model well suited for cross-sectional datawell suited for cross-sectional data
no assumption on functional form or distribution no assumption on functional form or distribution
only controlling for only controlling for observedobserved heterogeneity heterogeneity among among treated and non treated firmstreated and non treated firms

13
Matching estimator Matching estimator (2)(2)
Average treatment effect on treated Average treatment effect on treated firms:firms:
| 1 | 1T CTTE E Y S E Y S
Outcome variable:
R&D spending
Status:S=1 treated
S=0 not treated
Potential outcome if
treated group would not have been treated
Directly observable
?

14
Matching estimator Matching estimator (3)(3)
Problem: E(YProblem: E(YCC|S=1) = ?|S=1) = ?
Rubin (1977): conditional independence assumption
Participation and potential outcome are independent for individuals with the same
set of exogenous characteristics X
THUS: THUS:
| 1, | 0,C CE Y S X E Y S X
| 1, | 0,T CTTE E Y S X x E Y S X x

15
Matching estimator Matching estimator (4)(4)
Best matching: more than one matching Best matching: more than one matching argumentargument
BUT:BUT:Curse of dimensionalityCurse of dimensionality
Solution:Solution:
Propensity scorePropensity scoreRosenbaum/Rubin (1983): probit model on receipt of
subsidiesLechner (1998): hybrid matching include additional
variables

16
Matching protocolMatching protocol
1. Specify and estimate probit model to obtain propensity scores2. Restrict sample to common support (remove outliers)3. Choose one observation from sub sample of treated firms and delete it
from that pool4. Calculate Mahalanobis distance between this firm and all non-subsidized
firms in order to find most similar control observation5. Select observation with minimum distance from remaining sample
(selected controls are not deleted from the control group) 6. Repeat steps 3 to 5 for all observations on subsidized firms7. The average effect on the treated = mean difference of matched
samples:
8. Sampling with replacement ordinary t-statistic on mean differences is biased (neglects appearance of repeated observations) correct standard errors: Lechner (2001) estimator for an asymptotic approximation of the standard errors
1ˆ T C
TT i iTi i
Y Yn

17
Selection modelSelection model
)z'(
)z'(Sx)SY(E
i
ii
'i
111
)z'(
)z'(x)SY(E
i
ii
'i
10 00
)z'(
)z'()()(xTTE
i
i'i
0101
Effect of the treatment on the treated firms:
BUT we need an instrumental variable!!!effect on probability to receive funding but no effect on R&D and innovative activity

18
DatasetDataset
► Flemish companiesFlemish companies► Sources: Sources:
Third Community Innovation Survey (CIS III)Third Community Innovation Survey (CIS III)1998-2000
774 observations – 179 subsidy recipients
ICAROS database IWT ICAROS database IWT IWT= main company funding institution in
Flanders
Patent data from European Patent Office (EPO)Patent data from European Patent Office (EPO)data on all patent applications since 1978

19
VariablesVariables
► Receipt of subsides:Receipt of subsides: dummy variable(local government, national government and EU)
► Outcome variables:Outcome variables: R&D:R&D: R&D expenditure at firm level in 2000 R&Dint:R&Dint: R&D expenditure / turnover *100(very skewed distribution also logarithmic transformation
scales)
Patent/EMP: Patent/EMP: patent applications in 2000 per employee
D(Patent>0): D(Patent>0): dummy variable for patenting firms

20
VariablesVariables
► Control variables (1):Control variables (1): nprj:nprj: number of projects applied for in the
pastControl for previous funding history
lnEmp:lnEmp: number of employees in 1998 ln smoothens variable
exportexport:: exports/turnover Degree of international competition
group:group: part of group foreign:foreign: owned by foreign parent
company

21
VariablesVariables
► Control variables (2):Control variables (2): PStock/Emp:PStock/Emp: firm’s patent stock per employee
control for previous (successful) R&D activities per employee: avoid multicollinearity with firm size 1979 to 1997: past innovation activities
, 11it i t itPS PS PA
Depreciation rate of
knowledge: 0,15
e.g. Hall (1990)
Patent Stock of firm i in period t
Patent applications filed at EPO of firm i in
period t

22
Descriptive statisticsDescriptive statistics
subsidized firmspotential control
groupp-value of
two-sided t-test on mean
equality
N1 = 179 N0 = 596
Mean Std. Dev. Mean Std. Dev.
NPRJ 0.453 1.981 0.076 0.384 p = 0.0122lnEMP 4.399 1.427 3.779 1.239 p < 0.0000GROUP 0.682 0.467 0.539 0.499 p = 0.0005FOREIGN 0.296 0.458 0.255 0.436 p = 0.2936EXPORT 0.533 0.331 0.353 0.340 p < 0.0000PSTOCK/EMP 0.720 2.412 0.126 0.936 p = 0.0015R&D 1.623 4.602 0.299 1.2113 p = 0.0002R&DINT 4.613 8.421 1.719 5.116 p < 0.0000lnR&D -2.033 3.107 -5.826 3.947 p < 0.0000lnR&DINT -0.092 2.437 -2.747 3.071 p < 0.0000D(PATENT>0) 0.072 0.260 0.017 0.129 p = 0.0062PATENT/EMP 0.092 0.506 0.015 0.139 p = 0.0455
Differences: treatment or other characteristics?
Matching technique
Observations without common support are dropped => 174 firms

23
Matching procedureMatching procedure
Probit estimation on the receipt of subsidiesProbit estimation on the receipt of subsidiesCoefficient Std. err.
NPRJ
lnEMP 0.184 *** 0.047
PSTOCK/EMP 0.106 *** 0.038
GROUP 0.181 0.133
FOREIGN -0.337 ** 0.142
EXPORT 0.725 *** 0.171
Constant term -1.926 *** 0.319
Test on joint significance on industry dummies
2(11) = 16.49
Log-Likelihood -378.1717
Pseudo R-squared 0.1002
Number of obs. 774
*** (**, *) significance level of 1% (5, 10%)The regression includes 11 industry dummies
Coefficient Std. err.0.292 *** 0.103
0.173 * 0.058
0.097 * 0.038
0.180 0.136
-0.266 0.198
0.693 *** 0.175
-1.926 *** 0.437
2(11) = 14.10
-370.4076
0.1151
774

24
Matching procedureMatching procedure
Propensity score (+ size) Propensity score (+ size) select nearest select nearest neighbourneighbour
Kernel density estimatesKernel density estimates
01
23
40 .2 .4 .6 .8 1
Estimated Propensity Score
Treatment GroupPotential Control Group
0.1
.2.3
.4
2 4 6 8ln(EMP)
Treatment GroupPotential Control Group
01
23
0 .2 .4 .6 .8Estimated Propensity Score
Treatment GroupSelected control group
0.1
.2.3
2 4 6 8ln(EMP)
Treatment GroupSelected control group
BEFORE matching
AFTER matching
propensity scorepropensity score sizesize

25
Matching resultsMatching results
subsidized firms potential control group
p-value of two-sided t-
test on mean
equalityN1 = 174 N0 = 174
Mean Std. Dev. Mean Std. Dev.
NPRJ 0.276 0.621 0.241 0.729 p = 0.635
lnEMP 4.379 1.408 4.369 1.302 p = 0.943
PSTOCK/EMP 0.462 1.319 0.477 1.722 p = 0.927
GROUP 0.684 0.466 0.678 0.469 p = 0.909
FOREIGN 0.293 0.456 0.224 0.418 p = 0.143
EXPORT 0.525 0.330 0.499 0.330 p = 0.466
Propensity score 0.304 0.148 0.299 0.138 p = 0.763
R&D 1.292 3.563 0.518 1.213 p = 0.007
lnR&D -2.142 3.073 -3.996 3.988 p = 0.000
R&DINT 4.370 8.202 2.208 4.653 p = 0.003
lnR&DINT -0.155 2.436 -1.624 2.962 p = 0.000
D(PATENT>0) 0.109 0.312 0.091 0.289 p = 0.639
PATENT/EMP 0.224 0.942 0.179 0.712 p = 0.647
26
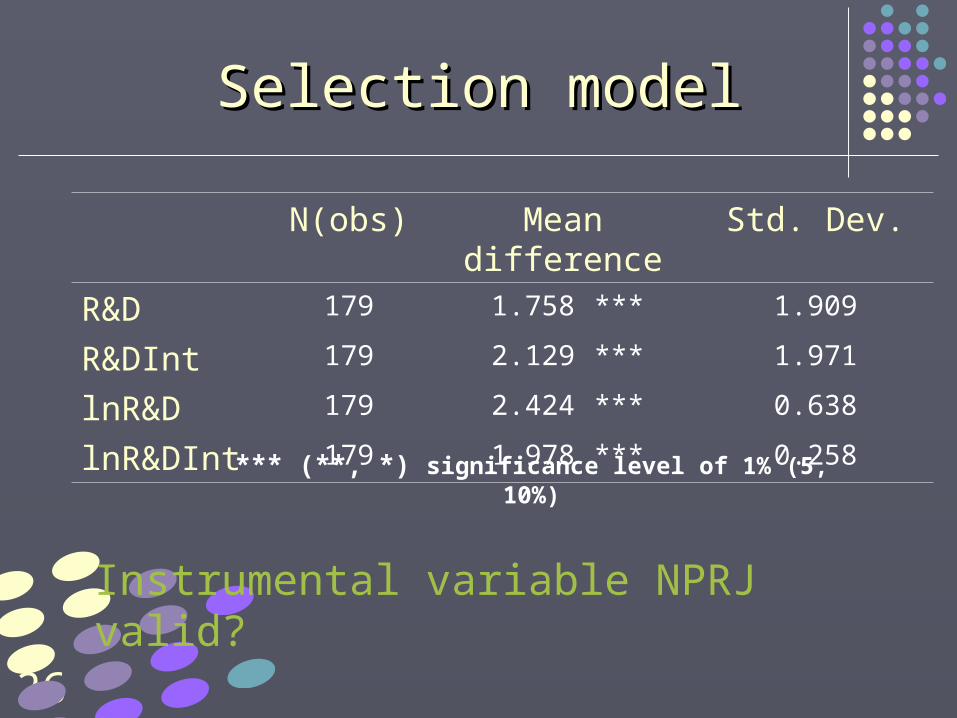
Selection modelSelection model
N(obs) Mean difference
Std. Dev.
R&D 179 1.758 *** 1.909
R&DInt 179 2.129 *** 1.971
lnR&D 179 2.424 *** 0.638
lnR&DInt 179 1.978 *** 0.258*** (**, *) significance level of 1% (5, 10%)
Instrumental variable NPRJ valid?

4. Conclusion4. Conclusion
28
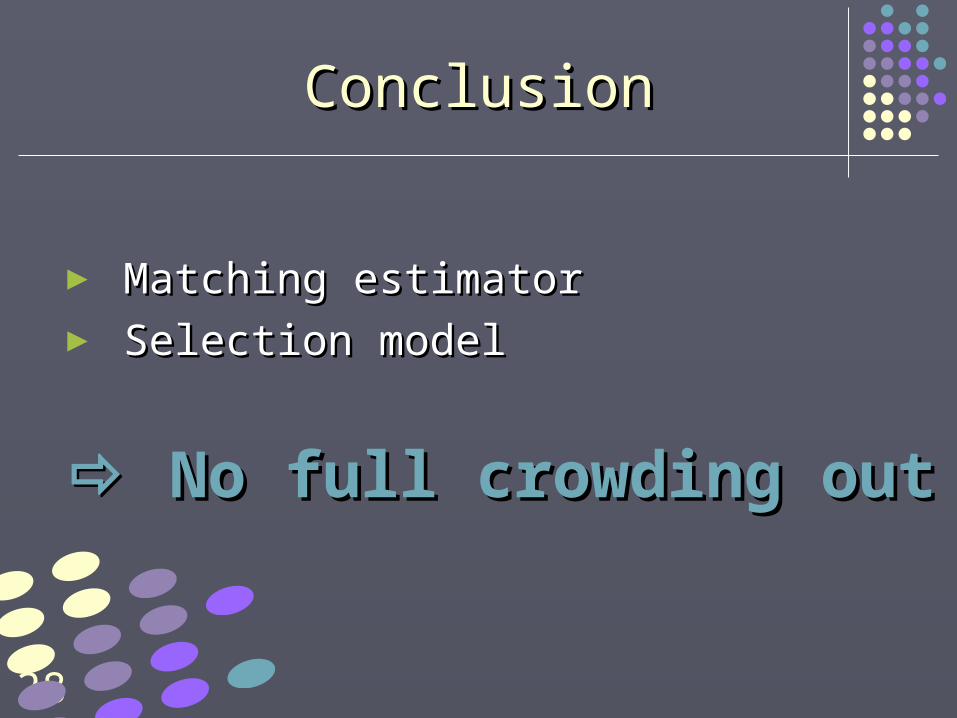
ConclusionConclusion
► Matching estimatorMatching estimator► Selection modelSelection model
No full crowding outNo full crowding out

29
Future researchFuture research
► Time series analysis: Time series analysis: robustness of analysis + lag variables robustness of analysis + lag variables
► Amount of subsidiesAmount of subsidies► Relationship with output variables Relationship with output variables
productivity / performanceproductivity / performance
► Including dataset on all subsidies Including dataset on all subsidies applied for at IWT (Flemish applied for at IWT (Flemish government)government)

30
Evaluation of the usefulness Evaluation of the usefulness of the CIS in this domainof the CIS in this domain
rich dataset, especially when combined rich dataset, especially when combined with other data sources with other data sources
no amounts of funding; only dummyno amounts of funding; only dummy
firmfirm-level data versus -level data versus projectproject-level data-level data link with output?link with output? link with other variables?link with other variables?
(behavioral additionality)(behavioral additionality)
31
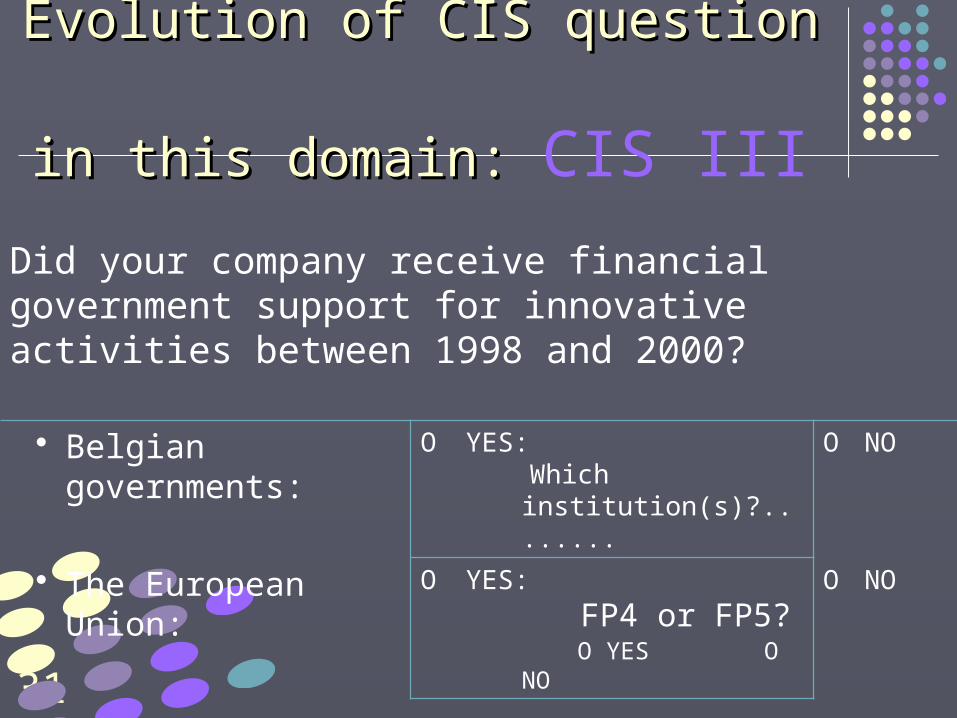
Evolution of CIS question Evolution of CIS question in this domain: in this domain: CIS III
Did your company receive financial government support for innovative activities between 1998 and 2000?
Belgian governments: O YES: Which institution(s)?........
O NO
The European Union: O YES:
FP4 or FP5? O YES O NO
O NO

32
Evolution of CIS question Evolution of CIS question in this domain: in this domain: CIS IV
Did your company receive any government support for innovative activities between 2002 and 2004?
Local or regional governments O YES O NO Federal government O YES O NO The EU O YES: O NO
FP5 or FP6? O YES O NO3xNO:
GO to next question
Was (part of) this government support granted for activities in which your company was involved in a collaboration agreement?
O YES O NO:
GO to next question
Was a university or public research institution involved in (one of) these collaboration agreement(s)?
O YES O NO

??? ????
??
? ? ?? ?
??
?? ?? ? ?? ? ?
QUESTIONS?QUESTIONS?