Embed Size (px)
Citation preview

Using ITSA to examine the
effectiveness of the CSU
modelS W Kim, D Varma, C Horwood, P Hakendorf, A Lee
25 September 2015 Oceania SUGM Kim et al. 2

What is ITSA?
25 September 2015 Oceania SUGM Kim et al. 3

What is ITSA?
Linden 2015, Stata Journal, 15, pp 481
25 September 2015 Oceania SUGM Kim et al. 4

Stata command: itsa
• “performs interrupted time-series analysis
using two ordinary least-squares (OLS)
regression-based approaches available in
the official Stata packages newey and
prais.” (Linden 2015)
25 September 2015 Oceania SUGM Kim et al. 5
25 September 2015 Oceania SUGM Kim et al. 6
Specifies all available options for prais
when the prais option is chosen; otherwise
all available options of newey other than
lag().

Cochrane Group definition of an
ITS design (Ramsay et al. 2003)
1. ≥ 3 time points before and after the
intervention, irrespective of the statistical
analysis used;
2. The intervention occurred at a clearly
defined point in time;
3. The study measured provider
performance or patient outcome
objectively
25 September 2015 Oceania SUGM Kim et al. 7

Guidelines on ITS Use
(Ramsay et al, 2003) Intervention occurred independently of other changes over
time
Intervention was unlikely to affect data collection
The primary outcome was assessed blindly or was measured objectively
The primary outcome was reliable or was measured objectively
The composition of the data set at each time point covered at least 80% of the total number of participants in the study
The shape of the intervention effect was prespecified
A rationale for the number and spacing of data points was described
The study was analyzed appropriately using time series techniques
25 September 2015 Oceania SUGM Kim et al. 8
Application
• In our hospital, we currently have comprehensive stroke
unit (CSU), which is the gold standard for stroke care,
however, CSU is not something we always had.
• We wanted to evaluate whether the CSU results in better
patients’ outcomes irrespective of the physician using
hospital administrative data.
25 September 2015 Oceania SUGM Kim et al. 9

Data
Add % went to rehab graph without prediction line here.
25 September 2015 Oceania SUGM Kim et al. 10
02
04
06
0
% D
isch
arg
es to R
eha
bili
tatio
n
Jan2000 Jan2005 Jan2010 Jan2015
Admitted year/month
CSU careNot expecting much
change before CSU care
Expecting
increase

Check against guidelines
Intervention occurred independently of other changes over time
Intervention was unlikely to affect data collection
The primary outcome was assessed blindly or was measured
objectively
The primary outcome was reliable or was measured objectively
The composition of the data set at each time point covered at least
80% of the total number of participants in the study

Check against guidelines
The shape of the intervention effect was prespecified
A rationale for the number and spacing of data points
was described
Monthly data was used and we had at least 10 points for each
interval
The study was analysed appropriately using time series
techniques
The model was appropriately adjusted for auto-correlation.
25 September 2015 Oceania SUGM Kim et al. 12

Stata command & output
25 September 2015 Oceania SUGM Kim et al. 13
>itsa percrehab age male charlson1, ///
sing trp(528 564 600) replace posttrend
>actest, lags(12)

Stata output
25 September 2015 Oceania SUGM Kim et al. 14

Stata output
25 September 2015 Oceania SUGM Kim et al. 15

Stata command & output
25 September 2015 Oceania SUGM Kim et al. 16
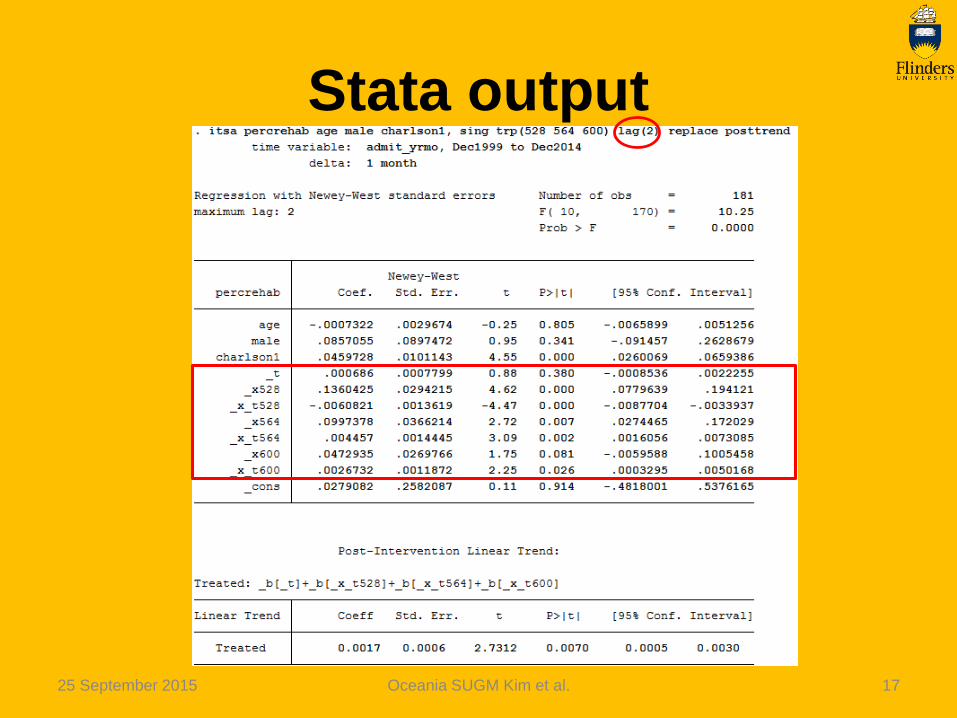
itsa percrehab age male charlson1, ///
sing trp(528 564 600) lag(2) replace posttrend
lincom _t+_x_t528
lincom _t+_x_t528+ _x_t564
lincom _t+_x_t528+ _x_t564+ _x_t600
predict res, resid
kdensity res, normal
Stata output
25 September 2015 Oceania SUGM Kim et al. 17

Stata output
25 September 2015 Oceania SUGM Kim et al. 18

Results
Prediction line is estimated assuming median age 78 years old with
52% of males and median Charlson’s comorbidity index of 3 for
each month.
25 September 2015 Oceania SUGM Kim et al. 19
02
04
06
0
% D
isch
arg
es to R
eha
bili
tatio
n
Jan2000 Jan2005 Jan2010 Jan2015Admitted year/month
Actual Predicted
Regression with Newey-West standard errors - lag(2)
No change -
steady state

Results
• After the first and second change, there
were immediate effect of increase in %
discharged to rehabilitation (P<0.01), but it
came back down significantly over the
time post 1st change (P<0.01) and did not
significantly change over the time post 2nd
change (P=0.359).
25 September 2015 Oceania SUGM Kim et al. 20

Results
• After the third change, the CSU care,
although there was no significant
immediate effect of increase in %
discharged to rehabilitation (P=0.081),
there is significant increase over the time
(P<0.01)
25 September 2015 Oceania SUGM Kim et al. 21

Discussion
• We need to look at this % discharged to
rehabilitation in combination with %
discharged to own home and aged care
facilities to be able to determine whether
there’s a benefit or not.
25 September 2015 Oceania SUGM Kim et al. 22

% discharged to home
25 September 2015 Oceania SUGM Kim et al. 23
02
04
06
08
0
% D
isch
arg
es to h
om
e
Jan2000 Jan2005 Jan2010 Jan2015
Admitted year/month

Discussion
• Considering there is no change in %
discharged to their own home, CSU care
results better patients’ outcome compared
to old system.
25 September 2015 Oceania SUGM Kim et al. 24

Limitations
• Interrupted time series analysis does not consider data
at the patient’s level therefore can not predict the
likelihood of discharge to rehabilitation at patient’s level.
• The estimates of the overall effect on % discharged to
rehabilitation involved extrapolation, which is inevitably
associated with uncertainty.
• The regression method assumes linear trends over time.
25 September 2015 Oceania SUGM Kim et al. 25

References
1. Ramsay CR, Matowe L, Grilli R, Grimshaw JM, Thomas RE. 2003.
Interrupted time series designs in health technology assessment:
Lessons from two systematic reviews of behavior change
strategies. Int.J.Technol.Assess.Health Care, 19, 613-23
2. Linden, A., and J. L. Adams. 2011. Applying a propensity-score
based weighting model to interrupted time series data: Improving
causal inference in program evaluation. Journal of Evaluation in
Clinical Practice, 17, 1231–1238.
3. Linden, A. 2015. Conducting interrupted time-series analysis for
single- and multiple-group comparisons. Stata Journal, 15, 480-
500.
25 September 2015 Oceania SUGM Kim et al. 26

Acknowledgement
• This presentation would not have been
possible without the support from The
Flinders University Conference Travel
Fellowship for the Carer Support
25 September 2015 Oceania SUGM Kim et al. 27


![School Profile 2016-2017 draft[2] - Edl · Cal Poly Pomona Cal Poly San Luis Obispo CSU Channel Islands CSU Dominguez Hills CSU Fullerton CSU Long Beach CSU Monterey Bay CSU Northridge](https://img.pdfslide.net/doc/110x75/5b3f628a7f8b9aff118c0fa3/school-profile-2016-2017-draft2-edl-cal-poly-pomona-cal-poly-san-luis-obispo.jpg)