Embed Size (px)
Citation preview
Using Key Behaviors to Drive Performance
1. What are Key Performance Indicators (KPIs)?
2. What are the underlying behaviors that drive those metrics (KBIs)?
3. How to coach your teams towards those behaviors to drive performance and increase output. (KBIs = greater KPIs)
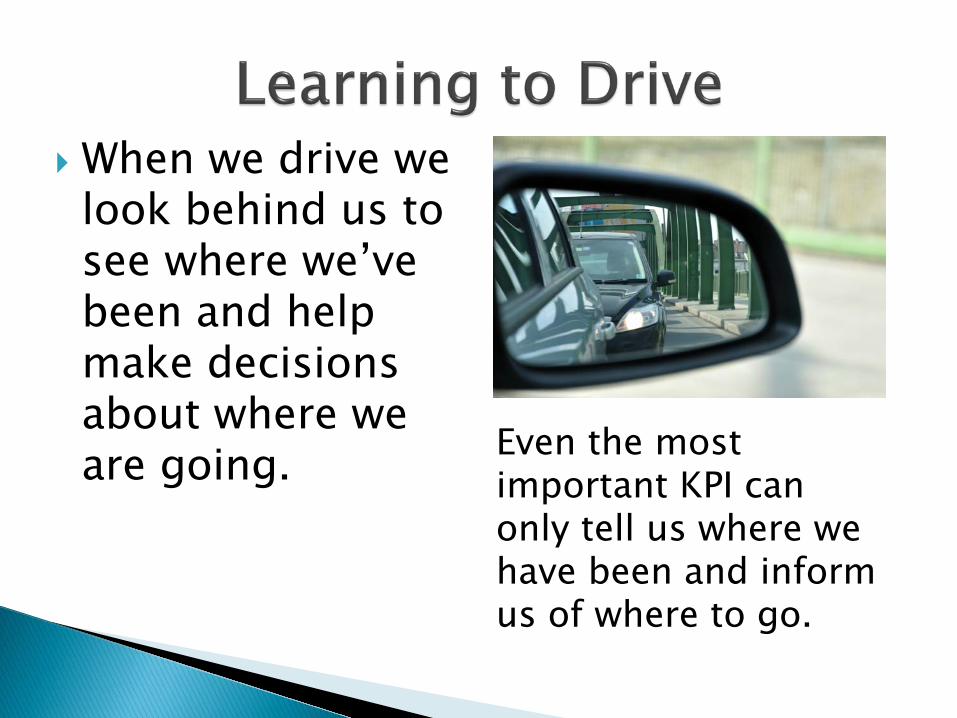
When we drive we look behind us to see where we’ve been and help make decisions about where we are going. Even the most
important KPI can only tell us where we have been and inform us of where to go.
A Key Performance Indicator (KPI) is a metric that shows the fiscal health of your business and can: Represent whether you are successfully running your business. Show long range trends year over year. Be the target you aim for everyday. And finally…
Inform you where to focus
training efforts!
Before beginning the development of your KPIs it is important to consider your organization’s Mission, Vision and Values (MVV) to guide the direction of your efforts.
The MVV is your destination It is your True North.
Use your MVV as inspiration create broad categories for your KPIs to fall into.
This will make it easier to decide if a KPI is important or just another number to track. ◦ If it does not fall into one of the categories then get rid of it.
Examples of these broad categories are: ◦Growth ◦ Profitability ◦ Productivity ◦ Compliance
Another thing to consider is the kind of product your staff generates.
◦ Are they a revenue generator? ◦ Are they a product producer? ◦Do they drive process?
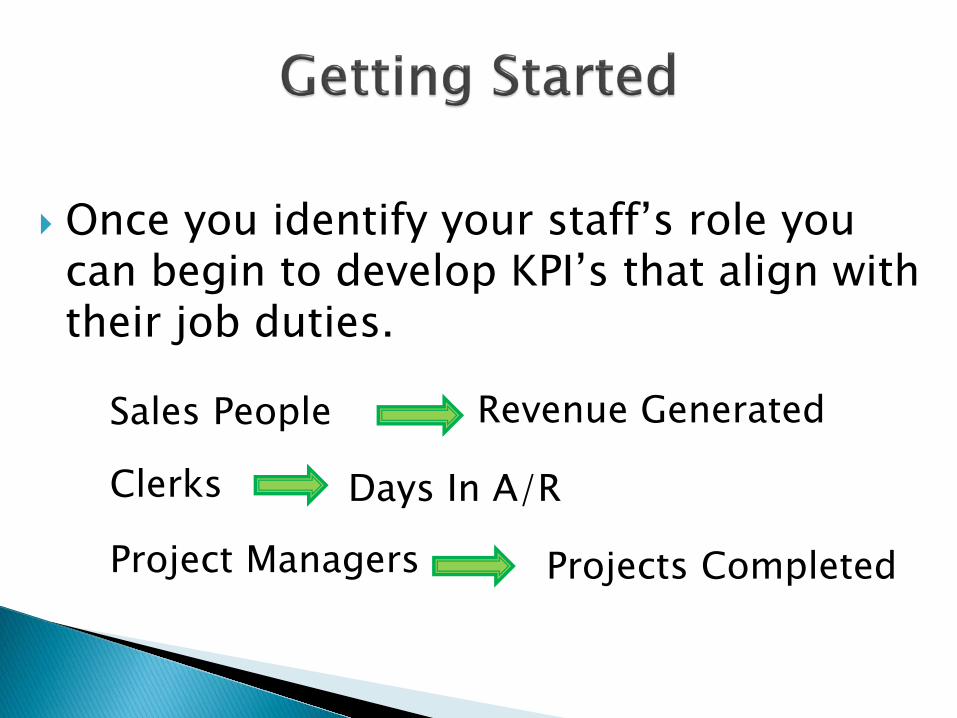
Once you identify your staff’s role you can begin to develop KPI’s that align with their job duties.
Sales People Revenue Generated
Clerks Days In A/R
Project Managers Projects Completed
Most organizations have KPIs… ◦ Examples include: Patient Satisfaction Days in A/R Gross Earned Income Estimated time to Actual Completion time on projects
However, the truly great organizations not only have the right metrics, they know how to drill down to the underlying activities of their business that drive those top metrics.
Top level KPIs like days in A/R or project time are the outcomes of many underlying activities.
Although incredibly important, for the biggest impact on performance you have to look deeper.
Once you start to look at the details of how those top level numbers are generated you can start to develop a plan to drive specific behaviors.
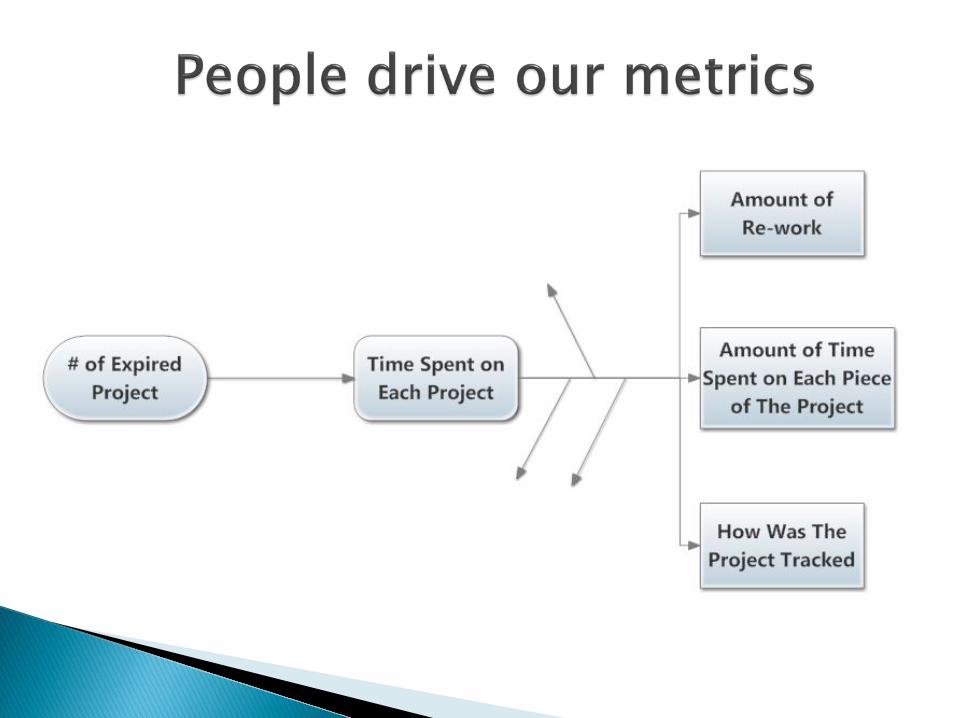
To find the behaviors that drive outcomes a “Metrics Tree” is a valuable tool. ◦ It is a simple visual representation of a metrics Value Stream.
Let’s use % written off due to bad debt as an example
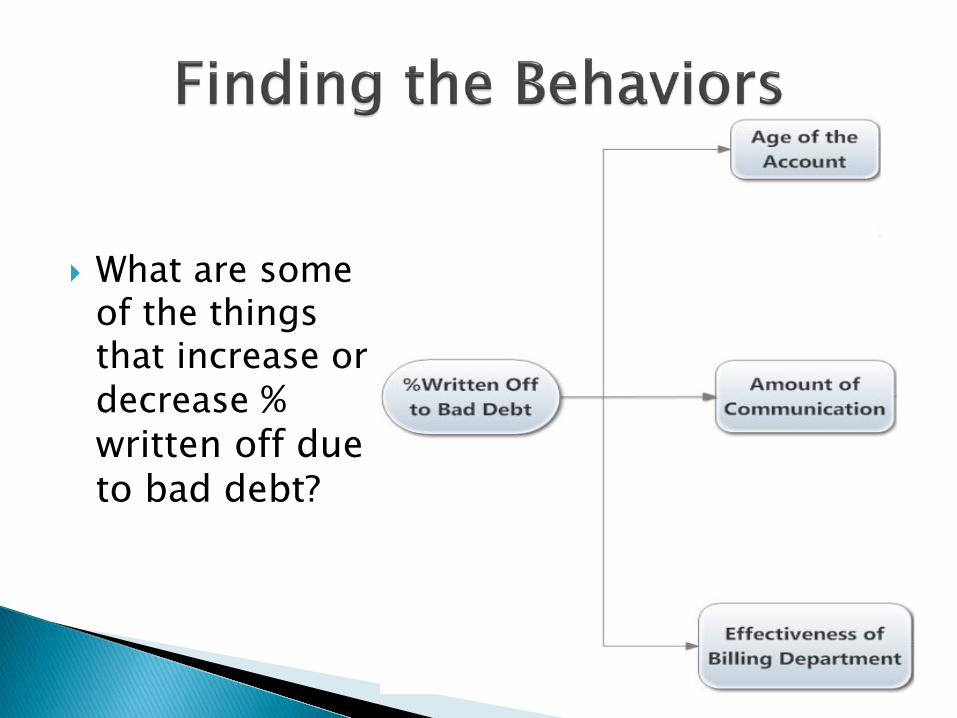
What are some of the things that increase or decrease % written off due to bad debt?
In order to find the metrics that drive your business outcomes you need to look at least three levels down.
At the 3rd Level you can find either Behaviors or Processes to improve upon.
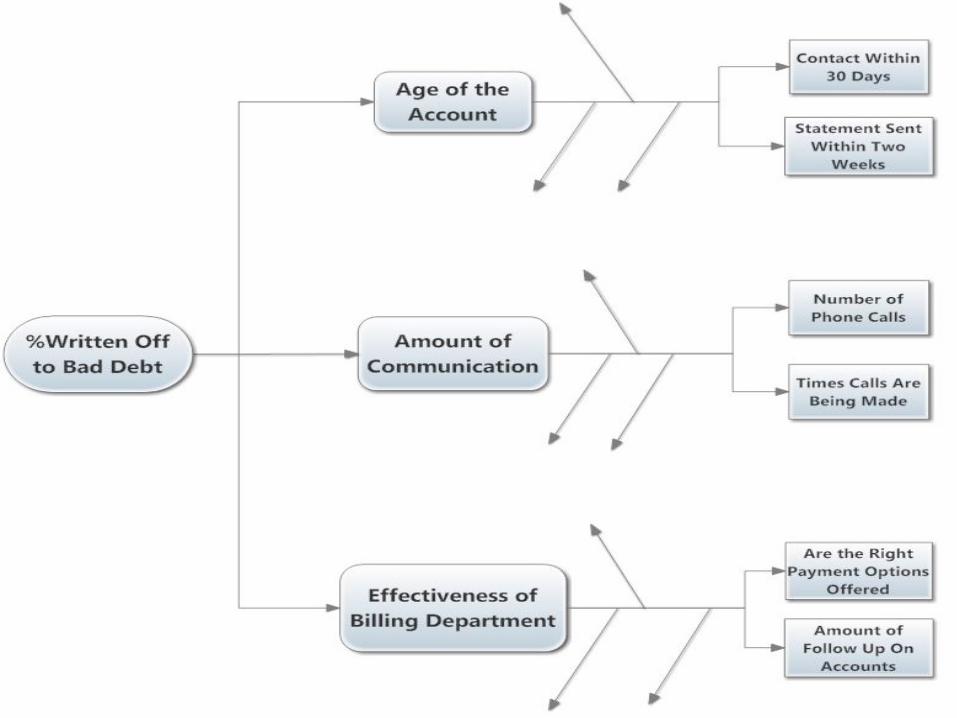
It is within the third tier (or lower) of the Metrics Tree that you begin to see the root cause of performance indicators. ◦ There you will find…
BEHAVIORS!
I worked with an organization that was having a really hard time getting their employees to complete projects in a timely manner.
We decided to track the number of projects that were past their deadline by more than a week (KPI).
The organization found that once a project was more than a week past due it began to impact the quality of the other projects the employee was working on.
We looked at many Secondary Indicators but decided that time on each project was the biggest opportunity.
After talking with team leaders we found that the expectation was, “Get it done as fast as you can!” ◦Without actual timelines the staff set their own pace. ◦ The pace of the staff and that of management often did not align.
We also found that there was a large amount of re-work happening as a project was passed from employee to employee.
The first thing we did was to create timelines for each project based on a hard due date set by management.
We then created due dates for each of the major milestones in the project. ◦ If we missed a milestone we knew it would have to be made up somewhere else.
We then began to look for the Positive Deviants among the staff. - People who constantly met their due dates and had a low rate of follow up work needed.
We found 3 common behaviors each of the Positive Deviants did differently from everyone else. ◦We then developed a training for the other employees based on those behaviors.
The organization gave their supervisors powerful tools for hitting their goals; ◦ Group Trainings to focus on the
global concepts. ◦ One-on-one coaching focused on
how to better manage time and expectations.
They were able to tie a behavior to an outcome that led to increased productivity.
Imagine what you could gain if you were able to find a direct link between your teams’ behaviors and the success of your organization!
Keep in mind as you begin to roll out new coaching that: ◦ Change is hard. People are wired to not accept change. ◦How you deliver the message will have a huge impact on how it is received.
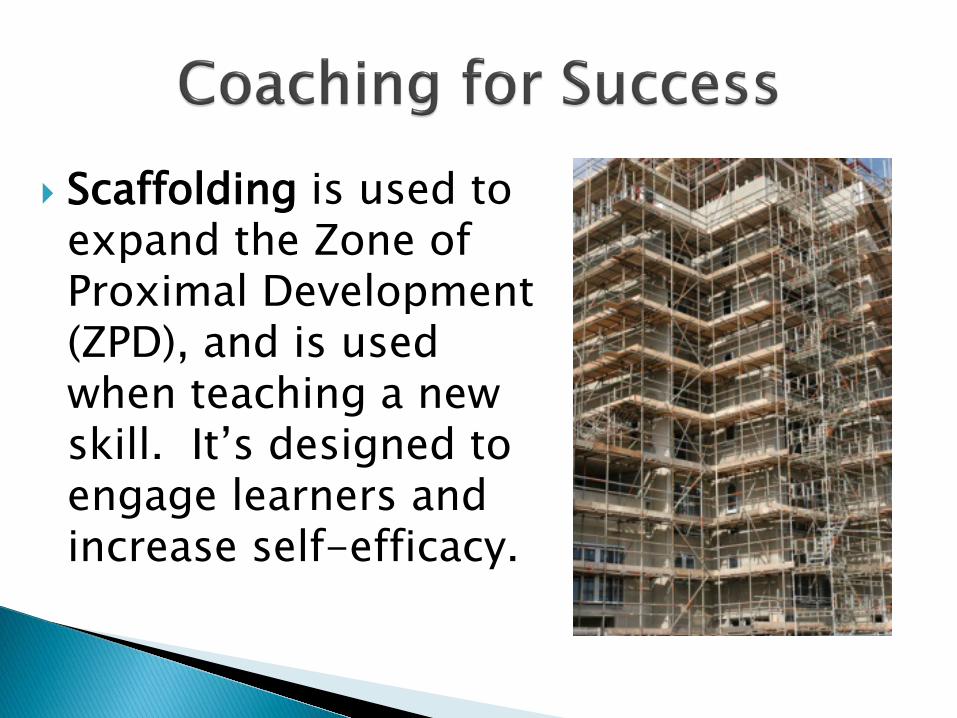
Scaffolding is used to expand the Zone of Proximal Development (ZPD), and is used when teaching a new skill. It’s designed to engage learners and increase self-efficacy.
When using Scaffolding you: Ignore mistakes & Focus on successes
to reinforce desired behavior. Offer support before giving input
regarding the next skill to emphasize.
As you coach, using the Key Identifiers from the Coaching Kata is incredibly helpful: ◦What is the Ideal State? ◦What is the Current State? ◦What is the Gap? ◦What are the Next Steps? ◦How do we get there?
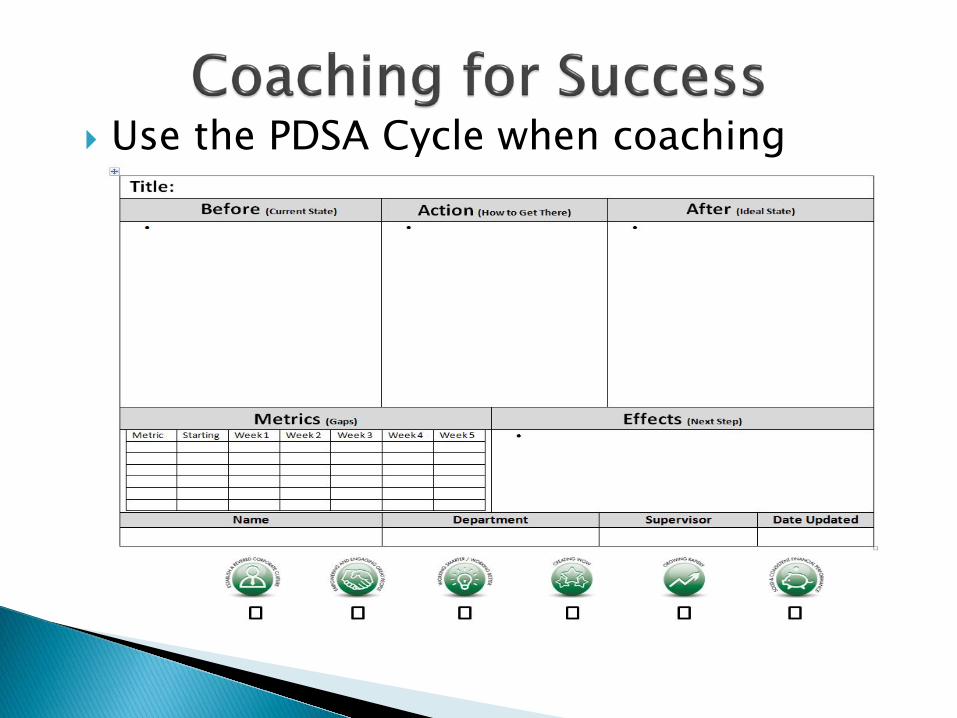
Use the PDSA Cycle when coaching
By utilizing KPIs aligned with your MVV you set the direction to reach your goals. They also: 1. Provide Rationale For Decision Making. 2. Provide Collaborative Development. 3. Allow Celebration Of Successes (no
matter how small). 4. Create opportunities for Public
Commitment.
If you change individual team members’ behavior for the better, their performance will improve.
If their individual performance improves, the metric (KPI) outcome will improve.
Your team will hit their performance goals.
Your organization will fulfill their MVV.
Determine the right KPIs that align with MVV.
Drill down until you find the behaviors that link to them.
Find the Positive Deviant. Train the behaviors that impact the bottom tier metrics.
“The best way to predict your future is to create it”
-Peter Drucker