Embed Size (px)
Citation preview

SECTIONB
USING LEARNING OUTCOMES FOR CONTINUOUS IMPROVEMENT A CASE STUDY OF ENGL 123
Dr. Theresa P. Maue
Embry-Riddle Aeronautical University Worldwide Campus
ABSTRACT
Online courses for Embry-Riddle Aeronautical University must be delivered as built, including all instructional activities, assessments and assignments. As the researcher developed ENGL 123 English Composition for online delivery, she became concerned that the course was tailored too much to her style. To test this, she created a survey that was administered to 12 instructors immediately after they finished teaching the course. They were asked to rank the effectiveness of each activity and assignment in teaching a specified learning outcome. The results were positive, although the number was too small to perform statistical analysis. Although the researcher made changes based on the feedback, she concluded that the course as designed overall could be taught successfully by any online instructor.
Introduction
Periodically, the Office of Institutional Research at Embry-Riddle Aeronautical University
(ERAU} surveys employers of Embry-Riddle graduates on a wide range of topics, including the
employers' judgment of the usefulness of certain skills and the employers' perception of the
competence of graduates in those skill areas. In the fall of 2006, Dr. Tom Sieland analyzed the
employer survey data from the 2001-2003 classes. His analysis revealed that there was a
significant deficit in non-technical writing skills in all three of the programs (Master of Aeronautical
Science [MAS], Bachelor of Science in Professional Aeronautics [BSPA], and Bachelor of
Science in Technical Management [BSTM]}, and that in all cases, non-technical writing was
ranked among the top ten desired skills. (Dr. Sieland's analysis is attached as Appendix A.}
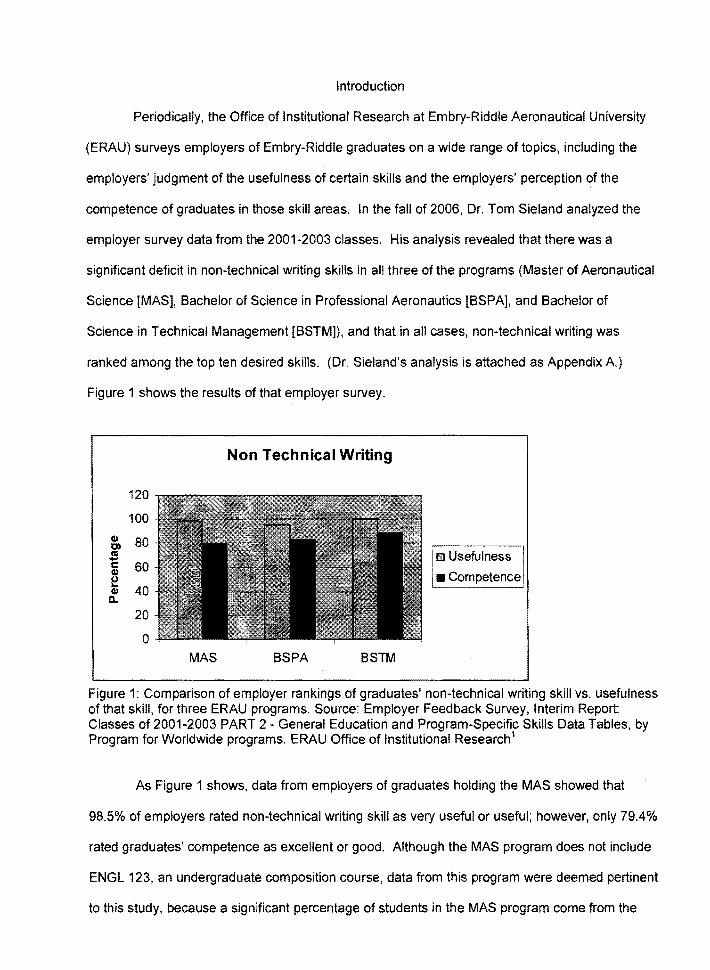
Figure 1 shows the results of that employer survey.
120
100
Cll 80 en .s c 60 Cll ~
40 Cl)
a. 20
0
Non Technical Writing
MAS BSPA BSTM
e Usefulness
• Competence
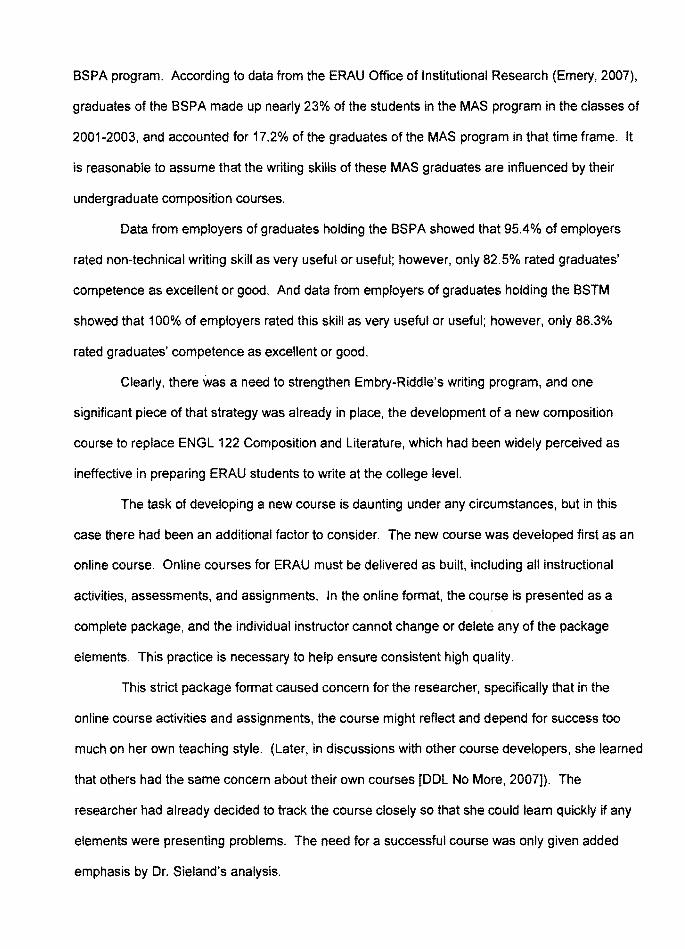
Figure 1: Comparison of employer rankings of graduates' non-technical writing skill vs. usefulness of that skill, for three ERAU programs. Source: Employer Feedback Survey, Interim Report: Classes of 2001-2003 PART 2 - General Education and Program-Specific Skills Data Tables, by Program for Worldwide programs. ERAU Office of Institutional Research 1
As Figure 1 shows, data from employers of graduates holding the MAS showed that
98.5% of employers rated non-technical writing skill as very useful or useful; however, only 79.4%
rated graduates' competence as excellent or good. Although the MAS program does not include
ENGL 123, an undergraduate composition course, data from this program were deemed pertinent
to this study, because a significant percentage of students in the MAS program come from the
BSPA program. According to data from the ERAU Office of Institutional Research (Emery, 2007),
graduates of the BSPA made up nearly 23% of the students in the MAS program in the classes of
2001-2003, and accounted for 17.2% of the graduates of the MAS program in that time frame. It
is reasonable to assume that the writing skills of these MAS graduates are influenced by their
undergraduate composition courses.
Data from employers of graduates holding the BSPA showed that 95.4% of employers
rated non-technical writing skill as very useful or useful; however, only 82.5% rated graduates'
competence as excellent or good. And data from employers of graduates holding the BSTM
showed that 100% of employers rated this skill as very useful or useful; however, only 88.3%
rated graduates' competence as excellent or good.
Clearly, there was a need to strengthen Embry-Riddle's writing program, and one
significant piece of that strategy was already in place, the development of a new composition
course to replace ENGL 122 Composition and Literature, which had been widely perceived as
ineffective in preparing ERAU students to write at the college level.
The task of developing a new course is daunting under any circumstances, but in this
case there had been an additional factor to consider. The new course was developed first as an
online course. Online courses for ERAU must be delivered as built, including all instructional
activities, assessments, and assignments. In the online format, the course is presented as a
complete package, and the individual instructor cannot change or delete any of the package
elements. This practice is necessary to help ensure consistent high quality.
This strict package format caused concern for the researcher, specifically that in the
online course activities and assignments, the course might reflect and depend for success too
much on her own teaching style. (Later, in discussions with other course developers, she learned
that others had the same concern about their own courses [DDL No More, 2007]). The
researcher had already decided to track the course closely so that she could learn quickly if any
elements were presenting problems. The need for a successful course was only given added
emphasis by Dr. Sieland's analysis.
To track the course, the researcher developed a survey to give to every instructor after
he or she concluded the course. The survey was organized according to the learning outcomes,
and it linked every activity or assignment to a specific learning outcome. It asked the instructor to
rate how well the activity or assignment helped to teach the learning outcome. The instructor was
asked to consider factors such as the relative ease or difficulty of understanding the exercise or
assignment, the amount of time required to complete it, the type of student feedback received,
and any other factors considered relevant in making an assessment. The researcher's primary
question was: Did the instructor who had just completed delivery of the course believe the
activities and assignments were effective in teaching the course learning outcomes?
Since the number of instructors was small, the researcher decided to also consult the
student end-of-course surveys, to collect student perceptions of the new course.
This paper covers data collected from the first 20 sections of the 12-week course, which
were conducted beginning July 2006 and concluding February 2007. A total of 422 students
completed the course. Thirteen different instructors taught it.
Survey instruments
The instructor data were collected via a survey emailed to all on line instructors after their
course sections ended. The survey was created with advice and help from several English
instructors, the Mathematics Chair Dr., Joe Allen, and the Arts &Letters Department Chair, Jim
Schultz. (The survey is attached as Appendix B.) The survey used a 5-point Likert scale to
measure instructor perceptions of specific course activities and assignments in terms of how
effectively they taught students each of the course learning outcomes.
The student data were collected from a portion of the standard student end-of-course
evaluation form. This form uses a 4-point Likert scale (with an additional option of Does Not
Apply) to measure student level of satisfaction with the course quality in eight areas and with the
instructor in three areas. In addition, the survey solicits comments about the course and the
instructor, and gives students five options for indicating how much time they spent each week
working on course materials/assignments. A total of 422 students completed the course during
the selected time frame, and 89 students completed the course evaluation form {a 21% rate of
return).
Results
Instructor Surveys
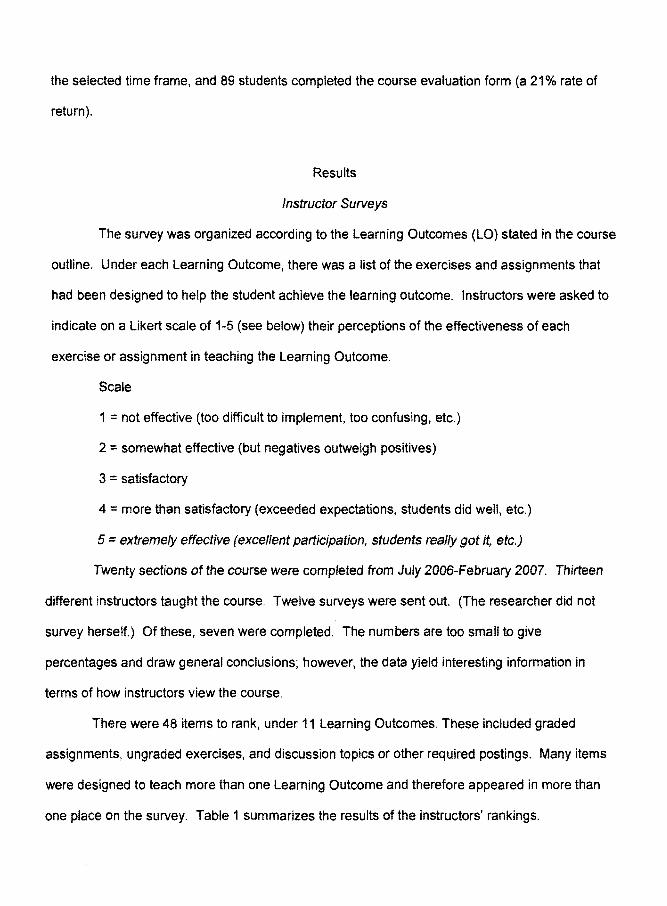
The survey was organized according to the Learning Outcomes {LO) stated in the course
outline. Under each Learning Outcome, there was a list of the exercises and assignments that
had been designed to help the student achieve the learning outcome. Instructors were asked to
indicate on a Likert scale of 1-5 (see below) their perceptions of the effectiveness of each
exercise or assignment in teaching the Learning Outcome.
Scale
1 = not effective (too difficult to implement, too confusing, etc.)
2 =somewhat effective {but negatives outweigh positives)
3 = satisfactory
4 = more than satisfactory (exceeded expectations, students did well, etc.)
5 =extremely effective (excellent participation, students really got it, etc.)
Twenty sections of the course were completed from July 2006-February 2007. Thirteen
different instructors taught the course. Twelve surveys were sent out. (The researcher did not
survey herself.) Of these, seven were completed. The numbers are too small to give
percentages and draw general conclusions; however, the data yield interesting information in
terms of how instructors view the course.
There were 48 items to rank, under 11 Learning Outcomes. These included graded
assignments, ungraded exercises, and discussion topics or other required postings. Many items
were designed to teach more than one Learning Outcome and therefore appeared in more than
one place on the survey. Table 1 summarizes the results of the instructors' rankings.
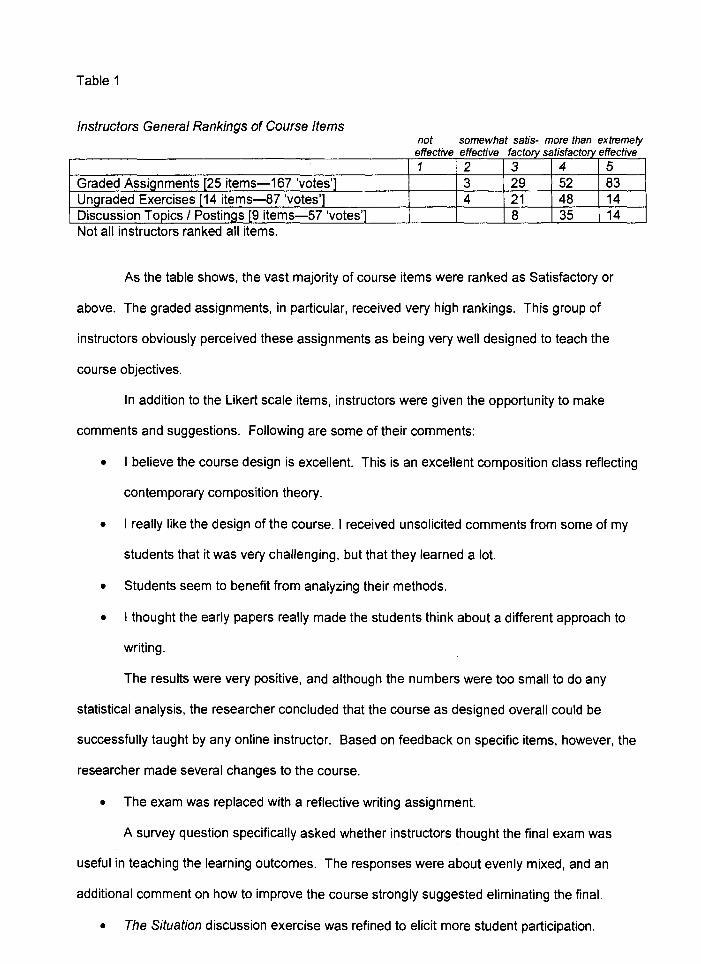
Table 1
Instructors General Rankings of Course Items not somewhat satis- more than extremely
e ec 1ve e ec 1ve ac ory sa 1s ac ory e ec 1ve ffif ffif f.t ff.t ffif 1 2 3 4 5
Graded Assignments [25 items-167 'votes'] 3 29 52 83 Unaraded Exercises [14 items-87 'votes'l 4 21 48 14 Discussion Topics I Postings [9 items-57 'votes'] 8 35 14 Not all instructors ranked all items.
As the table shows, the vast majority of course items were ranked as Satisfactory or
above. The graded assignments, in particular, received very high rankings. This group of
instructors obviously perceived these assignments as being very well designed to teach the
course objectives.
In addition to the Likert scale items, instructors were given the opportunity to make
comments and suggestions. Following are some of their comments:
• I believe the course design is excellent. This is an excellent composition class reflecting
contemporary composition theory.
• I really like the design of the course. I received unsolicited comments from some of my
students that it was very challenging, but that they learned a lot.
• Students seem to benefit from analyzing their methods.
• I thought the early papers really made the students think about a different approach to
writing.
The results were very positive, and although the numbers were too small to do any
statistical analysis, the researcher concluded that the course as designed overall could be
successfully taught by any online instructor. Based on feedback on specific items, however, the
researcher made several changes to the course.
• The exam was replaced with a reflective writing assignment.
A survey question specifically asked whether instructors thought the final exam was
useful in teaching the learning outcomes. The responses were about evenly mixed, and an
additional comment on how to improve the course strongly suggested eliminating the final.
• The Situation discussion exercise was refined to elicit more student participation.
Several instructors commented on the struggle to get or keep students involved, although
all those who responded to the survey wanted to keep the exercise in the course.
• The time period was shortened for the Exploratory Research paper, and the grade weight
was reduced.
• The time period was lengthened for the Classical Argument Position Paper.
• Grade weights for other assignments were adjusted.
These changes were made as a result of instructors' feedback on the Classical Argument
Position Paper, which is the capstone assignment for the course, and an earlier research
assignment, the Exploratory Research Paper with Research Log. Most instructors believed the
Exploratory Research Paper was valuable, but some expressed a desire to have greater
emphasis on a more formal tone in writing research papers. This formal tone is required in the
Classical Argument paper and not required in the Exploratory paper.
The researcher took into account the reality that most research papers will require the
more formal tone, and while not eliminating the tone facet of the Exploratory assignment,
changed the emphasis by allocating additional time for the Classical Argument assignment and
reducing the time allocation for and grade weight of the Exploratory assignment. The lengthened
time period for the Classical Argument assignment also allowed for the addition of instruction on
the persuasive strategies of ethos and pathos and the addition of an instructor review of students'
drafts before they submitted their final papers.
Finally, the changes in the two research assignments necessitated the adjustment of
grade weights for a number of other assignments.
Student Surveys
The researcher's review of the student evaluations of the course revealed that the great
majority of students were satisfied or more than satisfied with the course structure documents I I
assignments and exercises (ENGL 123 student end-of-course evaluations, 2006-2007). The
results are summarized in Table 2.
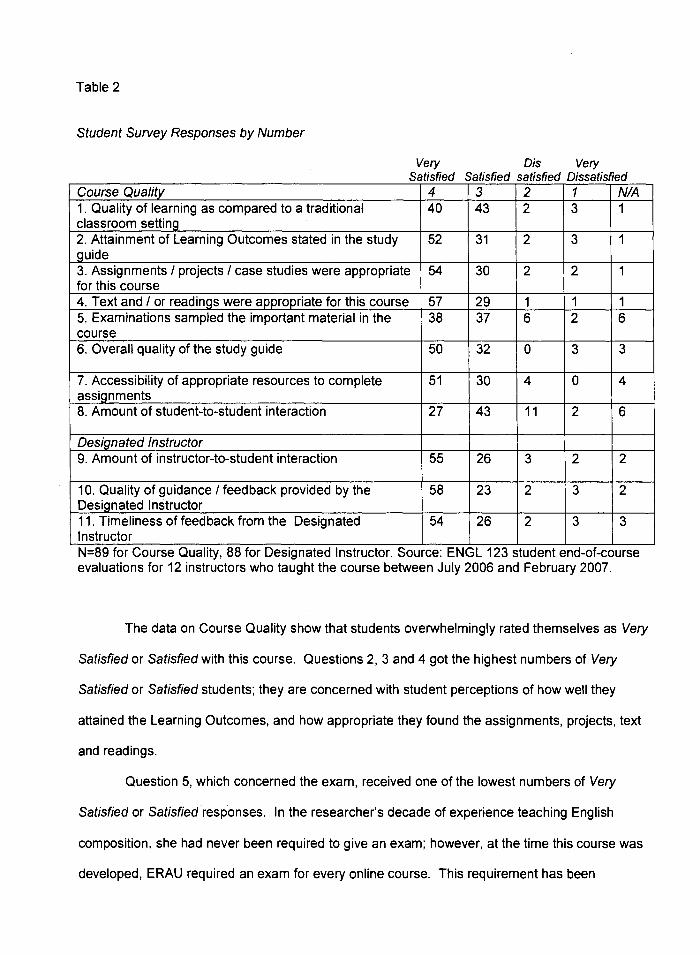
Table 2
Student Survey Responses by Number
Very Dis Very Satisfied Satisfied satisfied Dissatisfied
Course Quality 4 3 2 1 NIA 1. Quality of learning as compared to a traditional 40 43 2 3 1 classroom setting 2. Attainment of Learning Outcomes stated in the study 52 31 2 3 1 guide 3. Assignments I projects I case studies were appropriate 54 30 2 2 1 for this course 4. Text and I or readings were appropriate for this course 57 29 1 1 1 5. Examinations sampled the important material in the 38 37 6 2 6 course 6. Overall quality of the study guide 50 32 0 3 3
7. Accessibility of appropriate resources to complete 51 30 4 0 4 assignments 8. Amount of student-to-student interaction 27 43 11 2 6
Designated Instructor 9. Amount of instructor-to-student interaction 55 26 3 2 2
10. Quality of guidance I feedback provided by the 58 23 2 3 2 Designated Instructor 11. Timeliness of feedback from the Designated 54 26 2 3 3 Instructor N=89 for Course Quality, 88 for Designated Instructor. Source: ENGL 123 student end-of-course evaluations for 12 instructors who taught the course between July 2006 and February 2007.
The data on Course Quality show that students overwhelmingly rated themselves as Very
Satisfied or Satisfied with this course. Questions 2, 3 and 4 got the highest numbers of Very
Satisfied or Satisfied students; they are concerned with student perceptions of how well they
attained the Learning Outcomes, and how appropriate they found the assignments, projects, text
and readings.
Question 5, which concerned the exam, received one of the lowest numbers of Very
Satisfied or Satisfied responses. In the researcher's decade of experience teaching English
composition, she had never been required to give an exam; however, at the time this course was
developed, ERAU required an exam for every online course. This requirement has been
eliminated, and one of the changes the researcher made to the course was to eliminate the
exam.
The relatively low numbers of Very Satisfied or Satisfied students in question 8 were
supported by additional comments indicating that students wanted more interaction with other
students. The researcher has made changes to address this.
The data on the Designated Instructor show high numbers of students who were Very
Satisfied or Satisfied with the instructor's performance. The researcher interprets this as
indicating that instructors were well prepared to teach and exhibited dedication in serving their
students. Further, the researcher believes this shows that the course and supporting materials
were well designed.
Table 3 and Figures 2 and 3 show the percentages of students who ranked themselves
as Very Satisfied or Satisfied with the course quality and the designated instructor.
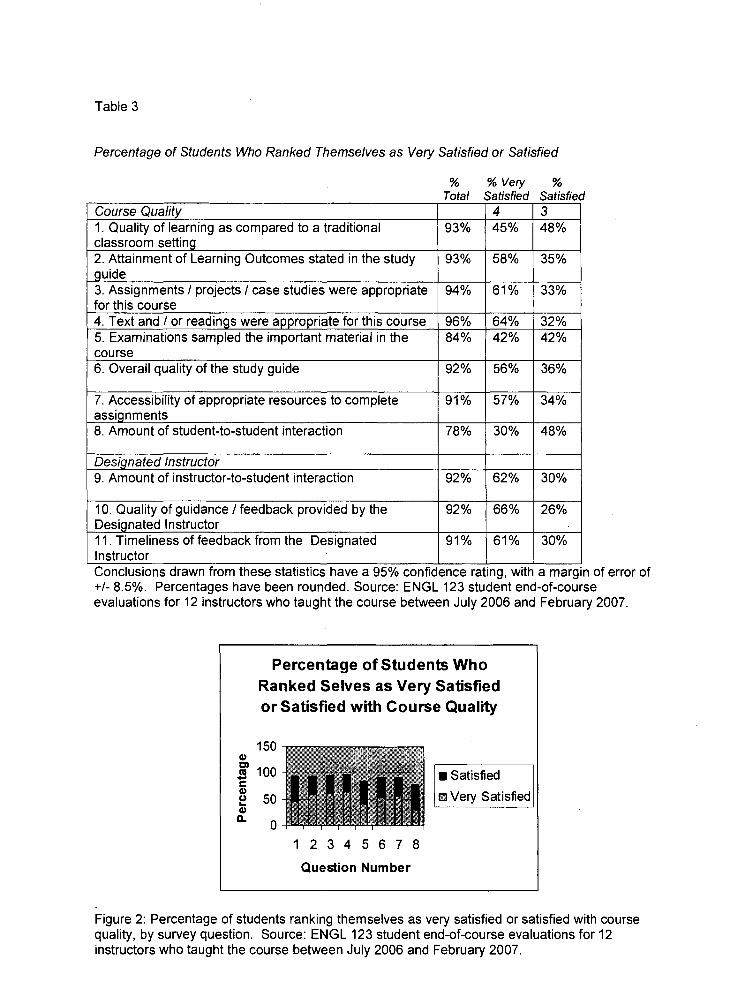
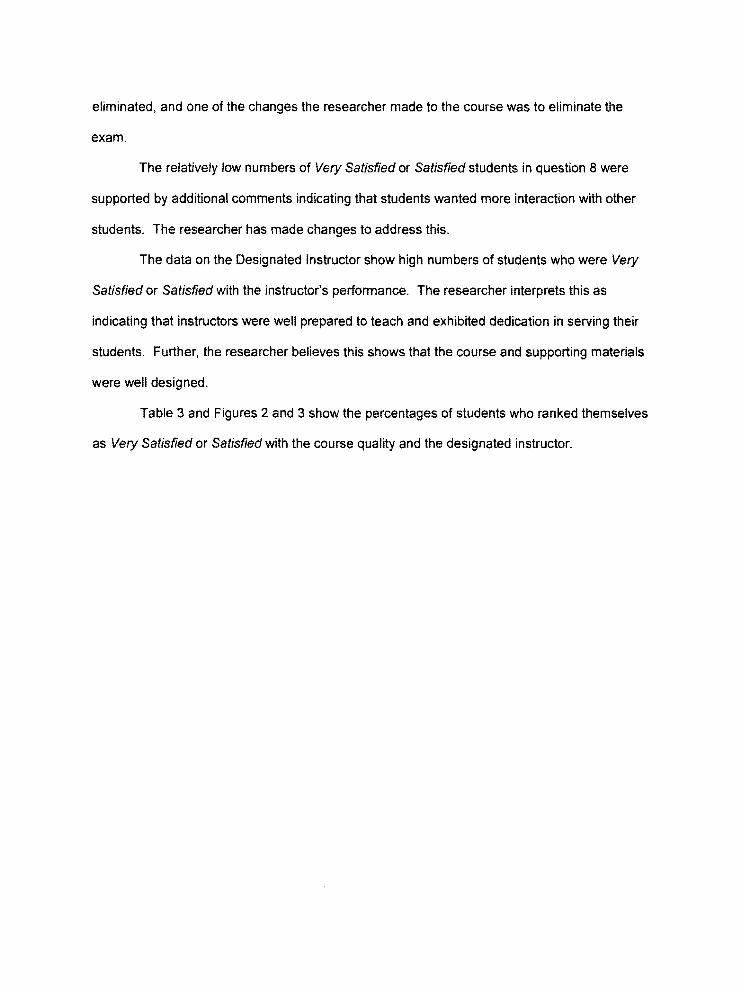
Table 3
Percentage of Students Who Ranked Themselves as Very Satisfied or Satisfied
% % Vel}' % Total Satisfied Satisfied
Course Quality 4 3 1. Quality of learning as compared to a traditional 93% 45% 48% classroom setting 2. Attainment of Learning Outcomes stated in the study 93% 58% 35% quide 3. Assignments I projects I case studies were appropriate 94% 61% 33% for this course 4. Text and I or readinqs were appropriate for this course 96% 64% 32% 5. Examinations sampled the important material in the 84% 42% 42% course 6. Overall quality of the study guide 92% 56% 36%
7. Accessibility of appropriate resources to complete 91% 57% 34% assignments 8. Amount of student-to-student interaction 78% 30% 48%
Designated Instructor 9. Amount of instructor-to-student interaction 92% 62% 30%
10. Quality of guidance I feedback provided by the 92% 66% 26% Designated Instructor 11. Timeliness of feedback from the Designated 91% 61% 30% Instructor Conclusions drawn from these statistics have a 95% confidence rating, with a margin of error of +/- 8.5%. Percentages have been rounded. Source: ENGL 123 student end-of-course evaluations for 12 instructors who taught the course between July 2006 and February 2007.
Percentage of Students Who Ranked Selves as Very Satisfied or Satisfied with Course Quality
150 Cl)
J 100 c: •Satisfied Cl)
~ 50 ([I Very Satisfied Cl)
ll.. 0
12345678
Question Number
Figure 2: Percentage of students ranking themselves as very satisfied or satisfied with course quality, by survey question. Source: ENGL 123 student end-of-course evaluations for 12 instructors who taught the course between July 2006 and February 2007.
Percentage of Students Who Ranked Selves as Very Satisfied
or Satisfied with Designated Instructor
G> 100 m J! c 50 ~ :. 0
•Satisfied
m Very Satisfied
9 10 11
Question Number
Figure 3: Percentage of students ranking themselves as very satisfied or satisfied with performance of designated course instructor, by survey question. Source: ENGL 123 student end-of-course evaluations for 12 instructors who taught the course between July 2006 and February 2007.
The final data from the student surveys came from Question 33, which asked students
how much time they spent per week working on course materials/assignments. Students were
given five choices, and Table 4 and Figure 4 summarize their answers.
Table 4
Number of Hours per Week Spent Working on Course Materials/Assignments
N=87. Source: ENGL 123 student end-of-course evaluations for 12 instructors who taught the course between July 2006 and February 2007.
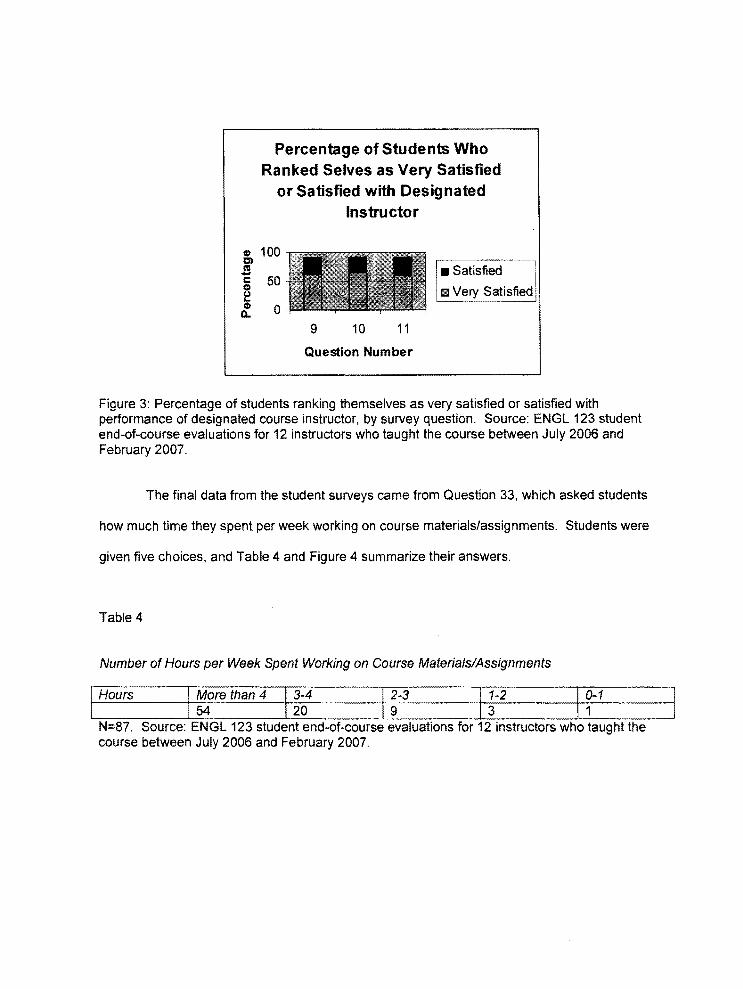
Q) 80 Ol 60 s 5i 40 i: 20 :. 0
Percentage of Students according to Time Spent on
Course
more 3 to 4 2 to 3 1 to 2 O to 1 than 4
Hours
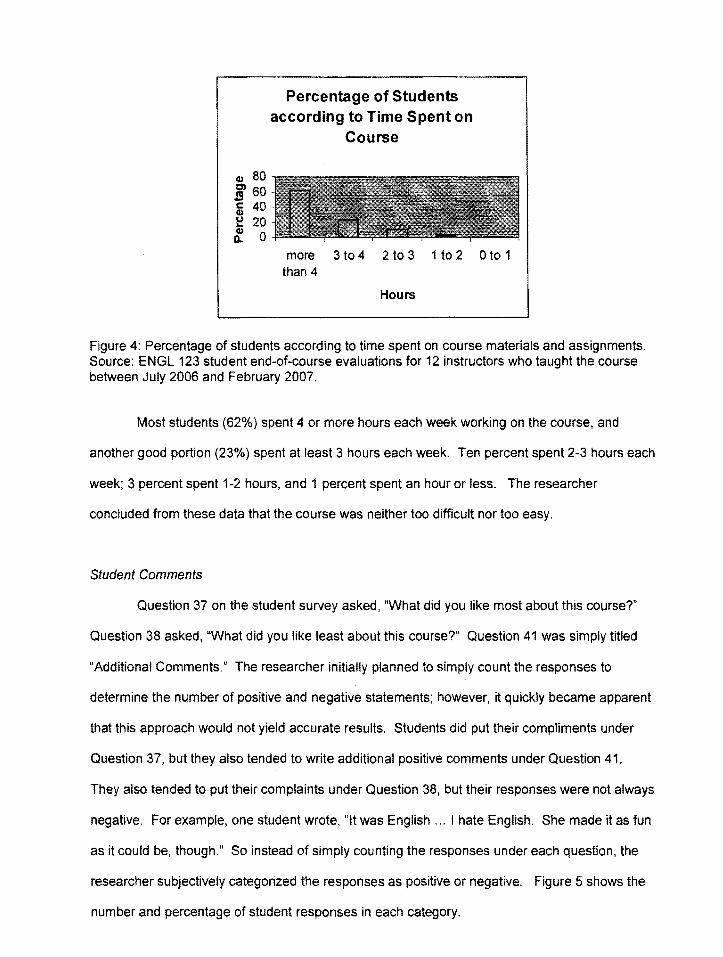
Figure 4: Percentage of students according to time spent on course materials and assignments. Source: ENGL 123 student end-of-course evaluations for 12 instructors who taught the course between July 2006 and February 2007.
Most students (62%) spent 4 or more hours each week working on the course, and
another good portion (23%) spent at least 3 hours each week. Ten percent spent 2-3 hours each
week; 3 percent spent 1-2 hours, and 1 percent spent an hour or less. The researcher
concluded from these data that the course was neither too difficult nor too easy.
Student Comments
Question 37 on the student survey asked, "What did you like most about this course?"
Question 38 asked, "What did you like least about this course?" Question 41 was simply titled
"Additional Comments." The researcher initially planned to simply count the responses to
determine the number of positive and negative statements; however, it quickly became apparent
that this approach would not yield accurate results. Students did put their compliments under
Question 37, but they also tended to write additional positive comments under Question 41.
They also tended to put their complaints under Question 38, but their responses were not always
negative. For example, one student wrote, "It was English ... I hate English. She made it as fun
as it could be, though." So instead of simply counting the responses under each question, the
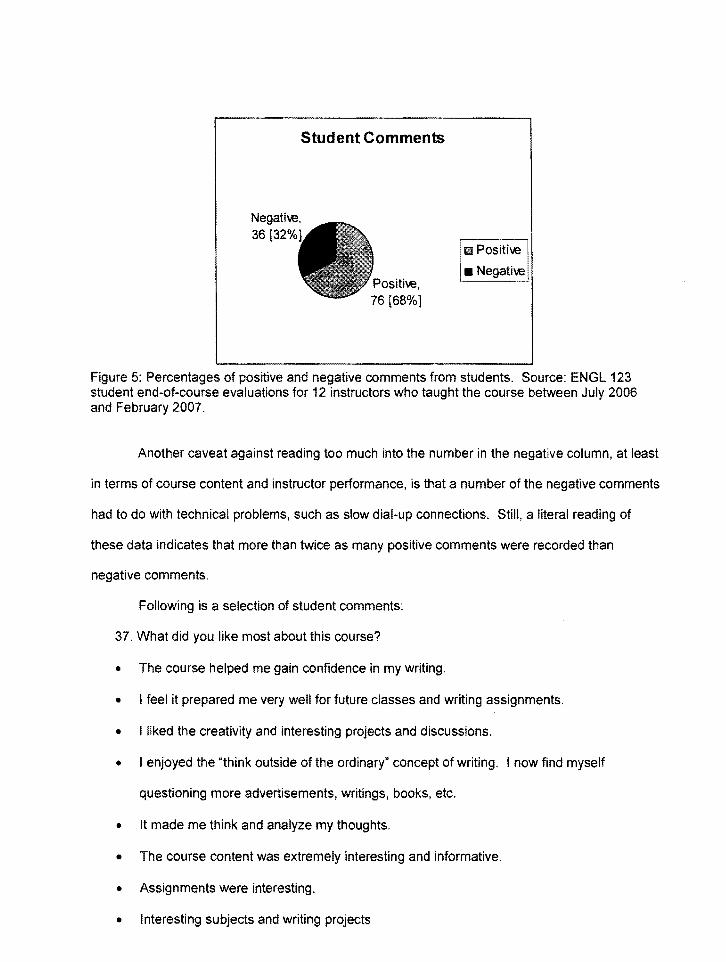
researcher subjectively categorized the responses as positive or negative. Figure 5 shows the
number and percentage of student responses in each category.
Student Comments
Negati-.e, 36 [32%}
m Positi-.e
• Negati-.e
Figure 5: Percentages of positive and negative comments from students. Source: ENGL 123 student end-of-course evaluations for 12 instructors who taught the course between July 2006 and February 2007.
Another caveat against reading too much into the number in the negative column, at least
in terms of course content and instructor performance, is that a number of the negative comments
had to do with technical problems, such as slow dial-up connections. Still, a literal reading of
these data indicates that more than twice as many positive comments were recorded than
negative comments.
Following is a selection of student comments:
37. What did you like most about this course?
• The course helped me gain confidence in my writing.
• I feel it prepared me very well for future classes and writing assignments.
• I liked the creativity and interesting projects and discussions.
• I enjoyed the "think outside of the ordinary" concept of writing. I now find myself
questioning more advertisements, writings, books, etc.
• It made me think and analyze my thoughts.
• The course content was extremely interesting and informative.
• Assignments were interesting.
• Interesting subjects and writing projects
• Brought me back to basics. Wish I had taken this earlier, would have made research
papers a lot easier.
• The material. It's a very well laid out course.
• The course helped me to explore a variety of writing styles and new ideas I had not been
previously exposed to.
• The work was relevant to exploring writing concepts.
• Good relation between study assignments to writing assignments.
• Good course for getting back to the role of student after 30 year hiatus.
• This is my first online course and now I will probably do many more online courses due to
the positive experience with this course.
38. What did you like least about this course?
• A couple of the assignments seemed strange.
• Assignments childish. Mostly busy work to make sure all boxes were checked ... a
massive waste of time and energy.
• The lack of interaction between everyone involved.
• I missed being in a classroom
• Not having the same interaction with your classmates as you do in a sit down course.
• Student interaction. Once I had a grasp of a subject, I felt no need to remain online. Had
no interest in responding to other students.
• Too much work and too many deadlines. Hard to keep up.
• Difficult to learn
• I was not happy with the final examination. It is hard to test a student on his/her writing
techniques with a multiple choice test.
Conclusions
It is reasonable to conclude that one way to assess the effectiveness of a course is to try
to discover how well the learning outcomes have been achieved. Yet such discovery is often
elusive. Grades are unreliable, given the widespread reality of grade inflation. Tracking students
in subsequent courses would be informative and should, perhaps, be tried, but such results would
take time. For a new course with the potential to affect the education of so many students, a
more immediate process seemed advisable. As a measure of instructors' confidence in the ability
of ENGL 123 to achieve the learning outcomes, the survey worked quite well. The instructors'
perceptions were also reinforced by the results of the student surveys. Therefore, the researcher
has confidence that the course is broadly viable for instructors with many different teaching
styles.
As a means of establishing a learning outcomes-based process for continuous
improvement. the researcher also believes the survey worked quite well. As indicated, the
researcher has made several changes to the course, based on feedback received. The
researcher plans to continue to use the survey to collect data on the course, and she
recommends this process to others.
The real test of success for this course, however, will have to come further down the
road. As an ideal outcome, student writing will improve, and this will be reflected in the quality of
assignments in other courses, and ultimately in the improvement of employers' ratings of
graduates' writing competence.
1 The researcher used data obtained from the Employer Feedback Survey, Interim Report: Classes of 2001-2003. This report is no longer available. Data from this report have been integrated into the Employer Feedback Survey, Classes of 2001-2004. However, the interim report is cited for this study because the data from that report were the most current available at the time of Dr. Sieland's analysis, which served to provide broad, data-supported context for the need for improvement in writing instruction at Embry-Riddle Aeronautical University. The Employer Feedback Survey, Classes of 2001-2004 is cited in the References list for those who would like to view updated information. Dr. Sieland's analysis, including data tables, is in Appendix A
References
DDL no more. (2007, March). [Discussion thread]. Developing on/ine course materials. FACD 703
sec. 1.
Embry-Riddle Aeronautical University. Office of Institutional Research. (2007, June). Employer
feedback survey: Classes of 2001-2004. Retrieved July 25, 2007, from ERAU Institutional
Research web site: http://irweb.erau.edu
Emery, B. (Compiler). (2007, July 24). [Spreadsheets showing students in MAS program for
classes of 2001-2003, and degrees earned]. Unpublished raw data.
ENGL 123 student end-of-course evaluations. (2006-2007). Unpublished raw data.
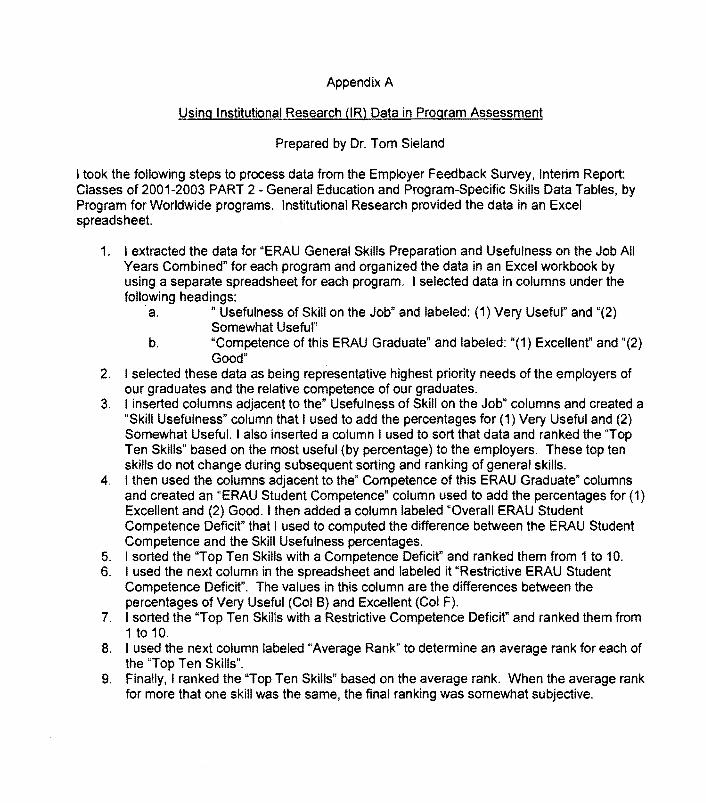
Appendix A
Using Institutional Research (IR) Data in Program Assessment
Prepared by Dr. Tom Sieland
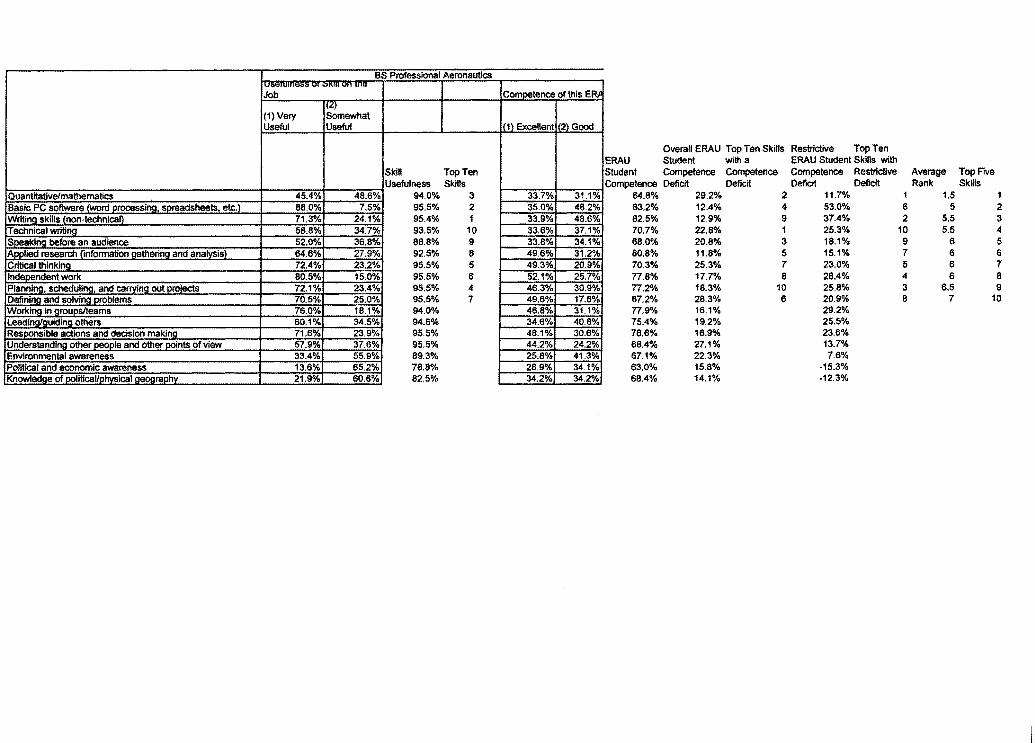
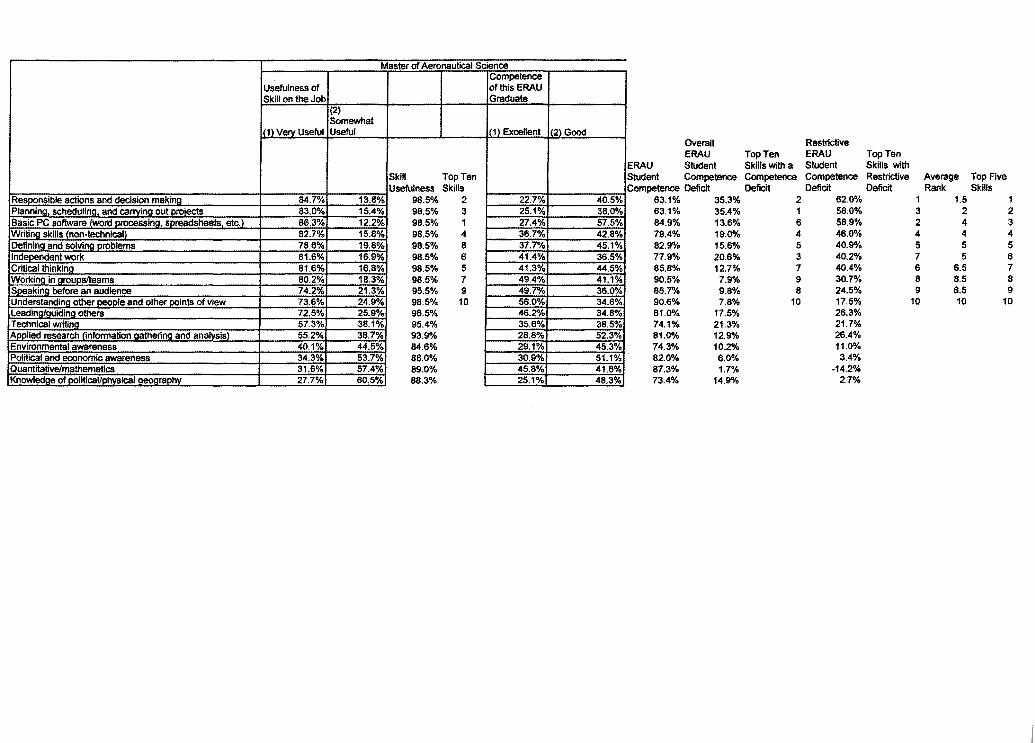
I took the following steps to process data from the Employer Feedback Survey, Interim Report: Classes of 2001-2003 PART 2 - General Education and Program-Specific Skills Data Tables, by Program for Worldwide programs. Institutional Research provided the data in an Excel spreadsheet.
1. I extracted the data for "ERAU General Skills Preparation and Usefulness on the Job All Years Combined" for each program and organized the data in an Excel workbook by using a separate spreadsheet for each program. I selected data in columns under the following headings:
·a. "Usefulness of Skill on the Job" and labeled: (1) Very Useful" and "(2) Somewhat Useful"
b. "Competence of this ERAU Graduate" and labeled: "(1) Excellent" and "(2) Good"
2. I selected these data as being representative highest priority needs of the employers of our graduates and the relative competence of our graduates.
3. I inserted columns adjacent to the" Usefulness of Skill on the Job" columns and created a "Skill Usefulness" column that I used to add the percentages for (1) Very Useful and (2) Somewhat Useful. I also inserted a column I used to sort that data and ranked the 'Top Ten Skills" based on the most useful (by percentage) to the employers. These top ten skills do not change during subsequent sorting and ranking of general skills.
4. t then used the columns adjacent to the" Competence of this ERAU Graduate" columns and created an "ERAU Student Competence" column used to add the percentages for (1} Excellent and (2} Good. I then added a column labeled "Overall ERAU Student Competence Deficit" that I used to computed the difference between the ERAU Student Competence and the Skill Usefulness percentages.
5. I sorted the "Top Ten Skills with a Competence Deficit" and ranked them from 1 to 10. 6. I used the next column in the spreadsheet and labeled it "Restrictive ERAU Student
Competence Deficit". The values in this column are the differences between the percentages of Very Useful (Col B) and Excellent (Col F}.
7. I sorted the "Top Ten Skills with a Restrictive Competence Deficit" and ranked them from 1 to 10.
8. I used the next column labeled "Average Rank" to determine an average rank for each of the "Top Ten Skills".
9. Finally, I ranked the "Top Ten Skills" based on the average rank. When the average rank for more that one skill was the same, the final ranking was somewhat subjective.
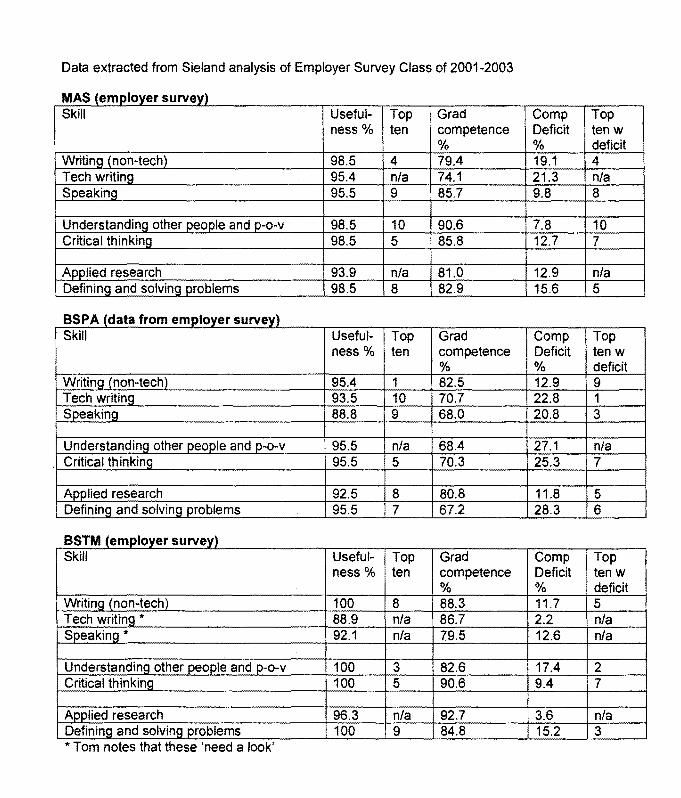
Data extracted from Sieland analysis of Employer Survey Class of 2001-2003
MAS (employer survey) Skill Useful- Top Grad Comp Top
ness% ten competence Deficit ten w % % deficit
Writing (non-tech) 98.5 4 79.4 19.1 4 Tech writing 95.4 n/a 74.1 21.3 n/a Speaking 95.5 9 85.7 9.8 8
Understanding other people and p-o-v 98.5 10 90.6 7.8 10 Critical thinking 98.5 5 85.8 12.7 7
Aoolied research 93.9 nla 81.0 12.9 n/a Defining and solving problems 98.5 8 82.9 15.6 5
BSPA (data from employer survey) Skill Useful- Top Grad Comp Top
ness % ten competence Deficit tenw % % deficit
Writing (non-tech) 95.4 1 82.5 12.9 9 Tech writing 93.5 10 70.7 22.8 1 Speaking 88.8 9 68.0 20.8 3
Understanding other people and p-o-v 95.5 n/a 68.4 27.1 n/a Critical thinking 95.5 5 70.3 25.3 7
Applied research 92.5 8 80.8 11.8 5 Defining and solving problems 95.5 7 67.2 28.3 6
BSTM (employer survey) Skill Useful- Top Grad Comp Top
ness % ten competence Deficit ten w % % deficit
Writing (non-tech) 0 8 88.3 11.7 5 Tech writing * 88.9 n/a 86.7 2.2 n/a Speakina * 92.1 n/a 79.5 12.6 n/a
Understanding other people and p-o-v 100 3 82.6 17.4 2 Critical thinkina 100 5 90.6 9.4 7
APPiied research 96.3 n/a 92.7 3.6 n/a Defining and solving problems 100 9 84.8 15.2 3 *Tom notes that these 'need a look'
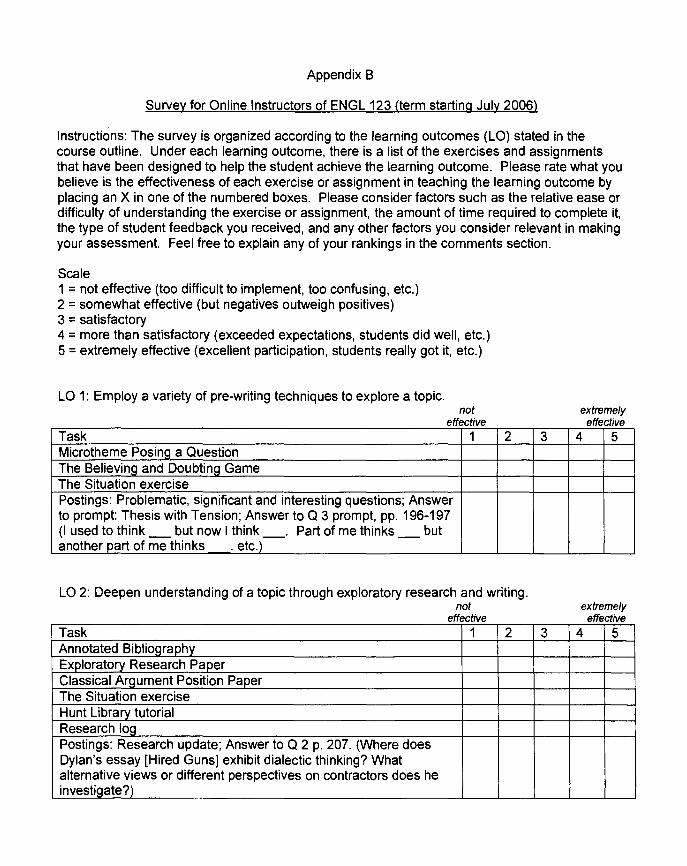
Appendix 8
Survey for Online Instructors of ENGL 123 (term starting July 2006)
Instructions: The survey is organized according to the learning outcomes (LO) stated in the course outline. Under each learning outcome, there is a list of the exercises and assignments that have been designed to help the student achieve the learning outcome. Please rate what you believe is the effectiveness of each exercise or assignment in teaching the learning outcome by placing an X in one of the numbered boxes. Please consider factors such as the relative ease or difficulty of understanding the exercise or assignment, the amount of time required to complete it, the type of student feedback you received, and any other factors you consider relevant in making your assessment. Feel free to explain any of your rankings in the comments section.
Scale 1 = not effective (too difficult to implement, too confusing, etc.) 2 =somewhat effective (but negatives outweigh positives) 3 = satisfactory 4 =more than satisfactory (exceeded expectations, students did well, etc.) 5 =extremely effective (excellent participation, students really got it, etc.)
LO 1: Employ a variety of pre-writing techniques to explore a topic.
Task Microtheme PosinQ a Question The Believing and DoubtinQ Game The Situation exercise
not effective
1
Postings: Problematic, significant and interesting questions; Answer to prompt: Thesis with Tension; Answer to Q 3 prompt, pp. 196-197 (I used to think_ but now I think_. Part of me thinks - but another part of me thinks . etc.)
2
LO 2: Deepen understanding of a topic through exploratory research and writing. not
effective
Task 1 2 Annotated BiblioQraphy Exploratory Research Paper Classical ArQument Position Paper The Situation exercise Hunt Library tutorial Research log Postings: Research update; Answer to Q 2 p. 207. (Where does Dylan's essay [Hired Guns] exhibit dialectic thinking? What alternative views or different perspectives on contractors does he investiQate?)
3
3
extremely effective
4 5
extremely effective
4 5
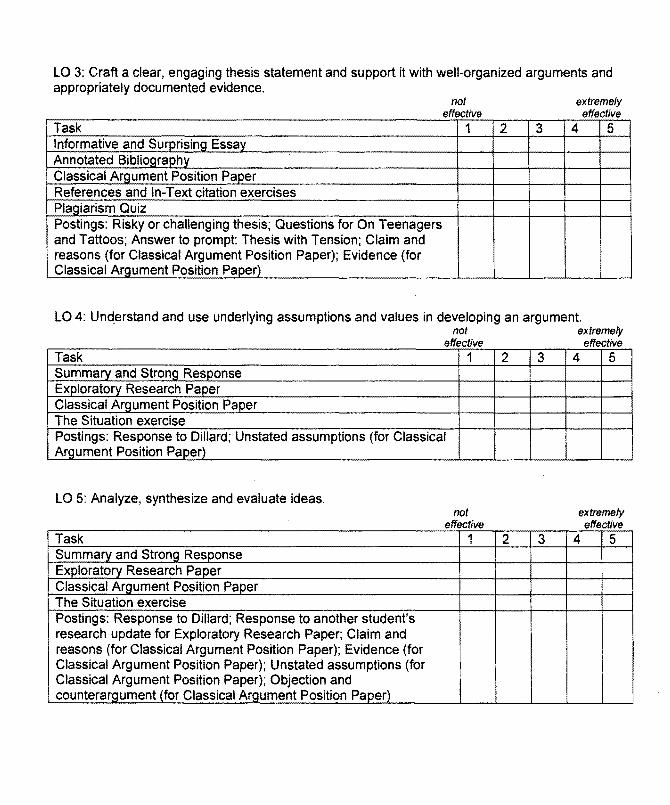
LO 3: Craft a clear, engaging thesis statement and support it with well-organized arguments and appropriately documented evidence.
Task Informative and Surprisino Essay Annotated Bibliography Classical ArQument Position Paper References and In-Text citation exercises Plagiarism Quiz Postings: Risky or challenging thesis; Questions for On Teenagers and Tattoos: Answer to prompt: Thesis with Tension; Claim and reasons (for Classical Argument Position Paper); Evidence (for Classical Argument Position Paper)
not effective
1 2 3
extremely effective
4 5
LO 4: Und.erstand and use underlying assumptions and values in developing an argument. not extremely
effective effective
Task 1 2 3 4 5 Summary and Strong Response Exploratory Research Paper Classical Argument Position Paper The Situation exercise Postings: Response to Dillard; Unstated assumptions (for Classical Argument Position Paoer)
LO 5: Analyze, synthesize and evaluate ideas.
Task Summary and Strong Response Exploratory Research Paper Classical Argument Position Paper The Situation exercise Postings: Response to Dillard; Response to another student's research update for Exploratory Research Paper; Claim and reasons (for Classical Argument Position Paper); Evidence (for Classical Argument Position Paper); Unstated assumptions (for Classical Argument Position Paper}; Objection and counteraroument (for Classical Aroument Position Paper)
not effective
1 2 3
extremely effective
4 5
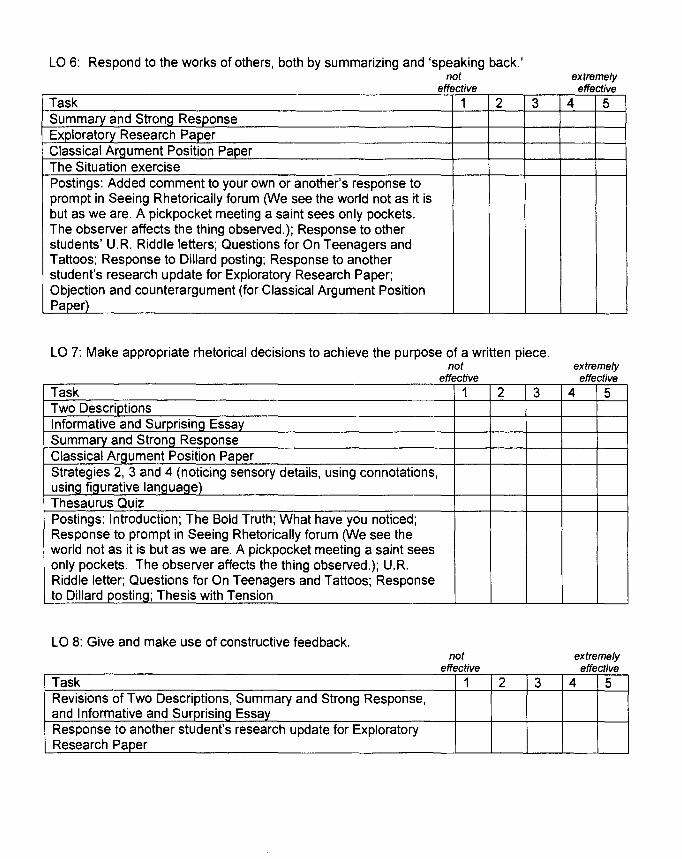
LO 6: Respond to the works of others, both by summarizing and 'speaking back.' not extremely
effective effective Task 1 2 3 4 5 Summary and StronQ Response Exploratory Research Paper Classical Araument Position Paper The Situation exercise Postings: Added comment to your own or another's response to prompt in Seeing Rhetorically forum 0/1/e see the world not as it is but as we are. A pickpocket meeting a saint sees only pockets. The observer affects the thing observed.); Response to other students' U.R. Riddle letters; Questions for On Teenagers and Tattoos; Response to Dillard posting; Response to another student's research update for Exploratory Research Paper; Objection and counterargument (for Classical Argument Position Paper)
LO 7: Make appropriate rhetorical decisions to achieve the purpose of a written piece.
Task Two Descriptions Informative and Surprising Essay Summary and Strong Response Classical Araument Position Paper Strategies 2, 3 and 4 (noticing sensory details, using connotations, usina fiaurative lanauaae) Thesaurus Quiz Postings: Introduction; The Bold Truth; What have you noticed; Response to prompt in Seeing Rhetorically forum (We see the world not as it is but as we are. A pickpocket meeting a saint sees only pockets. The observer affects the thing observed.); U.R. Riddle letter; Questions for On Teenagers and Tattoos; Response to Dillard posting; Thesis with Tension
LO 8: Give and make use of constructive feedback.
Task Revisions of Two Descriptions, Summary and Strong Response, and Informative and Surprising Essay Response to another student's research update for Exploratory Research Paper
not extremely effective effective
1
not effective
1
2 3
2 3
4 5
extremely effective
4 5
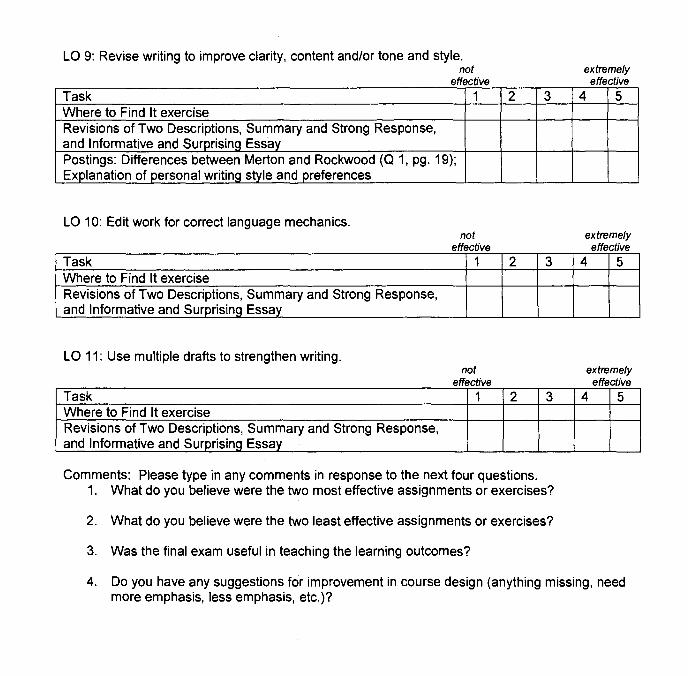
LO 9: Revise writing to improve clarity, content and/or tone and style. not
effective
Task 1 2 3 Where to Find It exercise Revisions of Two Descriptions, Summary and Strong Response, and Informative and Surprising Essay Postings: Differences between Merton and Rockwood (Q 1, pg. 19); Explanation of personal writing style and preferences
LO 10: Edit work for correct language mechanics. not
effective
Task 1 2 3 Where to Find It exercise Revisions of Two Descriptions, Summary and Strong Response, and Informative and Surprising Essay
LO 11: Use multiple drafts to strengthen writing. not
effective
Task 1 2 3 Where to Find It exercise Revisions of Two Descriptions, Summary and Strong Response, and Informative and Surprising Essay
Comments: Please type in any comments in response to the next four questions. 1. What do you believe were the two most effective assignments or exercises?
2. What do you believe were the two least effective assignments or exercises?
3. Was the final exam useful in teaching the learning outcomes?
extremely effective
4 5
extremely effective
4 5
extremely effective
4 5
4. Do you have any suggestions for improvement in course design (anything missing, need more emphasis, less emphasis, etc.)?
----····--------
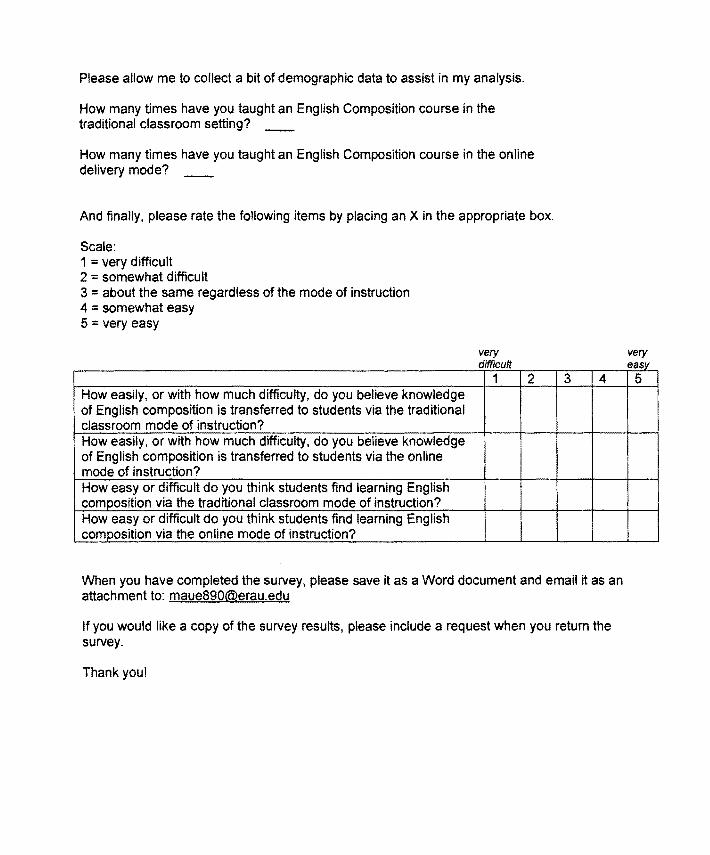
Please allow me to collect a bit of demographic data to assist in my analysis.
How many times have you taught an English Composition course in the traditional classroom setting? __
How many times have you taught an English Composition course in the online delivery mode? __
And finally, please rate the following items by placing an X in the appropriate box.
Scale: 1 =very difficult 2 =somewhat difficult 3 = about the same regardless of the mode of instruction 4 = somewhat easy 5 =very easy
How easily, or with how much difficulty, do you believe knowledge of English composition is transferred to students via the traditional classroom mode of instruction? How easily, or with how much difficulty, do you believe knowledge of English composition is transferred to students via the on line mode of instruction? How easy or difficult do you think students find learning English composition via the traditional classroom mode of instruction? How easy or difficult do you think students find learning English composition via the online mode of instruction?
very d'ffi It I ICU
1 2 3 4
When you have completed the survey, please save it as a Word document and email it as an attachment to: [email protected]
If you would like a copy of the survey results, please include a request when you return the survey.
Thank you!
very easy
5
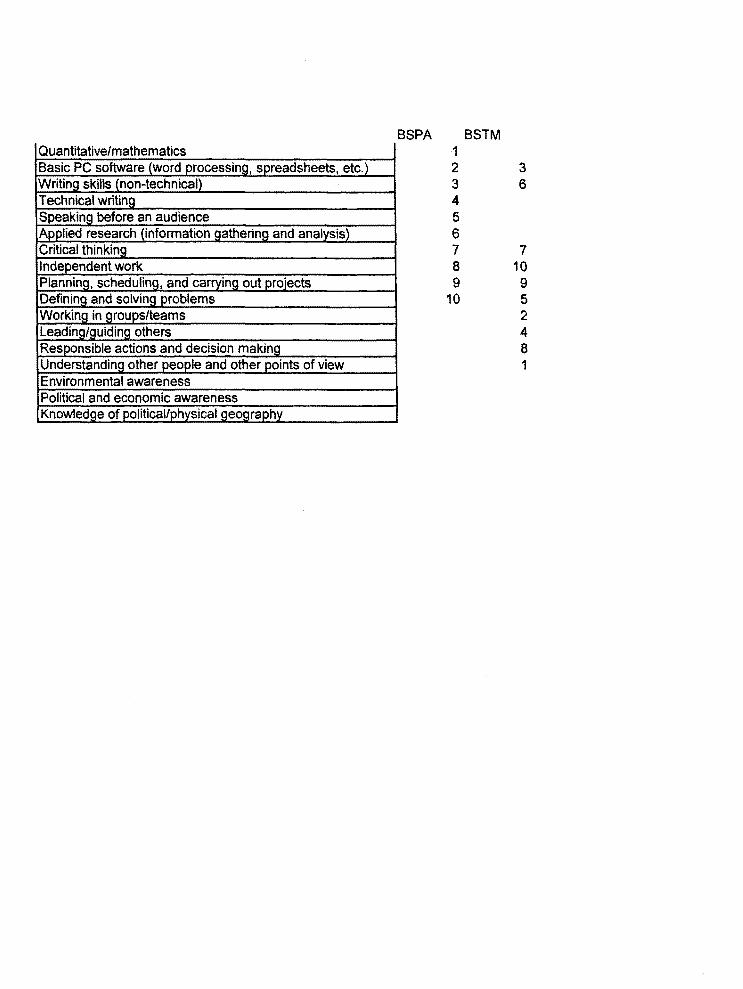
Quantitative/mathematics BSPA BSTM
1 2 3 3 6 4 5 6 7 7 8 10 9 9
10 5 2 4 8 1
BS Professional Aeronautics osemmess 01 sRm on me f I Job
G~"' 1=-- I I '" 1° I Overall ERAU Top Ten Skills Restrictive Top Ten
ERAU Student With a ERAU Student Skills with Skill Top Ten Student Competence Competence Competence Restrictive Average Top Five Usefulness Skills Competence Deficit Deficit Deficit Deficit Rank Skills
45.4% 48.6% 94.0% 3 33.7% 31.1% 64.8% 29.2% 2 11.7% 1 1.5 1 88.0% 7.5% 95.5% 2 35.0% 48.2% 83.2% 12.4% 4 53.0% 6 5 2 71.3% 24.1% 95.4% 1 33.9% 48.6% 82.5% 12.9% 9 37.4% 2 5.5 3 58.8% 34.7% 93.5% 10 33.6% 37.1% 70.7% 22.8% 1 25.3% 10 5.5 4 52.0o/o 88.8% 9 33.8% 34.1% 68.0% 20.8% 3 18.1% 9 6 5
92.5% 8 49.6% 31.2% 80.8% 11.8% 5 15.1% 7 6 6 95.5% 5 49.3% 20.9% 70.3% 25.3% 7 23.0% 5 6 7 95.5% 6 52.1% 25.7% 77.8% 17.7% 8 28.4% 4 6 8 95.5% 4 46.3% 30.9% n.2% 18.3% 10 25.8% 3 6.5 s 95.5% 7 49.6% 17.6% 67.2% 28.3% 6 20.9% 8 7 10 94.0% 46.8% 31.1% n.9% 16.1% 29.2% 94.6% 34.6% 40.8% 75.4% 19.2% 25.5% 95.5% 48.1% 30.6% 78.6% 16.9% 23.6% 95.5% 44.2% 24.2% 68.4% 27.1% 13.7%
33.4% 89.3% 25.8% 41.3% 67.1% 22.3% 7.6% 13.6% 78.8% 28.9% 34.1% 63.0% 15.8% -15.3% 21.9% 60.6% 82.5% 34.2% 34.2% 66.4% 14.1% -12.3%

Usefulness of Skill on the Job
(2) Skill (1) Very Somewhat Usefulnes Top Ten Useful Useful s Skills
84.3% 15.7% 100.0% 3 88.4% 7.4% 95.9% 2 92.9% 7.1% 100.0"k 1 62.5% 37.5% 100.0% 10 67.2% 32.8% 100.0% 9 73.1% 26.9% 100.0% 8 83.6% 16.4% 100.0% 5 83.6% 16.4% 100.0% 6 84.2% 15.8% 100.0% 4 83.5% 16.5% 100.0% 7 57.0o/o 39.3% 96.3% 54.3% 34.6% 88.9% 48.5% 26.7% 75.3% 47.7% 44.5% 92.1% 43.8% 20.7% 64.4% 37.1% 45.2% 82.3%
Politieal and economic awareness I 31.7% 39.3% 71.0%
Comoetence of this ERAU Graduate
Overall ERAU ERAU Student Student
(1) Competen Competen Excellent IC2l Good ce ce Deficit
50.0% 32.6% 82.6% 17.4% 63.0% 19.6% 82.6% 13.2% 60.0% 32.0% 92.0% 8.0% 48.3% 30.4% 78.7% 21.3% 50.0% 34.7% 84.8% 15.2% 51.5% 36.7% 88.3% 11.7% 56.6% 33.9% 90.6% 9.4% 54.4% 36.5% 90.9% 9.1% 51.7% 44.1% 95.8% 4.2% 64.1% 24.3% 88.4% 11.6% 52.6% 40.1% 92.7% 3.6% 38.8% 47.9% 86.7% 2.2% 59.6% 25.5% 65.1% -9.8% 37.5% 42.0% 79.5% 12.6% 60.4% 25.2% 85.7% -21.3% 38.5% 38.1% 76.6% 5.7% 29.4% 35.4% 64.8% 6.2%
I
Top Ten Restrictive Skills with ERAU Top Ten a Student Skills with Competen Competen Restrictive Average Top Five
Skills 1.5
ce Deficit ce Deficit Deficit Rank 2 34.3% 1 4 25.4% 6 9 32.8% 2 1 14.2% 10 3 17.1% 9 5 21.6% 7 7 27.0% 5 8 29.2% 4
10 32.5% 3 6 19.4% 8
4.4% 15.5% Needs a look
-11.0% 10.2% Needs a look
-16.7% -1.4% 2.3%
5 5.5 5.5
6 6 6 6
6.5 7
2 3 4 5 6 7 8 9
10
Master of Aeronautical Science
Usefulness of Skill on the Job
(2) Somewhat
1l Verv Useful I useful
84.7% 13.8% 83.0% 86.3% 82.7% 78.6% 81.6% 81.6% 80.2% 74.2%
'SiS) ____ j__ ~.2%
60.5%
Skin Top Ten Usefulness Skills
98.5% 2 98.5% 3 98.5% 1 98.5% 4 98.5% 8 98.5% 6 98.5% 5 98.5% 7 95.5% 9 98.5% 10 98.5% 95.4% 93.9% 84.6% 88.0% 89.0% 88.3%
Competence ofthisERAU Graduate
22.7% 25.1% 27.4% 36.7% 37.7% 41.4% 41.3% 49.4% 49.7% 56.0% 46.2% 35.6% 28.8% 29.1% 30.9% 45.8% 25.1%
40.5% 38.0% 57.5% 42.8% 45.1% 36.5% 44.5% 41.1% 36.0% 34.6% 34.8% 38.5% 52.3% 45.3% 51.1% 41.6% 48.3%
Overall Restl'ictive ERAU Top Ten ERAU Top Ten
ERAU Student Skills with a Student Skills with Student Competence Competence Competence Restrictive Average Top Five Competence Deficit Deficit Deficit Deficit Rank Skills
63.1% 35.3% 2 62.0% 1 1.5 1 63.1% 35.4% 1 58.0% 3 2 2 84.9% 13.6% 6 58.9% 2 4 3 79.4% 19.0% 4 46.0% 4 4 4 82.9% 15.6% 5 40.9% 5 5 5 77.9% 20.6% 3 40.2% 7 5 6 85.8% 12.7% 7 40.4% 6 6.5 7 90.5% 7.9% 9 30.7% 8 8.5 8 85.7% 9.8% 8 24.5% 9 8.5 9 90.6% 7.8% 10 17.5% 10 10 10 81.0% 17.5% 26.3% 74.1% 21.3% 21.7% 81.0% 12.9% 26.4% 74.3% 10.2% 11.0% 82.0% 6.0% 3.4% 87.3% 1.7% -14.2% 73.4% 14.9% 2.7%