Embed Size (px)
Citation preview
Using Longitudinal Data to Build Natural History Models
Lessons learned from modeling type 2 diabetes and prostate cancer
INFORMS Healthcare Conference, Rotterdam, 2017
Brian DentonDepartment of Industrial and Operations EngineeringUniversity of Michigan
Natural History Models
Natural history models can be used to simulate the
natural course of chronic diseases.
Randomized controlled trial (RCT) data is the gold
standard but:
RCTs are expensive and time consuming and may
not always be possible
Can test a very limited number of treatment
options over short time periods
Observational data is abundant but there are
challenges to unlocking knowledge due to various
sources of bias and confounding
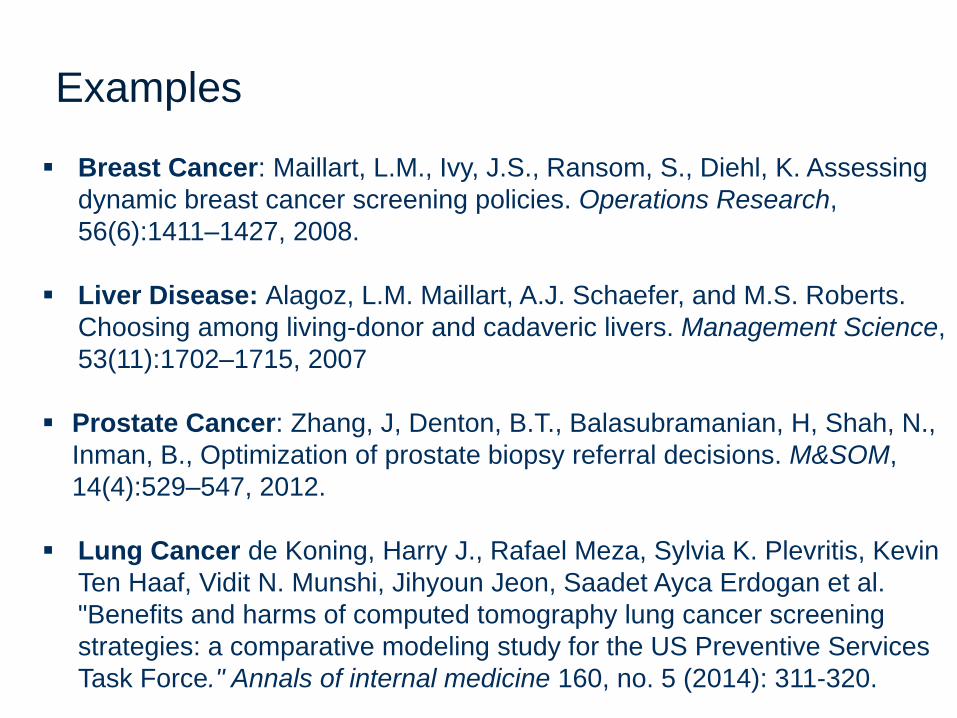
Examples
Breast Cancer: Maillart, L.M., Ivy, J.S., Ransom, S., Diehl, K. Assessing
dynamic breast cancer screening policies. Operations Research,
56(6):1411–1427, 2008.
Liver Disease: Alagoz, L.M. Maillart, A.J. Schaefer, and M.S. Roberts.
Choosing among living-donor and cadaveric livers. Management Science,
53(11):1702–1715, 2007
Prostate Cancer: Zhang, J, Denton, B.T., Balasubramanian, H, Shah, N.,
Inman, B., Optimization of prostate biopsy referral decisions. M&SOM,
14(4):529–547, 2012.
Lung Cancer de Koning, Harry J., Rafael Meza, Sylvia K. Plevritis, Kevin
Ten Haaf, Vidit N. Munshi, Jihyoun Jeon, Saadet Ayca Erdogan et al.
"Benefits and harms of computed tomography lung cancer screening
strategies: a comparative modeling study for the US Preventive Services
Task Force." Annals of internal medicine 160, no. 5 (2014): 311-320.
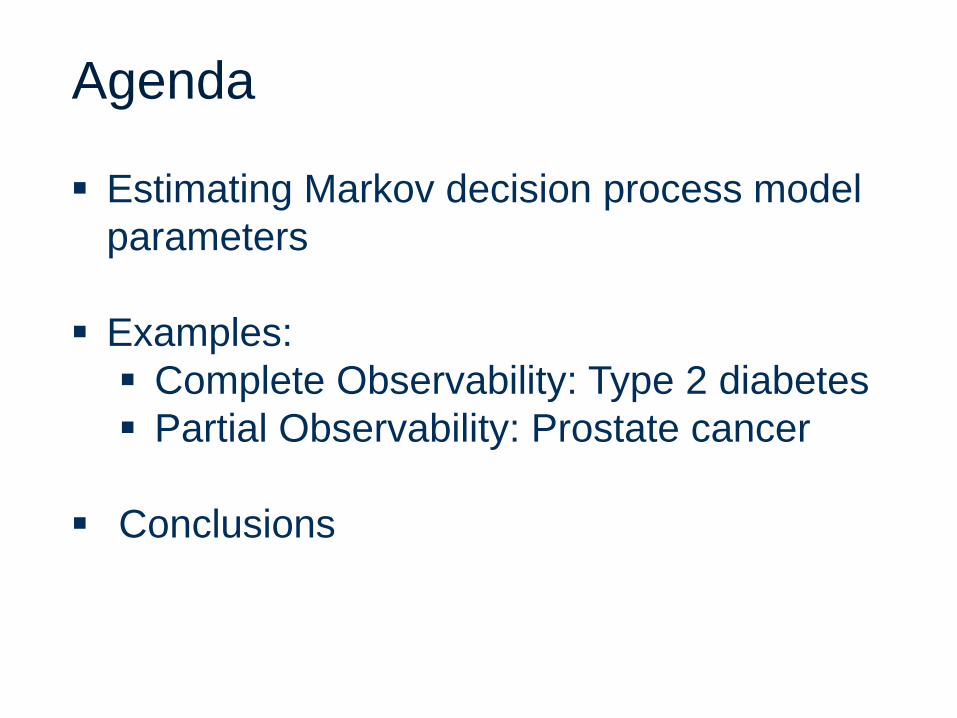
Agenda
Estimating Markov decision process model
parameters
Examples:
Complete Observability: Type 2 diabetes
Partial Observability: Prostate cancer
Conclusions
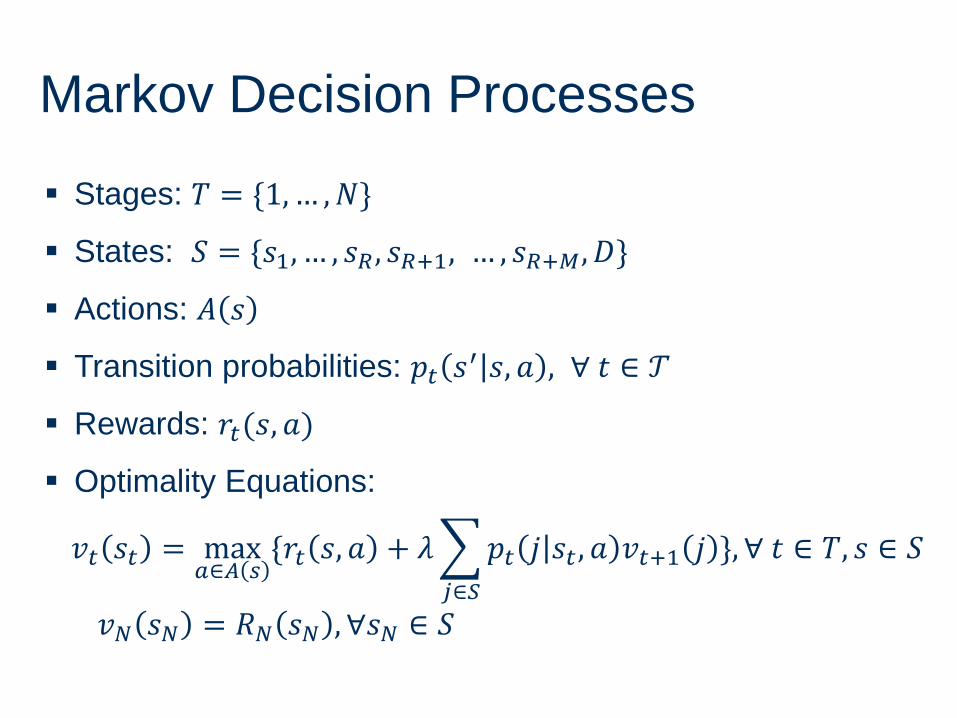
Markov Decision Processes
Stages: 𝑇 = {1,… ,𝑁}
States: 𝑆 = {𝑠1, … , 𝑠𝑅 , 𝑠𝑅+1, … , 𝑠𝑅+𝑀, 𝐷}
Actions: 𝐴 𝑠
Transition probabilities: 𝑝𝑡 𝑠′ 𝑠, 𝑎 , ∀ 𝑡 ∈ 𝒯
Rewards: 𝑟𝑡(𝑠, 𝑎)
Optimality Equations:
𝑣𝑡 𝑠𝑡 = max𝑎∈𝐴 𝑠
{𝑟𝑡 𝑠, 𝑎 + 𝜆
𝑗∈𝑆
𝑝𝑡 𝑗 𝑠𝑡 , 𝑎 𝑣𝑡+1 𝑗 }, ∀ 𝑡 ∈ 𝑇, 𝑠 ∈ 𝑆
𝑣𝑁 𝑠𝑁 = 𝑅𝑁 𝑠𝑁 , ∀𝑠𝑁 ∈ 𝑆
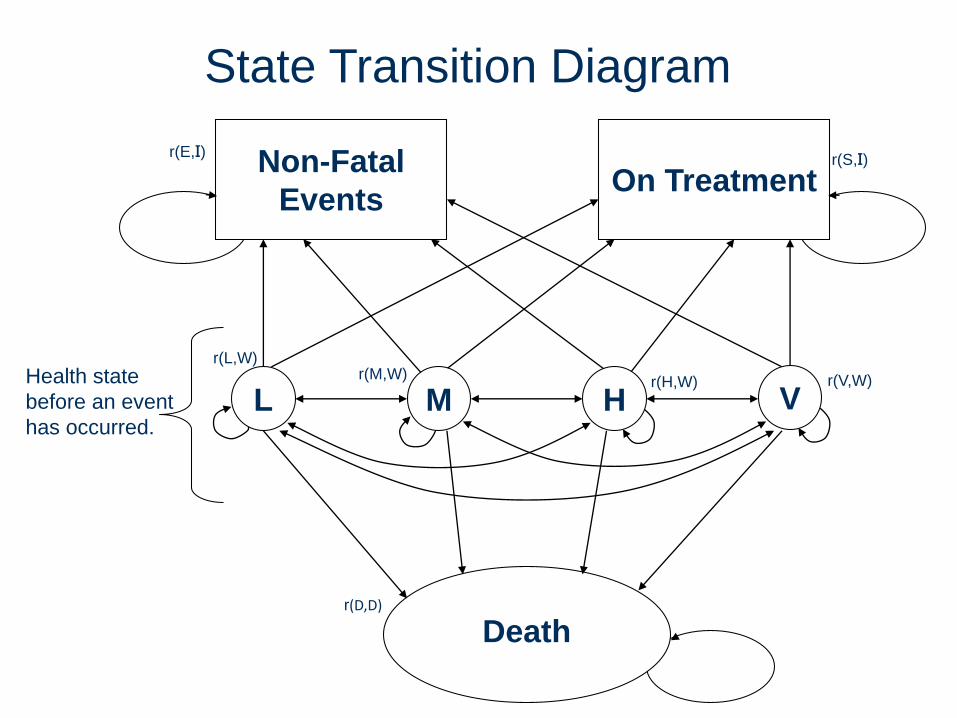
Health state
before an event
has occurred.
State Transition Diagram
L
Non-Fatal
EventsOn Treatment
Death
r(L,W)r(M,W)
r(H,W)
r(S,I)r(E,I)
r(D,D)
r(V,W)
VM H
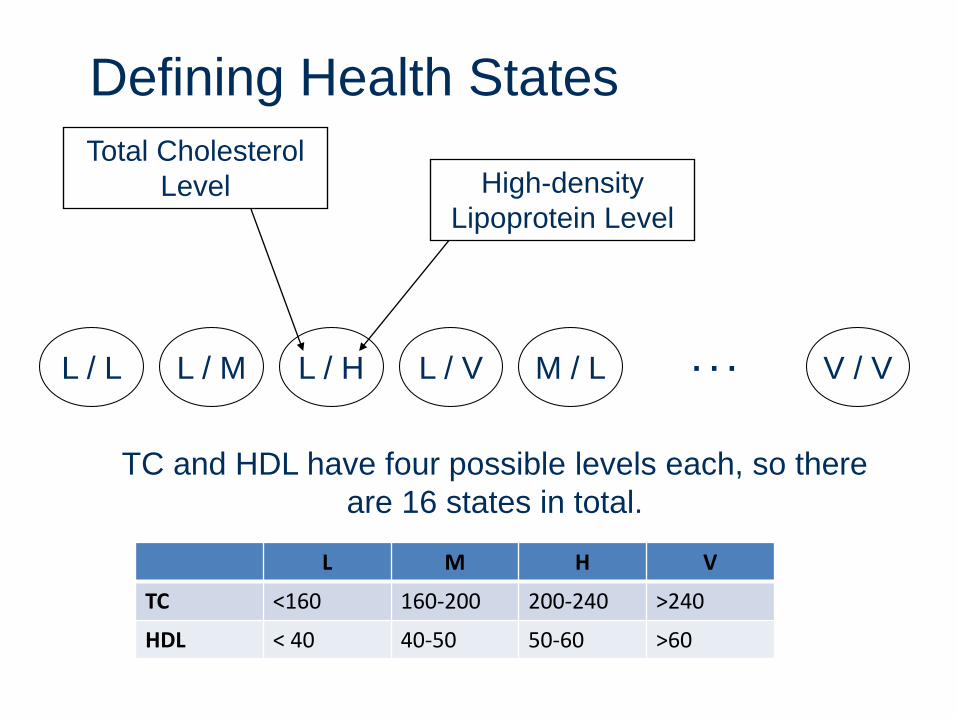
Defining Health States
L / L L / M L / H L / V M / L V / V. . .
Total Cholesterol
Level High-density
Lipoprotein Level
TC and HDL have four possible levels each, so there
are 16 states in total.
L M H V
TC <160 160-200 200-240 >240
HDL < 40 40-50 50-60 >60
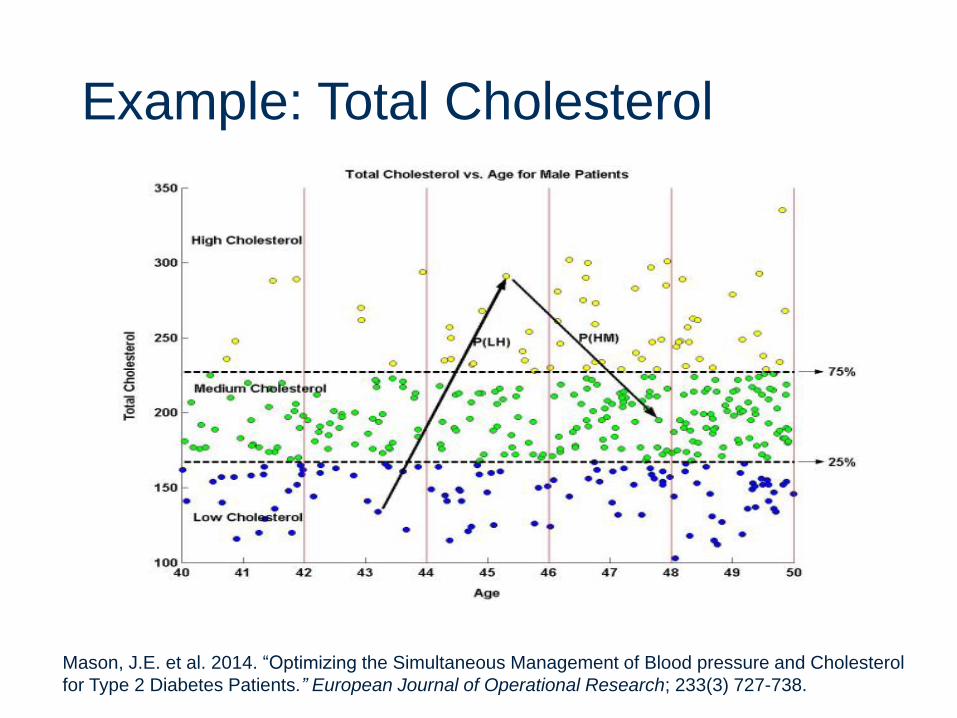
Example: Total Cholesterol
Mason, J.E. et al. 2014. “Optimizing the Simultaneous Management of Blood pressure and Cholesterol
for Type 2 Diabetes Patients.” European Journal of Operational Research; 233(3) 727-738.
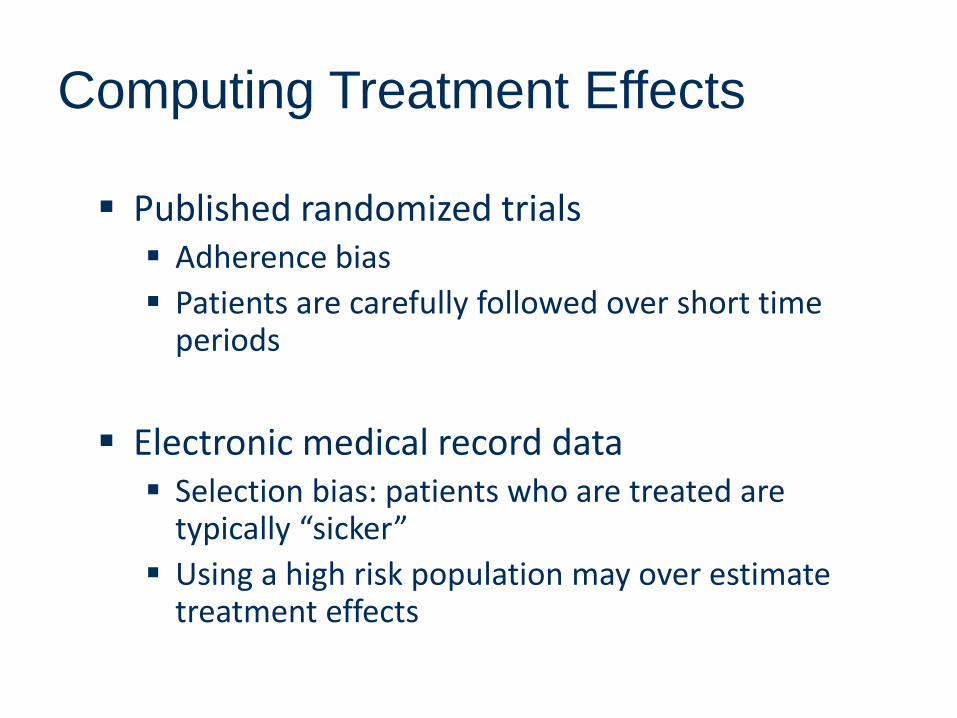
Computing Treatment Effects
Published randomized trials Adherence bias
Patients are carefully followed over short time periods
Electronic medical record data Selection bias: patients who are treated are
typically “sicker”
Using a high risk population may over estimate treatment effects
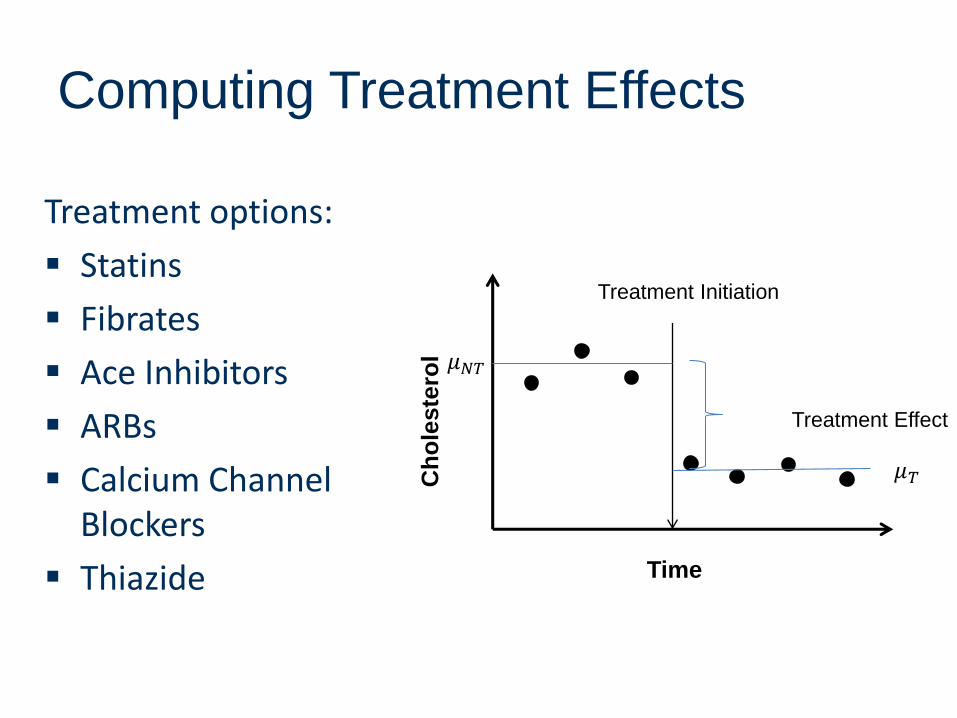
Computing Treatment Effects
Treatment options:
Statins
Fibrates
Ace Inhibitors
ARBs
Calcium Channel Blockers
Thiazide Time
Ch
ole
ste
rol
Treatment Initiation
Treatment Effect
𝜇𝑁𝑇
𝜇𝑇
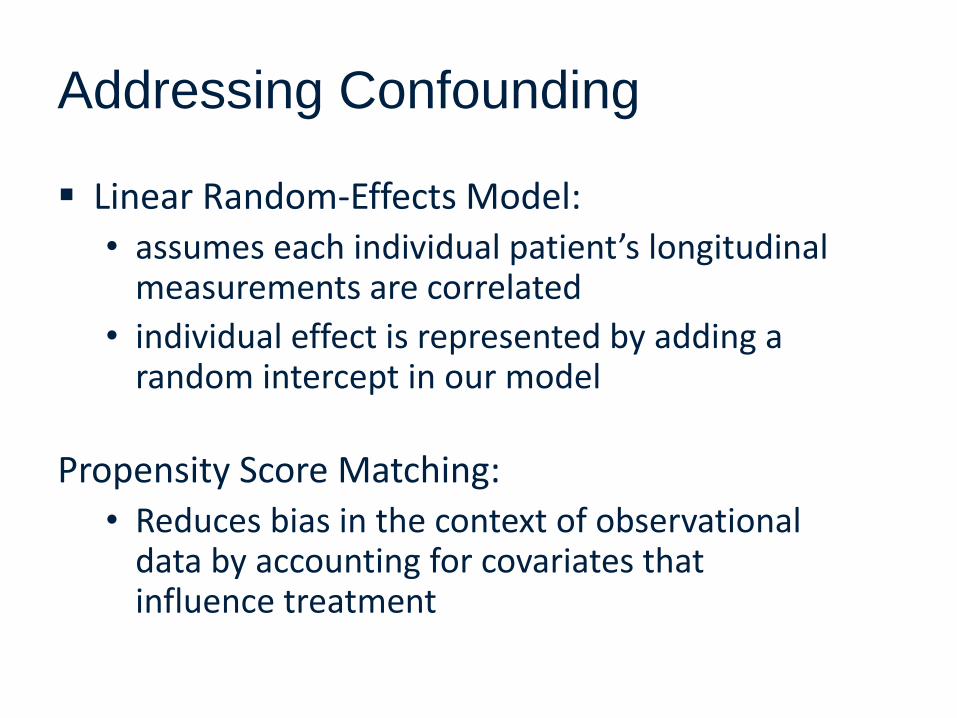
Addressing Confounding
Linear Random-Effects Model: • assumes each individual patient’s longitudinal
measurements are correlated
• individual effect is represented by adding a random intercept in our model
Propensity Score Matching:• Reduces bias in the context of observational
data by accounting for covariates that influence treatment
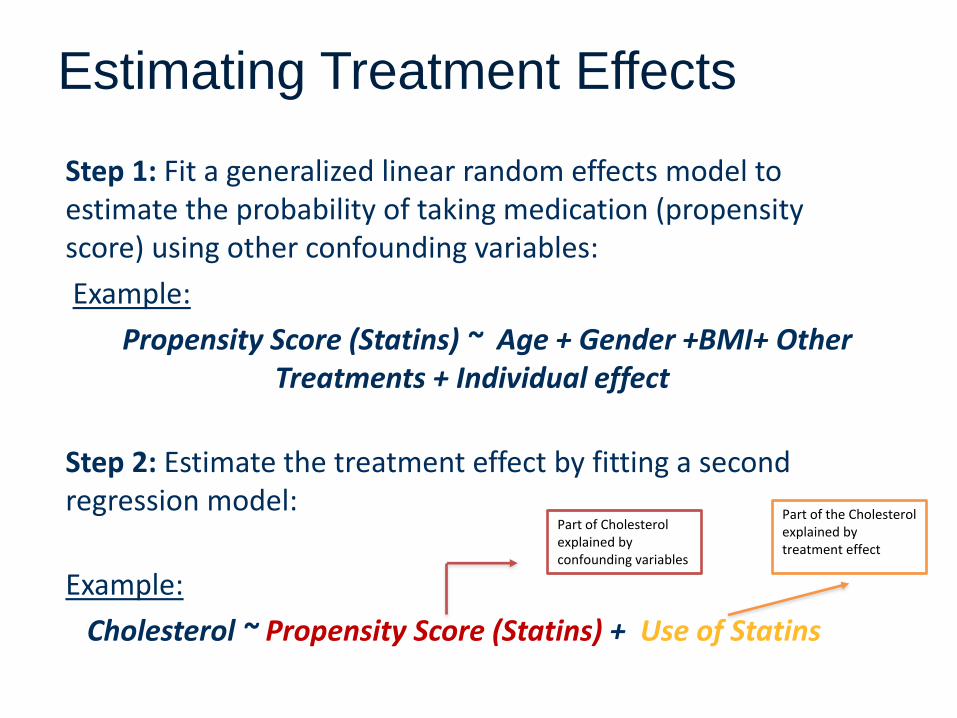
Estimating Treatment Effects
Step 1: Fit a generalized linear random effects model to estimate the probability of taking medication (propensity score) using other confounding variables:
Example:
Propensity Score (Statins) ~ Age + Gender +BMI+ Other Treatments + Individual effect
Step 2: Estimate the treatment effect by fitting a second regression model:
Example:
Cholesterol ~ Propensity Score (Statins) + Use of Statins
Part of Cholesterol explained by confounding variables
Part of the Cholesterol explained by treatment effect
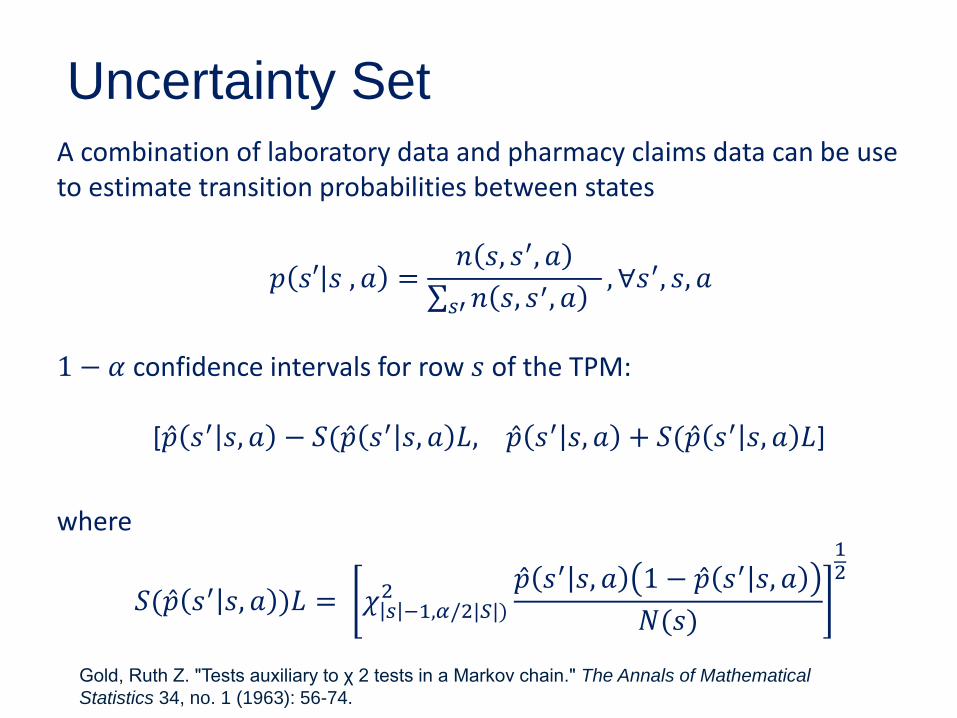
Uncertainty SetA combination of laboratory data and pharmacy claims data can be use to estimate transition probabilities between states
𝑝 𝑠′ 𝑠 , 𝑎 =𝑛 𝑠, 𝑠′, 𝑎
σ𝑠′𝑛 𝑠, 𝑠′, 𝑎, ∀𝑠′, 𝑠, 𝑎
1 − 𝛼 confidence intervals for row 𝑠 of the TPM:
[ Ƹ𝑝 𝑠′ 𝑠, 𝑎 − 𝑆( Ƹ𝑝 𝑠′ 𝑠, 𝑎 𝐿, Ƹ𝑝 𝑠′ 𝑠, 𝑎 + 𝑆( Ƹ𝑝 𝑠′ 𝑠, 𝑎 𝐿]
where
𝑆( Ƹ𝑝 𝑠′ 𝑠, 𝑎 )𝐿 = 𝜒 𝑠 −1,𝛼/2|𝑆|)2 Ƹ𝑝 𝑠′ 𝑠, 𝑎 1 − Ƹ𝑝 𝑠′ 𝑠, 𝑎
𝑁(𝑠)
12
Gold, Ruth Z. "Tests auxiliary to χ 2 tests in a Markov chain." The Annals of Mathematical
Statistics 34, no. 1 (1963): 56-74.
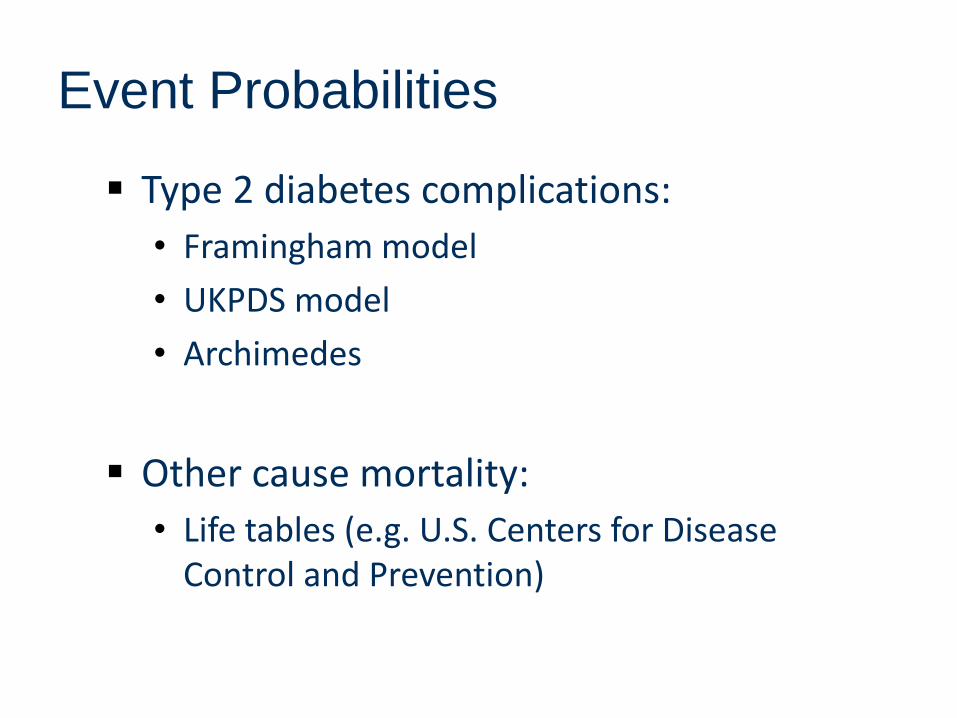
Event Probabilities
Type 2 diabetes complications:
• Framingham model
• UKPDS model
• Archimedes
Other cause mortality:
• Life tables (e.g. U.S. Centers for Disease Control and Prevention)
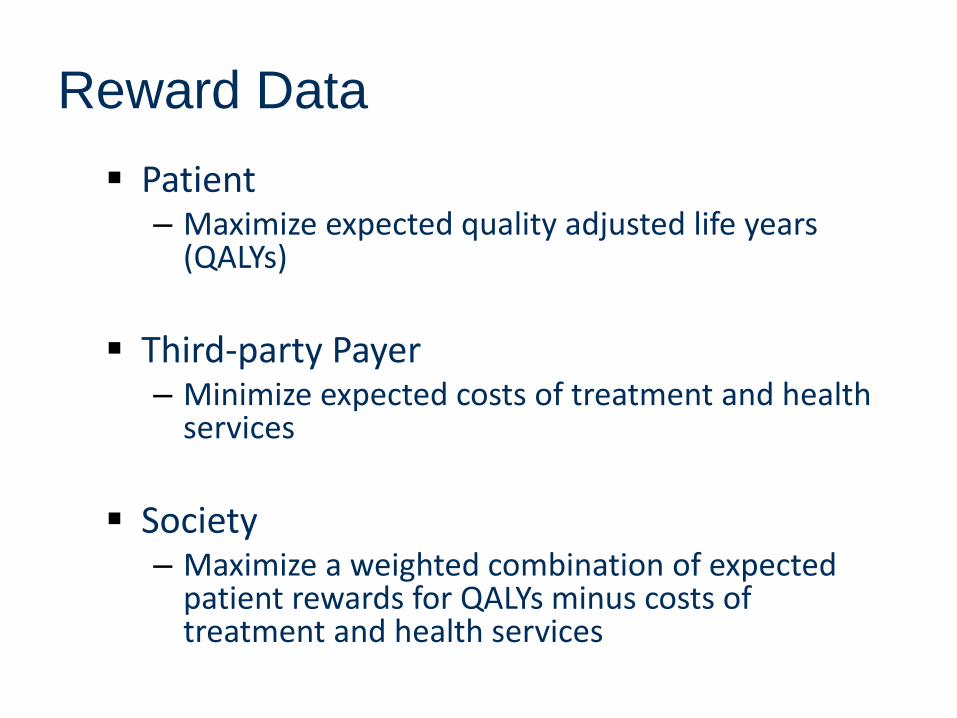
Reward Data
Patient– Maximize expected quality adjusted life years
(QALYs)
Third-party Payer– Minimize expected costs of treatment and health
services
Society– Maximize a weighted combination of expected
patient rewards for QALYs minus costs of treatment and health services
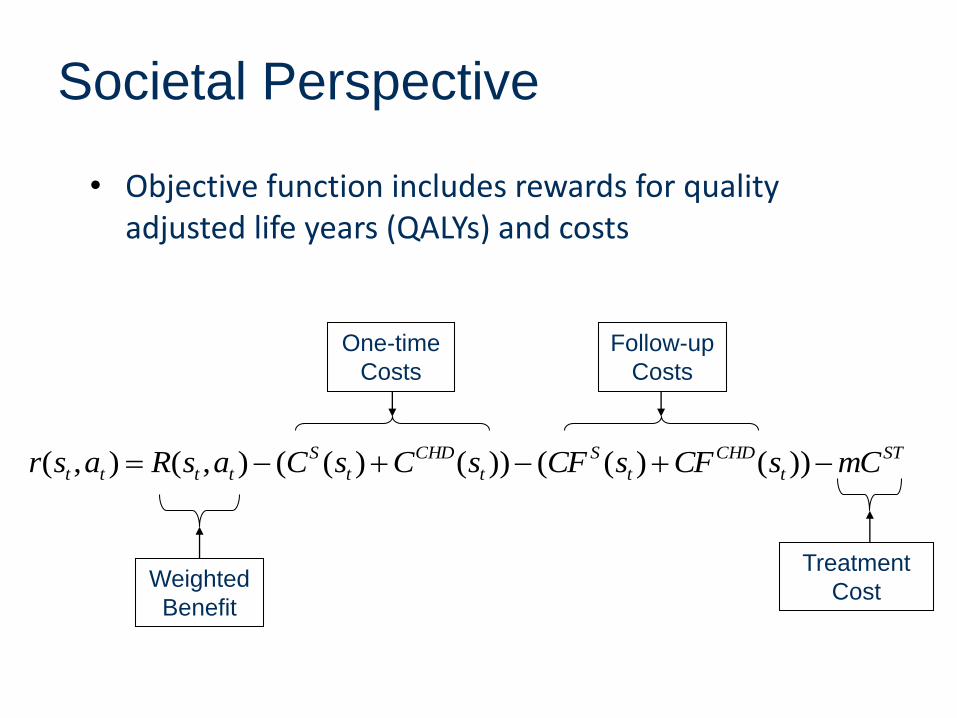
Societal Perspective
• Objective function includes rewards for quality adjusted life years (QALYs) and costs
Weighted
Benefit
Treatment
Cost
One-time
Costs
Follow-up
Costs
ST
t
CHD
t
S
t
CHD
t
S
tttt mCsCFsCFsCsCasRasr ))()(())()((),(),(
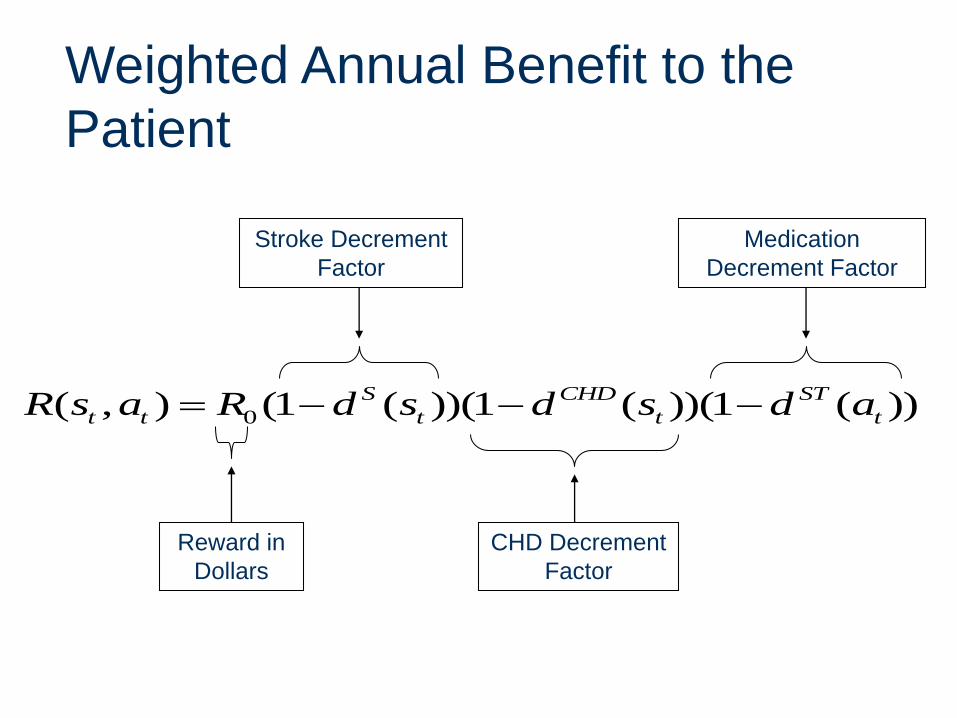
Weighted Annual Benefit to the
Patient
Stroke Decrement
Factor
Medication
Decrement Factor
CHD Decrement
Factor
Reward in
Dollars
0( , ) (1 ( ))(1 ( ))(1 ( ))S CHD ST
t t t t tR s a R d s d s d a
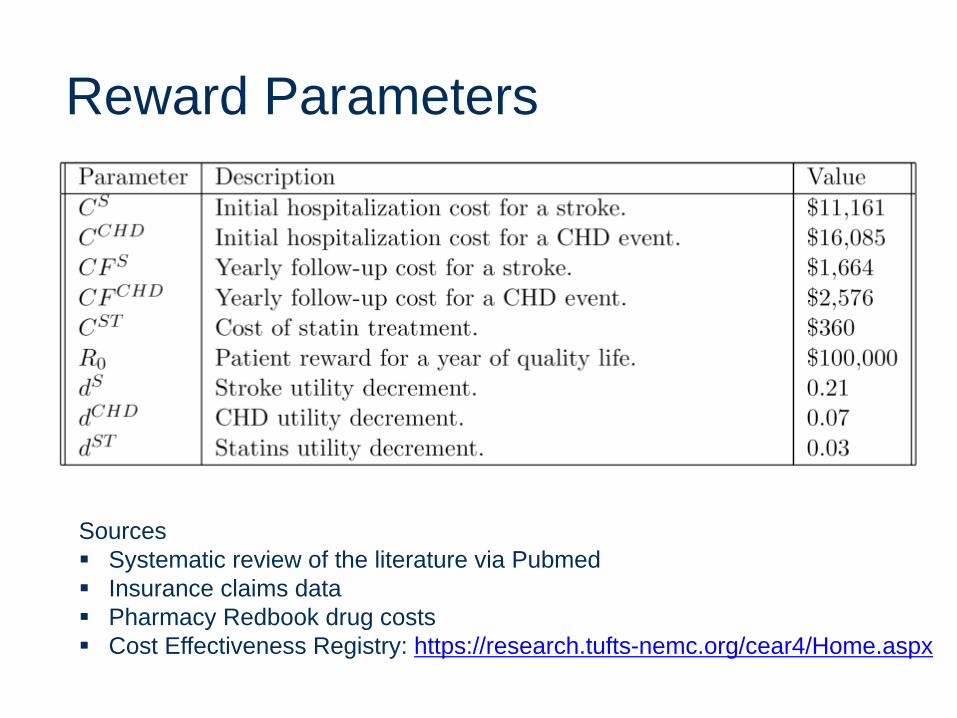
Reward Parameters
Sources
Systematic review of the literature via Pubmed
Insurance claims data
Pharmacy Redbook drug costs
Cost Effectiveness Registry: https://research.tufts-nemc.org/cear4/Home.aspx
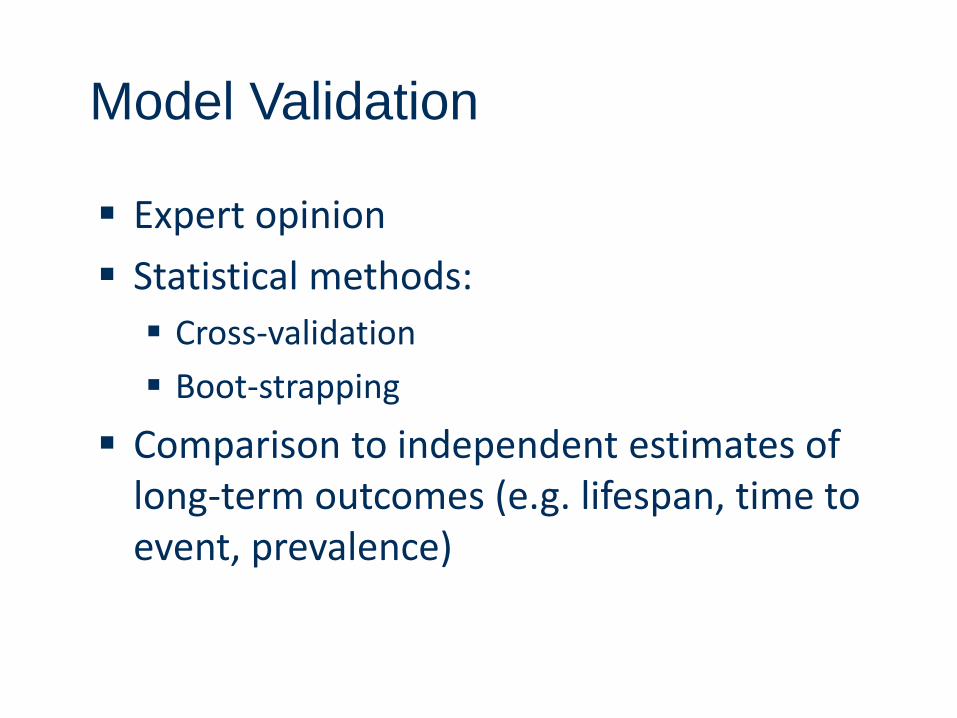
Model Validation
Expert opinion
Statistical methods:
Cross-validation
Boot-strapping
Comparison to independent estimates of long-term outcomes (e.g. lifespan, time to event, prevalence)
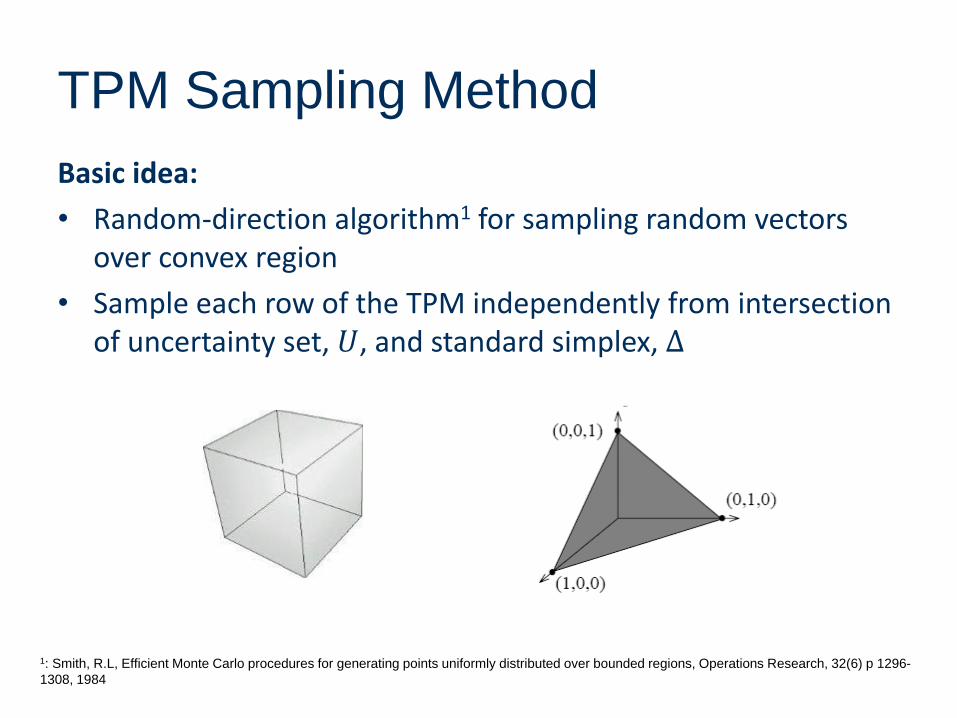
TPM Sampling Method
Basic idea:
• Random-direction algorithm1 for sampling random vectors over convex region
• Sample each row of the TPM independently from intersection of uncertainty set, 𝑈, and standard simplex, Δ
1: Smith, R.L, Efficient Monte Carlo procedures for generating points uniformly distributed over bounded regions, Operations Research, 32(6) p 1296-
1308, 1984
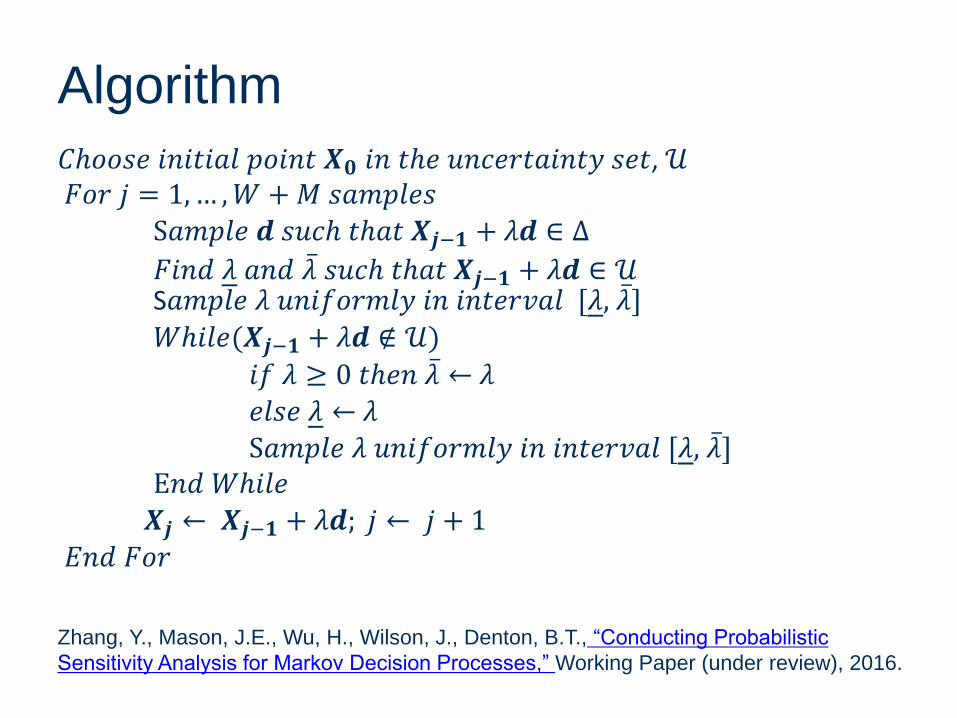
Algorithm
𝐶ℎ𝑜𝑜𝑠𝑒 𝑖𝑛𝑖𝑡𝑖𝑎𝑙 𝑝𝑜𝑖𝑛𝑡 𝑿𝟎 𝑖𝑛 𝑡ℎ𝑒 𝑢𝑛𝑐𝑒𝑟𝑡𝑎𝑖𝑛𝑡𝑦 𝑠𝑒𝑡, 𝒰𝐹𝑜𝑟 𝑗 = 1,… ,𝑊 +𝑀 𝑠𝑎𝑚𝑝𝑙𝑒𝑠
S𝑎𝑚𝑝𝑙𝑒 𝒅 𝑠𝑢𝑐ℎ 𝑡ℎ𝑎𝑡 𝑿𝒋−𝟏 + 𝜆𝒅 ∈ Δ
𝐹𝑖𝑛𝑑 𝜆 𝑎𝑛𝑑 ҧ𝜆 𝑠𝑢𝑐ℎ 𝑡ℎ𝑎𝑡 𝑿𝒋−𝟏 + 𝜆𝒅 ∈ 𝒰S𝑎𝑚𝑝𝑙𝑒 𝜆 𝑢𝑛𝑖𝑓𝑜𝑟𝑚𝑙𝑦 𝑖𝑛 𝑖𝑛𝑡𝑒𝑟𝑣𝑎𝑙 [𝜆, ҧ𝜆]
𝑊ℎ𝑖𝑙𝑒(𝑿𝒋−𝟏 + 𝜆𝒅 ∉ 𝒰)
𝑖𝑓 𝜆 ≥ 0 𝑡ℎ𝑒𝑛 ҧ𝜆 ← 𝜆
𝑒𝑙𝑠𝑒 𝜆 ← 𝜆
S𝑎𝑚𝑝𝑙𝑒 𝜆 𝑢𝑛𝑖𝑓𝑜𝑟𝑚𝑙𝑦 𝑖𝑛 𝑖𝑛𝑡𝑒𝑟𝑣𝑎𝑙 [𝜆, ҧ𝜆]E𝑛𝑑 𝑊ℎ𝑖𝑙𝑒
𝑿𝒋 ← 𝑿𝒋−𝟏 + 𝜆𝒅; 𝑗 ← 𝑗 + 1
𝐸𝑛𝑑 𝐹𝑜𝑟
Zhang, Y., Mason, J.E., Wu, H., Wilson, J., Denton, B.T., “Conducting Probabilistic
Sensitivity Analysis for Markov Decision Processes,” Working Paper (under review), 2016.
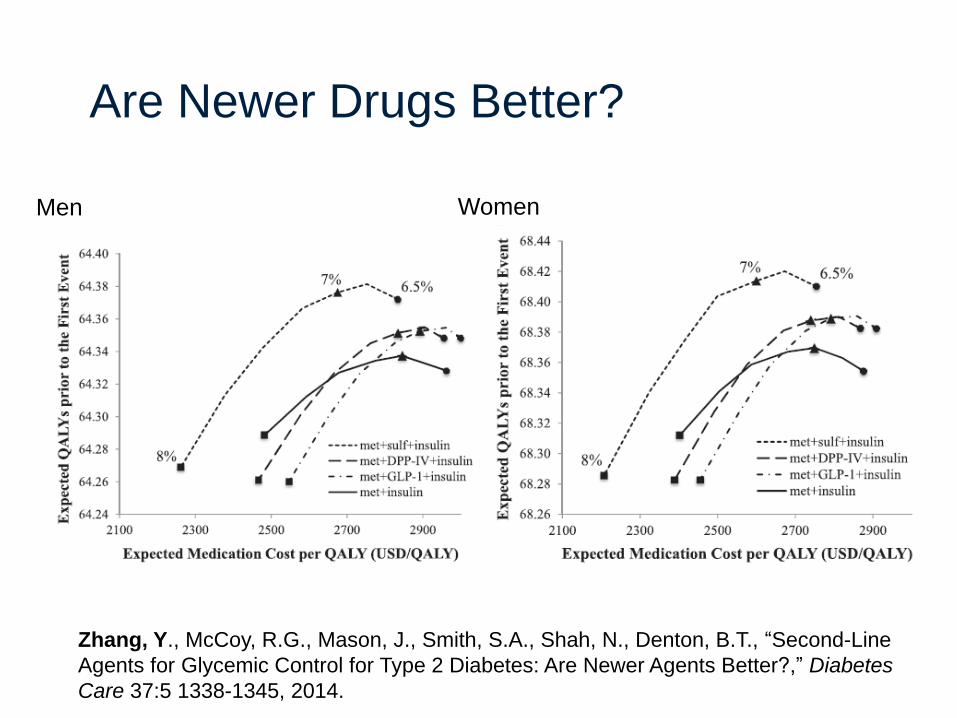
Are Newer Drugs Better?
Men Women
Zhang, Y., McCoy, R.G., Mason, J., Smith, S.A., Shah, N., Denton, B.T., “Second-Line
Agents for Glycemic Control for Type 2 Diabetes: Are Newer Agents Better?,” Diabetes
Care 37:5 1338-1345, 2014.
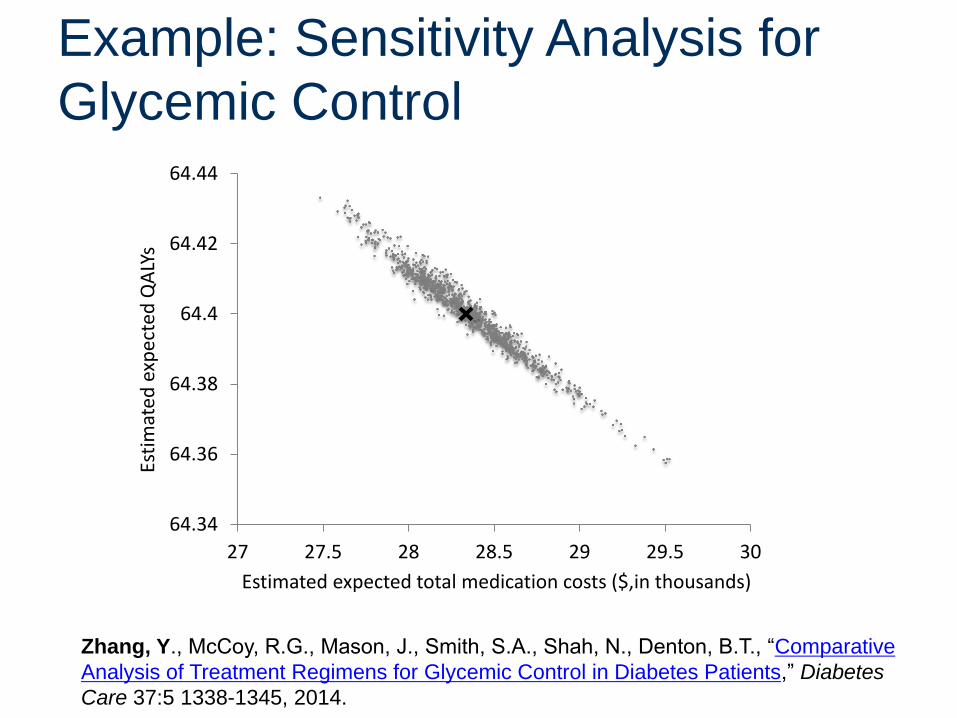
Example: Sensitivity Analysis for
Glycemic Control
64.34
64.36
64.38
64.4
64.42
64.44
27 27.5 28 28.5 29 29.5 30
Esti
mat
edex
pec
ted
QA
LYs
Estimated expected total medication costs ($,in thousands)
Zhang, Y., McCoy, R.G., Mason, J., Smith, S.A., Shah, N., Denton, B.T., “Comparative
Analysis of Treatment Regimens for Glycemic Control in Diabetes Patients,” Diabetes
Care 37:5 1338-1345, 2014.
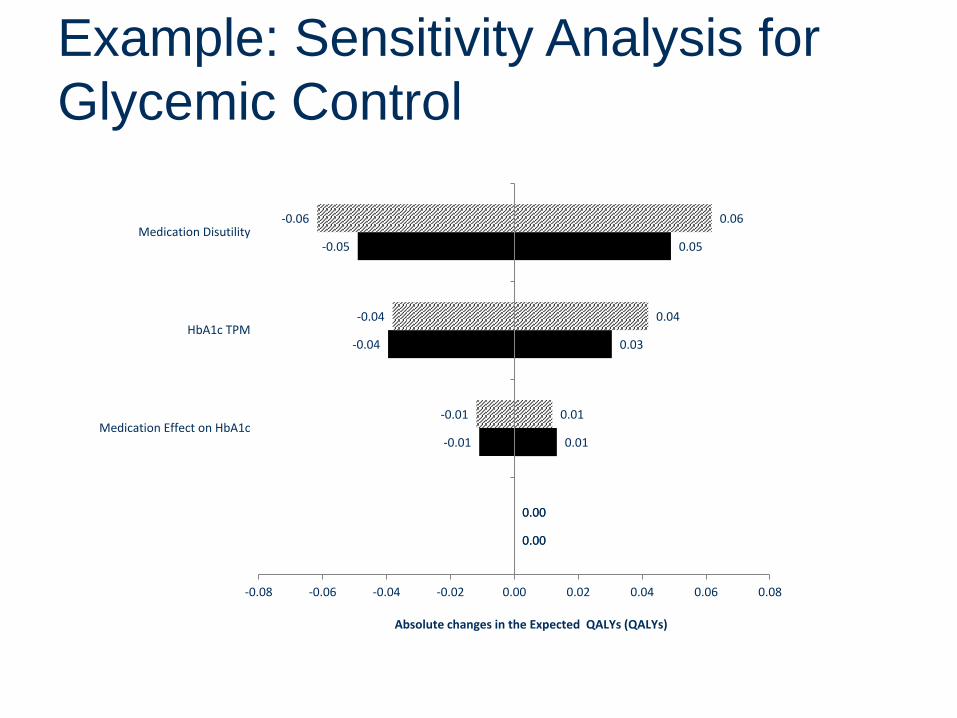
0.00
0.01
0.03
0.05
0.00
0.01
0.04
0.06
0.00
-0.01
-0.04
-0.05
0.00
-0.01
-0.04
-0.06
-0.08 -0.06 -0.04 -0.02 0.00 0.02 0.04 0.06 0.08
Monthly Medication Cost
Medication Effect on HbA1c
HbA1c TPM
Medication Disutility
Absolute changes in the Expected QALYs (QALYs)
Example: Sensitivity Analysis for
Glycemic Control
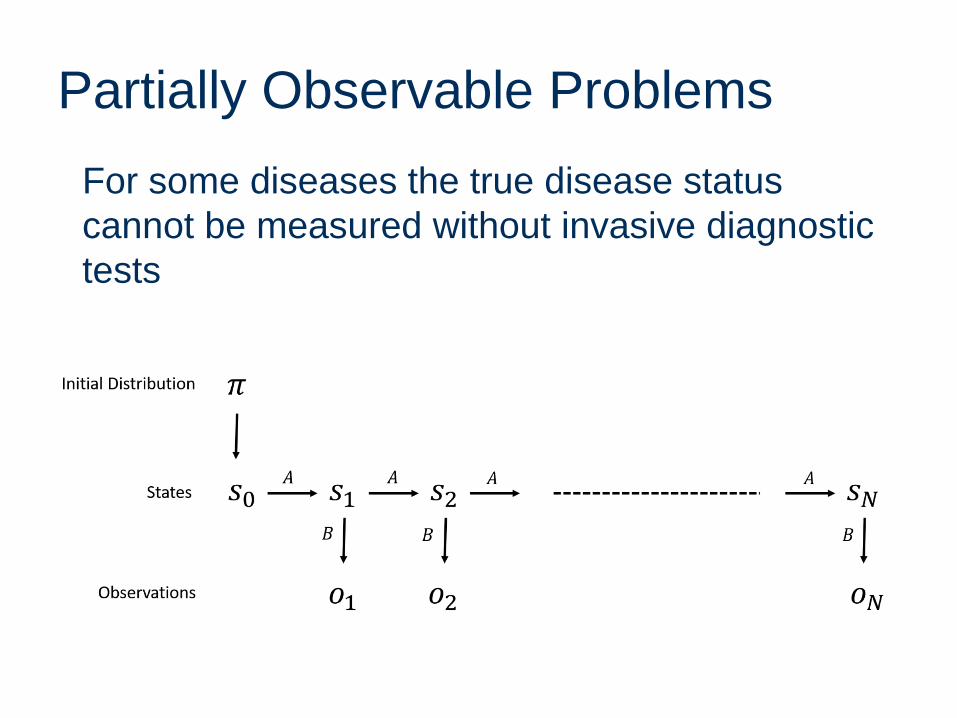
Partially Observable Problems
For some diseases the true disease status
cannot be measured without invasive diagnostic
tests
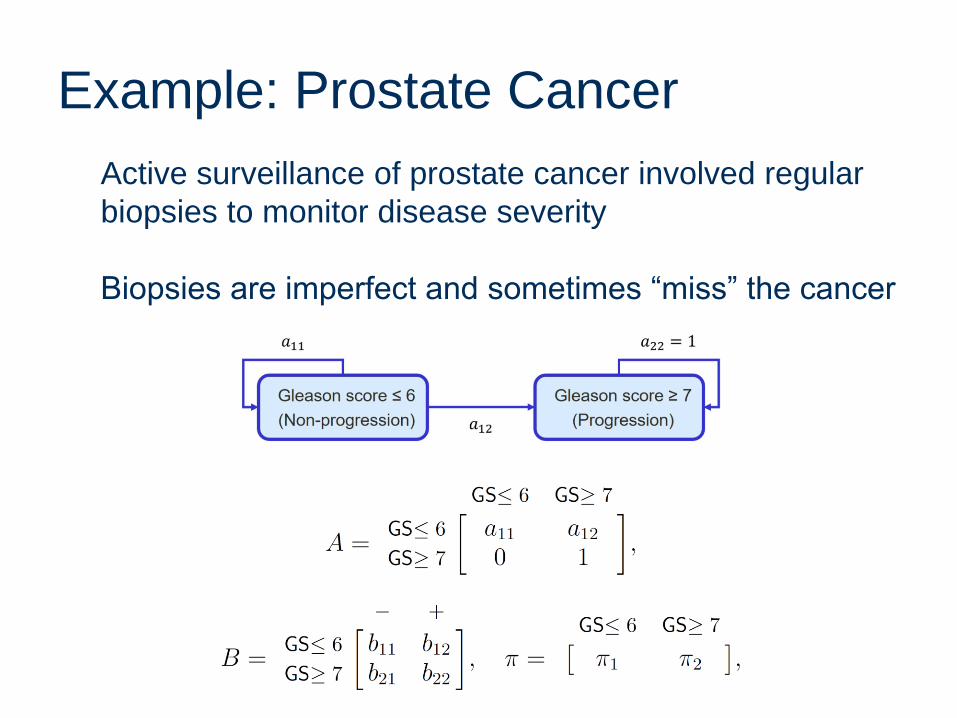
Example: Prostate Cancer
Active surveillance of prostate cancer involved regular
biopsies to monitor disease severity
Biopsies are imperfect and sometimes “miss” the cancer
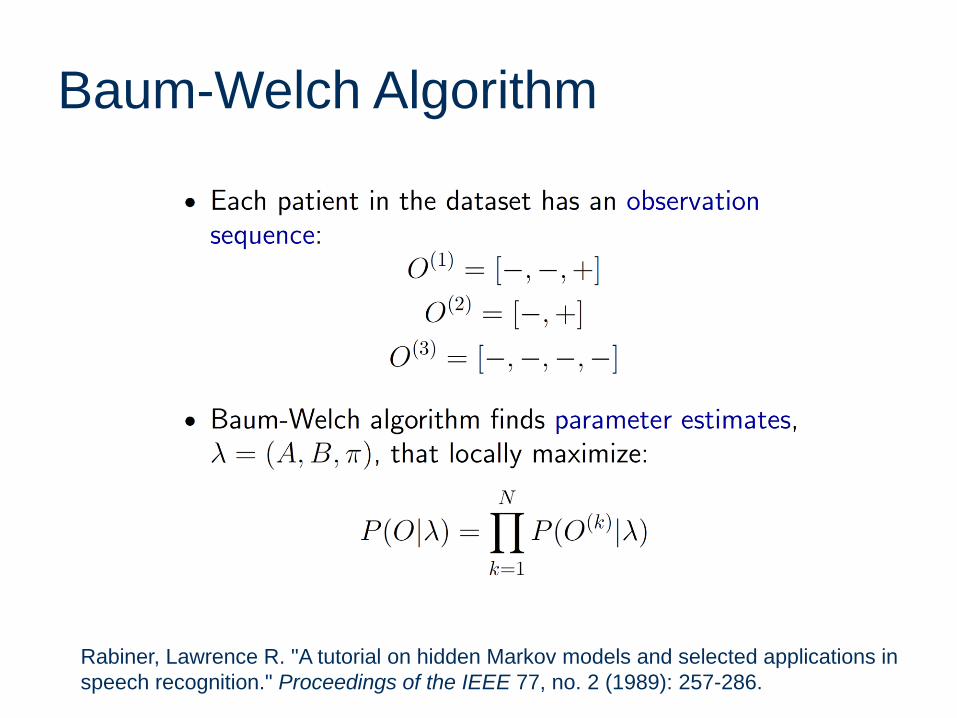
Baum-Welch Algorithm
Rabiner, Lawrence R. "A tutorial on hidden Markov models and selected applications in
speech recognition." Proceedings of the IEEE 77, no. 2 (1989): 257-286.
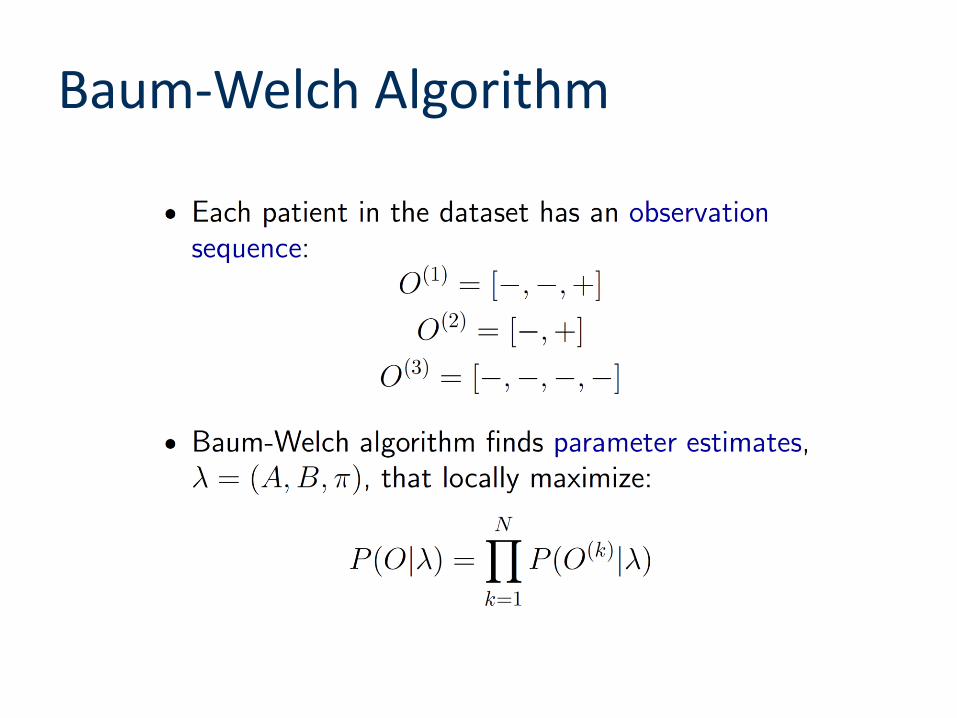
Baum-Welch Algorithm
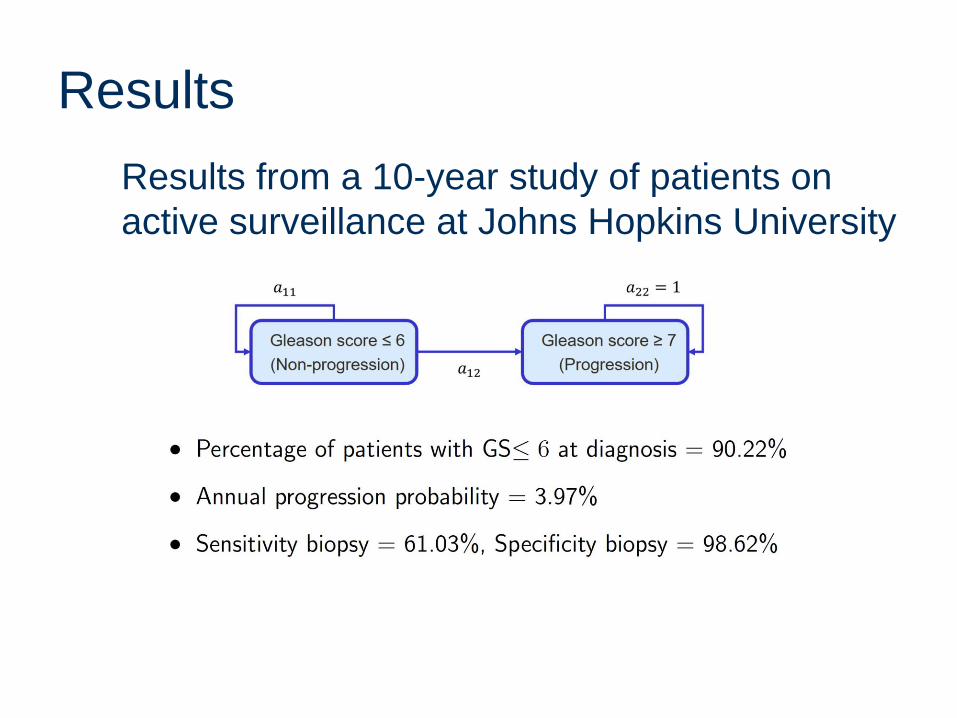
Results
Results from a 10-year study of patients on
active surveillance at Johns Hopkins University
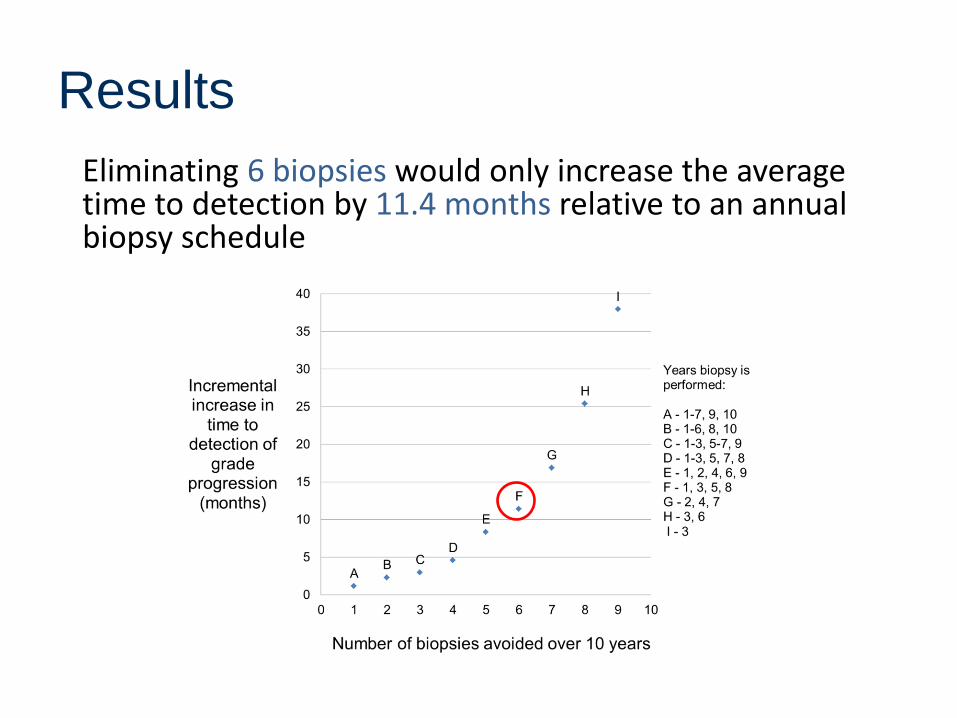
Eliminating 6 biopsies would only increase the average time to detection by 11.4 months relative to an annual biopsy schedule
Results
Takeaway Messages
Markov decision processes (MDPs) are
increasingly used to study medical decisions
Natural history models are the fundamental
foundation for MDPs
Little is know about the best ways to
estimate MDP model parameters and
mitigate bias from observational data

Acknowledgements
Christine Barnett, Research Triangle Institute
Jennifer Mason, University of Virginia
Lauren Steimle, University of Michigan
Jim Wilson, NC State University
Yuanhui Zhang, CDC
Nilay Shah, Mayo Clinic
Steven Smith, Mayo Clinic
This work was supported by the National Science Foundation CMMI
1462060. Any opinions, findings, and conclusions or recommendations
expressed in this material are those of the authors and do not
necessarily reflect the views of the National Science Foundation.

Brian Denton
Industrial and Operations Engineering
University of Michigan
Thank You
Slides posted on my website:
http://umich.edu/~btdenton/presentations/
33
Thanks!
Recent Related WorkZhang, J., Denton, B.T., Balasubramanian, H., Inman, B., Shah, N., “Optimization of
Prostate Biopsy Referral Decisions,” Manufacturing & Service Operations Management
, 14(4), 529-547, 2012.
Mason, J., Denton, B.T., Shah, N., Smith, S., “Optimizing the Simultaneous
Management of Cholesterol and Blood Pressure Treatment Guidelines for Patients with
Type 2 Diabetes,” European Journal of Operational Research, 233, 727-738, 2013.
Zhang, Y., McCoy, R.G., Mason, J., Smith, S.A., Shah, N., Denton, B.T., “Second-line
agents for glycemic control for type 2 diabetes: are newer agents better?,” Diabetes
Care, 37:5 1338-1345, 2014.
Zhang, Y., , Wu, H., Denton, B.T., Wilson, J.R., Lobo, J.M., “Conducting Probabilistic
Sensitivity Analysis for Markov Decision Processes,” Working paper
Zhang, Y., Denton, B.T., “Robust Markov Decision Processes for Medical Treatment
Decisions,” Working Paper, 2015 (available at Optimization Online:
http://www.optimization-online.org/DB_HTML/2015/10/5134.html)
Steimle, L., Denton, B.T., “Screening and Treatment of Chronic Diseases,” Markov
Decision Processes in Practice, Eds: Richard Boucherie and Nico M. van Dijk, Springer,
New York, 2017