Embed Size (px)
Citation preview
Page 1 of 25 Using Loom with the Hortonworks Sandbox
Using Loom with the Hortonworks Sandbox V1.2 November 11, 2013
Introduction Summary
Data science often calls for the application of a variety of tools: the Hadoop Distributed File System (HDFS) provides a place to store and process data that does not fit in memory; Hive provides a SQL-like interface for processing data in Hadoop; and R gives powerful options for munging, modeling, and visualizing “small” data. Loom provides an integrated workflow from one tool to another, capturing and storing metadata in its extensible registry. In this tutorial, learn how to install and get started with Loom, register and transform data in HDFS through the Loom Workbench, and import transformed data into R for analysis. The tutorial is based on an analysis of the relationship between flight delays and weather. By the end of the tutorial, we will see what airports saw the most rain during the sample period. Although this tutorial shows how to use the Loom Workbench, the same steps can also be accomplished through the Loom API. For more information, see the complete Loom documentation on the Revelytix website. If you have any questions or comments, please contact us at [email protected].
Prerequisites:
• Hortonworks Sandbox V1.3 (4GB RAM recommended) • Loom 1.2.7 or higher • RLoom 0.7.8 or higher [optional] • R [optional] • RStudio [optional]
Overview
1. Install Loom 2. Acquire Data and Login 3. Create Sources 4. Create Datasets 5. Create and Execute Transforms 6. Connect to Loom from R [optional]

Page 2 of 25 Using Loom with the Hortonworks Sandbox
Step 1 - Install Loom Installing Loom on the Hortonworks Sandbox is simple, but it does require using the command line interface of the Sandbox virtual machine (VM). The steps are similar to Sandbox Tutorial #12.
1. Log in to the command line of the Sandbox VM. Press CTRL + ALT and enter the following name and password. Alternatively, you can use ssh to connect on the command line.
login: root password: hadoop
2. Download and unzip the Loom distribution from Revelytix. Go to
http://www.revelytix.com/?q=content/download-loom-trial and register for the download. After submitting the form, you will receive an email with the Loom download URL. Download the zip file with 'wget'.
wget <download-‐URL>; unzip loom-‐1.2.7-‐distribution.zip
3. Change the working directory to the distribution directory.
cd loom-‐1.2.7
4. Set environment variables for Hadoop and Hive.
export HADOOP_HOME=/usr/lib/hadoop; export HIVE_HOME=/usr/lib/hive
5. Add the user ‘root’ to the group ‘hdfs’.
usermod -‐aG hdfs root
6. Execute the Loom start-up script from the distribution directory as shown below. Do not
change your working directory to the 'loom-1.2.7/bin' subdirectory or another subdirectory. By default, Loom starts on port 8080 of the VM. If you cannot run Loom on 8080 due to conflicts with another service, you can start Loom on a different port, such as 9090. To use another port, you may need to add a new port forwarding rule to the VM network settings.
bin/loom-‐server.sh # Loom starts on port 8080 bin/loom-‐server.sh <port> # Loom starts on <port>

Page 3 of 25 Using Loom with the Hortonworks Sandbox
Once you start the Loom server, leave the process running on the command line. The output will look like this:
[root@sandbox loom-‐1.2.4]# bin/loom-‐server.sh Starting Database... /usr/lib/hadoop/conf HADOOP_CP=/usr/lib/hadoop/conf::/usr/lib/hadoop/*:/usr/lib/hadoop/lib/* /usr/lib/hadoop/conf HIVE_CP=bin/../plugins/hive:/usr/lib/hive/lib/*:/usr/lib/hive/conf:/usr/lib/hadoop/conf:/usr/lib/hcatalog/share/hcatalog/hcatalog-‐core.jar Starting Loom Server... SLF4J: Class path contains multiple SLF4J bindings. SLF4J: Found binding in [jar:file:/root/loom-‐install/loom-‐1.2.4/lib/ext/slf4j-‐log4j12-‐1.6.6.jar!/org/slf4j/impl/StaticLoggerBinder.class] SLF4J: Found binding in [jar:file:/usr/lib/hadoop/lib/slf4j-‐log4j12-‐1.4.3.jar!/org/slf4j/impl/StaticLoggerBinder.class] SLF4J: See http://www.slf4j.org/codes.html#multiple_bindings for an explanation. SLF4J: Actual binding is of type [org.slf4j.impl.Log4jLoggerFactory] Starting Loom Server on port 8080 Loom Server started
If you prefer to maintain access to the command line, you can use a utility such as screen or nohup to start the server in the background. These utilities must be downloaded separately. While the Loom server starts up, download sample data for the tutorial.
Step 2 - Acquire Data and Log In Sample U.S. government data on flight delays and weather, along with a table matching airports and weather stations, are available from the Revelytix Amazon S3 bucket. The airline on-time performance data comes from the Bureau of Transportation Statistics, while the weather data comes from the National Climatic Data Center’s Global Historical Climatology Network.
1. Download the tutorial data to your computer’s local drive by clicking on this link: https://s3.amazonaws.com/Revelytix-Public/sandbox_tutorial_data.zip.
2. Navigate to the file browser of the Sandbox in your web browser.

Page 4 of 25 Using Loom with the Hortonworks Sandbox
3. Click Upload > Zip file > Upload a zip file.
4. Select the zip file you downloaded to your computer. Click Open. The file will be
uploaded to the VM, unzipped, and put in HDFS as a directory.
5. Open the Loom Workbench in your web browser. By default, the Workbench runs on port 8080 of the VM. Note that you will not be able to access the Workbench until the statement “Loom Server started” appears on the command line.

Page 5 of 25 Using Loom with the Hortonworks Sandbox
6. Click Register.
7. Enter a Username and Password.
8. Click Register. This takes you to the Loom Home Page.
Page 6 of 25 Using Loom with the Hortonworks Sandbox
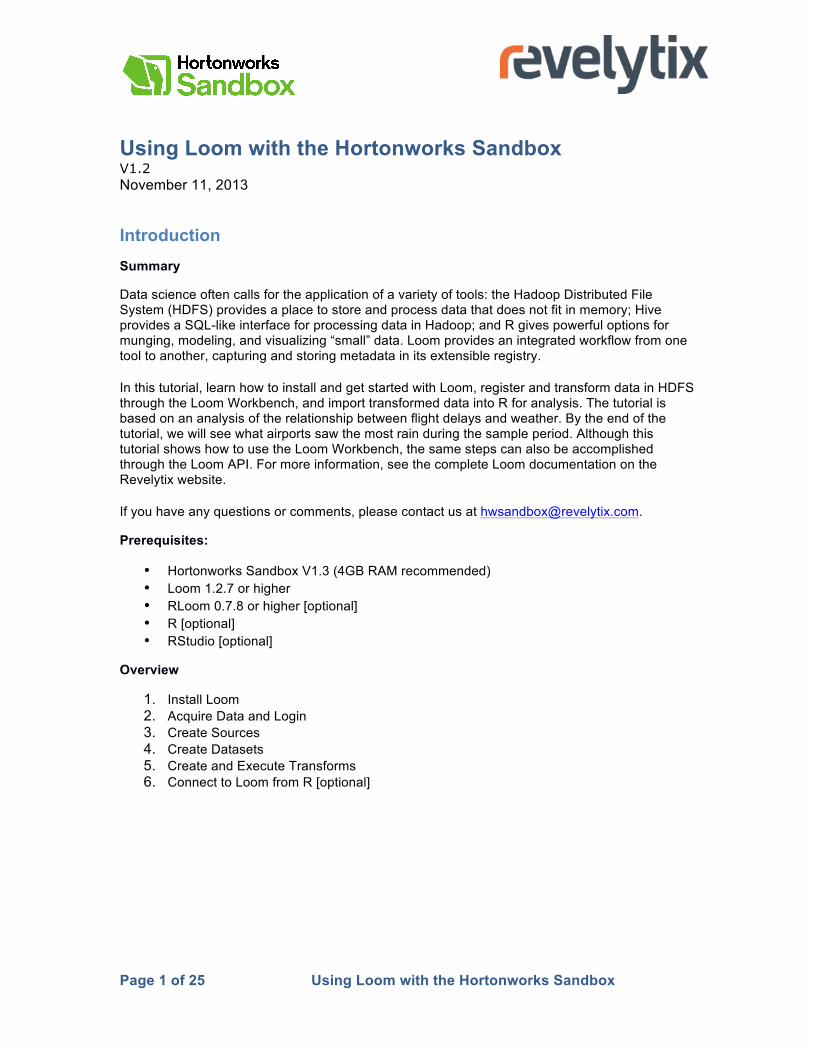
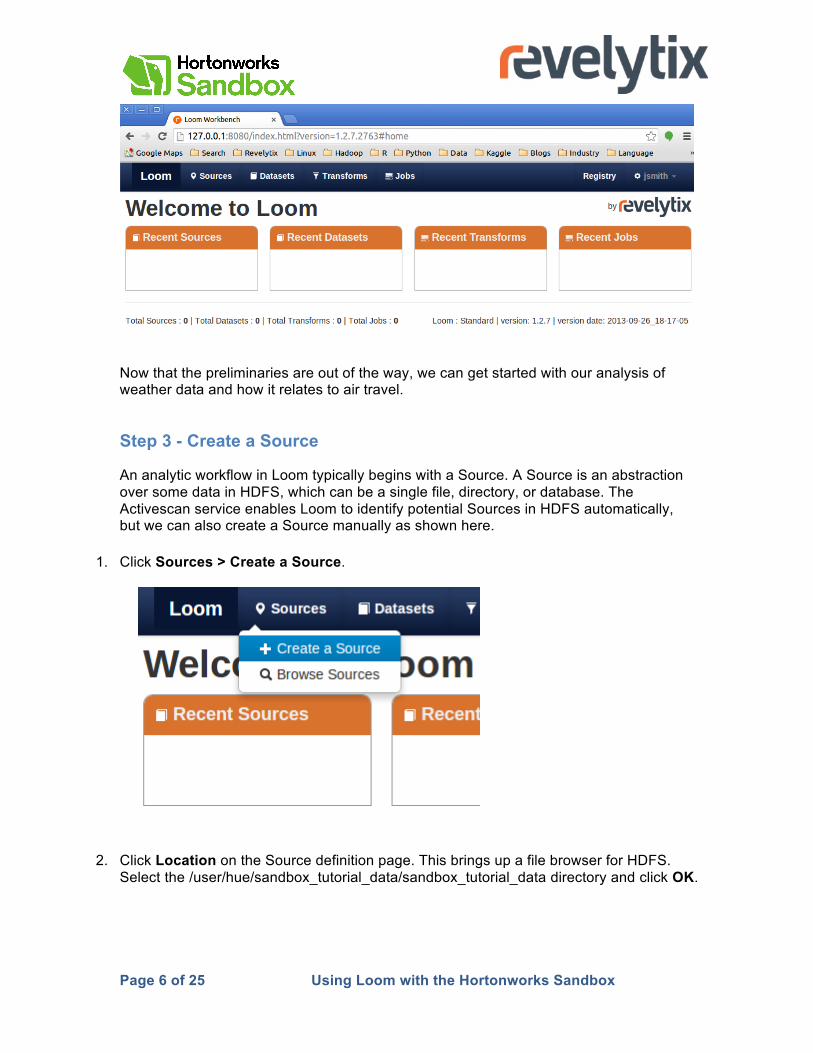
Now that the preliminaries are out of the way, we can get started with our analysis of weather data and how it relates to air travel.
Step 3 - Create a Source An analytic workflow in Loom typically begins with a Source. A Source is an abstraction over some data in HDFS, which can be a single file, directory, or database. The Activescan service enables Loom to identify potential Sources in HDFS automatically, but we can also create a Source manually as shown here.
1. Click Sources > Create a Source.
2. Click Location on the Source definition page. This brings up a file browser for HDFS. Select the /user/hue/sandbox_tutorial_data/sandbox_tutorial_data directory and click OK.

Page 7 of 25 Using Loom with the Hortonworks Sandbox
3. Click Provenance Details.

Page 8 of 25 Using Loom with the Hortonworks Sandbox
4. Enter a new Name for the Source, such as ‘loom_tutorial’. Create a Folder called “tutorials” in the Loom registry for the Source. Add keywords “Revelytix, data science” in Tags and “Loom tutorial” in Description. Click Provenance Details again to hide these fields.
5. Click the magnifying glass to inspect each of the tables in the Source.
6. Inspect the Parsed data and Raw data.

Page 9 of 25 Using Loom with the Hortonworks Sandbox

Page 10 of 25 Using Loom with the Hortonworks Sandbox
7. Click Format and select different settings from the defaults as needed. In particular, note that the table based on ‘GHCN_2013_06.csv’ does not have a header. For this table, uncheck Has a header row? to keep the first row of data from being used for column names. When you are finished formatting a table, click Done.

Page 11 of 25 Using Loom with the Hortonworks Sandbox
8. Click Save to create the Source.
In creating the Source, you identified some data in HDFS and registered it in Loom with a particular format. Now it is time to enrich the Source with more metadata and create a Dataset.
Step 4 - Create Datasets The next step in the workflow is to create a Dataset from the Source. A Dataset is a Loom-managed, actionable collection of tables with complete schemas. Create two Datasets, ‘ghcn’ and ‘matches’, from the new Source. Each of these Datasets will contain a single table.
1. Click Browse Sources from the Sources tab. Click the “loom_tutorial” Source.
Page 12 of 25 Using Loom with the Hortonworks Sandbox
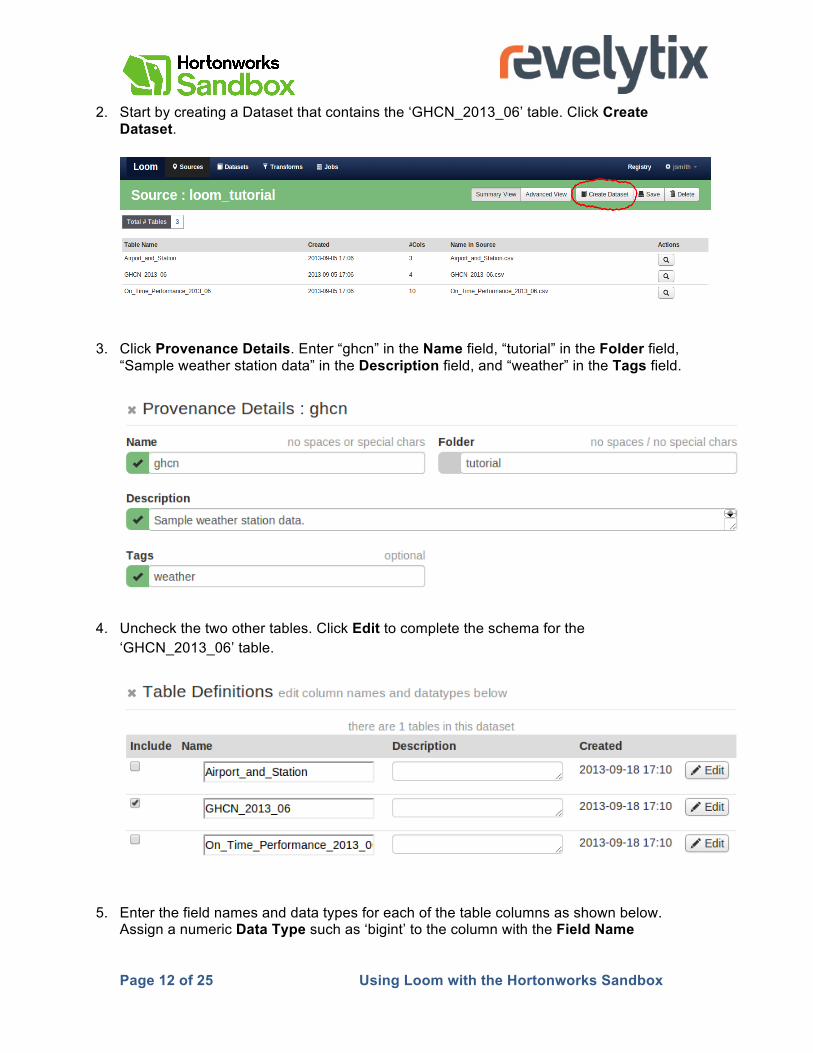
2. Start by creating a Dataset that contains the ‘GHCN_2013_06’ table. Click Create Dataset.
3. Click Provenance Details. Enter “ghcn” in the Name field, “tutorial” in the Folder field, “Sample weather station data” in the Description field, and “weather” in the Tags field.
4. Uncheck the two other tables. Click Edit to complete the schema for the ‘GHCN_2013_06’ table.
5. Enter the field names and data types for each of the table columns as shown below.
Assign a numeric Data Type such as ‘bigint’ to the column with the Field Name

Page 13 of 25 Using Loom with the Hortonworks Sandbox
‘quantity’. The ‘station’ column uniquely identifies each weather station. The ‘weatherdate’ column provides the date of the observation. The ‘stat’ column marks the observation as precipitation (‘PRCP’) or average wind speed (‘AWND’). The ‘quantity’ column shows the numeric value of the observation, in tenths of a millimeter or miles per hour, respectively.
6. Enter a more convenient name for the table: “ghcn”. Click Save.
7. Once you have saved the Dataset, you are taken to the Dataset summary tab. The ‘ghcn’ Dataset appears with the entity state “pending”. Click Datasets > Browse datasets to refresh the entity state of the ‘ghcn’ Dataset. Once it turns to “active”, click the ‘ghcn’ Dataset to see its details page.

Page 14 of 25 Using Loom with the Hortonworks Sandbox
8. Loom’s Activescan service automatically calculates basic statistics for new tables, such
as the number of rows. Click the spreadsheet to review column-level statistics.
9. Activescan shows the number of null values, min, max, mean, and standard deviation for the numeric column. If the statistics are not yet available, wait a minute for the Activescan jobs to finish and try again. Click Done.
10. Click Sources > Browse Sources to return to the source summary tab. Click on the ‘loom_tutorial’ source.
11. Create a Dataset that contains the ‘Airport_and_Station’ table. Click Create Dataset.

Page 15 of 25 Using Loom with the Hortonworks Sandbox
12. Click Provenance Details. Enter “matches” in the Name field, “tutorial” in the Folder field, “Matches airports and weather stations” in the Description field, and “weather” in the Tags field.
13. Uncheck the two other tables. Click Edit to complete the schema for the ‘Airport_and_Station’ table.
14. This file had a header, so the Field Name for each column is already given. Assign the Data Type ‘double’ to the column with the field name ‘distance’. The ‘airport’ column has three-letter abbreviations for U.S. domestic airports. The ‘station’ column gives the weather station nearest to the airport. The ‘distance’ column provides the distance between the weather station and airport in miles.

Page 16 of 25 Using Loom with the Hortonworks Sandbox
15. Enter a more convenient name for the table: “matches”. Click Save.
16. The ‘matches’ Dataset appears on the Dataset summary tab with the entity state “pending”. Click Datasets > Browse datasets to refresh the entity state until it says “active”. Now that you have Datasets containing tables with complete schemas, you can transform those tables with Hive to learn more about your data.
Step 5 - Create and Execute a Transform What is the impact of precipitation on flight delays? Execute Hive queries to get started on an answer to this question. Loom automatically records the lineage of the inputs and outputs. Every execution of a Hive query creates a Job with metadata about the execution.
1. Click the ‘ghcn’ Dataset and click the play button.
Page 17 of 25 Using Loom with the Hortonworks Sandbox
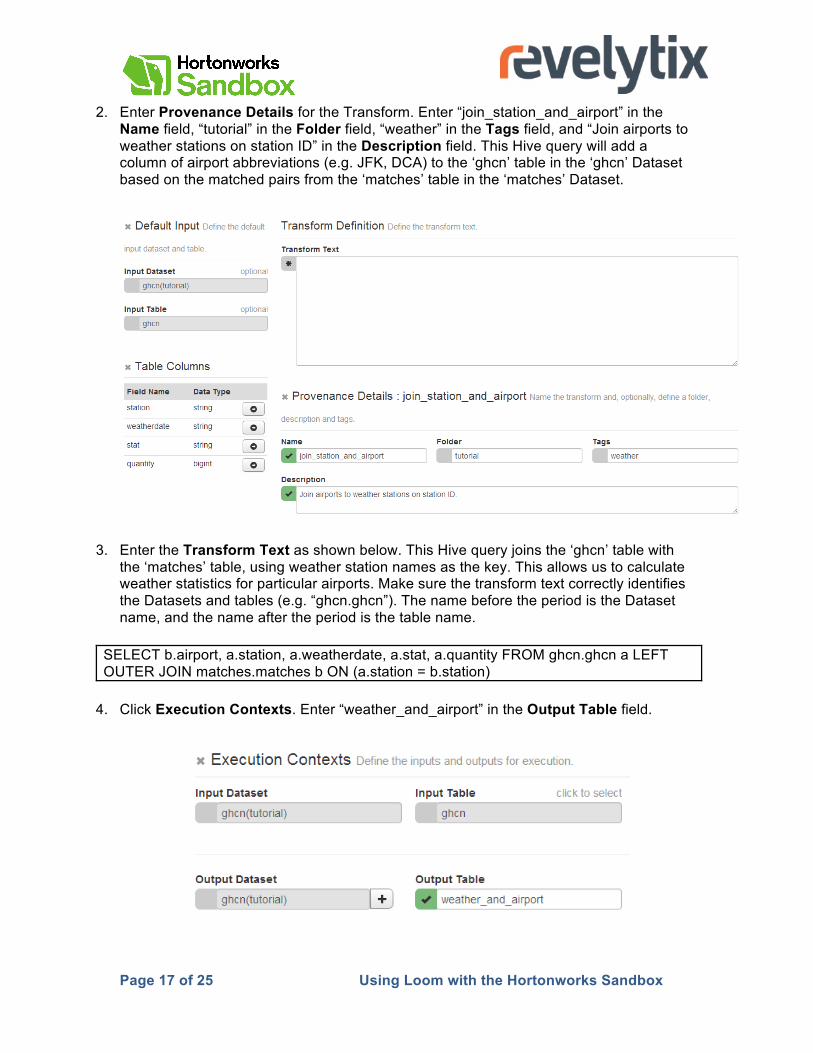
2. Enter Provenance Details for the Transform. Enter “join_station_and_airport” in the Name field, “tutorial” in the Folder field, “weather” in the Tags field, and “Join airports to weather stations on station ID” in the Description field. This Hive query will add a column of airport abbreviations (e.g. JFK, DCA) to the ‘ghcn’ table in the ‘ghcn’ Dataset based on the matched pairs from the ‘matches’ table in the ‘matches’ Dataset.
3. Enter the Transform Text as shown below. This Hive query joins the ‘ghcn’ table with the ‘matches’ table, using weather station names as the key. This allows us to calculate weather statistics for particular airports. Make sure the transform text correctly identifies the Datasets and tables (e.g. “ghcn.ghcn”). The name before the period is the Dataset name, and the name after the period is the table name.
SELECT b.airport, a.station, a.weatherdate, a.stat, a.quantity FROM ghcn.ghcn a LEFT OUTER JOIN matches.matches b ON (a.station = b.station)
4. Click Execution Contexts. Enter “weather_and_airport” in the Output Table field.

Page 18 of 25 Using Loom with the Hortonworks Sandbox
5. Click Run. Loom takes you to the Job details page.

Page 19 of 25 Using Loom with the Hortonworks Sandbox
6. Click Refresh Status to see the latest statistics for the Job.
7. The jobmay take a couple minutes to run.When the Job is ‘completed’, click the name of the dataset under Outputs to see the results.

Page 20 of 25 Using Loom with the Hortonworks Sandbox
8. The Loom lineage graph provides a record of inputs and outputs for Hive queries, no matter how complicated the workflow. Click the crossing arrows next to one of the tables to see how the tables are related.
9. Review the lineage graph. Blue dots represent tables, and orange circles represent Jobs. Click the Job to see details on the left-hand pane.
Page 21 of 25 Using Loom with the Hortonworks Sandbox
Now that you have transformed the data with Hive, you can optionally import the data into R for analysis and visualization. We encourage you to use the Loom Workbench to continue to explore the sample data. Better yet, starting using Loom with your own data and analytics!
Step 6 - Connect to Loom from R [optional] We can’t compare precipitation and flight delays with the data registered so far, but we can see which airports got the most precipitation in the sample period. Connect to a Loom instance, import data, and create a plot. The open-source R environment is a powerful tool for statistical analysis and visualization. R must be installed separately on your computer to complete this step. The RLoom package provides an easy way to access data and metadata in HDFS through calls to Loom’s RESTful API. The same data and metadata is also available to other tools, such as Python. For more information on the API, see the complete Loom documentation on the Revelytix website. If you see errors running this script, double-check that the entity names in the script match the names in your Loom registry. The RStudio IDE, which also must be installed separately, provides a convenient way to run through a script line-by-line. Download a script with the R code shown below by clicking this link: https://s3.amazonaws.com/Revelytix-‐Public/Loom_Tutorial_for_Hortonworks_Sandbox.R.
1. Download the RLoom package from Revelytix.
www.revelytix.com/transfer/RLoom-‐0.7.8.zip
2. Install RLoom and dependencies. The four dependencies are available from the main R repository. Install RLoom from the downloaded .tar.gz file.
> install.packages("RCurl") > install.packages("bitops") > install.packages("RJSONIO") > install.packages("plyr") > install.packages(pkgs="<your-‐path>/RLoom.tar.gz", repos=NULL, type="source")
3. Load the RLoom package and help pages.
> library(RLoom) > help(package="RLoom")

Page 22 of 25 Using Loom with the Hortonworks Sandbox
4. Connect to Loom. Enter your own name and password. Your host and port may also differ, depending on how the VM and Loom are set up in relation to your computer.
> loom <-‐ loomConnect( + host=“http://127.0.0.1”, + port=“8080”, + username=<your-‐name>, + password=<your-‐password> + ) > ping(loom) [1] TRUE

Page 23 of 25 Using Loom with the Hortonworks Sandbox
5. Return a data frame with the name and UUID of the Datasets registered in Loom.
> dataset.index <-‐ entityList(loom=loom, type="dataset/Dataset", + fields=c('entity/name','entity/id')) > colnames(dataset.index) <-‐ c("dataset", "id") > print(dataset.index) dataset id 1 weather 5228faa1-‐92d4-‐427f-‐9d14-‐ccc570de6cf9 2 otp 5228fc13-‐29f3-‐4ebe-‐ad85-‐4a1a96bf53cc
6. Store the UUID for the ‘weather’ Dataset as a string.
> weather.id <-‐ dataset.index[dataset.index$dataset=="weather","id"] > print(weather.id) [1] "5228faa1-‐92d4-‐427f-‐9d14-‐ccc570de6cf9"
7. Return metadata for ‘weather_and_airport’ table.
> weather.stats <-‐ dataStats(loom, containerID=weather.id, + dataUnitName="weather_and_airport", as.frame=FALSE) > weather.rows <-‐ weather.stats$'scan.table/numRecords' > print(weather.rows) [1] 18050
8. Import the ‘weather_and_airport’ table into R. This may take 1-2 minutes.
> weather.full <-‐ dataHead(loom=loom, containerID=weather.id, + dataUnitName="weather_and_airport", nrow=weather.rows) > head(weather.full) airport distance station weatherdate stat quantity 1 AMA 37.2 USW00023047 20130601 PRCP 0 2 AMA 37.2 USW00023047 20130601 AWND 60 3 TUP 0.4 USW00093862 20130601 PRCP 109 4 TUP 0.4 USW00093862 20130601 AWND 37 5 DRO 0.7 USW00093005 20130601 PRCP 0 6 DRO 0.7 USW00093005 20130601 AWND 26
9. Munge the data into an appropriate form. Turn the data frame of lists into a data frame of
vectors; convert the value column from character to numeric.
> weather <-‐ as.data.frame(sapply(weather,unlist),stringsAsFactors=FALSE) > weather$value <-‐ as.numeric(weather$value)
10. Aggregate precipitation by airport. Taking the sum results in total precipitation at each
airport over the sample period.

Page 24 of 25 Using Loom with the Hortonworks Sandbox
> airport.rain <-‐ by(weather$value[weather$stat=="PRCP"], +as.factor(weather$airport[weather$stat=="PRCP"]), sum) > airport.rain.sorted <-‐ sort(airport.rain, decreasing=TRUE) > airport.rain.sorted.inches <-‐ sort(airport.rain, decreasing=TRUE)/254
11. Plot the data with a bar plot.
> barplot(head(airport.rain.sorted.inches,10), main="Top Ten Airports by Precipitation, + June 2013", xlab="Airport", ylab="Total Inches")
This tutorial is only an example of what can be done with this data using Loom, Hadoop,
and R. Check out the accompanying video for an extended workflow.
Page 25 of 25 Using Loom with the Hortonworks Sandbox
Feedback We’re interested to hear about your experience with this tutorial. Please take this short survey.
About Revelytix Revelytix is a commercial software company providing tools for enterprise information management. The founders and engineering team have been together for 14 years, eight at Metamatrix (sold to Red Hat in 2006) and six years at Revelytix. For the first few years at Revelytix we built complex data management software for the Department of Defense. Loom is our flagship product. Loom manages Hadoop data complexity, making data scientists and other Hadoop users more productive. Loom automatically discovers datasets, generates metadata on datasets, and tracks lineage of operations in Hadoop. Loom has a published RESTful API and is integrated with R, through the RLoom package. For more information, please visit our website or contact us directly: www.revelytix.com [email protected] [email protected] 443 - 212 - 5049
About Hortonworks Hortonworks develops, distributes and supports the only 100-percent open source distribution of Apache Hadoop explicitly architected, built and tested for enterprise grade deployments. Developed by the original architects, builders and operators of Hadoop, Hortonworks stewards the core and delivers the critical services required by the enterprise to reliably and effectively run Hadoop at scale. Our distribution, Hortonworks Data Platform, provides an open and stable foundation for enterprises and a growing ecosystem to build and deploy big data solutions. Hortonworks also provides unmatched technical support, training and certification programs. For more information, visit www.hortonworks.com. The Hortonworks Sandbox can be found at: www.hortonworks.com/sandbox.