Embed Size (px)
Citation preview

100
Using Major Ions Data to Support the Demonstration of Hydraulic Containment in a Fractured Bedrock Aquifer
Steven P. Sayko, P.G. and William F. Daniels, P.G., Services Environmental, Inc.;
Richard J. Passmore, Glenn Springs Holdings, Inc. Abstract Demonstration of hydraulic containment is typically accomplished by contouring groundwater level data from monitoring wells and interpreting groundwater flow directions from the potentiometric contours. In fractured bedrock aquifers, the interpretation of water levels is often confounded by the complex structure and sharp contrasts in hydraulic properties. The Hyde Park Landfill Site in Niagara Falls, New York, is located over a fractured dolomite aquifer. A bedrock hydraulic containment system was installed and began operation in 1993. However, hydraulic containment could not be conclusively demonstrated with water level data. Installation of additional pumping wells, monitoring wells, and increased pumping had not resolved the difficulties in demonstrating containment. In 2001, it was recognized that a re-characterization of the site and revision of the site conceptual model was necessary to address the containment objective. A complete site reassessment was performed, including an extensive geophysical investigation, reevaluation of the site conceptual model, and the installation of 113 small-diameter, short-screen piezometers. As part of this effort, 70 of the new piezometers were sampled for major ions. The major ions results supported the site conceptual model and interpretation of water level data from the new piezometers, and strongly supported the interpretation of hydraulic containment. The combination of a supportable site conceptual model, water level data, and major ions data demonstrate that the hydraulic containment objectives have been achieved. This paper presents the use of major ion data for support of the hydraulic performance requirements.

101
Introduction
A 1986 agreement (the RRT) required that a groundwater recovery system be installed in the bedrock aquifer at the Hyde Park Landfill Site in Niagara Falls, New York (the Site). The agreement required that hydraulic containment be achieved along a delineated plume perimeter. Specifically, the RRT required that an inward hydraulic gradient be maintained and demonstrated using well pairs located normal to the plume perimeter, one well within and one well outside of the plume perimeter. Unfortunately, water levels in fractured bedrock aquifers are often confounded by the complex structure and sharp contrasts in hydraulic properties.
The groundwater containment system was installed and began operating in 1993. To date, the inward hydraulic gradient demonstration required in the RRT has not been fully satisfied. This failure to measure inward gradients at all monitoring well pairs is related to the hydrogeologic conditions in the bedrock aquifer, not due to an ineffective performance of the bedrock groundwater containment system.
In 2000, a reassessment of 17 years of Site data and the preparation of a numerical groundwater flow model were initiated. The client, principal consultant, and two new consulting firms formed a working technical team to complete this reassessment. By 2001, it was recognized that the existing Site conceptual model and monitoring well network lacked sufficient detail/resolution to reliably demonstrate inward hydraulic gradients. A complete re-characterization of the Site would be required to develop a new Site conceptual model and increase the resolution of the monitoring network. Additional investigations were performed, including an extensive geophysical investigation, borehole packer testing, borehole vertical flow measurements, borehole video logging, literature review, and extensive continuous water level monitoring.
Based on these efforts, the Site conceptual model changed from a three interval (Upper, Middle, and Lower) bedrock system, to a layer-cake of 11 thin, bedding-parallel, flow zones separated by aquitards ranging from 5 to 25 feet in thickness. This characterization is consistent with the work of Johnston (1964) and Yager (1996). A total of 113 small-diameter, short-screen piezometers were installed, slug tested, and monitored for an extended period with electronic water level recorders and hand measurements. Seventy of the new piezometers were sampled for Site-specific organic parameters, major ions, and stable isotopes of oxygen and hydrogen.
This paper presents the major ion data as it was used in support of the hydraulic containment performance. These data have been interpreted and presented to the EPA as a line of evidence that the hydraulic containment objective of the RRT is satisfied. The geochemical evaluation presented here is highly simplified; for a technical discussion of geochemistry, the reader is referred to Hanshaw and Back (1979), Hem (1970), Deutsch (1997), or numerous other texts on the subject.
Geology
The Site is located approximately one mile east of the Lower Niagara River, Figure 1.
The bedrock beneath the Site is the Lockport Formation, a Silurian aged dolomite. In the vicinity of the Site, the Lockport and the underlying formations, strike approximately north 70º east, and dip to the south at approximately 40 feet per mile. The Lockport at the Site sustains pumping rates between 0.1 and 40 gallons per minute.
Figure 2 presents a simple west-to-east geologic cross-section from the Niagara River through the Site. All of
Figure 1. Site Location.

102
the active Site remediation and monitoring is in the Lockport Dolomite.
The Rochester Shale Member of the Clinton Group underlies the Lockport and provides an essentially impermeable bottom for the Lockport. The top of the Rochester shale outcrops in the Niagara River Gorge approximately 200 feet above the river and the Lockport discharges from a seepage face along the gorge above the Rochester Shale. East and north of the Site are conduits and a canal that carry water to the New York Power Authority (NYPA) Robert Moses hydroelectric power generating station. Near the Site, these features are excavated approximately to the top of the Rochester Shale. Water levels in the conduits and canal fluctuate by as much as 14 feet daily but maintain a relatively stable average water level throughout the year. The conduits and canal may act as both an area of discharge and recharge, depending on the flow zone that intercepts these features. In the vicinity of the Site, individual flow zones were identified by Johnston (1964) based on direct observation of seepage from bedding planes during the excavation of the NYPA conduits and canal. Seepage is clearly observed along long linear bedding planes. Figure 3 shows a photo of ice forming along one flow zone that outcrops in the NYPA canal north of the Site.
During Site investigations in 2000 and 2001, flow zones were defined at bedding planes where transmissive zones were frequently observed. The zones were identified using borehole geophysics and vertical flow measurements. The zones identified were consistent with the flow zones identified by Johnston (1964) and later Yager (1996). Because the bedding in the Lockport is very uniform, the elevations of the flow zones are predictable to within a few feet. However, the hydraulic properties within a flow zone can be highly variable. Transmissivity values measured in the flow zones ranged from less than 0.001 ft2/day, up to 1,000 ft2/day, depending on the flow zone.
Site Re-Characterization
The original Site conceptual model defined three intervals in the bedrock. This characterization has since been replaced with a conceptual model with 11 discrete flow zones. The revision in the Site conceptual model was
Figure 3: Icicles formed along a flow zone discharging in the NYPA canal.
Figure 2. Simplified geologic cross-section. The orange on the surface represents the glacial till overburden. The vertical exaggeration is approximately 5:1.

103
undertaken not because the original conceptualization was incorrect; a model, conceptual or mathematical, is an approximation of a real system, and a model is acceptable if it satisfies the project objectives. The three-interval conceptual model satisfied the original project objectives. However, that characterization was insufficient to satisfy the “precision” necessary to address the inward hydraulic gradient monitoring requirement defined in the RRT. Specifically, the Upper, Middle, and Lower bedrock monitoring wells had long-open intervals that typically intercepted two or more discrete flow zones; these wells provided a composite head representative of the heads in the discrete flow zones intercepted, and the transmissivity of the flow zone at the well location. Sokol (1963) provides an analysis of the head averaging that occurs for wells that are completed across multiple flow zones with varying transmissivities. Figure 4 presents a cross-sectional view showing the 11 discrete flow zones identified, and the construction of the Upper, Middle, and Lower bedrock monitoring wells.
The lack of precision related to the water levels from monitoring wells intercepting multiple flow zones was addressed by installing short-screen, flow zone specific piezometers. Many of the long open-interval bedrock monitoring wells were retrofitted with multiple 1-inch diameter piezometers with 2-foot long screens, and four feet of filter pack. The intervals between piezometers completed in the same well were filled with bentonite chips. All piezometers were checked for an interconnection across the bentonite seal; no interconnections were found.
While the water levels in the piezometers are still a composite of the 4-foot interval monitored, the transmissivity of the flow zone monitored is much greater than the transmissivity of the intact rock above and below the flow zone, and the water level should represent the head in the flow zone.
The results of the water level monitoring in the piezometers provided two important lessons:
● Regardless of how perfect our measuring instruments (the piezometers) were, heterogeneity within the bedrock could still confound the inward gradient monitoring objective; and
● Monitoring horizontal gradients is not effective for containment monitoring where vertical groundwater flow is dominant.
Figure 4. Looking Along Strike: Upper (blue), Middle (green), and Lower (red) bedrock monitoring wells intercept multiple flow zones. Flow zones FZ-01 to FZ-11 (parallel lines dipping to the right) are numbered from the top to the bottom of the formation.

104
Demonstrating Hydraulic Containment without Inward Gradient Monitoring
Based on the results of a major investigative effort, we had shown that the use of piezometer or wells pairs to demonstrate a hydraulic performance requirement could be confounded by fractured bedrock, regardless of how much care was taken in the design and construction of the piezometers/wells. Fortunately, the EPA recognizes this potential problem. In Elements for Effective Management of Operating Pump and Treat Systems, EPA (2002), the Agency makes two important observations “… the complex hydrogeology at fractured bedrock or highly heterogeneous sites may prohibit conclusive results …” and “accurate interpretation of actual capture is difficult and is best evaluated with converging lines of evidence.” The EPA document provides “Potential Lines of Evidence for Ground Water Capture”, reproduced here. While these lines of evidence are suggested in the EPA guidance, the client and consultant are still responsible for providing a convincing argument that containment is achieved by these lines of evidence.
The project team pursued all lines of evidence suggested in EPA (2002). Groundwater modeling provided a flow budget and predicted capture zones using particle tracking. The model indicated total capture. Statistical analyses of concentration trends were completed. The analysis indicated that concentrations were either stable or decreasing in the monitoring wells. Dye tracer tests performed in the past had experienced significant difficulties. Dye tracers were not further pursued. Unfortunately, the model and chemistry data were not sufficiently convincing to overcome the lack of conventional water level data supporting complete containment.
The additional evidence necessary to demonstrate that the RRT containment objective was satisfied came from the major ions data. The major ions analysis in effect became a tracer study where the tracer solution begins as groundwater recharge, either precipitation or surface water infiltration. This water has very low concentrations of the major ions:
Cations: calcium, magnesium, sodium, and potassium; and
Anions: chloride, carbonate, bicarbonate, and sulfate.
This water is “traced” by following the geochemical evolution, or aging of the groundwater. Groundwater evolves as it migrates, and groundwater flow is in the direction from younger to older water. The geochemical evolution of groundwater in carbonate aquifers has been studied by numerous authors, for example: Hanshaw and Back (1979), and Eberts and George (2000), and found to follow a predictable pathway. The Site data exhibit a groundwater evolution consistent with these previous investigators, and the evolution patterns support the Site conceptual model and the effectiveness of the hydraulic containment.
Potential Lines of Evidence for Ground Water Capture
• calculations of capture zone width based on flow budget and/or analytical models
• interpretation of ground water flow lines from potentiometric surface maps that are based on measured ground water elevations from the various subsurface stratigraphic units
• inward flow relative to a compliance boundary, based on measured ground water elevations at two or more locations oriented perpendicular to the boundary
• concentration trends over time at sentinel wells located downgradient of the capture zone
• particle tracking in conjunction with a numerical ground water flow model calibrated/verified by actual ground water elevations under pumping conditions
• implementation and analysis of data from tracer tests Elements for Effective Management of Operating Pump and Treat Systems,EPA (2002)
105
Major Ions Evaluation
Using Piper Diagrams
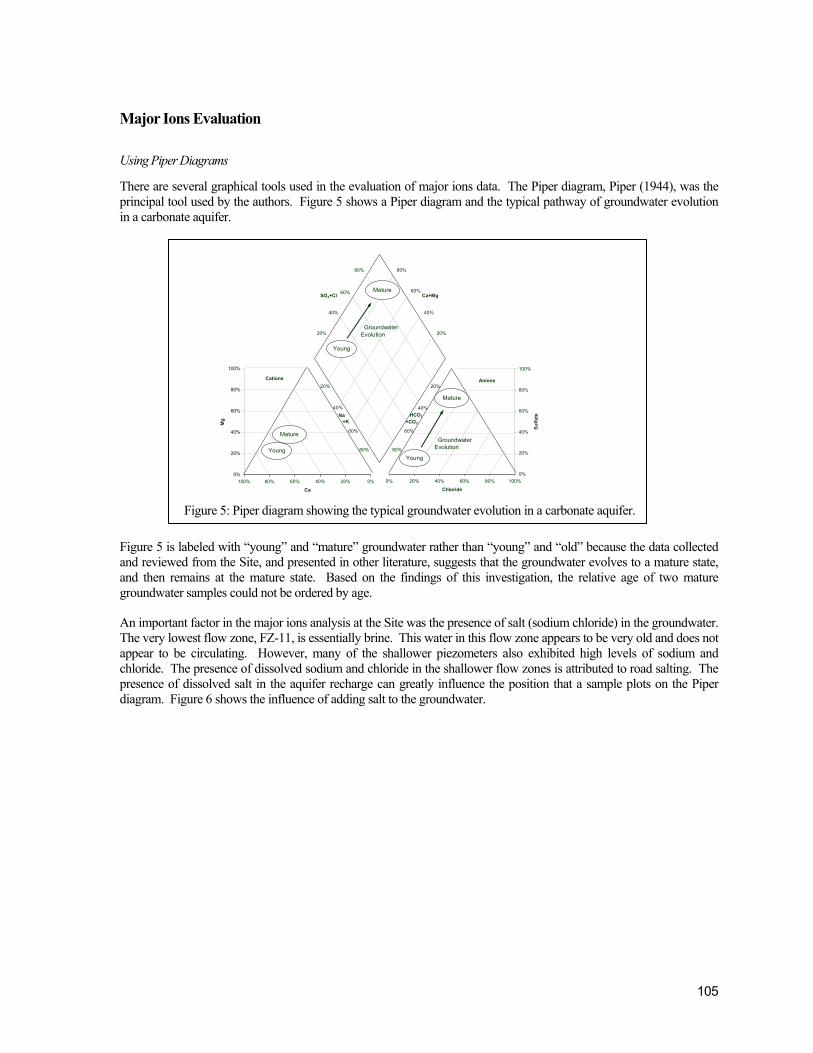
There are several graphical tools used in the evaluation of major ions data. The Piper diagram, Piper (1944), was the principal tool used by the authors. Figure 5 shows a Piper diagram and the typical pathway of groundwater evolution in a carbonate aquifer.
Figure 5 is labeled with “young” and “mature” groundwater rather than “young” and “old” because the data collected and reviewed from the Site, and presented in other literature, suggests that the groundwater evolves to a mature state, and then remains at the mature state. Based on the findings of this investigation, the relative age of two mature groundwater samples could not be ordered by age.
An important factor in the major ions analysis at the Site was the presence of salt (sodium chloride) in the groundwater. The very lowest flow zone, FZ-11, is essentially brine. This water in this flow zone appears to be very old and does not appear to be circulating. However, many of the shallower piezometers also exhibited high levels of sodium and chloride. The presence of dissolved sodium and chloride in the shallower flow zones is attributed to road salting. The presence of dissolved salt in the aquifer recharge can greatly influence the position that a sample plots on the Piper diagram. Figure 6 shows the influence of adding salt to the groundwater.
0%
20%
40%
60%
80%
100%
0% 20% 40% 60% 80% 100%
Chloride
Sulfa
te
Anions
0%
20%
40%
60%
80%
100%
0%20%40%60%80%100%
Ca
Mg
Cations
Ca+MgSO4+Cl
80%
60%
40%
20%
20%
40%
60%
80%
20%
40%
60%
80%
80%
60%
40%
20%
Na +K
HCO3
+CO3
Young
Mature
Groundwater Evolution
Groundwater Evolution
Young
Mature
Young
Mature
Figure 5: Piper diagram showing the typical groundwater evolution in a carbonate aquifer.

106
Salty groundwater recharge creates young groundwater that plots on a line between the “young” groundwater as presented on Figure 5, and the salty recharge that plots in the right corner of each graph in the Piper diagram. Figures 7, 8, and 9 present the major ions data from the uppermost flow zone at the Site (FZ-01), the next lower flow zone (FZ-02), and the deepest flow zone currently considered to be part of the actively circulating groundwater system (FZ-09).
0%
20%
40%
60%
80%
100%
0% 20% 40% 60% 80% 100%
Chloride
Sulfa
te
Anions
0%
20%
40%
60%
80%
100%
0%20%40%60%80%100%
Ca
Mg
Cations
Ca+MgSO4+Cl
80%
60%
40%
20%
20%
40%
60%
80%
20%
40%
60%
80%
80%
60%
40%
20%
Na +K
HCO3
+CO3
Young
Mature
Groundwater Evolution
Groundwater Evolution
Salty Recharge
Young
Mature
Salty Recharge
Young
Mature
Salty Recharge
Figure 6. Influence of dissolved sodium chloride on the Piper diagram.
0%
20%
40%
60%
80%
100%
0% 20% 40% 60% 80% 100%
Chloride
Sulfa
te
Anions
0%
20%
40%
60%
80%
100%
0%20%40%60%80%100%
Ca
Mg
Cations
Ca+MgSO4+Cl
80%
60%
40%
20%
20%
40%
60%
80%
20%
40%
60%
80%
80%
60%
40%
20%
Na +K
HCO3
+CO3
Figure 7. Young groundwater in FZ-01.

107
On Figure 7, a line in drawn showing typical young groundwater. This line is a mixing line, showing the combination of major ions dissolved from the Lockport Dolomite with the recharge containing differing levels of dissolved road salt. The mixing line is consistent with that shown on Figure 6. Figure 8 presents the FZ-02 data. A mixing line for FZ-02 is shown, and the FZ-01 mixing line is retained for reference. Figure 9 presents the FZ-09 data. A mixing line for FZ-09 is shown, and the FZ-01 mixing line is retained for reference. The aging sequence suggested by the FZ-01, FZ-02, and FZ-09 data are generally consistent in the intervening flow zones. Figure 10 shows the data from all of the piezometers and the groundwater evolution/aging pattern, interpreted.
0%
20%
40%
60%
80%
100%
0% 20% 40% 60% 80% 100%
Chloride
Sulfa
te
Anions
0%
20%
40%
60%
80%
100%
0%20%40%60%80%100%
Ca
Mg
Cations
Ca+MgSO4+Cl
80%
60%
40%
20%
20%
40%
60%
80%
20%
40%
60%
80%
80%
60%
40%
20%
Na +K
HCO3
+CO3
Figure 9. Groundwater in FZ-09. Heavy solid line is an interpretation of typical FZ-09 groundwater, the dashed line is the line for FZ-01 presented for reference.
0%
20%
40%
60%
80%
100%
0% 20% 40% 60% 80% 100%
Chloride
Sulfa
te
Anions
0%
20%
40%
60%
80%
100%
0%20%40%60%80%100%
Ca
Mg
Cations
Ca+MgSO4+Cl
80%
60%
40%
20%
20%
40%
60%
80%
20%
40%
60%
80%
80%
60%
40%
20%
Na +K
HCO3
+CO3
Figure 8. Groundwater in FZ-02. Heavy solid line is an interpretation of typical FZ-02 groundwater, the dashed line is the line for FZ-01 presented for reference.

108
The groundwater evolution at the Site is generally consistent with the conditions expected for a carbonate aquifer. The differences between the conceptual evolution presented on Figure 5 and conditions at the Site, are: the introduction of road salt in the water recharging the aquifer, as proposed on Figure 6; and the Cation evolution that is the reverse of the conditions suggested on Figures 5 and 6. No explanation for the apparent contradiction in the Cations data is offered here.
Using Sulfate Concentrations
The Piper diagrams provide an effective visual method of assessing relative groundwater age. However, to spatially assess the relative age of groundwater, a single-value for each piezometer, as opposed to a Piper diagram, is desirable. The aging patterns observed in the Piper diagrams often correspond to total dissolved solids (TDS) concentrations (approximately equal to the sum of the major ions concentrations), and the sulfate concentrations; Eberts and George (2000). TDS were evaluated for assessing groundwater age; however, the presence of dissolved road salt discussed above artificially increases the TDS and confounds the interpretation of groundwater age using TDS. Sulfate concentrations are less likely than TDS to be influenced by anthropogenic factors. The groundwater evolution depicted on the Anions portion of Figure 5 reflects increasing sulfate concentrations due to the dissolution of gypsum in the bedrock. Figure 11 presents the sulfate concentrations observed in each of the flow zones. Each point on the graph represents one piezometer. The dashed line represents the median of the data for each flow zone. The shallowest flow zone, FZ-01, has relatively low sulfate concentrations. As groundwater migrates deeper into the bedrock, the sulfate concentrations increase until sulfate solubility is reached.
0%
20%
40%
60%
80%
100%
0% 20% 40% 60% 80% 100%
Chloride
Sulfa
te
Anions
0%
20%
40%
60%
80%
100%
0%20%40%60%80%100%
Ca
Mg
Cations
Ca+MgSO4+Cl
80%
60%
40%
20%
20%
40%
60%
80%
20%
40%
60%
80%
80%
60%
40%
20%
Na +K
HCO3
+CO3
Figure 10. Evolution of groundwater at the Hyde Park Site as interpreted from the Piper diagram. The blue arrows show the direction of increasing age.

109
To compare the sulfate concentrations with the Piper diagram, a Piper diagram was prepared with sample points sized proportionally to the sulfate concentration, Figure 12.
Figure 12 shows that for the groundwater at the Hyde Park Site, sulfate concentrations correspond with the aging patterns determined from the Piper diagram. Based on this analysis, the sulfate data were used to evaluate the relative age of groundwater spatially.
Spatial Distribution of Sulfate and Relative Groundwater Age
A series of eight sulfate concentrations maps, one for each of the monitored flow zones, were prepared for the EPA in presenting the major ions results. These figures showed the relative age of groundwater in each flow zone and
0%
20%
40%
60%
80%
100%
0% 20% 40% 60% 80% 100%
Chloride
Sulfa
te
Anions
0%
20%
40%
60%
80%
100%
0%20%40%60%80%100%
Ca
Mg
Cations
Ca+MgSO4+Cl
80%
60%
40%
20%
20%
40%
60%
80%
20%
40%
60%
80%
80%
60%
40%
20%
Na +K
HCO3
+CO3
Sulfate Concentration = 1,400 mg/L
= 800 mg/L
= 200 mg/L
Figure 12: Piper diagram with points sized proportionally to the sulfate concentrations.
10
100
1,000
10,000
0 1 2 3 4 5 6 7 8 9 10 11 12Flow Zone
Con
cent
ratio
n (m
g/L)
The dashed line connects the median values for each flow zone.
Figure 11: Sulfate concentrations observed in Site piezometers. Each point represents the result from one piezometer. Flow zones FZ-03, FZ-08, and FZ-10 are not included in the monitoring network.

110
provided strong evidence that hydraulic containment was satisfied. For this paper, one cross-section showing sulfate concentrations is presented. This one figure effectively summarizes the eight flow zone maps.
Figure 13 is a cross-section through the site showing the young and mature groundwater (blue areas are young, red areas mature, and yellow identifies a transition between young and mature groundwater). The current conceptual model of the Site and groundwater modeling defined the general flow conditions as:
● Vertically downward groundwater flow in the shallow flow zones, FZ-01 through FZ-04;
● Horizontal groundwater flow in FZ-05 through FZ-09; and
● Groundwater in FZ-10 and FZ-11 is essentially stagnant.
Sulfate concentrations are lowest in FZ-01 and increase moving downward. Groundwater in the vicinity of the landfill in FZ-01 to FZ-05 is young. This aging pattern is consistent with the conceptual model of vertically downward flow. In FZ-06 to FZ-09, the groundwater below the landfill is mature. However, between the landfill and the Niagara River gorge, the natural point of discharge for the bedrock aquifer, there is an area of young groundwater. The bedrock purge wells surround the landfill area (some purge wells are shown on Figure 13; they are the long open-interval wells). The purge wells must be controlling migration of the mature groundwater in FZ-06 to FZ-09; otherwise there would be mature groundwater discharging at the gorge.
Major Ions Demonstrate the FZ-11 Groundwater Is Not Flowing
The application of sulfate concentrations to assign a relative age to the groundwater provides strong evidence of the hydraulic containment system’s effectiveness. Several other observations were made from the data. One of the most interesting was the interpretation of groundwater flow in FZ-11. The groundwater in FZ-11 is distinctly different than the groundwater in FZ-01 to FZ-09. FZ-11 contains natural gas, occasional traces of petroleum, and very high concentrations of sodium and chloride. Johnston (1964) reviewed the chemistry of FZ-11 (his zone 1) and concluded that the groundwater was stagnant. Chebotarev (1955) suggested that where chloride is present as the predominant anion in groundwater, the groundwater flow is sluggish and flushing of the aquifer is minimal. While these observations are reasonable, there are several purge wells completed in FZ-11 that are pumping and removing organic Site-related parameters.
AFW
-1Overburden
Rochester Formation
Nia
gara
Riv
er
Gor
ge
204204
C3
242
222
C3
242
222
1,460PM
W-1
1,080
193
J5
193
1,610
1,700
1,240
1,360
950
FZ-01
FZ-02
FZ-04
FZ-05
FZ-06
FZ-07
FZ-09
FZ-11
Garfield St.Tunnel
I1
1,460
1,230
298
78.1
YoungWater
MatureWater
PW-3
MPW
-3L
1,420
1,423PW
-2U
PW-2
MPW
-2L
369
1,420
1,365
Landfill Area
Note: For Locations with multiple samples and duplicates, the sulfate value presented represents an average.
AB
P-7
203
Well/Piezometer and SO4 Concentration (mg/L)
Well/Piezometer not sampled for Major Ions
193 Well/Piezometer and SO4 Concentration (mg/L)
Well/Piezometer not sampled for Major Ions
193
Lock
port
For
mat
ion
Figure 13: Cross-section showing the relative age of groundwater based on sulfate concentrations. Long open interval wells are the bedrock purge wells.
111
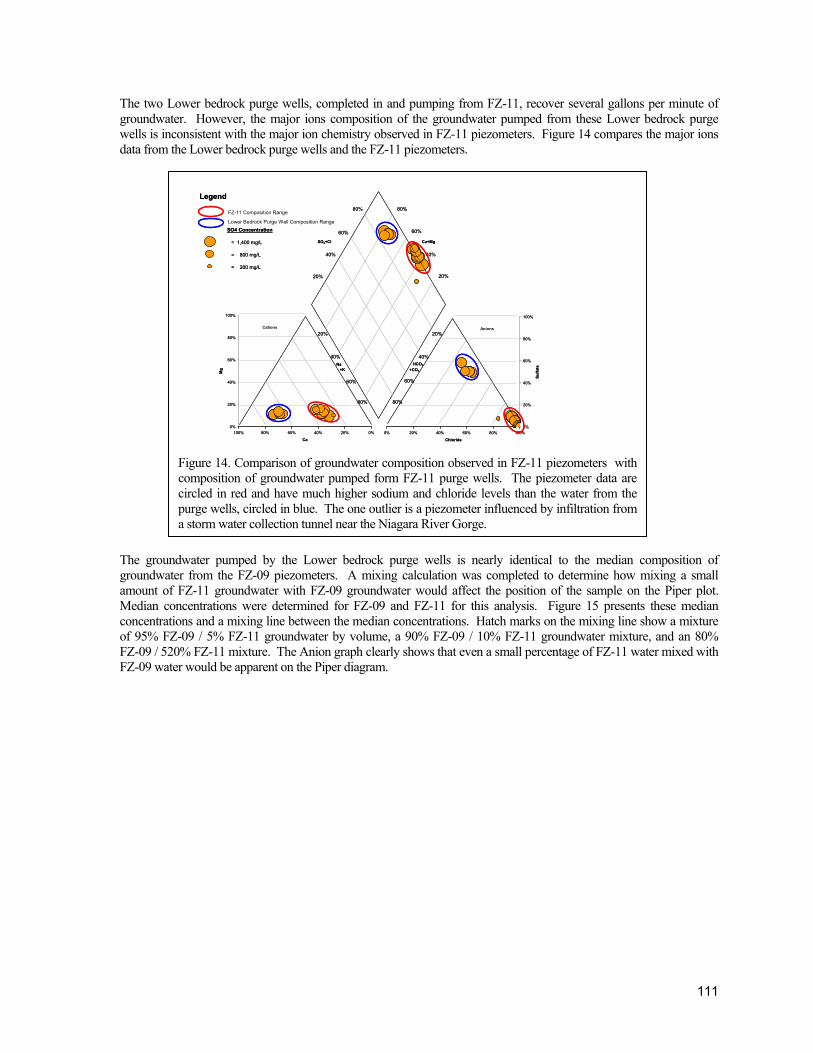
The two Lower bedrock purge wells, completed in and pumping from FZ-11, recover several gallons per minute of groundwater. However, the major ions composition of the groundwater pumped from these Lower bedrock purge wells is inconsistent with the major ion chemistry observed in FZ-11 piezometers. Figure 14 compares the major ions data from the Lower bedrock purge wells and the FZ-11 piezometers.
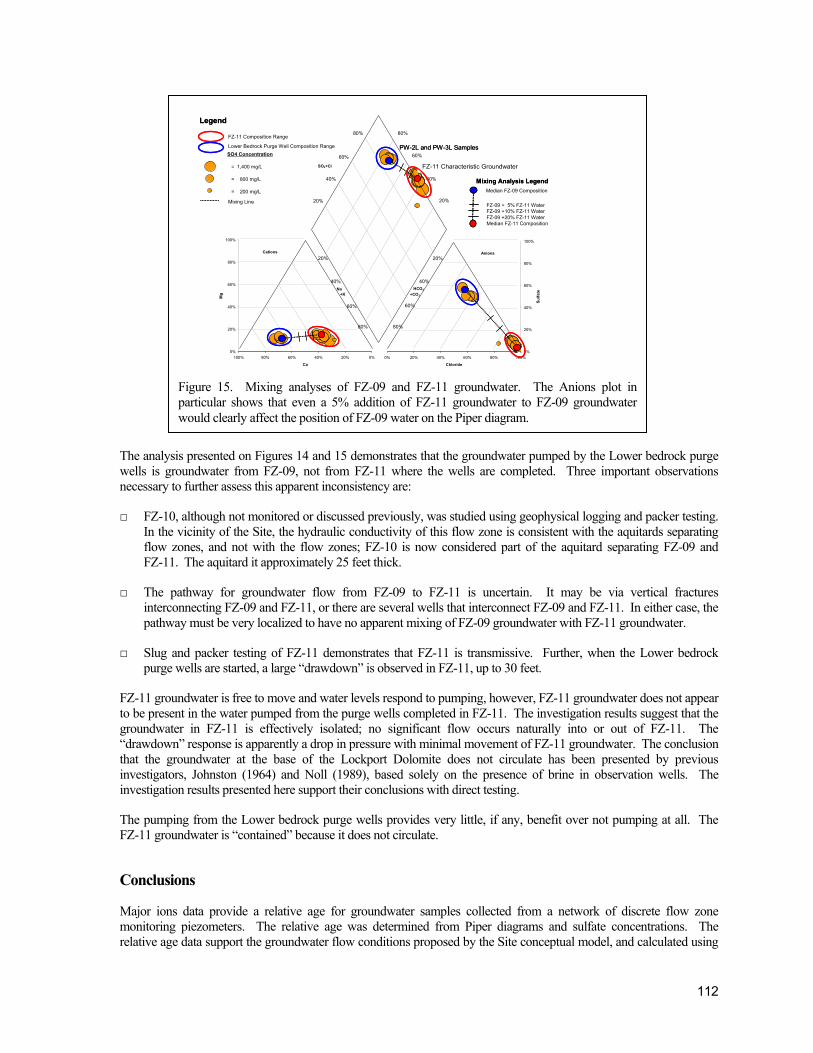
The groundwater pumped by the Lower bedrock purge wells is nearly identical to the median composition of groundwater from the FZ-09 piezometers. A mixing calculation was completed to determine how mixing a small amount of FZ-11 groundwater with FZ-09 groundwater would affect the position of the sample on the Piper plot. Median concentrations were determined for FZ-09 and FZ-11 for this analysis. Figure 15 presents these median concentrations and a mixing line between the median concentrations. Hatch marks on the mixing line show a mixture of 95% FZ-09 / 5% FZ-11 groundwater by volume, a 90% FZ-09 / 10% FZ-11 groundwater mixture, and an 80% FZ-09 / 520% FZ-11 mixture. The Anion graph clearly shows that even a small percentage of FZ-11 water mixed with FZ-09 water would be apparent on the Piper diagram.
0%
20%
40%
60%
80%
100%
0% 20% 40% 60% 80% 100%
Chloride
Sulfa
te
Anions
0%
20%
40%
60%
80%
100%
0%20%40%60%80%100%
Ca
Mg
Cations
Ca+MgSO4+Cl
80%
60%
40%
20%
20%
40%
60%
80%
20%
40%
60%
80%
SO4 Concentration = 1,400 mg/L
= 800 mg/L
= 200 mg/L
80%
60%
40%
20%
Na +K
HCO3
+CO3
Legend
Lower Bedrock Purge Well Composition Range
FZ-11 Composition Range
0%
20%
40%
60%
80%
100%
0% 20% 40% 60% 80% 100%
Chloride
Sulfa
te
Anions
0%
20%
40%
60%
80%
100%
0%20%40%60%80%100%
Ca
Mg
Cations
Ca+MgSO4+Cl
80%
60%
40%
20%
20%
40%
60%
80%
20%
40%
60%
80%
SO4 Concentration = 1,400 mg/L
= 800 mg/L
= 200 mg/L
80%
60%
40%
20%
Na +K
HCO3
+CO3
Legend
Lower Bedrock Purge Well Composition Range
FZ-11 Composition Range
Figure 14. Comparison of groundwater composition observed in FZ-11 piezometers with composition of groundwater pumped form FZ-11 purge wells. The piezometer data are circled in red and have much higher sodium and chloride levels than the water from the purge wells, circled in blue. The one outlier is a piezometer influenced by infiltration from a storm water collection tunnel near the Niagara River Gorge.
112
The analysis presented on Figures 14 and 15 demonstrates that the groundwater pumped by the Lower bedrock purge wells is groundwater from FZ-09, not from FZ-11 where the wells are completed. Three important observations necessary to further assess this apparent inconsistency are:
□ FZ-10, although not monitored or discussed previously, was studied using geophysical logging and packer testing. In the vicinity of the Site, the hydraulic conductivity of this flow zone is consistent with the aquitards separating flow zones, and not with the flow zones; FZ-10 is now considered part of the aquitard separating FZ-09 and FZ-11. The aquitard it approximately 25 feet thick.
□ The pathway for groundwater flow from FZ-09 to FZ-11 is uncertain. It may be via vertical fractures interconnecting FZ-09 and FZ-11, or there are several wells that interconnect FZ-09 and FZ-11. In either case, the pathway must be very localized to have no apparent mixing of FZ-09 groundwater with FZ-11 groundwater.
□ Slug and packer testing of FZ-11 demonstrates that FZ-11 is transmissive. Further, when the Lower bedrock purge wells are started, a large “drawdown” is observed in FZ-11, up to 30 feet.
FZ-11 groundwater is free to move and water levels respond to pumping, however, FZ-11 groundwater does not appear to be present in the water pumped from the purge wells completed in FZ-11. The investigation results suggest that the groundwater in FZ-11 is effectively isolated; no significant flow occurs naturally into or out of FZ-11. The “drawdown” response is apparently a drop in pressure with minimal movement of FZ-11 groundwater. The conclusion that the groundwater at the base of the Lockport Dolomite does not circulate has been presented by previous investigators, Johnston (1964) and Noll (1989), based solely on the presence of brine in observation wells. The investigation results presented here support their conclusions with direct testing.
The pumping from the Lower bedrock purge wells provides very little, if any, benefit over not pumping at all. The FZ-11 groundwater is “contained” because it does not circulate.
Conclusions
Major ions data provide a relative age for groundwater samples collected from a network of discrete flow zone monitoring piezometers. The relative age was determined from Piper diagrams and sulfate concentrations. The relative age data support the groundwater flow conditions proposed by the Site conceptual model, and calculated using
0%
20%
40%
60%
80%
100%
0% 20% 40% 60% 80% 100%
Chloride
Sulfa
te
Anions
0%
20%
40%
60%
80%
100%
0%20%40%60%80%100%
Ca
Mg
Cations
Ca+MgSO4+Cl
80%
60%
40%
20%
20%
40%
60%
80%
20%
40%
60%
80%
SO4 Concentration = 1,400 mg/L
= 800 mg/L
= 200 mg/L
80%
60%
40%
20%
Na +K
HCO3
+CO3
FZ-11 Composition Range
Lower Bedrock Purge Well Composition Range
FZ-11 Composition Range
Mixing Line
Legend
PW-2L and PW-3L Samples
FZ-11 Characteristic Groundwater
Median FZ-09 Composition
FZ-09 + 5% FZ-11 WaterFZ-09 +10% FZ-11 WaterFZ-09 +20% FZ-11 WaterMedian FZ-11 Composition
Mixing Analysis Legend
FZ-11 Composition Range
Lower Bedrock Purge Well Composition Range
FZ-11 Composition Range
Mixing Line
Legend
PW-2L and PW-3L Samples
FZ-11 Characteristic Groundwater
Median FZ-09 Composition
FZ-09 + 5% FZ-11 WaterFZ-09 +10% FZ-11 WaterFZ-09 +20% FZ-11 WaterMedian FZ-11 Composition
Mixing Analysis Legend
Figure 15. Mixing analyses of FZ-09 and FZ-11 groundwater. The Anions plot in particular shows that even a 5% addition of FZ-11 groundwater to FZ-09 groundwater would clearly affect the position of FZ-09 water on the Piper diagram.

113
a numerical groundwater flow model. The data strongly support the conclusion that the Site hydraulic containment system is achieving the regulatory hydraulic containment objectives. Following the recommendations provided in Elements for Effective Management of Operating Pump and Treat Systems, EPA (2002), the major ions results have been incorporated as a “line of evidence” to support the performance of the hydraulic containment system.
The major ions data also demonstrated that groundwater in the deepest flow zone at the Site was effectively stagnant/non-circulating. How this finding will be incorporated into the Site remedy is yet to be determined.
Acknowledgements
The work presented here would not have been possible without the support of Miller Springs Remediation Management, Inc., and the team leadership of Dr. George Luxbacher. The members of the technical team from Conestoga-Rovers and Associates, Stavros S. Papadopulos and Associates, Inc., and Services Environmental, Inc., worked effectively together to bring the best resources to the project and to ensure that everyone involved understood the work and findings. Thanks to Dimitri Vlassopoulos at Stavros S. Papadopulos and Associates, Inc., for his expert review of the geochemistry during the major ions investigation and reporting.
References
Deutsch, W.J., 1997. Groundwater Geochemistry, Fundamentals and Applications to Contamination, Lewis Publishers
Eberts, S.M. and George, L.L, 2000, Regional Ground-Water Flow and Geochemistry in the Midwestern basins and Arches Aquifer System in Parts of Indiana, Michigan, and Illinois. United States Geological Survey Professional Paper 1423-C.
Hanshaw, B.B. and Back, W., 1979. Major Geochemical Processes in the Evolution of Carbonate-Aquifer Systems. Journal of Hydrology, 43 (1979) 287-312.
Hem, J.D., 1970. Study and Interpretation of the Chemical Characteristics of Natural Water (2nd ed). United States Geological Survey Water Supply Paper 1473.
Johnston, R.H., 1964. Groundwater in the Niagara Falls Area, New York, State of New York Conservation Department, Water Resources Commission, Bulletin GW-53.
Noll, Richard S., 1989, Geochemistry and Hydrology of Groundwater Flow Systems in the Lockport Dolomite, near Niagara Falls, New York, Masters Thesis, University of Alaska, Fairbanks, Alaska.
Piper, A.M., 1944. A Graphic Procedure in the Geochemical Interpretation of Water Analysis. American Geophysical Union, V. 25, p. 914-923.
Sokol, D., 1963. Position and Fluctuations of Water Level in a Well Perforated in More Than One Aquifer. Journal of Geophysical Research, 68(4), pp. 1079-1080.
Yager, R.M., 1996. Simulated Three-Dimensional Ground-Water Flow in the Lockport Group, A Fractured-Dolomite Aquifer Near Niagara Falls, New York, United States Geological Survey, Water Supply Paper 2487.

114
Biographical Sketches Steven P. Sayko, P.G. Mr. Sayko is the President of Services Environmental, Inc. He has a B.S. in Physics, an M.S. in geology, and 20 years of experience in environmental investigation and remediation. His expertise includes: groundwater modeling, visualization, aquifer analysis, and remediation design and evaluation. Mr. Sayko currently participates on several multi-consultant technical teams. These teams bring together key resources to cooperatively develop creative and effective project solutions. William F. Daniels, P.G. Mr. Daniels is a Senior Hydrogeologist with Services Environmental, Inc. He has a B.S. and M.S. in Geology, an M.Arch. in Architecture, and 14 years of experience in groundwater and environmental investigations. His expertise includes: surface water/groundwater analysis, data visualization, litigation support, and coastal and estuarine geology. Richard J. Passmore Mr. Passmore is a Project Manager with Glenn Springs Holdings, Inc. He has a B.S. in Chemical Engineering, and over ten years of experience in groundwater and environmental site investigation, and the design, construction, and operation of remedial actions. Services Environmental, Inc. Offices are located at: Services Environmental, Inc.
375 Morgan Street Phoenixville, PA, 19460. (610) 933-1900 [email protected]