Embed Size (px)
Citation preview

USING MATLAB FOR MATERIALS DESIGN:DESCRIBING GRAIN ORIENTATIONS IN METALSClaes Olsson, PhD - Docent / Sandvik Materials Technology

MATERIALS TECHNOLOGY
THE SANDVIK GROUP
MACHINING SOLUTIONS MINING AND CONSTRUCTION

SANDVIK MATERIALS TECHNOLOGYTHE STEEL RESEARCH CENTER IN SANDVIKEN
• ~ 230 staff
• ~ 900 different materials
• SteelsNi-baseZircaloyTitaniumPowder Metallurgy Thin Film Coatings...

ANALYTICAL TASK
4
• Zircaloy tubes are used for packaging nuclear fuel
• To prevent cracking, it is important to control grain orientation in the tube wall.
• Grain orientation is characterized with X-ray Diffraction
• Data evaluation, quantification and reporting is made with MATLAB + MTEX
• MTEX is an open source toolbox, developed by Prof. Dr. Ralf Hielscher et al.at TU-Chemnitz. It contains tools for handling material orientation data:
https://mtex-toolbox.github.io/

ZIRCALOYTUBING FOR NUCLEAR FUEL

CHARACTERISTICS
• Right in the reactor core
• Need a material with low neutron capture cross section, hence Zr-Nb alloys
• Good control of impurities
• High demands on the metallurgical process
• High demands on the rolling process
NUCLEAR FUEL RODS IN ZIRCALOY

ROLLING TUBES OF HEXAGONAL MATERIALS

TEXTURE MEASUREMENT WITH X-RAY DIFFRACTION (XRD) AND MATLAB

THE ORIENTATION DISTRIBUTION FUNCTION (ODF)
Orientation Distribution (Euler Angles)- Describes the orientation of all crystals in the sample- For a cubic system, a 90° x 90° x 90° space is sufficient
-��
�� � � �� � ��, Φ, �
����
������

X-Ray Diffraction Measures Lattice Spacing
ψ
2Θdhkl-planes
• Only crystals with the correct orientation fulfills the Bragg condition, i.e.∆k = G , alternatively
• Record the intensity of each diffraction peak in a 5°x 5° grid on the hemisphere above the sample.
� �2����
��

SPHERICAL PROJECTIONS

FAST DIFFRACTOGRAM RECORDING
New method: Extract intensities by curve fitting!
Old method: Measure intensity at three fixed angles to calculate the ODF.

SYNTHETIC LINE PROFILES – PSEUDO VOIGT
� 2� � ���� !"#$�
%"&'
�
(1 *
1 ( 42� * ,-
whereImax– peak heightp – peak positionw – full width at half maxm – Gauss / Lorentz mix2θ – Scale for the x-axis

MULTI-PEAK FITTING
No tilt –diffraction vector normal to sample surface.OK without fitting.
High tilt –diffraction vector grazing to sample surface.Peak fitting necessary!

MULTI-PEAK FITTING• Fix positions relative to each other• Same width for all peaks• Set the peak shape to Gaussian• Intensity is the only completely free
variable
Problem: Pass x fit variables and (n-x) fix variables to the solver.
Solution:- Create a peak shape function:
- Pass it to the solver (1 peak example): fitNdx = [1 2];fixNdx = [3 4];fixPrms = [0.9 1];fitPrms = [1000 43 0.9 1];
- Finally, re-create the parameter vector inside the peak shape function:
p(fitNdx) = fitPrms;p(fixNdx) = fixPrms;

SPHERICAL PROJECTIONS

MTEX CODE SAMPLE – PLOTTING
https://mtex-toolbox.github.io/
RD

MEASUREMENT - THEORY
Calculated From Measurements via the ODF
Rolling Direction
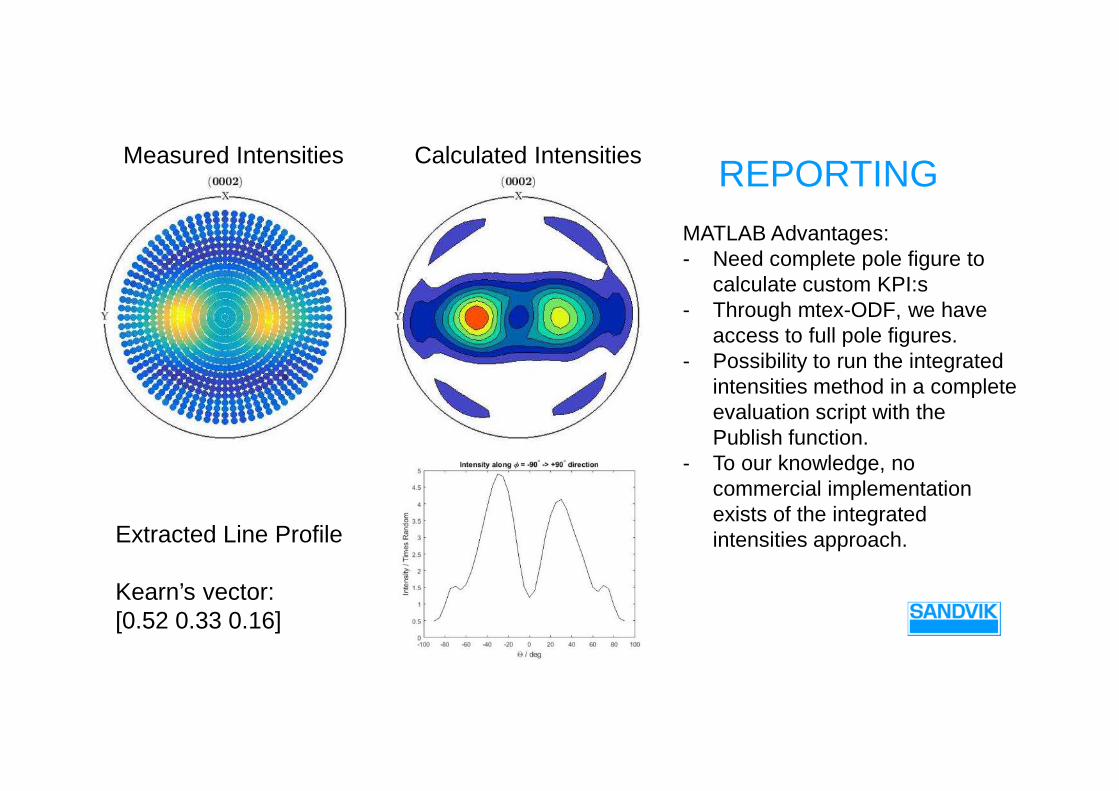
REPORTING
MATLAB Advantages:- Need complete pole figure to
calculate custom KPI:s- Through mtex-ODF, we have
access to full pole figures.- Possibility to run the integrated
intensities method in a complete evaluation script with the Publish function.
- To our knowledge, no commercial implementation exists of the integrated intensities approach.
Measured Intensities Calculated Intensities
Extracted Line Profile
Kearn’s vector:[0.52 0.33 0.16]

EBSDELECTRON BACKSCATTER DIFFRACTION

SCANNING ELECTRON MICROSCOPY -ELECTRON BACKSCATTER DIFFRACTION
Each pixel in the image is a Kikuchi pattern
Automatic indexing of each pixel
The indexing gives the orientation of the grain in each point
These orientations are then exported to MATLAB.

MATLAB EBSD MAPPING
Identify grains: Colorize pointwise by orientation
Colorize grains by orientation spread
rela
tive v
olu
me (
%)
Grain size histograms:

EXTRACT POLE FIGURES
Inte
nsity / T
ime
s R
an
do
m
EBSD compares well with XRD data, although XRD samples a much larger area
Bonuses: Lateral informationPossibility to extract information on individual grains

RECRYSTALLIZED FRACTION
A compound criterion for recrystallization:
(A > Acrit ) AND (GOS < GOScrit )
A = Grain AreaGOS = Grain Orientation Spread
The underlying gray scale is by bone-gray by grain size.
This type of combined evaluation criteria is very easily implemented in MATLAB.
In this case, RexFrac (yellow) = 35%

WHY MATLAB / MTEX?
• MTEX provides the Orientation Distribution Function
• Easier (and better) than coding the spherical harmonics approximation ourselves.
• MTEX User Community within the Sandvik Group
• Compared to vendor specific software:
• The integrated intensities method by curve fitting is not available commercially.
• Access to many mathematical and plotting tools within the environment.

CONCLUSIONS
• MATLAB / MTEX was used for
− Automated curve fitting, typically >10 000 fits / measurement
− Creating a custom script for calculating Key Performance Indicators for Zircaloy tubing.
− Scripted EBSD evaluation with complex criteria.


![Waterborne Epoxy Based Coating Materials · friendly coatings like powder coatings, solventless coatings, UV curable coatings and waterborne coatings [6]. The first step in this process](https://img.pdfslide.net/doc/110x75/600912c2a8aea319421a2c7d/waterborne-epoxy-based-coating-materials-friendly-coatings-like-powder-coatings.jpg)