Embed Size (px)
Citation preview

INTERNATIONAL CONFERENCE ON ENGINEERING DESIGN, ICED’07 28 - 31 AUGUST 2007, CITE DES SCIENCES ET DE L'INDUSTRIE, PARIS, FRANCE
USING META-DATA TO ENHANCE PROCESS SIMULATION AND IDENTIFY IMPROVEMENTS Chris Bell1, David C Wynn1, William N Dawes2 and P John Clarkson1 1Engineering Design Centre & 2CFD Laboratory, Department of Engineering University of Cambridge, Trumpington Street, Cambridge, CB2 1PZ, UK.
ABSTRACT Process modelling can play an important part in understanding and improving engineering design processes. Meta-data, i.e., numerical information describing the state of a process, can be used to enhance modelling fidelity and to measure predicted behaviour. We explore the application of meta-data using a proxy process represented using an Applied Signposting Model. The proxy has been derived from a model of the turbine cooling system design process. We argue that meta-data can be used to control the flow of the modelled process, to couple the behaviour of concurrent sub-processes and to provide quantitative feedback about the process behaviour. We also show that alternative process configurations can be developed to deliver improved performance within the same structure of activities and information flow, and use simulation results to identify such configurations.
Keywords: Process modelling, Meta-data, Applied Signposting Model
1 INTRODUCTION The design of many high-performance engineered components is based on the iterative application of specialised computer tools. The performance of the design process depends both upon tools and the manner in which they are applied. The improvement of such processes often focuses on enhancing individual tools, design activities and the connections between them. This is expensive, and in many cases there are diminishing returns available. In this paper, we aim to identify a means to more effectively utilise existing design technology to improve process performance. Many authors argue that simulation can be useful to identify improved design process configurations [1]. In this paper, we argue that process “meta-data” may be modelled to improve the fidelity of simulation models, and thereby support such activities. The work is developed from a study of the turbine blade cooling design process and is illustrated using a representative proxy process. The paper proceeds in five sections. Firstly, existing literature is briefly discussed and the concept of process meta-data is introduced. Secondly, the process modelling and simulation methodology we use to represent meta-data is reviewed. Thirdly, the case study is discussed and key findings regarding meta-data modelling are highlighted. As the model developed during the case study is too complex for methods development, the proposed approach is illustrated in the fourth section by application to a proxy model, which is analysed to identify improved and alternative configurations. Finally, the findings, limitations and opportunities for further research are discussed.
2 MOTIVATION Simulation-based approaches for exploring alternative design process configurations are based upon the assumption that process behaviour is reflected in the simulation model. Many such approaches have been proposed in the literature, based upon task precedence models such as GERT [2], task dependency models such as the Dependency Structure Matrix (DSM) [3, 4] and dynamic task models such as the Adaptive Test Process [5] and Signposting [6]. A necessary element in all design process models is accounting for the iteration that is key to designing. As the decisions governing iterative behaviour are difficult to explicitly represent, they are often modelled using a process of stochastic task selection. However, whilst task behaviour within a process often does contain a stochastic element, many choices are actively guided by the process participants [7].
ICED’07/563 1

This paper proposes that such guidance and control may be explicitly incorporated into a simulation model by assuming that decisions are based upon the consideration of “meta-data” at the point they are made. In this context, meta-data is defined as “an abstract representation of the state of the process and/or design”. Three questions arise from this proposal: 1. How can meta-data be incorporated in a process simulation model? 2. What meta-data should be modelled to represent process dynamics? 3. How can alternative process configurations that deliver better performance be identified? These questions will be explored in sections 3, 4 and 5 respectively.
3 INCORPORATING META-DATA IN A PROCESS SIMULATION MODEL In this section, we show how process meta-data can be represented using the Applied Signposting Model (ASM) [8]. This task-based process modelling framework was chosen as the basis for this research because it allows flexible representation of process behaviour, and is implemented in a freely available simulation tool [9].
3.1 Overview of the ASM model ASM process models are constructed from tasks, representing design activities, and parameters, representing aspects of the design that change during the process. Three classes of task are provided: • Simple tasks comprise one input and one output scenario. • Compound tasks represent branching choices, between multiple output scenarios. • Iteration tasks are special cases of the compound task, which contain continue and iterate again
scenarios only. They are used to control the termination of an iterative refinement cycle. In this context, a scenario represents a set of interactions with the design parameters. Interactions may have a textual qualifier indicating the value of the parameter in that context. For example, an input interaction to an analysis task represents the parameter “configuration” with the qualifier “pre-analysis”; when the task is completed the qualifier is changed to “verified”. A key benefit of the task-parameter model is that it requires consideration of how as well as which tasks are connected. This assists in building accurate process representations. For example, if two tasks in the model are sequential but their coupling is based on apparently mismatched parameters and/or qualifiers, it may be inferred that the tasks have not been adequately conceptualised or that intermediate activities have not yet been represented. Modelling can also help identify redundant process steps, i.e., those that do not connect or add value to the process as expected. Tasks can be grouped into sub-processes, which can in turn be composed into hierarchies and re-used in different contexts through the model. Tasks have various additional properties, including a probability distribution that describes their duration and the resources required to execute.
3.2 Simulating the design process based on an ASM model The ASM is implemented in a software tool called “P3 Signposting” which provides a discrete-event Monte-Carlo simulation algorithm based upon an extended Petri Net formalism [10]. In this algorithm, each task commences when all necessary parameters are made available by the execution of the upstream tasks. Where tasks have more than one output scenario, the selected route can be controlled by stochastic selection or by evaluating specified functions (see below). When many tasks have sufficient information to begin, but resource constraints prevent parallel execution, an algorithmic task selection policy is used to identify the task that will be attempted first. Example policies include “Minimum duration first” or ”Random selection”. Each simulation leaves a results record, which can be post-processed to obtain information about the process history and final results. This record forms the basis of the analysis presented in forthcoming sections
3.3 Using process variables to describe meta-data ASM models may include process variables, i.e., user-defined numeric values that can be used to customise the process simulation. The executing ASM simulation ‘pushes’ process variable data between tasks, which can modify and respond to the data. The ASM can thus be viewed as a programmable system. Process variables provide an ideal mechanism to represent the meta-data discussed in this paper, as they can be used to control task durations and selection probability and can record a time-history of the process state.
ICED’07/563 2
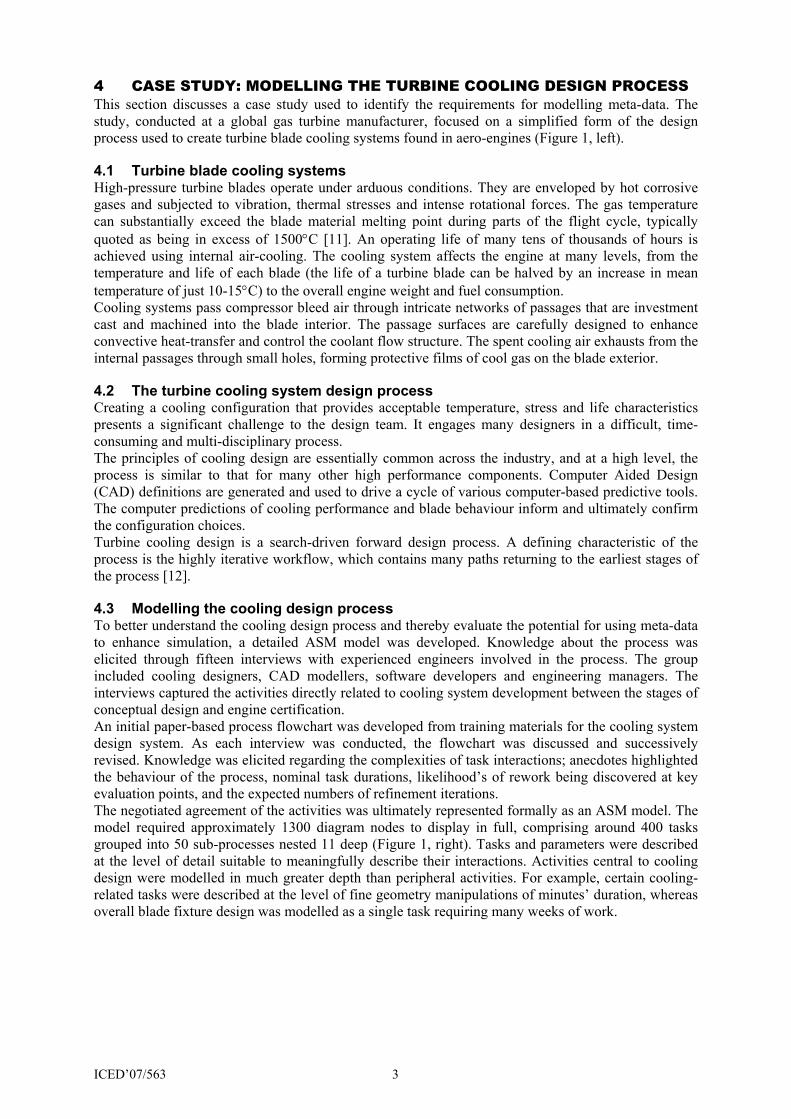
4 CASE STUDY: MODELLING THE TURBINE COOLING DESIGN PROCESS This section discusses a case study used to identify the requirements for modelling meta-data. The study, conducted at a global gas turbine manufacturer, focused on a simplified form of the design process used to create turbine blade cooling systems found in aero-engines (Figure 1, left).
4.1 Turbine blade cooling systems High-pressure turbine blades operate under arduous conditions. They are enveloped by hot corrosive gases and subjected to vibration, thermal stresses and intense rotational forces. The gas temperature can substantially exceed the blade material melting point during parts of the flight cycle, typically quoted as being in excess of 1500°C [11]. An operating life of many tens of thousands of hours is achieved using internal air-cooling. The cooling system affects the engine at many levels, from the temperature and life of each blade (the life of a turbine blade can be halved by an increase in mean temperature of just 10-15°C) to the overall engine weight and fuel consumption. Cooling systems pass compressor bleed air through intricate networks of passages that are investment cast and machined into the blade interior. The passage surfaces are carefully designed to enhance convective heat-transfer and control the coolant flow structure. The spent cooling air exhausts from the internal passages through small holes, forming protective films of cool gas on the blade exterior.
4.2 The turbine cooling system design process Creating a cooling configuration that provides acceptable temperature, stress and life characteristics presents a significant challenge to the design team. It engages many designers in a difficult, time-consuming and multi-disciplinary process. The principles of cooling design are essentially common across the industry, and at a high level, the process is similar to that for many other high performance components. Computer Aided Design (CAD) definitions are generated and used to drive a cycle of various computer-based predictive tools. The computer predictions of cooling performance and blade behaviour inform and ultimately confirm the configuration choices. Turbine cooling design is a search-driven forward design process. A defining characteristic of the process is the highly iterative workflow, which contains many paths returning to the earliest stages of the process [12].
4.3 Modelling the cooling design process To better understand the cooling design process and thereby evaluate the potential for using meta-data to enhance simulation, a detailed ASM model was developed. Knowledge about the process was elicited through fifteen interviews with experienced engineers involved in the process. The group included cooling designers, CAD modellers, software developers and engineering managers. The interviews captured the activities directly related to cooling system development between the stages of conceptual design and engine certification. An initial paper-based process flowchart was developed from training materials for the cooling system design system. As each interview was conducted, the flowchart was discussed and successively revised. Knowledge was elicited regarding the complexities of task interactions; anecdotes highlighted the behaviour of the process, nominal task durations, likelihood’s of rework being discovered at key evaluation points, and the expected numbers of refinement iterations. The negotiated agreement of the activities was ultimately represented formally as an ASM model. The model required approximately 1300 diagram nodes to display in full, comprising around 400 tasks grouped into 50 sub-processes nested 11 deep (Figure 1, right). Tasks and parameters were described at the level of detail suitable to meaningfully describe their interactions. Activities central to cooling design were modelled in much greater depth than peripheral activities. For example, certain cooling-related tasks were described at the level of fine geometry manipulations of minutes’ duration, whereas overall blade fixture design was modelled as a single task requiring many weeks of work.
ICED’07/563 3

Figure 1. A turbine blade showing its cooling system (left) and an ASM model of the
cooling system design process, progressively revealing sub-processes (right)
4.4 Key findings of the case study The case study revealed a number of key findings: • The cooling design process is based on repeated application of computer tools, which exchange
data in specific formats. The ASM model developed during the case study revealed a complex network of tasks with many instances of nested iteration loops, task concurrency and branching between possible choices.
• Although the process may be represented as a task network, there are tacit interactions between tasks that are not easily represented in terms of direct parameter dependencies. Decisions made in each design activity may affect later activities and decisions.
• Within the process, certain sub-processes are re-applied in multiple contexts. Although their structure does not change, the design goals and emphasis of work reflect the stage of the broader design process. Some were goal-driven, indicating that a simulation model should account for the effect of the current state of the process (e.g., knowledge gained, time remaining etc.) upon process decisions. A meta-data controlled simulation is one way to capture these effects.
• One collection of sub-processes stands out because of the level of re-use throughout the overall process; these are the activities used to define CAD models representing 2D planar sections through the cooled blade and the creation of models for thermal and operating life predictions.
In summary, the case study and the detailed process model discussed above provided the insight necessary to develop a suitably simplified model for developing the meta-data modelling concept. The aim is to develop an approach suitable to represent the dynamics of similar design-by-refinement processes.
5 PROCESS SIMULATION USING META-DATA In this section a proxy process model which uses meta-data based simulation is developed and analysed to show how improved configurations may be identified. The structure of the proxy process draws on the sub-process used in designing and analysing the 2D sections. The proxy process contained key elements identified in the case study process: nested iterations, branching and task concurrency. The following key behaviours were also reproduced: tacit task interconnection, state-dependent choice making and the achievement of goals controlling process termination. Although the proxy uses fewer tasks than the case study model in section 6 we argue that it encompasses and demonstrates all of the aspects necessary for developing an approach scalable to larger and more complex models.
ICED’07/563 4
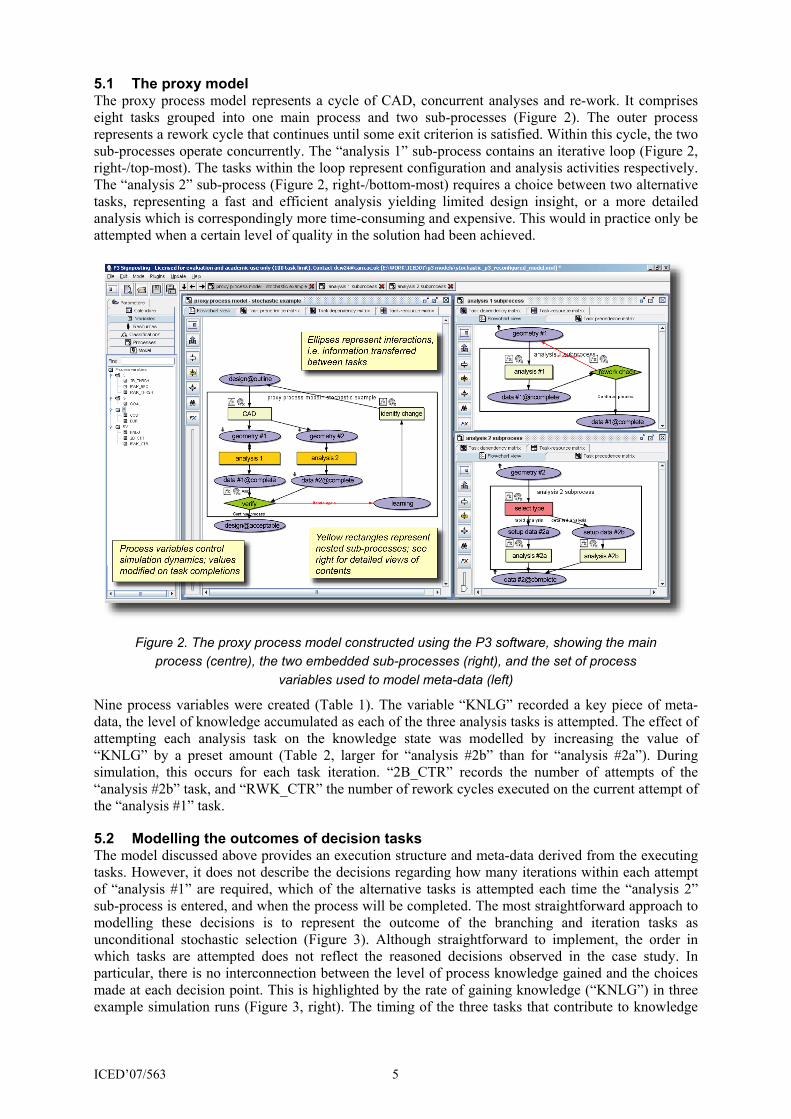
5.1 The proxy model The proxy process model represents a cycle of CAD, concurrent analyses and re-work. It comprises eight tasks grouped into one main process and two sub-processes (Figure 2). The outer process represents a rework cycle that continues until some exit criterion is satisfied. Within this cycle, the two sub-processes operate concurrently. The “analysis 1” sub-process contains an iterative loop (Figure 2, right-/top-most). The tasks within the loop represent configuration and analysis activities respectively. The “analysis 2” sub-process (Figure 2, right-/bottom-most) requires a choice between two alternative tasks, representing a fast and efficient analysis yielding limited design insight, or a more detailed analysis which is correspondingly more time-consuming and expensive. This would in practice only be attempted when a certain level of quality in the solution had been achieved.
Figure 2. The proxy process model constructed using the P3 software, showing the main
process (centre), the two embedded sub-processes (right), and the set of process variables used to model meta-data (left)
Nine process variables were created (Table 1). The variable “KNLG” recorded a key piece of meta-data, the level of knowledge accumulated as each of the three analysis tasks is attempted. The effect of attempting each analysis task on the knowledge state was modelled by increasing the value of “KNLG” by a preset amount (Table 2, larger for “analysis #2b” than for “analysis #2a”). During simulation, this occurs for each task iteration. “2B_CTR” records the number of attempts of the “analysis #2b” task, and “RWK_CTR” the number of rework cycles executed on the current attempt of the “analysis #1” task.
5.2 Modelling the outcomes of decision tasks The model discussed above provides an execution structure and meta-data derived from the executing tasks. However, it does not describe the decisions regarding how many iterations within each attempt of “analysis #1” are required, which of the alternative tasks is attempted each time the “analysis 2” sub-process is entered, and when the process will be completed. The most straightforward approach to modelling these decisions is to represent the outcome of the branching and iteration tasks as unconditional stochastic selection (Figure 3). Although straightforward to implement, the order in which tasks are attempted does not reflect the reasoned decisions observed in the case study. In particular, there is no interconnection between the level of process knowledge gained and the choices made at each decision point. This is highlighted by the rate of gaining knowledge (“KNLG”) in three example simulation runs (Figure 3, right). The timing of the three tasks that contribute to knowledge
ICED’07/563 5
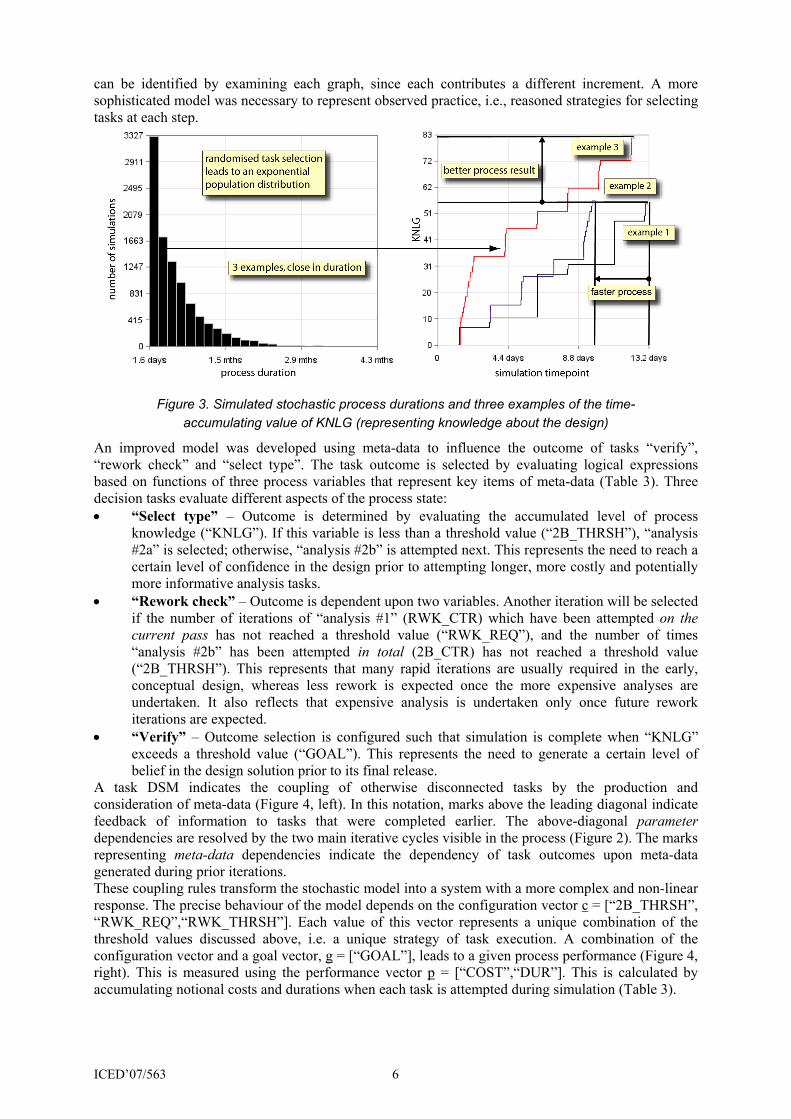
can be identified by examining each graph, since each contributes a different increment. A more sophisticated model was necessary to represent observed practice, i.e., reasoned strategies for selecting tasks at each step.
Figure 3. Simulated stochastic process durations and three examples of the time-
accumulating value of KNLG (representing knowledge about the design)
An improved model was developed using meta-data to influence the outcome of tasks “verify”, “rework check” and “select type”. The task outcome is selected by evaluating logical expressions based on functions of three process variables that represent key items of meta-data (Table 3). Three decision tasks evaluate different aspects of the process state: • “Select type” – Outcome is determined by evaluating the accumulated level of process
knowledge (“KNLG”). If this variable is less than a threshold value (“2B_THRSH”), “analysis #2a” is selected; otherwise, “analysis #2b” is attempted next. This represents the need to reach a certain level of confidence in the design prior to attempting longer, more costly and potentially more informative analysis tasks.
• “Rework check” – Outcome is dependent upon two variables. Another iteration will be selected if the number of iterations of “analysis #1” (RWK_CTR) which have been attempted on the current pass has not reached a threshold value (“RWK_REQ”), and the number of times “analysis #2b” has been attempted in total (2B_CTR) has not reached a threshold value (“2B_THRSH”). This represents that many rapid iterations are usually required in the early, conceptual design, whereas less rework is expected once the more expensive analyses are undertaken. It also reflects that expensive analysis is undertaken only once future rework iterations are expected.
• “Verify” – Outcome selection is configured such that simulation is complete when “KNLG” exceeds a threshold value (“GOAL”). This represents the need to generate a certain level of belief in the design solution prior to its final release.
A task DSM indicates the coupling of otherwise disconnected tasks by the production and consideration of meta-data (Figure 4, left). In this notation, marks above the leading diagonal indicate feedback of information to tasks that were completed earlier. The above-diagonal parameter dependencies are resolved by the two main iterative cycles visible in the process (Figure 2). The marks representing meta-data dependencies indicate the dependency of task outcomes upon meta-data generated during prior iterations. These coupling rules transform the stochastic model into a system with a more complex and non-linear response. The precise behaviour of the model depends on the configuration vector c = [“2B_THRSH”, “RWK_REQ”,“RWK_THRSH”]. Each value of this vector represents a unique combination of the threshold values discussed above, i.e. a unique strategy of task execution. A combination of the configuration vector and a goal vector, g = [“GOAL”], leads to a given process performance (Figure 4, right). This is measured using the performance vector p = [“COST”,“DUR”]. This is calculated by accumulating notional costs and durations when each task is attempted during simulation (Table 3).
ICED’07/563 6
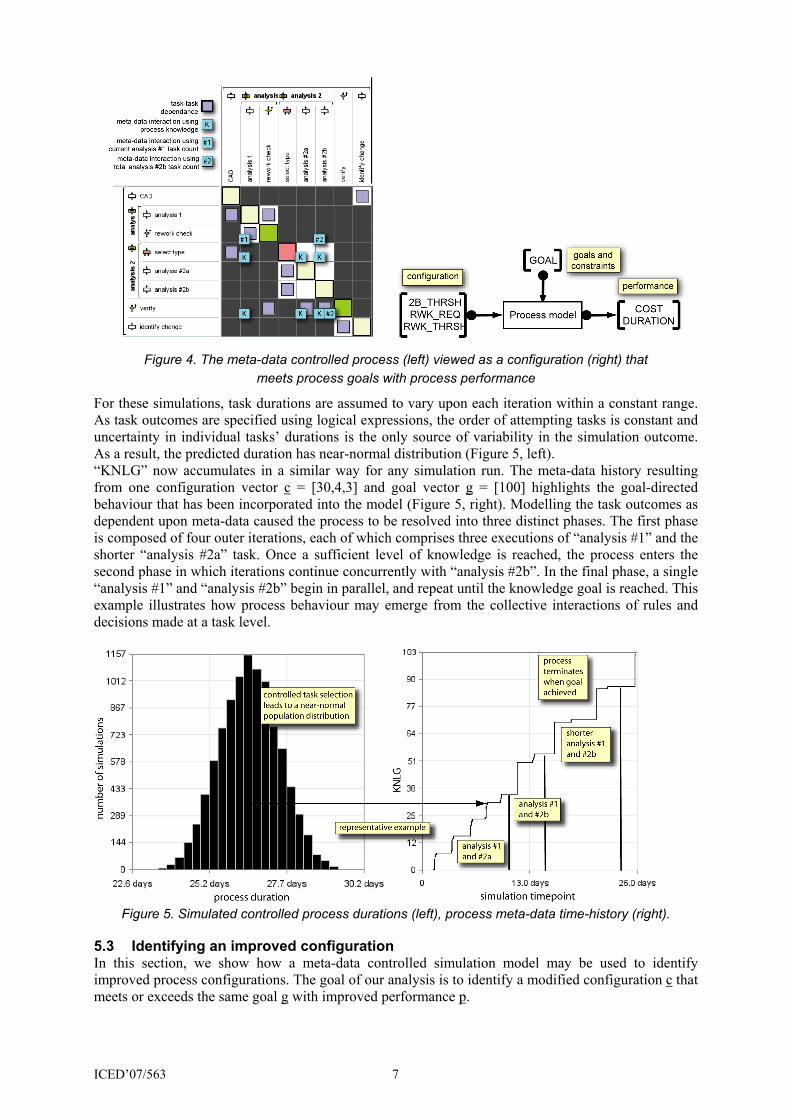
Figure 4. The meta-data controlled process (left) viewed as a configuration (right) that
meets process goals with process performance
For these simulations, task durations are assumed to vary upon each iteration within a constant range. As task outcomes are specified using logical expressions, the order of attempting tasks is constant and uncertainty in individual tasks’ durations is the only source of variability in the simulation outcome. As a result, the predicted duration has near-normal distribution (Figure 5, left). “KNLG” now accumulates in a similar way for any simulation run. The meta-data history resulting from one configuration vector c = [30,4,3] and goal vector g = [100] highlights the goal-directed behaviour that has been incorporated into the model (Figure 5, right). Modelling the task outcomes as dependent upon meta-data caused the process to be resolved into three distinct phases. The first phase is composed of four outer iterations, each of which comprises three executions of “analysis #1” and the shorter “analysis #2a” task. Once a sufficient level of knowledge is reached, the process enters the second phase in which iterations continue concurrently with “analysis #2b”. In the final phase, a single “analysis #1” and “analysis #2b” begin in parallel, and repeat until the knowledge goal is reached. This example illustrates how process behaviour may emerge from the collective interactions of rules and decisions made at a task level.
Figure 5. Simulated controlled process durations (left), process meta-data time-history (right).
5.3 Identifying an improved configuration In this section, we show how a meta-data controlled simulation model may be used to identify improved process configurations. The goal of our analysis is to identify a modified configuration c that meets or exceeds the same goal g with improved performance p.
ICED’07/563 7
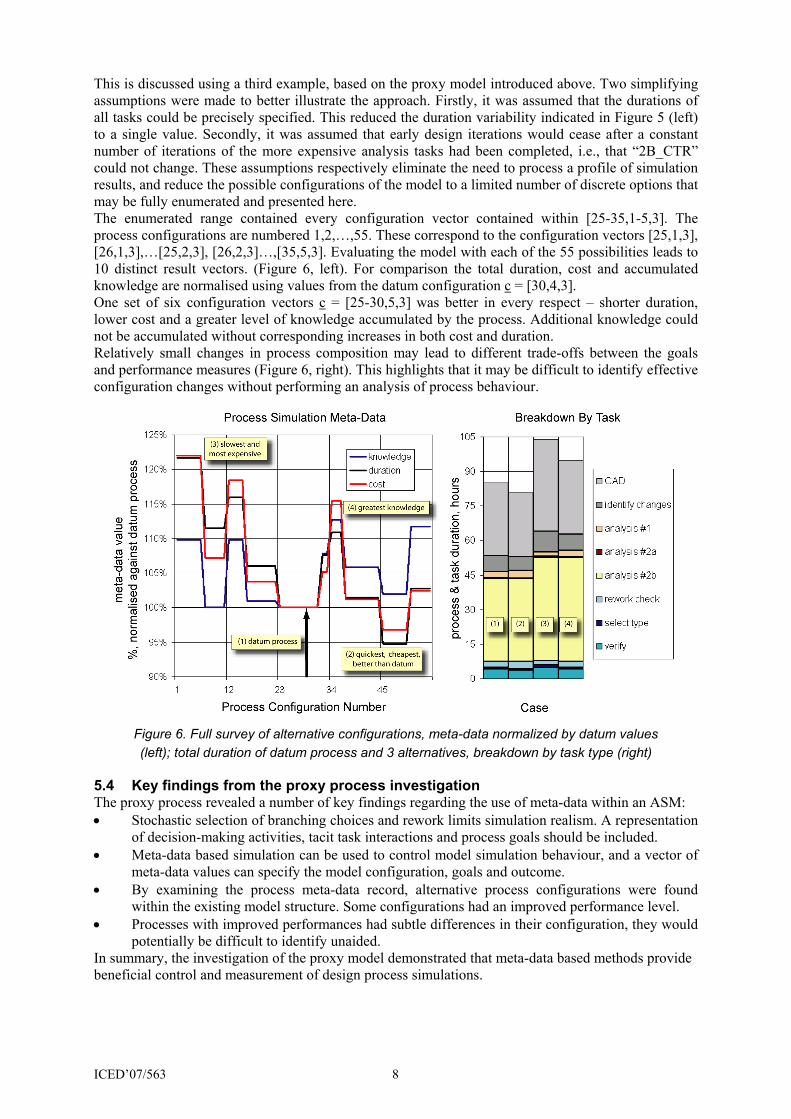
This is discussed using a third example, based on the proxy model introduced above. Two simplifying assumptions were made to better illustrate the approach. Firstly, it was assumed that the durations of all tasks could be precisely specified. This reduced the duration variability indicated in Figure 5 (left) to a single value. Secondly, it was assumed that early design iterations would cease after a constant number of iterations of the more expensive analysis tasks had been completed, i.e., that “2B_CTR” could not change. These assumptions respectively eliminate the need to process a profile of simulation results, and reduce the possible configurations of the model to a limited number of discrete options that may be fully enumerated and presented here. The enumerated range contained every configuration vector contained within [25-35,1-5,3]. The process configurations are numbered 1,2,…,55. These correspond to the configuration vectors [25,1,3], [26,1,3],…[25,2,3], [26,2,3]…,[35,5,3]. Evaluating the model with each of the 55 possibilities leads to 10 distinct result vectors. (Figure 6, left). For comparison the total duration, cost and accumulated knowledge are normalised using values from the datum configuration c = [30,4,3]. One set of six configuration vectors c = [25-30,5,3] was better in every respect – shorter duration, lower cost and a greater level of knowledge accumulated by the process. Additional knowledge could not be accumulated without corresponding increases in both cost and duration. Relatively small changes in process composition may lead to different trade-offs between the goals and performance measures (Figure 6, right). This highlights that it may be difficult to identify effective configuration changes without performing an analysis of process behaviour.
Figure 6. Full survey of alternative configurations, meta-data normalized by datum values (left); total duration of datum process and 3 alternatives, breakdown by task type (right)
5.4 Key findings from the proxy process investigation The proxy process revealed a number of key findings regarding the use of meta-data within an ASM: • Stochastic selection of branching choices and rework limits simulation realism. A representation
of decision-making activities, tacit task interactions and process goals should be included. • Meta-data based simulation can be used to control model simulation behaviour, and a vector of
meta-data values can specify the model configuration, goals and outcome. • By examining the process meta-data record, alternative process configurations were found
within the existing model structure. Some configurations had an improved performance level. • Processes with improved performances had subtle differences in their configuration, they would
potentially be difficult to identify unaided. In summary, the investigation of the proxy model demonstrated that meta-data based methods provide beneficial control and measurement of design process simulations.
ICED’07/563 8
6 DISCUSSION AND FURTHER WORK In this section, we argue that the meta-data approach may be extended to enhance component design processes of the type discussed in section 4. Three points support this: • Scalability. The meta-data controls and transforms may be applied on a task-by-task basis. • Flexibility. Many desired behaviours may be represented if suitable meta-data, process
variables and transforms are identified. • Multiple parameterisations. The different instances of particular sub-processes can be given
different controlling thresholds and goals, reflecting changing conditions and requirements throughout the stages of a process.
Since the analysis presented above has focused on a simplified example model, application of the meta-data modelling approach to more realistic models requires additional issues to be addressed. Further work should therefore include: • Methods for identifying rules. The response of the process model is critically dependent upon
the rules governing behaviour of individual tasks. In practice, a method is needed to develop and validate these rules. This may be difficult as sub-process behaviour was observed to depend upon the context of application. The complex behaviour emergent from the simulation of a large process will require verification. One possible solution is to compare predicted process performance and sub-process calendar dates against historical data (e.g., milestone dates from Gantt charts). Such verification may prove difficult if the overall process is not well understood, or if documentation has insufficient resolution.
• Incorporating uncertainty. The proxy model was constructed with no variability in outcomes, as this significantly simplified the analysis. However, in practice process behaviour is based upon situated responses to unexpected and unpredictable events. It is therefore desirable to incorporate sources of uncertainty such as the outcome of evaluation activities and the durations of individual tasks.
• Application of optimisation methods. The proxy model used discrete data values and permitted a full enumeration of all possible configurations. However, more complex models incorporating uncertainty would require numerical optimisation techniques to identify improved configurations. A Hooke and Jeeves based algorithm [13] would provide an appropriate starting point to investigate this. Further research is necessary to explore this possibility.
7 CONCLUSIONS This paper has argued that decisions within component design processes are influenced by consideration of meta-data, i.e., the state of the process at which the decision is made. It was shown that meta-data can be incorporated in a simulation model based on the Applied Signposting modelling methodology, and argued that this may be used to enhance the fidelity of such models and thereby improve their utility to support process improvement. The proposed approach was illustrated by developing a proxy model based on an observed industry process. Although relatively simple in structure, the performance of the proxy process was shown to be sensitive to the strategy for executing tasks. The results suggest that optimisation techniques may ultimately be applied to meta-data controlled models to identify process configurations that deliver improved configurations within an existing framework of activities. In summary: • Process meta-data can be modelled and may improve the fidelity of process simulation models. • ASM process variables provide an effective means of achieving this goal. • Such models can be analysed to identify improved process configurations; further work is
necessary to explore this.
ACKNOWLEDGMENTS The support of Rolls-Royce plc and Dr Simon Gallimore is gratefully acknowledged.
ICED’07/563 9
REFERENCES [1] Browning T.R., Fricke E. and Negele H. Key Concepts in Modelling Product Development
Processes. In Systems Engineering, 2006, 9(2), 104-128. [2] Pritzker A.A.B. GERT: Graphical Evaluation and Review Technique. The RAND Corporation,
Memorandum RM-4973-NASA, 1966. [3] Steward, D.V. “The Design Structure Matrix: A method for managing the design of complex
systems”, Engineering Management, IEEE Transactions on, 1981, EM-28(3), pp.71-74. [4] Eppinger, S., Whitney, D., Smith, R. and Gebala, D. “A model-based method for organizing
tasks in product development”, Research in Engineering Design, 1994, 6, pp. 1-13. [5] Levardy V. and Browning T.R. Adaptive test process – Designing a project plan that adapts to
the state of a project. In International Council on Systems Engineering, INCOSE 2005, Rochester, NY, July 2005.
[6] Clarkson P.J. and Hamilton J.R. Signposting, a parameter-driven task-based model of the design process. Research in Engineering Design. 2001, 12(1), 18-38.
[7] Carrascosa M., Eppinger S.D. and Whitney D. Using the design structure matrix to estimate product development time. In Proceedings of ASME Design Engineering Technical Conferences, Atlanta, 1998.
[8] Wynn D.C., Eckert C.M. and Clarkson P.J. Applied Signposting: A modeling framework to support design process improvement. In Proceedings of IDETC/CIE ASME 2006 International Design Engineering Technical Conference and Computers and Information in Engineering Conference, Pennsylvania, September 2006.
[9] P3 Signposting software - http://www-edc.eng.cam.ac.uk/p3 [10] Murata T. Petri Nets: Properties, Analysis and Applications. In Proceedings of the IEEE. 1989,
77(4), 541-580. [11] Han J.C., Dutta S. and Ekkad S.V. Gas Turbine Heat Transfer and Cooling Technology, 2000
(Taylor and Francis, London). [12] Bell C.P., Jarrett J.P., Clarkson P.J. and Dawes W.N. Improving the conceptual design of
turbine rotor blade cooling systems. In 15th International Conference on Engineering Design, ICED’05, Melbourne, August 2005, 421-431.
[13] Hooke R. and Jeeves T.A. “Direct Search” Solution of Numerical and Statistical Problems. In Journal of the ACM. 1961, 8(2), 212-229.
Contact: C. P. Bell Engineering Design Centre, Department of Engineering, University of Cambridge, Trumpington Street, Cambridge, CB2 1PZ United Kingdom +44-1223- 332742 [email protected] http://www-edc.eng.cam.ac.uk/people/cpb42.html
ICED’07/563 10

APPENDIX – PROCESS MODEL SETUP DATA
Table 1. Process variables used to instrument the simulation model
Configuration c Goal g Performance p Simulation variables 2B_THRSH GOAL COST KNLG
RWK_REQ DUR 2B_CTR
RWK_THRSH RWK_CTR
Table 2. Properties of tasks in the stochastic simulation model
Task Cost (notional)
Transform DUR (days)
Outcome Probability
CAD 400 - 4 days -
identify change
100 - 1 day -
analysis #1 20 KNLG + 1 RWK_CTR + 1
0.1 day -
rework check
20 - 0.1 day SELECT “analysis #1” – 70% SELECT “verify” – 30%
select type 50 - 0.1 day SELECT “analysis #2a” - 80% SELECT “analysis #2b” – 20%
analysis #2a 20 KNLG + 4 0.1 day -
analysis #2b 3000 KNLG + 15 2B_CTR + 1
9 days -
verify 300 RWK_CTR = 0 0.5 day SELECT “identify changes” – 85% FINISH – 15%
Table 3. Properties of tasks in the controlled model
Task Cost (notional)
Transform duration (days)
Outcome Selection Rule
CAD 400 - 3-5 (Uniform PDF)
-
identify change
100 - 0.5-1.5 (Uniform PDF)
-
analysis #1 20 KNLG + 1 RWK_CTR + 1
0.1-0.15-0.2 (Triangular PDF)
-
rework check
20 - 0.1 day IF (RWK_CTR= < RWK_REQ) AND
(2B_CTR > RWK_THRSH) SELECT “analysis #1”
ELSE SELECT “verify”
select type 50 - 0.1 day IF (KNLG < 2B_THRSH) SELECT “analysis #2a”
ELSE SELECT “analysis_#2b”
analysis #2a 20 KNLG + 4 0.1-0.15-0.2 (Triangular PDF)
-
analysis #2b 3000 KNLG + 15 2B_CTR + 1
6-10 (Uniform PDF)
-
verify 300 RWK_CTR = 0 0.5 day IF (KNLG < GOAL) SELECT “identify change”
ELSE FINISH
ICED’07/563 11