Embed Size (px)
Citation preview
Using Mobile Phone Barometer for Low-Power TransportationContext Detection
Kartik Sankaran†, Minhui Zhu†, Xiang Fa Guo†, Akkihebbal L. Ananda†,Mun Choon Chan†, and Li-Shiuan Peh‡
†School of Computing, National University of Singapore‡Dept. of EECS, Massachusetts Institute of Technology
†{kartiks,zhuminh,xiangfa,ananda,chanmc}@comp.nus.edu.sg, ‡[email protected]
AbstractAccelerometer is the predominant sensor used for low-
power context detection on smartphones. Although low-power, accelerometer is orientation and position-dependent,requires a high sampling rate, and subsequently complexprocessing and training to achieve good accuracy. Wepresent an alternative approach for context detection usingonly the smartphone’s barometer, a relatively new sensornow present in an increasing number of devices. The barom-eter is independent of phone position and orientation. Us-ing a low sampling rate of 1 Hz, and simple processingbased on intuitive logic, we demonstrate that it is possi-ble to use the barometer for detecting the basic user activ-ities of IDLE, WALKING, and VEHICLE at extremely low-power. We evaluate our approach using 47 hours of real-world transportation traces from 3 countries and 13 individ-uals, as well as more than 900 km of elevation data pulledfrom Google Maps from 5 cities, comparing power andaccuracy to Google’s accelerometer-based Activity Recog-nition algorithm, and to Future Urban Mobility Survey’s(FMS) GPS-accelerometer server-based application. Ourbarometer-based approach uses 32 mW lower power com-pared to Google, and has comparable accuracy to bothGoogle and FMS. This is the first paper that uses only thebarometer for context detection.
Categories and Subject DescriptorsI.5.4 [Pattern Recognition]: Applications—Signal pro-
cessing
General TermsAlgorithms, Experimentation
KeywordsContext detection; Mobile sensing; Barometer
Permission to make digital or hard copies of all or part of this work for personal orclassroom use is granted without fee provided that copies are not made or distributedfor profit or commercial advantage and that copies bear this notice and the full citationon the first page. Copyrights for components of this work owned by others thanACM must be honored. Abstracting with credit is permitted. To copy otherwise,or republish, to post on servers or to redistribute to lists, requires prior specificpermission and/or a fee. Request permissions from [email protected].
SenSys’14, November 3–6, 2014, Memphis, TN, USA.Copyright is held by the owner/author(s). Publication rights licenced to ACM.ACM 978-1-4503-3143-2/14/11 ...$15.00http://dx.doi.org/10.1145/2668332.2668343
1 IntroductionWith smartphones now reaching the computational power
of personal computers, they are expected to behave intel-ligently: they should silently understand what the user isdoing, help in ongoing or future tasks, and adapt accord-ingly. Google Now (July 2012) and Siri (Oct 2011), for ex-ample, behave as intelligent personal assistants. Cover [1],an Android application released in Oct 2013, automaticallyadapts the applications displayed on the lockscreen based onwhether the user is at home/work/travelling. Google utilizesthe user’s activity and movement to improve the quality oflocation readings [2].
A key ingredient of such intelligent smartphone behaviouris context-awareness. The phone needs to continuously un-derstand what the user is doing. Context is typically de-rived from the multitude of sensors on the phone. Since thephone’s battery life-time is critical, context-detection algo-rithms must run at extremely low-power. In this regard, Ap-ple and Google have taken the first steps forward to reducingpower consumed for walking and step detection, by intro-ducing the M7 co-processor [3] (Sept 2013) and step counter[4] (Oct 2013) to offload sensor processing from the mainCPU when the phone is asleep.
Transportation-mode detection is a special case ofcontext-awareness where the phone automatically under-stands the user’s daily commute. Such awareness is im-mensely useful for maintaining activity diaries, conductingsurveys, and urban planning. For example, Moves [5], thefirst to make use of Google’s Activity Recognition API [6],is a popular application that maintains an activity diary forthe user, and was featured in the Google I/O session in May2013 when the API was introduced.
Being one of the lowest-power sensors available on thephone, accelerometer is the predominantly used sensor intransportation-mode detection [7]. It can detect accelerationin the phone’s 3 axial directions. Using supervised machinelearning and features extracted from the accelerometer read-ings, user activity can be classified as IDLE, WALKING orVEHICLE.
Although accelerometer is low-power, its readings arephone orientation and position-dependent, as well as userand vehicle-dependent. The machine learning algorithmneeds to be trained for all these different possibilities. To de-tect walking and vehicle activities accurately, sampling rate
is typically 10 Hz and above. The high sampling rate, 3 axialdirections, and position dependence make the classificationcomplicated and increases power consumption (Section 6.4).
In this paper, we present an alternative approach tocontext-detection using only the barometer, a sensor nowfound in an increasing number of devices today1, which mea-sures air pressure. Pressure can in turn be translated to alti-tude (height). Barometers were initially introduced on An-droid phones to reduce the delay of the GPS fix by providingthe z co-ordinate (altitude). Since the MEMS sensor is sensi-tive enough to measure even a 1 metre change in height, theyare also used for floor-change detection, and can differentiatebetween travelling on stairs/elevator. Some applications areattempting to crowd-source pressure data for weather fore-casting [8, 9]. Fitness applications use change in height tobetter estimate calorie consumption.
We present the first paper that uses only the barometerfor transportation context-detection. The barometer is in-herently orientation and position-independent. Using a lowsampling rate of 1 Hz, coupled with the new sensor-batchinghardware, and using relatively simple processing based onintuitive logic, we demonstrate that the barometer can beused for basic context detection of the user activities IDLE,WALKING, and VEHICLE at extremely low power. Thesestates are sufficient to characterise typical transportation con-text, and can act as a trigger for other higher-power finer-granularity classification of vehicular modes.
We evaluate our approach using 47 hours of transporta-tion traces from 3 countries and 13 individuals. We com-pare the accuracy and power consumption to two other ap-proaches: Google’s accelerometer-based Activity Recogni-tion algorithm [6], which runs at low power, and Future Ur-ban Mobility Survey’s (FMS) GPS and accelerometer server-based approach [10, 11], an app developed by the Singapore-MIT Alliance for Research and Technology (SMART), inconjunction with the Singapore government’s Household In-terview Travel Survey (HITS). FMS is the first smartphonesurvey app to have been field-tested on a large deploymentof over 1000+ users in Boston and Singapore, designed asan alternative to traditional surveys done via in-person inter-views in HITS.
We chose FMS and Google as baselines due to their widedeployment and usage. In our evaluation, we find that ourbarometer-based approach consumes 32 mW lower power incomparison to Google, and has comparable accuracy to bothGoogle as well as FMS.
In addition to real-world trace data, we have also evalu-ated our algorithm using over 900 km (30,000 data points) ofelevation data available on Google Maps from 5 cities. Theaccuracy results from map data are similar to real-world tracedata, and provide convincing evidence that sufficient eleva-tion changes do occur in practice for barometer to detect usercontext.
We have implemented our approach on Android. It runsin real-time on the phone locally, without requiring internetconnection.
1Nexus 4, Nexus 5, Galaxy Nexus, Galaxy S3/4/5, Galaxy Note 1/2/3,and many more
The rest of the paper is organised as follows: Section2 discusses related work. Section 3 describes the motiva-tion of using the barometer for context detection. A briefbackground is given in Section 4, and the context-detectionmethodology is described in Section 5. Section 6 evaluatesthe barometer approach. This is followed by a discussion inSection 7, and Section 8 concludes the paper.
2 Related WorkResearch has been done in context-detection using sen-
sors for several years, differing in the type of user activi-ties detected, sensors used, and classification techniques. Anextensive survey is presented in [7]. Accelerometer is thepredominant sensor used, with 28 out of 36 papers listed us-ing it. Other commonly used sensors include GPS, Cellular,and WiFi. In the following, we focus on prior work usingthese sensors, describing their limitations, while section 3discusses how the barometer overcomes these limitations.
• GPS: GPS is an extremely useful sensor for activitydetection, since it provides the physical location of theuser. A series of GPS readings can be analysed to cal-culate speed and bearing, typically used in combinationwith accelerometer features to achieve higher classifi-cation accuracy. Reddy et al. [12] and Ryder et al.[13] use GPS in conjunction with accelerometer to de-tect the modes idle/walking/running/bike/vehicle, andobserve that GPS contributes to an increase in accu-racy of about 10%. The Future Urban Mobility Survey(FMS) application [10, 11] uses GPS and accelerome-ter to detect the modes walking/car/bus/MRT/bike, ob-serving an increase of 27% in accuracy over just usingan accelerometer sampled at 10 Hz. In contrast, Zhenget al. [14] uses solely GPS data to detect the modeswalking/driving/bus/bike, by extracting additional fea-tures such as heading change rate, stop rate, and ve-locity change rate. The trade-off in GPS accuracy isits high power usage and low coverage indoors, under-ground, and in urban canyons. To reduce power usage,GPS is turned on adaptively rather than periodically, us-ing accelerometer and/or cell tower change as a trig-ger. However, the power usage remains high outdoors,where charging sockets are typically unavailable.
• Cellular and WiFi: Movement can also be detected us-ing change in cellular and WiFi signals. Anderson andMuller [15] use fluctuation in cellular signal strength tofigure out if the user is stationary/walking/driving, asdoes Sohn et al. [16]. Using signal strength is chal-lenging since it can change unpredictably even whenthe user is stationary. Nawaz et al. [17] use a morerobust WiFi beacon reception ratio as opposed to sig-nal strength, to detect if a user has parked or is driv-ing a car. An algorithm called BeaconPrint [18] usescellular/WiFi beacon IDs to detect movement, withoutrequiring any signal strength information. Since WiFihas shorter range and the network deployment is denser,change in signal is observed faster than change in cellu-lar signal. However, WiFi-based techniques work onlyin urban areas with dense WiFi access points. Cellular
has better coverage, but cell size can vary significantly,making cellular-based detection difficult to generalize.
• Accelerometer: The lowest-power and most predomi-nant sensor used for context detection is the accelerom-eter. Features extracted from accelerometer data are in-put to a supervised machine learning algorithm, whichclassifies the user activities. Due to classifier complex-ity, majority of prior work perform classification offline[19] instead of in real-time. Reddy et al. [12] imple-ment their classifier on Nokia N95 phones, while per-forming the training offline, as does [20]. To avoidorientation problems, orientation-independent features(such as combined magnitude) can be used [19]. How-ever, extensive training is still required to account foruser and position dependence. Unlike Cellular andWiFi, accelerometer is capable of fine-grained classifi-cation of vehicular modes. Hemminki et al. [21] imple-ment a three-stage classifier on Android to detect trav-elling on bus/train/metro/tram/car, at a power consump-tion of 85 mW (excluding base-power consumption).Our barometer-based approach can be used as a low-power trigger for higher-power finer-grained vehicularclassification.
• Barometer: Barometer has been used for aiding GPS[22], the reason for its introduction into Android smart-phones. Tanigawa et al. [23] uses barometer as an aid inremoving accelerometer drift. Due to its excellent rela-tive accuracy, barometer has been used for floor-changedetection [24, 25]. Stairs and elevator can be easily dis-tinguished using vertical speed thresholds. [24] uses asampling rate of 1 Hz, similar to our paper. A highersampling rate of 15 and 25 Hz can be used to reducenoise [25]. However, since newer barometer chips sup-port internal hardware smoothing, a high sampling rateis no longer required. So far, barometer has been usedonly as an aid to other sensors. To the best of our knowl-edge, no prior work has used only barometer for detec-tion of the modes idle/walking/vehicle.
3 MotivationPrior work have used multiple sensors including GPS,
Cellular, WiFi, and accelerometer for context detection.Then why it is advantageous to use barometer for the samepurpose?
Although several sensors are available, each has its ownset of limitations in low-power activity detection, listed inTable 1. GPS consumes high power, and has poor coverageindoors and underground. In contrast, the barometer sensoris one of the lowest powered sensors on the phone, and isavailable for use everywhere. WiFi and cellular-based ap-proaches are better than GPS power-wise, but do not workwithout sufficient density of access points and cell towers.The barometer, on the other hand, is not dependent on anyexternal infrastructure.
Accelerometer, like barometer, is low-power, and not de-pendent on external infrastructure. Consequently, it hasbecome popular for context-detection. However, even ac-celerometer has drawbacks. By nature, accelerometer data
is dependent on the phone’s position (is the phone in a bag,pocket, or hand), and its orientation. Additionally, the read-ings vary from user to user, and vehicle to vehicle. Ev-ery user handles a phone differently, and different vehiclesmay produce different vibrations in the phone while mov-ing. These dependencies can be offset by using orientation-independent features and training the machine learning algo-rithm with each dependency case. However, addressing thesedependencies adds to the cost and complexity of the system,increasing power consumption. Majority of prior accelerom-eter work implement the classification offline instead of onthe phone, concentrating on accuracy but neglecting power.
As we demonstrate later in this paper, barometer is inher-ently position-independent, requires simple processing andonly minor calibration based on the terrain, overcoming allthe drawbacks of accelerometer.
To summarize, barometer has the following advantages:
• Position-independence: Barometer measures air pres-sure, and is inherently position-independent, as long asthe phone is not kept in an air-tight environment.
• Simpler calibration: Accelerometer depends on theposition, orientation, user, and vehicle, and requires suf-ficient training to work well in all cases. Barometer re-duces dependencies drastically: it only requires calibra-tion of a few parameters using the overall characteristicsof the terrain of the land, which remains relatively un-changed over time.
• Better WAIT detection: In transportation applications,one of the important aspects of the journey is the wait-ing time. While accelerometer is excellent for detectingwhen the phone is stationary, it faces problem when theuser fiddles or makes minor movements with the phone,triggering false positives. This is especially problematicwhen accelerometer is used to trigger higher power sen-sors like GPS. Barometer, unaffected by phone move-ments, yields fewer false positives compared to ac-celerometer for user movement (Section 6.1.3 comparesthe accuracy of accelerometer and barometer for theWAIT state).
• Lower-power: Barometer’s lower sampling rate andsimpler processing reduce power consumption. Table 2shows how the sampling rate can affect power usage (Ahigher sampling rate causes the sensor driver to be wo-ken up more frequently). Sampling accelerometer at 20Hz increases base power consumption by 112%, whilesampling barometer at 1 Hz increases it only by 2%(For more details on the measurement settings, pleasesee Section 6.4). Note that actual sampling rate is typi-cally higher than what is specified to the Android Sen-sor Manager (for example, Galaxy S3 returns barometervalues at 5 Hz rather than 1 Hz).
Accelerometer data in 3 axial directions is both a boonand a bane. It provides more information, but complicatesprocessing. This paper ultimately tries to answer the ques-tion: Is one-dimensional height data more useful than three-
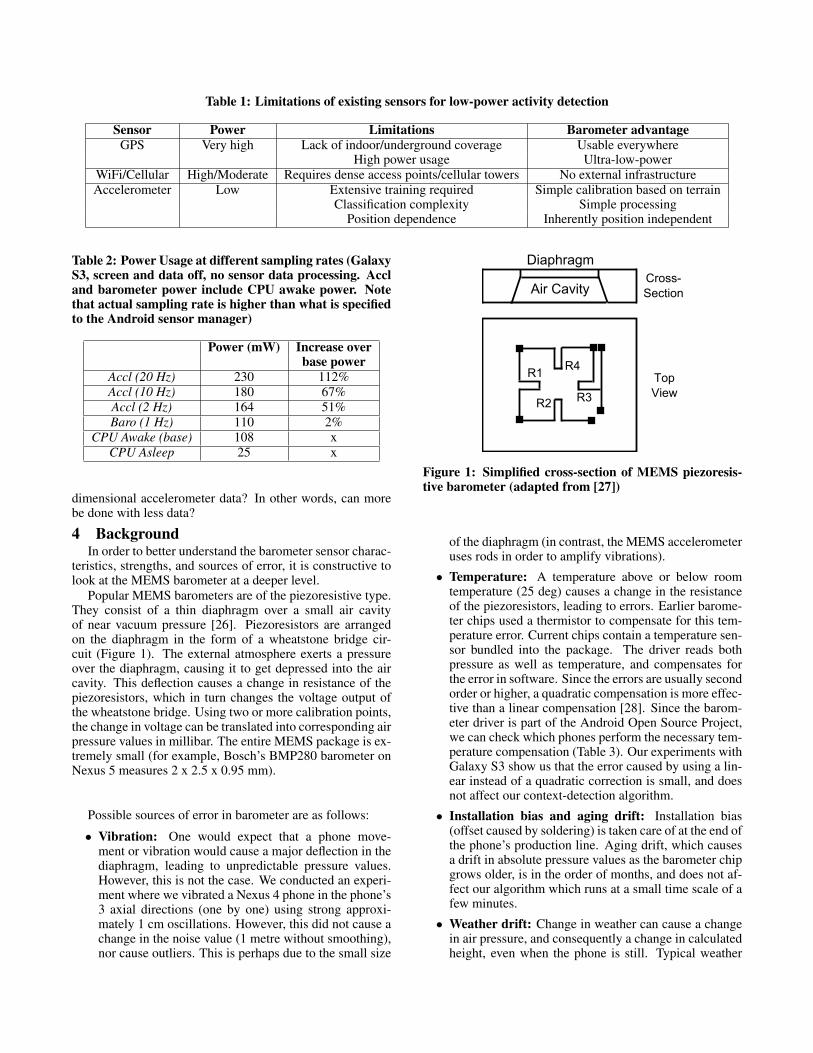
Table 1: Limitations of existing sensors for low-power activity detection
Sensor Power Limitations Barometer advantageGPS Very high Lack of indoor/underground coverage Usable everywhere
High power usage Ultra-low-powerWiFi/Cellular High/Moderate Requires dense access points/cellular towers No external infrastructureAccelerometer Low Extensive training required Simple calibration based on terrain
Classification complexity Simple processingPosition dependence Inherently position independent
Table 2: Power Usage at different sampling rates (GalaxyS3, screen and data off, no sensor data processing. Accland barometer power include CPU awake power. Notethat actual sampling rate is higher than what is specifiedto the Android sensor manager)
Power (mW) Increase overbase power
Accl (20 Hz) 230 112%Accl (10 Hz) 180 67%Accl (2 Hz) 164 51%Baro (1 Hz) 110 2%
CPU Awake (base) 108 xCPU Asleep 25 x
dimensional accelerometer data? In other words, can morebe done with less data?
4 BackgroundIn order to better understand the barometer sensor charac-
teristics, strengths, and sources of error, it is constructive tolook at the MEMS barometer at a deeper level.
Popular MEMS barometers are of the piezoresistive type.They consist of a thin diaphragm over a small air cavityof near vacuum pressure [26]. Piezoresistors are arrangedon the diaphragm in the form of a wheatstone bridge cir-cuit (Figure 1). The external atmosphere exerts a pressureover the diaphragm, causing it to get depressed into the aircavity. This deflection causes a change in resistance of thepiezoresistors, which in turn changes the voltage output ofthe wheatstone bridge. Using two or more calibration points,the change in voltage can be translated into corresponding airpressure values in millibar. The entire MEMS package is ex-tremely small (for example, Bosch’s BMP280 barometer onNexus 5 measures 2 x 2.5 x 0.95 mm).
Possible sources of error in barometer are as follows:
• Vibration: One would expect that a phone move-ment or vibration would cause a major deflection in thediaphragm, leading to unpredictable pressure values.However, this is not the case. We conducted an experi-ment where we vibrated a Nexus 4 phone in the phone’s3 axial directions (one by one) using strong approxi-mately 1 cm oscillations. However, this did not cause achange in the noise value (1 metre without smoothing),nor cause outliers. This is perhaps due to the small size
Air Cavity
Diaphragm
Cross-
Section
Top
View
R1
R2
R4
R3
Figure 1: Simplified cross-section of MEMS piezoresis-tive barometer (adapted from [27])
of the diaphragm (in contrast, the MEMS accelerometeruses rods in order to amplify vibrations).
• Temperature: A temperature above or below roomtemperature (25 deg) causes a change in the resistanceof the piezoresistors, leading to errors. Earlier barome-ter chips used a thermistor to compensate for this tem-perature error. Current chips contain a temperature sen-sor bundled into the package. The driver reads bothpressure as well as temperature, and compensates forthe error in software. Since the errors are usually secondorder or higher, a quadratic compensation is more effec-tive than a linear compensation [28]. Since the barom-eter driver is part of the Android Open Source Project,we can check which phones perform the necessary tem-perature compensation (Table 3). Our experiments withGalaxy S3 show us that the error caused by using a lin-ear instead of a quadratic correction is small, and doesnot affect our context-detection algorithm.
• Installation bias and aging drift: Installation bias(offset caused by soldering) is taken care of at the end ofthe phone’s production line. Aging drift, which causesa drift in absolute pressure values as the barometer chipgrows older, is in the order of months, and does not af-fect our algorithm which runs at a small time scale of afew minutes.
• Weather drift: Change in weather can cause a changein air pressure, and consequently a change in calculatedheight, even when the phone is still. Typical weather
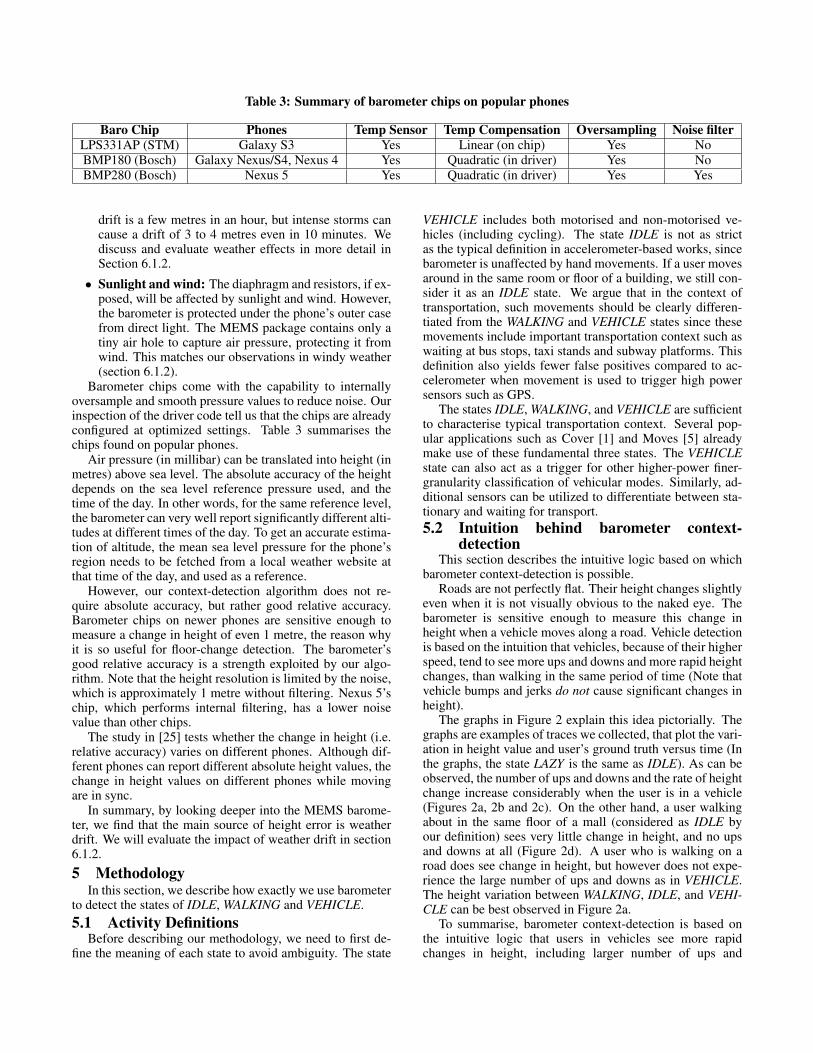
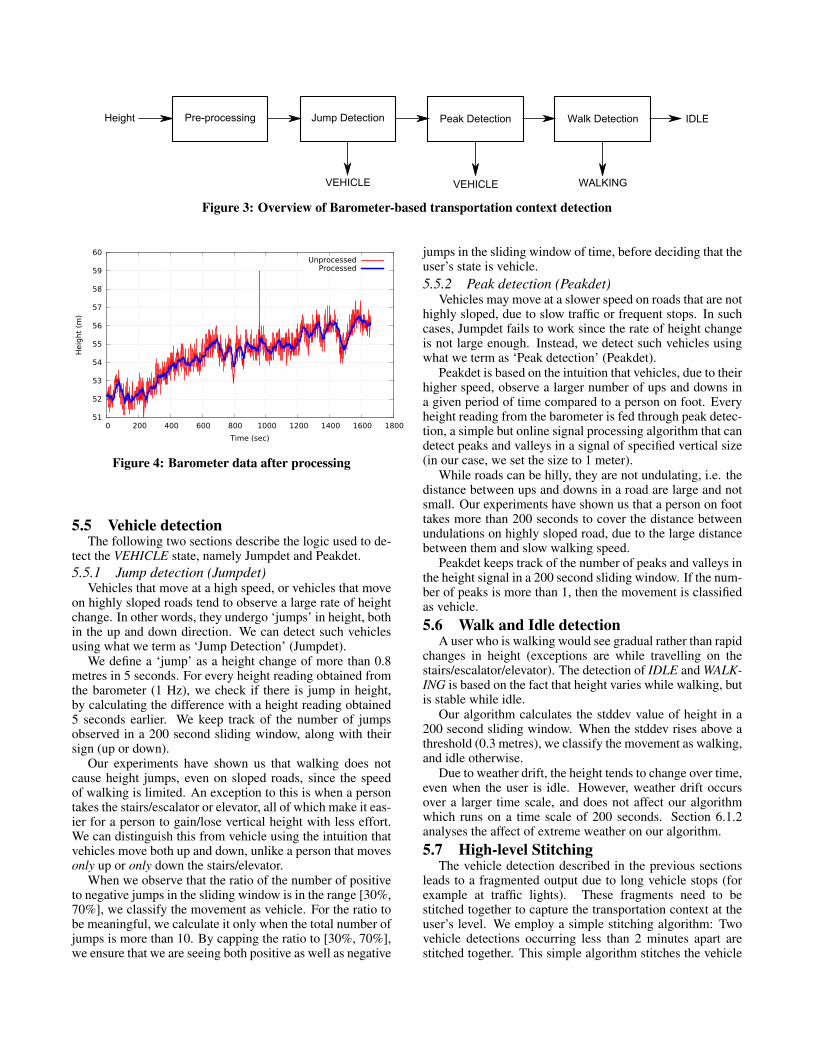
Table 3: Summary of barometer chips on popular phones
Baro Chip Phones Temp Sensor Temp Compensation Oversampling Noise filterLPS331AP (STM) Galaxy S3 Yes Linear (on chip) Yes NoBMP180 (Bosch) Galaxy Nexus/S4, Nexus 4 Yes Quadratic (in driver) Yes NoBMP280 (Bosch) Nexus 5 Yes Quadratic (in driver) Yes Yes
drift is a few metres in an hour, but intense storms cancause a drift of 3 to 4 metres even in 10 minutes. Wediscuss and evaluate weather effects in more detail inSection 6.1.2.
• Sunlight and wind: The diaphragm and resistors, if ex-posed, will be affected by sunlight and wind. However,the barometer is protected under the phone’s outer casefrom direct light. The MEMS package contains only atiny air hole to capture air pressure, protecting it fromwind. This matches our observations in windy weather(section 6.1.2).
Barometer chips come with the capability to internallyoversample and smooth pressure values to reduce noise. Ourinspection of the driver code tell us that the chips are alreadyconfigured at optimized settings. Table 3 summarises thechips found on popular phones.
Air pressure (in millibar) can be translated into height (inmetres) above sea level. The absolute accuracy of the heightdepends on the sea level reference pressure used, and thetime of the day. In other words, for the same reference level,the barometer can very well report significantly different alti-tudes at different times of the day. To get an accurate estima-tion of altitude, the mean sea level pressure for the phone’sregion needs to be fetched from a local weather website atthat time of the day, and used as a reference.
However, our context-detection algorithm does not re-quire absolute accuracy, but rather good relative accuracy.Barometer chips on newer phones are sensitive enough tomeasure a change in height of even 1 metre, the reason whyit is so useful for floor-change detection. The barometer’sgood relative accuracy is a strength exploited by our algo-rithm. Note that the height resolution is limited by the noise,which is approximately 1 metre without filtering. Nexus 5’schip, which performs internal filtering, has a lower noisevalue than other chips.
The study in [25] tests whether the change in height (i.e.relative accuracy) varies on different phones. Although dif-ferent phones can report different absolute height values, thechange in height values on different phones while movingare in sync.
In summary, by looking deeper into the MEMS barome-ter, we find that the main source of height error is weatherdrift. We will evaluate the impact of weather drift in section6.1.2.
5 MethodologyIn this section, we describe how exactly we use barometer
to detect the states of IDLE, WALKING and VEHICLE.5.1 Activity Definitions
Before describing our methodology, we need to first de-fine the meaning of each state to avoid ambiguity. The state
VEHICLE includes both motorised and non-motorised ve-hicles (including cycling). The state IDLE is not as strictas the typical definition in accelerometer-based works, sincebarometer is unaffected by hand movements. If a user movesaround in the same room or floor of a building, we still con-sider it as an IDLE state. We argue that in the context oftransportation, such movements should be clearly differen-tiated from the WALKING and VEHICLE states since thesemovements include important transportation context such aswaiting at bus stops, taxi stands and subway platforms. Thisdefinition also yields fewer false positives compared to ac-celerometer when movement is used to trigger high powersensors such as GPS.
The states IDLE, WALKING, and VEHICLE are sufficientto characterise typical transportation context. Several pop-ular applications such as Cover [1] and Moves [5] alreadymake use of these fundamental three states. The VEHICLEstate can also act as a trigger for other higher-power finer-granularity classification of vehicular modes. Similarly, ad-ditional sensors can be utilized to differentiate between sta-tionary and waiting for transport.5.2 Intuition behind barometer context-
detectionThis section describes the intuitive logic based on which
barometer context-detection is possible.Roads are not perfectly flat. Their height changes slightly
even when it is not visually obvious to the naked eye. Thebarometer is sensitive enough to measure this change inheight when a vehicle moves along a road. Vehicle detectionis based on the intuition that vehicles, because of their higherspeed, tend to see more ups and downs and more rapid heightchanges, than walking in the same period of time (Note thatvehicle bumps and jerks do not cause significant changes inheight).
The graphs in Figure 2 explain this idea pictorially. Thegraphs are examples of traces we collected, that plot the vari-ation in height value and user’s ground truth versus time (Inthe graphs, the state LAZY is the same as IDLE). As can beobserved, the number of ups and downs and the rate of heightchange increase considerably when the user is in a vehicle(Figures 2a, 2b and 2c). On the other hand, a user walkingabout in the same floor of a mall (considered as IDLE byour definition) sees very little change in height, and no upsand downs at all (Figure 2d). A user who is walking on aroad does see change in height, but however does not expe-rience the large number of ups and downs as in VEHICLE.The height variation between WALKING, IDLE, and VEHI-CLE can be best observed in Figure 2a.
To summarise, barometer context-detection is based onthe intuitive logic that users in vehicles see more rapidchanges in height, including larger number of ups and
LAZY_MOVEMENT
WALKING
STAIRS_ESCALATOR_LIFT
BUS
1200 1400 1600 1800 2000 2200 2400 188
190
192
194
196
198
200
Gro
und
Tru
th
Heig
ht
(m)
Time (sec)
Ground TruthHeight
(a) Commute on a bus in Boston
LAZY_MOVEMENT
WALKING
BUS
1200 1400 1600 1800 2000 2200 2400 24
26
28
30
Gro
und
Tru
th
Heig
ht
(m)
Time (sec)
Ground TruthHeight
(b) Commute on a bus in Singapore
LAZY_MOVEMENT
VEHICLE_STOPPED
VEHICLE_MOVING
SUBWAY_MRT
0 500 1000 1500 2000 2500 3000 22 24 26 28 30 32 34 36 38 40 42 44 46 48 50 52 54 56
Gro
und
Tru
th
Heig
ht
(m)
Time (sec)
Ground TruthHeight
(c) Subway ride in Singapore
WALKING
STAIRS_ESCALATOR_LIFT
0 200 400 600 800 1000 29
30
31
32
33
34
35
36
37
38
39
Gro
und
Tru
th
Heig
ht
(m)
Time (sec)
Ground TruthHeight
(d) Walking between floors in a mall
Figure 2: Some examples of height variation against time for different user states
downs. Users who are walking see a gradual change inheight. Users who are idle do not see any change in height.
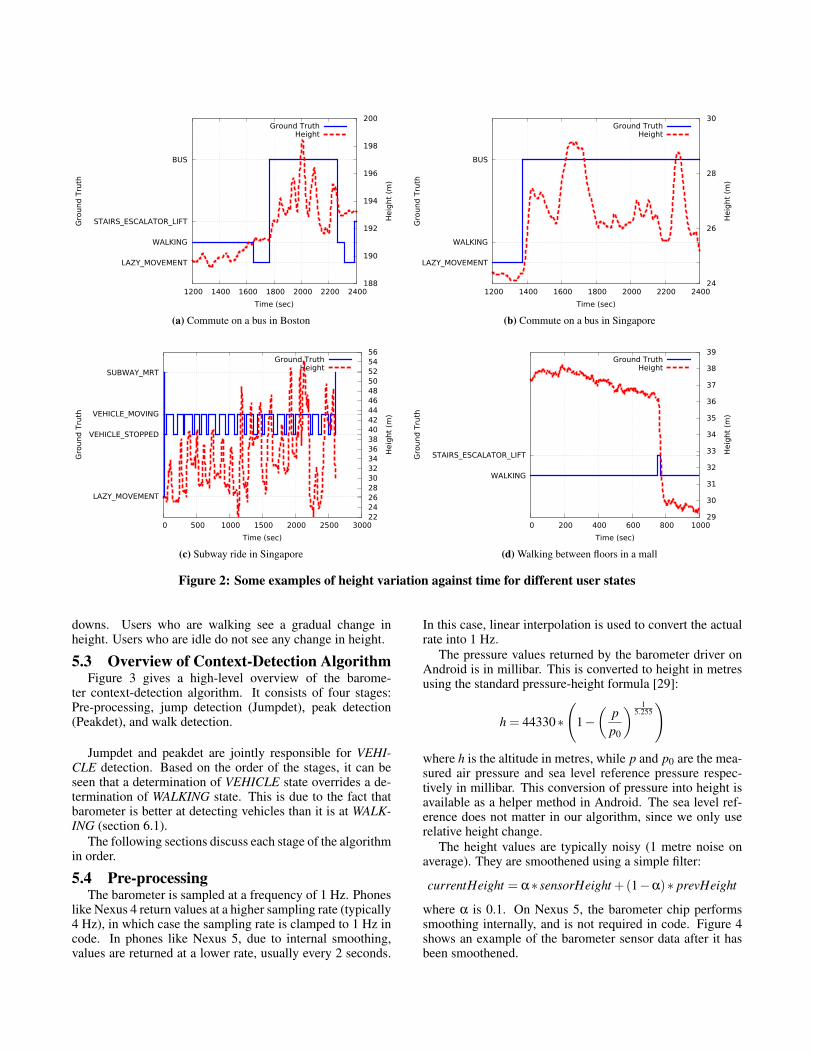
5.3 Overview of Context-Detection AlgorithmFigure 3 gives a high-level overview of the barome-
ter context-detection algorithm. It consists of four stages:Pre-processing, jump detection (Jumpdet), peak detection(Peakdet), and walk detection.
Jumpdet and peakdet are jointly responsible for VEHI-CLE detection. Based on the order of the stages, it can beseen that a determination of VEHICLE state overrides a de-termination of WALKING state. This is due to the fact thatbarometer is better at detecting vehicles than it is at WALK-ING (section 6.1).
The following sections discuss each stage of the algorithmin order.
5.4 Pre-processingThe barometer is sampled at a frequency of 1 Hz. Phones
like Nexus 4 return values at a higher sampling rate (typically4 Hz), in which case the sampling rate is clamped to 1 Hz incode. In phones like Nexus 5, due to internal smoothing,values are returned at a lower rate, usually every 2 seconds.
In this case, linear interpolation is used to convert the actualrate into 1 Hz.
The pressure values returned by the barometer driver onAndroid is in millibar. This is converted to height in metresusing the standard pressure-height formula [29]:
h = 44330∗
(1−(
pp0
) 15.255)
where h is the altitude in metres, while p and p0 are the mea-sured air pressure and sea level reference pressure respec-tively in millibar. This conversion of pressure into height isavailable as a helper method in Android. The sea level ref-erence does not matter in our algorithm, since we only userelative height change.
The height values are typically noisy (1 metre noise onaverage). They are smoothened using a simple filter:
currentHeight = α∗ sensorHeight +(1−α)∗ prevHeight
where α is 0.1. On Nexus 5, the barometer chip performssmoothing internally, and is not required in code. Figure 4shows an example of the barometer sensor data after it hasbeen smoothened.
Jump Detection Peak DetectionPre-processing Walk DetectionHeight
VEHICLE VEHICLE WALKING
IDLE
Figure 3: Overview of Barometer-based transportation context detection
51
52
53
54
55
56
57
58
59
60
0 200 400 600 800 1000 1200 1400 1600 1800
Heig
ht
(m)
Time (sec)
UnprocessedProcessed
Figure 4: Barometer data after processing
5.5 Vehicle detectionThe following two sections describe the logic used to de-
tect the VEHICLE state, namely Jumpdet and Peakdet.5.5.1 Jump detection (Jumpdet)
Vehicles that move at a high speed, or vehicles that moveon highly sloped roads tend to observe a large rate of heightchange. In other words, they undergo ‘jumps’ in height, bothin the up and down direction. We can detect such vehiclesusing what we term as ‘Jump Detection’ (Jumpdet).
We define a ‘jump’ as a height change of more than 0.8metres in 5 seconds. For every height reading obtained fromthe barometer (1 Hz), we check if there is jump in height,by calculating the difference with a height reading obtained5 seconds earlier. We keep track of the number of jumpsobserved in a 200 second sliding window, along with theirsign (up or down).
Our experiments have shown us that walking does notcause height jumps, even on sloped roads, since the speedof walking is limited. An exception to this is when a persontakes the stairs/escalator or elevator, all of which make it eas-ier for a person to gain/lose vertical height with less effort.We can distinguish this from vehicle using the intuition thatvehicles move both up and down, unlike a person that movesonly up or only down the stairs/elevator.
When we observe that the ratio of the number of positiveto negative jumps in the sliding window is in the range [30%,70%], we classify the movement as vehicle. For the ratio tobe meaningful, we calculate it only when the total number ofjumps is more than 10. By capping the ratio to [30%, 70%],we ensure that we are seeing both positive as well as negative
jumps in the sliding window of time, before deciding that theuser’s state is vehicle.5.5.2 Peak detection (Peakdet)
Vehicles may move at a slower speed on roads that are nothighly sloped, due to slow traffic or frequent stops. In suchcases, Jumpdet fails to work since the rate of height changeis not large enough. Instead, we detect such vehicles usingwhat we term as ‘Peak detection’ (Peakdet).
Peakdet is based on the intuition that vehicles, due to theirhigher speed, observe a larger number of ups and downs ina given period of time compared to a person on foot. Everyheight reading from the barometer is fed through peak detec-tion, a simple but online signal processing algorithm that candetect peaks and valleys in a signal of specified vertical size(in our case, we set the size to 1 meter).
While roads can be hilly, they are not undulating, i.e. thedistance between ups and downs in a road are large and notsmall. Our experiments have shown us that a person on foottakes more than 200 seconds to cover the distance betweenundulations on highly sloped road, due to the large distancebetween them and slow walking speed.
Peakdet keeps track of the number of peaks and valleys inthe height signal in a 200 second sliding window. If the num-ber of peaks is more than 1, then the movement is classifiedas vehicle.5.6 Walk and Idle detection
A user who is walking would see gradual rather than rapidchanges in height (exceptions are while travelling on thestairs/escalator/elevator). The detection of IDLE and WALK-ING is based on the fact that height varies while walking, butis stable while idle.
Our algorithm calculates the stddev value of height in a200 second sliding window. When the stddev rises above athreshold (0.3 metres), we classify the movement as walking,and idle otherwise.
Due to weather drift, the height tends to change over time,even when the user is idle. However, weather drift occursover a larger time scale, and does not affect our algorithmwhich runs on a time scale of 200 seconds. Section 6.1.2analyses the affect of extreme weather on our algorithm.5.7 High-level Stitching
The vehicle detection described in the previous sectionsleads to a fragmented output due to long vehicle stops (forexample at traffic lights). These fragments need to bestitched together to capture the transportation context at theuser’s level. We employ a simple stitching algorithm: Twovehicle detections occurring less than 2 minutes apart arestitched together. This simple algorithm stitches the vehicle
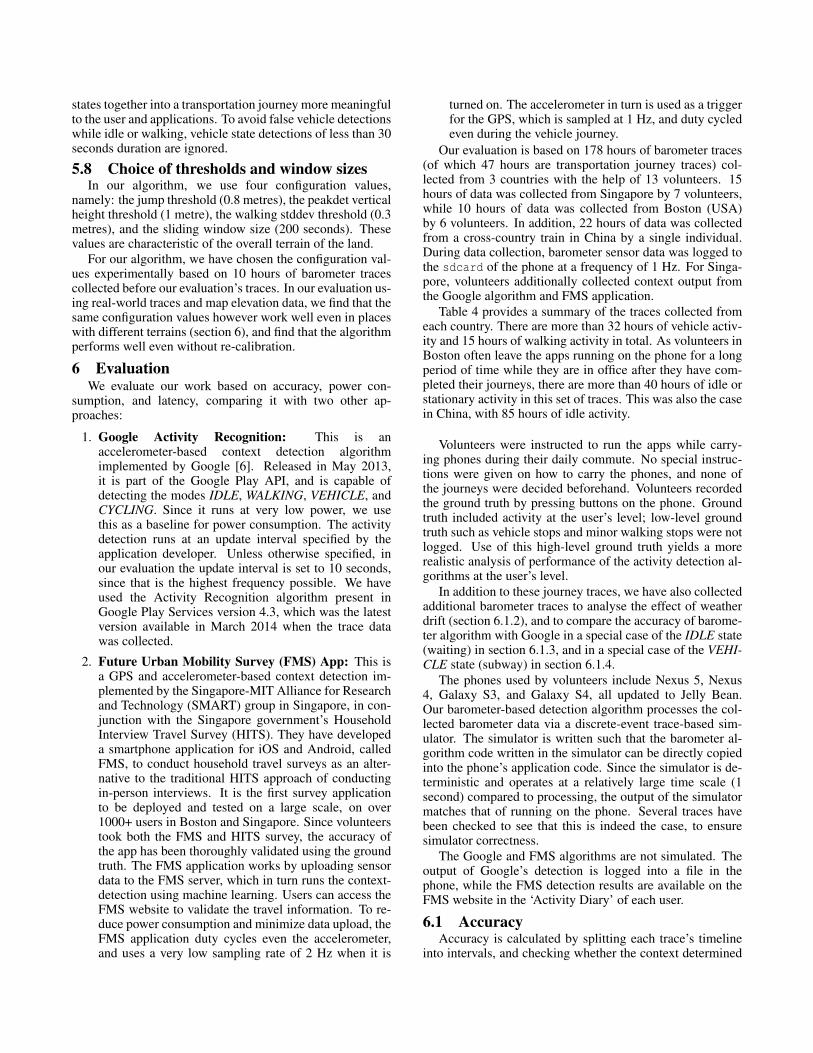
states together into a transportation journey more meaningfulto the user and applications. To avoid false vehicle detectionswhile idle or walking, vehicle state detections of less than 30seconds duration are ignored.
5.8 Choice of thresholds and window sizesIn our algorithm, we use four configuration values,
namely: the jump threshold (0.8 metres), the peakdet verticalheight threshold (1 metre), the walking stddev threshold (0.3metres), and the sliding window size (200 seconds). Thesevalues are characteristic of the overall terrain of the land.
For our algorithm, we have chosen the configuration val-ues experimentally based on 10 hours of barometer tracescollected before our evaluation’s traces. In our evaluation us-ing real-world traces and map elevation data, we find that thesame configuration values however work well even in placeswith different terrains (section 6), and find that the algorithmperforms well even without re-calibration.
6 EvaluationWe evaluate our work based on accuracy, power con-
sumption, and latency, comparing it with two other ap-proaches:
1. Google Activity Recognition: This is anaccelerometer-based context detection algorithmimplemented by Google [6]. Released in May 2013,it is part of the Google Play API, and is capable ofdetecting the modes IDLE, WALKING, VEHICLE, andCYCLING. Since it runs at very low power, we usethis as a baseline for power consumption. The activitydetection runs at an update interval specified by theapplication developer. Unless otherwise specified, inour evaluation the update interval is set to 10 seconds,since that is the highest frequency possible. We haveused the Activity Recognition algorithm present inGoogle Play Services version 4.3, which was the latestversion available in March 2014 when the trace datawas collected.
2. Future Urban Mobility Survey (FMS) App: This isa GPS and accelerometer-based context detection im-plemented by the Singapore-MIT Alliance for Researchand Technology (SMART) group in Singapore, in con-junction with the Singapore government’s HouseholdInterview Travel Survey (HITS). They have developeda smartphone application for iOS and Android, calledFMS, to conduct household travel surveys as an alter-native to the traditional HITS approach of conductingin-person interviews. It is the first survey applicationto be deployed and tested on a large scale, on over1000+ users in Boston and Singapore. Since volunteerstook both the FMS and HITS survey, the accuracy ofthe app has been thoroughly validated using the groundtruth. The FMS application works by uploading sensordata to the FMS server, which in turn runs the context-detection using machine learning. Users can access theFMS website to validate the travel information. To re-duce power consumption and minimize data upload, theFMS application duty cycles even the accelerometer,and uses a very low sampling rate of 2 Hz when it is
turned on. The accelerometer in turn is used as a triggerfor the GPS, which is sampled at 1 Hz, and duty cycledeven during the vehicle journey.
Our evaluation is based on 178 hours of barometer traces(of which 47 hours are transportation journey traces) col-lected from 3 countries with the help of 13 volunteers. 15hours of data was collected from Singapore by 7 volunteers,while 10 hours of data was collected from Boston (USA)by 6 volunteers. In addition, 22 hours of data was collectedfrom a cross-country train in China by a single individual.During data collection, barometer sensor data was logged tothe sdcard of the phone at a frequency of 1 Hz. For Singa-pore, volunteers additionally collected context output fromthe Google algorithm and FMS application.
Table 4 provides a summary of the traces collected fromeach country. There are more than 32 hours of vehicle activ-ity and 15 hours of walking activity in total. As volunteers inBoston often leave the apps running on the phone for a longperiod of time while they are in office after they have com-pleted their journeys, there are more than 40 hours of idle orstationary activity in this set of traces. This was also the casein China, with 85 hours of idle activity.
Volunteers were instructed to run the apps while carry-ing phones during their daily commute. No special instruc-tions were given on how to carry the phones, and none ofthe journeys were decided beforehand. Volunteers recordedthe ground truth by pressing buttons on the phone. Groundtruth included activity at the user’s level; low-level groundtruth such as vehicle stops and minor walking stops were notlogged. Use of this high-level ground truth yields a morerealistic analysis of performance of the activity detection al-gorithms at the user’s level.
In addition to these journey traces, we have also collectedadditional barometer traces to analyse the effect of weatherdrift (section 6.1.2), and to compare the accuracy of barome-ter algorithm with Google in a special case of the IDLE state(waiting) in section 6.1.3, and in a special case of the VEHI-CLE state (subway) in section 6.1.4.
The phones used by volunteers include Nexus 5, Nexus4, Galaxy S3, and Galaxy S4, all updated to Jelly Bean.Our barometer-based detection algorithm processes the col-lected barometer data via a discrete-event trace-based sim-ulator. The simulator is written such that the barometer al-gorithm code written in the simulator can be directly copiedinto the phone’s application code. Since the simulator is de-terministic and operates at a relatively large time scale (1second) compared to processing, the output of the simulatormatches that of running on the phone. Several traces havebeen checked to see that this is indeed the case, to ensuresimulator correctness.
The Google and FMS algorithms are not simulated. Theoutput of Google’s detection is logged into a file in thephone, while the FMS detection results are available on theFMS website in the ‘Activity Diary’ of each user.
6.1 AccuracyAccuracy is calculated by splitting each trace’s timeline
into intervals, and checking whether the context determined
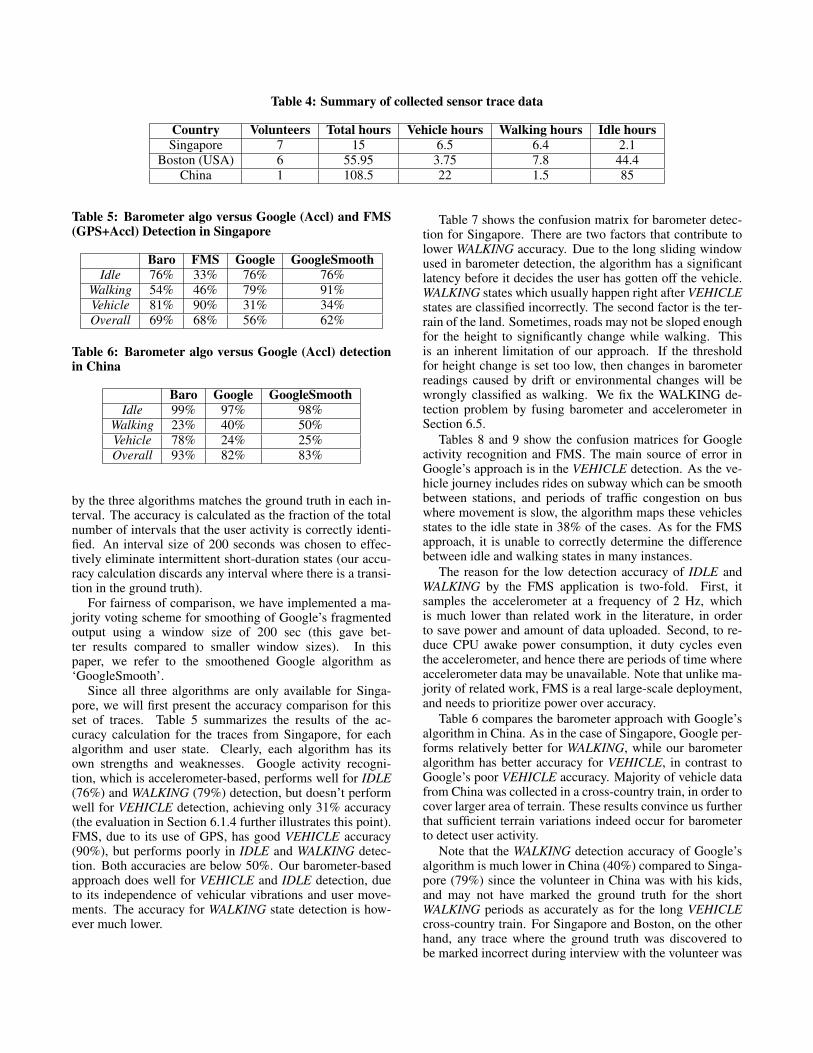
Table 4: Summary of collected sensor trace data
Country Volunteers Total hours Vehicle hours Walking hours Idle hoursSingapore 7 15 6.5 6.4 2.1
Boston (USA) 6 55.95 3.75 7.8 44.4China 1 108.5 22 1.5 85
Table 5: Barometer algo versus Google (Accl) and FMS(GPS+Accl) Detection in Singapore
Baro FMS Google GoogleSmoothIdle 76% 33% 76% 76%
Walking 54% 46% 79% 91%Vehicle 81% 90% 31% 34%Overall 69% 68% 56% 62%
Table 6: Barometer algo versus Google (Accl) detectionin China
Baro Google GoogleSmoothIdle 99% 97% 98%
Walking 23% 40% 50%Vehicle 78% 24% 25%Overall 93% 82% 83%
by the three algorithms matches the ground truth in each in-terval. The accuracy is calculated as the fraction of the totalnumber of intervals that the user activity is correctly identi-fied. An interval size of 200 seconds was chosen to effec-tively eliminate intermittent short-duration states (our accu-racy calculation discards any interval where there is a transi-tion in the ground truth).
For fairness of comparison, we have implemented a ma-jority voting scheme for smoothing of Google’s fragmentedoutput using a window size of 200 sec (this gave bet-ter results compared to smaller window sizes). In thispaper, we refer to the smoothened Google algorithm as‘GoogleSmooth’.
Since all three algorithms are only available for Singa-pore, we will first present the accuracy comparison for thisset of traces. Table 5 summarizes the results of the ac-curacy calculation for the traces from Singapore, for eachalgorithm and user state. Clearly, each algorithm has itsown strengths and weaknesses. Google activity recogni-tion, which is accelerometer-based, performs well for IDLE(76%) and WALKING (79%) detection, but doesn’t performwell for VEHICLE detection, achieving only 31% accuracy(the evaluation in Section 6.1.4 further illustrates this point).FMS, due to its use of GPS, has good VEHICLE accuracy(90%), but performs poorly in IDLE and WALKING detec-tion. Both accuracies are below 50%. Our barometer-basedapproach does well for VEHICLE and IDLE detection, dueto its independence of vehicular vibrations and user move-ments. The accuracy for WALKING state detection is how-ever much lower.
Table 7 shows the confusion matrix for barometer detec-tion for Singapore. There are two factors that contribute tolower WALKING accuracy. Due to the long sliding windowused in barometer detection, the algorithm has a significantlatency before it decides the user has gotten off the vehicle.WALKING states which usually happen right after VEHICLEstates are classified incorrectly. The second factor is the ter-rain of the land. Sometimes, roads may not be sloped enoughfor the height to significantly change while walking. Thisis an inherent limitation of our approach. If the thresholdfor height change is set too low, then changes in barometerreadings caused by drift or environmental changes will bewrongly classified as walking. We fix the WALKING de-tection problem by fusing barometer and accelerometer inSection 6.5.
Tables 8 and 9 show the confusion matrices for Googleactivity recognition and FMS. The main source of error inGoogle’s approach is in the VEHICLE detection. As the ve-hicle journey includes rides on subway which can be smoothbetween stations, and periods of traffic congestion on buswhere movement is slow, the algorithm maps these vehiclesstates to the idle state in 38% of the cases. As for the FMSapproach, it is unable to correctly determine the differencebetween idle and walking states in many instances.
The reason for the low detection accuracy of IDLE andWALKING by the FMS application is two-fold. First, itsamples the accelerometer at a frequency of 2 Hz, whichis much lower than related work in the literature, in orderto save power and amount of data uploaded. Second, to re-duce CPU awake power consumption, it duty cycles eventhe accelerometer, and hence there are periods of time whereaccelerometer data may be unavailable. Note that unlike ma-jority of related work, FMS is a real large-scale deployment,and needs to prioritize power over accuracy.
Table 6 compares the barometer approach with Google’salgorithm in China. As in the case of Singapore, Google per-forms relatively better for WALKING, while our barometeralgorithm has better accuracy for VEHICLE, in contrast toGoogle’s poor VEHICLE accuracy. Majority of vehicle datafrom China was collected in a cross-country train, in order tocover larger area of terrain. These results convince us furtherthat sufficient terrain variations indeed occur for barometerto detect user activity.
Note that the WALKING detection accuracy of Google’salgorithm is much lower in China (40%) compared to Singa-pore (79%) since the volunteer in China was with his kids,and may not have marked the ground truth for the shortWALKING periods as accurately as for the long VEHICLEcross-country train. For Singapore and Boston, on the otherhand, any trace where the ground truth was discovered tobe marked incorrect during interview with the volunteer was
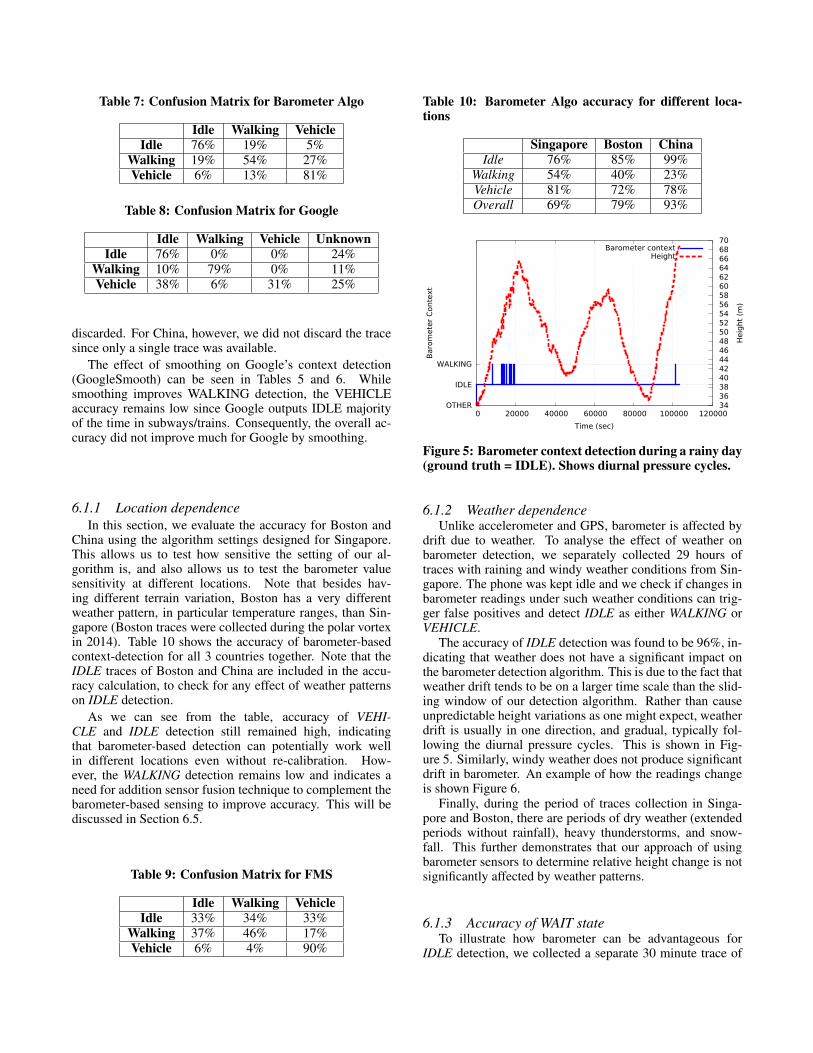
Table 7: Confusion Matrix for Barometer Algo
Idle Walking VehicleIdle 76% 19% 5%
Walking 19% 54% 27%Vehicle 6% 13% 81%
Table 8: Confusion Matrix for Google
Idle Walking Vehicle UnknownIdle 76% 0% 0% 24%
Walking 10% 79% 0% 11%Vehicle 38% 6% 31% 25%
discarded. For China, however, we did not discard the tracesince only a single trace was available.
The effect of smoothing on Google’s context detection(GoogleSmooth) can be seen in Tables 5 and 6. Whilesmoothing improves WALKING detection, the VEHICLEaccuracy remains low since Google outputs IDLE majorityof the time in subways/trains. Consequently, the overall ac-curacy did not improve much for Google by smoothing.
6.1.1 Location dependenceIn this section, we evaluate the accuracy for Boston and
China using the algorithm settings designed for Singapore.This allows us to test how sensitive the setting of our al-gorithm is, and also allows us to test the barometer valuesensitivity at different locations. Note that besides hav-ing different terrain variation, Boston has a very differentweather pattern, in particular temperature ranges, than Sin-gapore (Boston traces were collected during the polar vortexin 2014). Table 10 shows the accuracy of barometer-basedcontext-detection for all 3 countries together. Note that theIDLE traces of Boston and China are included in the accu-racy calculation, to check for any effect of weather patternson IDLE detection.
As we can see from the table, accuracy of VEHI-CLE and IDLE detection still remained high, indicatingthat barometer-based detection can potentially work wellin different locations even without re-calibration. How-ever, the WALKING detection remains low and indicates aneed for addition sensor fusion technique to complement thebarometer-based sensing to improve accuracy. This will bediscussed in Section 6.5.
Table 9: Confusion Matrix for FMS
Idle Walking VehicleIdle 33% 34% 33%
Walking 37% 46% 17%Vehicle 6% 4% 90%
Table 10: Barometer Algo accuracy for different loca-tions
Singapore Boston ChinaIdle 76% 85% 99%
Walking 54% 40% 23%Vehicle 81% 72% 78%Overall 69% 79% 93%
OTHER
IDLE
WALKING
0 20000 40000 60000 80000 100000 120000 34 36 38 40 42 44 46 48 50 52 54 56 58 60 62 64 66 68 70
Baro
mete
r C
onte
xt
Heig
ht
(m)
Time (sec)
Barometer contextHeight
Figure 5: Barometer context detection during a rainy day(ground truth = IDLE). Shows diurnal pressure cycles.
6.1.2 Weather dependenceUnlike accelerometer and GPS, barometer is affected by
drift due to weather. To analyse the effect of weather onbarometer detection, we separately collected 29 hours oftraces with raining and windy weather conditions from Sin-gapore. The phone was kept idle and we check if changes inbarometer readings under such weather conditions can trig-ger false positives and detect IDLE as either WALKING orVEHICLE.
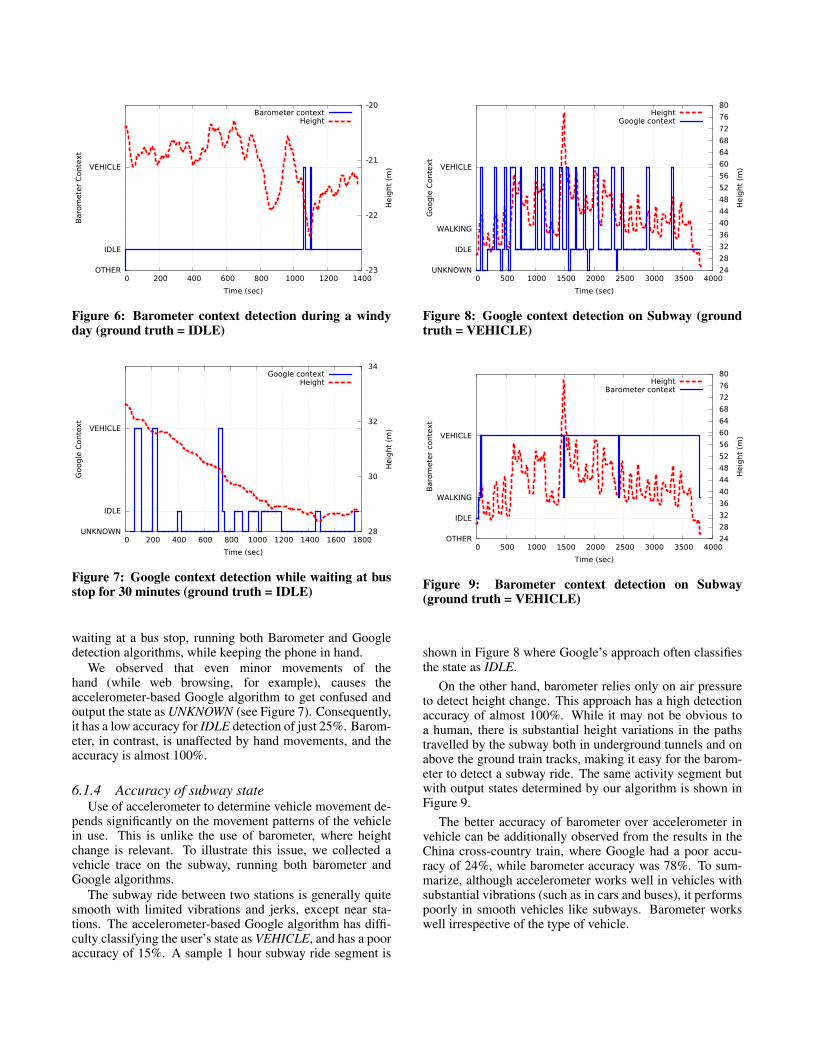
The accuracy of IDLE detection was found to be 96%, in-dicating that weather does not have a significant impact onthe barometer detection algorithm. This is due to the fact thatweather drift tends to be on a larger time scale than the slid-ing window of our detection algorithm. Rather than causeunpredictable height variations as one might expect, weatherdrift is usually in one direction, and gradual, typically fol-lowing the diurnal pressure cycles. This is shown in Fig-ure 5. Similarly, windy weather does not produce significantdrift in barometer. An example of how the readings changeis shown Figure 6.
Finally, during the period of traces collection in Singa-pore and Boston, there are periods of dry weather (extendedperiods without rainfall), heavy thunderstorms, and snow-fall. This further demonstrates that our approach of usingbarometer sensors to determine relative height change is notsignificantly affected by weather patterns.
6.1.3 Accuracy of WAIT stateTo illustrate how barometer can be advantageous for
IDLE detection, we collected a separate 30 minute trace of
OTHER
IDLE
VEHICLE
0 200 400 600 800 1000 1200 1400-23
-22
-21
-20
Baro
mete
r C
onte
xt
Heig
ht
(m)
Time (sec)
Barometer contextHeight
Figure 6: Barometer context detection during a windyday (ground truth = IDLE)
UNKNOWN
IDLE
VEHICLE
0 200 400 600 800 1000 1200 1400 1600 1800 28
30
32
34
Goog
le C
onte
xt
Heig
ht
(m)
Time (sec)
Google contextHeight
Figure 7: Google context detection while waiting at busstop for 30 minutes (ground truth = IDLE)
waiting at a bus stop, running both Barometer and Googledetection algorithms, while keeping the phone in hand.
We observed that even minor movements of thehand (while web browsing, for example), causes theaccelerometer-based Google algorithm to get confused andoutput the state as UNKNOWN (see Figure 7). Consequently,it has a low accuracy for IDLE detection of just 25%. Barom-eter, in contrast, is unaffected by hand movements, and theaccuracy is almost 100%.
6.1.4 Accuracy of subway stateUse of accelerometer to determine vehicle movement de-
pends significantly on the movement patterns of the vehiclein use. This is unlike the use of barometer, where heightchange is relevant. To illustrate this issue, we collected avehicle trace on the subway, running both barometer andGoogle algorithms.
The subway ride between two stations is generally quitesmooth with limited vibrations and jerks, except near sta-tions. The accelerometer-based Google algorithm has diffi-culty classifying the user’s state as VEHICLE, and has a pooraccuracy of 15%. A sample 1 hour subway ride segment is
UNKNOWN
IDLE
WALKING
VEHICLE
0 500 1000 1500 2000 2500 3000 3500 4000 24
28
32
36
40
44
48
52
56
60
64
68
72
76
80
Goog
le C
onte
xt
Heig
ht
(m)
Time (sec)
HeightGoogle context
Figure 8: Google context detection on Subway (groundtruth = VEHICLE)
OTHER
IDLE
WALKING
VEHICLE
0 500 1000 1500 2000 2500 3000 3500 4000 24
28
32
36
40
44
48
52
56
60
64
68
72
76
80
Baro
mete
r co
nte
xt
Heig
ht
(m)
Time (sec)
HeightBarometer context
Figure 9: Barometer context detection on Subway(ground truth = VEHICLE)
shown in Figure 8 where Google’s approach often classifiesthe state as IDLE.
On the other hand, barometer relies only on air pressureto detect height change. This approach has a high detectionaccuracy of almost 100%. While it may not be obvious toa human, there is substantial height variations in the pathstravelled by the subway both in underground tunnels and onabove the ground train tracks, making it easy for the barom-eter to detect a subway ride. The same activity segment butwith output states determined by our algorithm is shown inFigure 9.
The better accuracy of barometer over accelerometer invehicle can be additionally observed from the results in theChina cross-country train, where Google had a poor accu-racy of 24%, while barometer accuracy was 78%. To sum-marize, although accelerometer works well in vehicles withsubstantial vibrations (such as in cars and buses), it performspoorly in smooth vehicles like subways. Barometer workswell irrespective of the type of vehicle.
6.1.5 Note on Google’s AlgorithmThe version of Google’s algorithm used in our evaluation
was Google Play Services 4.3, the latest version available atthe time of collection of trace data in March 2014.
Google appears to have significantly modified their activ-ity recognition algorithm in subsequent releases of GooglePlay Services, which can now distinguish between WALK-ING and RUNNING. The algorithm is also more sensitive tophone movement, enabling it to better detect subway rides.We compared the accuracy of Version 4.3 (March 2014) andVersion 5.0 (August 2014)2 in the subway. The new versionhas a significantly higher accuracy of 81%, compared to theolder version with accuracy of 22%.
However, the extra sensitivity of the new version alsoleads to a larger number of VEHICLE false positives causedby minor hand movement. We compared the accuracy of theold and new version while waiting for a bus. The old versiondetected 3% VEHICLE false positives, while the new versionperformed poorly with 88% VEHICLE false positives (Notethat both the old and new version have a low WAITING de-tection accuracy, since the old version reports UNKNOWNmost of the time, as observed in Section 6.1.3). This compar-ison shows that while the extra sensitivity in the new versionenables better subway detection, it causes a large number offalse positives due to minor hand movement when the user isidle.6.2 Simulation using Map elevation data
In addition to real-world trace data, we have manuallypulled over 900 km (30,000 data points) of elevation datafrom non-overlapping roads of 5 cities from Google Maps.Using map elevation data, we can evaluate the accuracy ofour algorithm in a larger number of places over larger ge-ographic areas having substantially different terrains, espe-cially where we do not have real-world trace data available.An additional advantage is that we can vary the speed oftravel and check the effect on accuracy.
Map elevation data was collected from roads in KansasCity (USA), San Francisco (USA), Lausanne (Switzerland),as well as from Singapore and Boston. Data was collectedat 30 meter points, which is the highest resolution possible.Elevation data in between points are interpolated. This datahas been used to emulate barometer sensor data, and fed toour algorithm to evaluate accuracy.
Table 11 shows the accuracy of barometer algorithm atdifferent speeds. Two walking speeds (5 and 8 kmph) andthree vehicle speeds (25, 35 and 50 kmph) are considered.5 kmph is the average walking speed of a person, while 8kmph is a fast pace. Note that the accuracy of vehicle forspeeds higher than 50 kmph is expected to be higher, sincenumber of ups and downs encountered would also be higher,and is hence not shown in Table 11.
Note that even in places like Kansas, sufficient terrainvariations occur while travelling for barometer to distinguishbetween user states. Even at very low vehicle speed of 25kmph, accuracy is high, which increases with increasing
2The apk of every Google Play Services release is available online andcan be installed for accuracy comparison
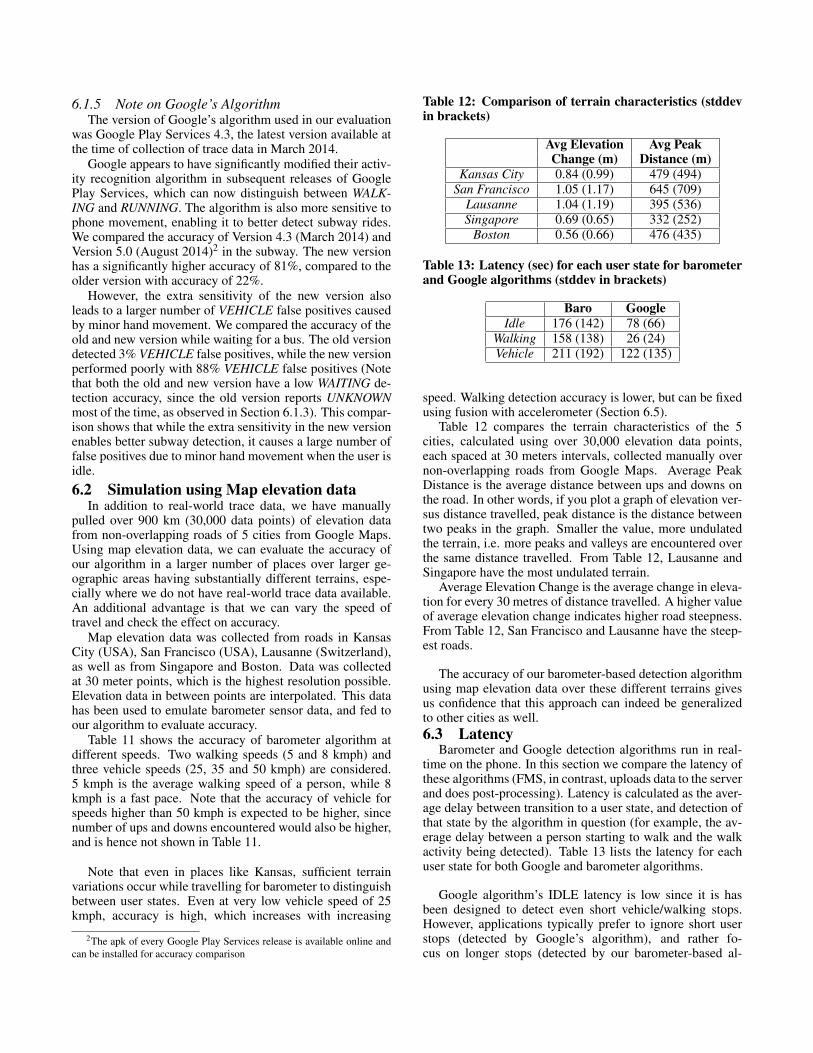
Table 12: Comparison of terrain characteristics (stddevin brackets)
Avg Elevation Avg PeakChange (m) Distance (m)
Kansas City 0.84 (0.99) 479 (494)San Francisco 1.05 (1.17) 645 (709)
Lausanne 1.04 (1.19) 395 (536)Singapore 0.69 (0.65) 332 (252)
Boston 0.56 (0.66) 476 (435)
Table 13: Latency (sec) for each user state for barometerand Google algorithms (stddev in brackets)
Baro GoogleIdle 176 (142) 78 (66)
Walking 158 (138) 26 (24)Vehicle 211 (192) 122 (135)
speed. Walking detection accuracy is lower, but can be fixedusing fusion with accelerometer (Section 6.5).
Table 12 compares the terrain characteristics of the 5cities, calculated using over 30,000 elevation data points,each spaced at 30 meters intervals, collected manually overnon-overlapping roads from Google Maps. Average PeakDistance is the average distance between ups and downs onthe road. In other words, if you plot a graph of elevation ver-sus distance travelled, peak distance is the distance betweentwo peaks in the graph. Smaller the value, more undulatedthe terrain, i.e. more peaks and valleys are encountered overthe same distance travelled. From Table 12, Lausanne andSingapore have the most undulated terrain.
Average Elevation Change is the average change in eleva-tion for every 30 metres of distance travelled. A higher valueof average elevation change indicates higher road steepness.From Table 12, San Francisco and Lausanne have the steep-est roads.
The accuracy of our barometer-based detection algorithmusing map elevation data over these different terrains givesus confidence that this approach can indeed be generalizedto other cities as well.6.3 Latency
Barometer and Google detection algorithms run in real-time on the phone. In this section we compare the latency ofthese algorithms (FMS, in contrast, uploads data to the serverand does post-processing). Latency is calculated as the aver-age delay between transition to a user state, and detection ofthat state by the algorithm in question (for example, the av-erage delay between a person starting to walk and the walkactivity being detected). Table 13 lists the latency for eachuser state for both Google and barometer algorithms.
Google algorithm’s IDLE latency is low since it is hasbeen designed to detect even short vehicle/walking stops.However, applications typically prefer to ignore short userstops (detected by Google’s algorithm), and rather fo-cus on longer stops (detected by our barometer-based al-
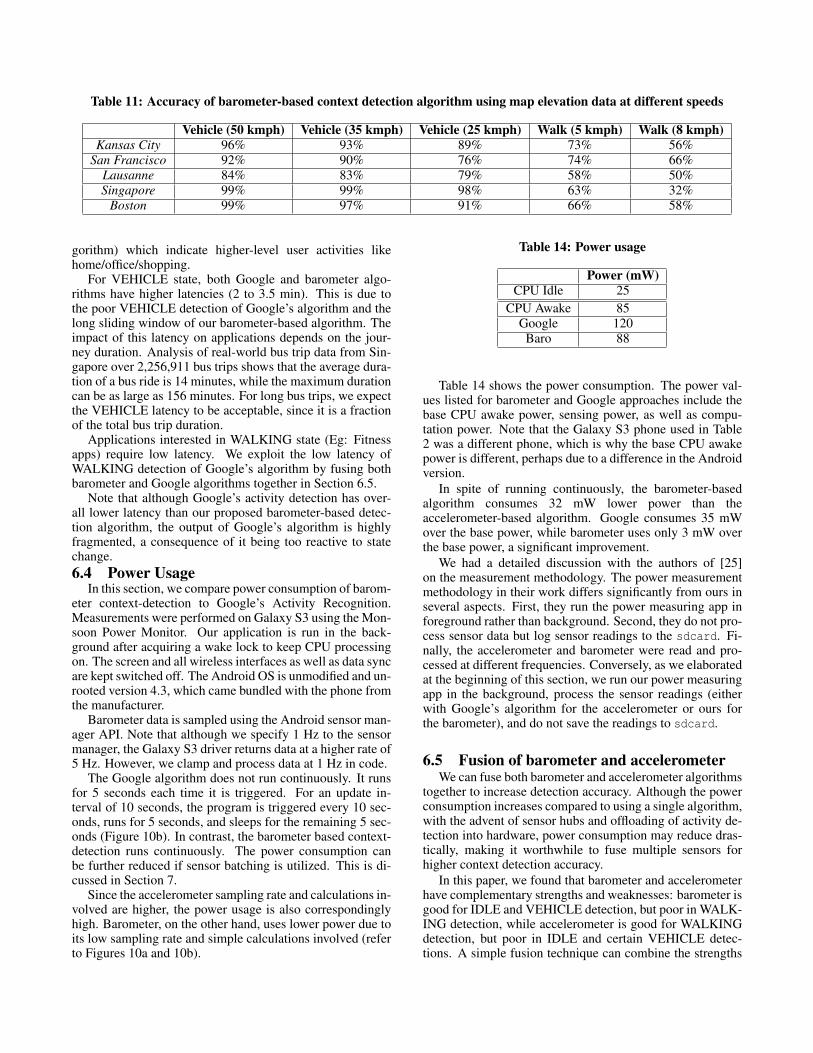
Table 11: Accuracy of barometer-based context detection algorithm using map elevation data at different speeds
Vehicle (50 kmph) Vehicle (35 kmph) Vehicle (25 kmph) Walk (5 kmph) Walk (8 kmph)Kansas City 96% 93% 89% 73% 56%
San Francisco 92% 90% 76% 74% 66%Lausanne 84% 83% 79% 58% 50%Singapore 99% 99% 98% 63% 32%
Boston 99% 97% 91% 66% 58%
gorithm) which indicate higher-level user activities likehome/office/shopping.
For VEHICLE state, both Google and barometer algo-rithms have higher latencies (2 to 3.5 min). This is due tothe poor VEHICLE detection of Google’s algorithm and thelong sliding window of our barometer-based algorithm. Theimpact of this latency on applications depends on the jour-ney duration. Analysis of real-world bus trip data from Sin-gapore over 2,256,911 bus trips shows that the average dura-tion of a bus ride is 14 minutes, while the maximum durationcan be as large as 156 minutes. For long bus trips, we expectthe VEHICLE latency to be acceptable, since it is a fractionof the total bus trip duration.
Applications interested in WALKING state (Eg: Fitnessapps) require low latency. We exploit the low latency ofWALKING detection of Google’s algorithm by fusing bothbarometer and Google algorithms together in Section 6.5.
Note that although Google’s activity detection has over-all lower latency than our proposed barometer-based detec-tion algorithm, the output of Google’s algorithm is highlyfragmented, a consequence of it being too reactive to statechange.6.4 Power Usage
In this section, we compare power consumption of barom-eter context-detection to Google’s Activity Recognition.Measurements were performed on Galaxy S3 using the Mon-soon Power Monitor. Our application is run in the back-ground after acquiring a wake lock to keep CPU processingon. The screen and all wireless interfaces as well as data syncare kept switched off. The Android OS is unmodified and un-rooted version 4.3, which came bundled with the phone fromthe manufacturer.
Barometer data is sampled using the Android sensor man-ager API. Note that although we specify 1 Hz to the sensormanager, the Galaxy S3 driver returns data at a higher rate of5 Hz. However, we clamp and process data at 1 Hz in code.
The Google algorithm does not run continuously. It runsfor 5 seconds each time it is triggered. For an update in-terval of 10 seconds, the program is triggered every 10 sec-onds, runs for 5 seconds, and sleeps for the remaining 5 sec-onds (Figure 10b). In contrast, the barometer based context-detection runs continuously. The power consumption canbe further reduced if sensor batching is utilized. This is di-cussed in Section 7.
Since the accelerometer sampling rate and calculations in-volved are higher, the power usage is also correspondinglyhigh. Barometer, on the other hand, uses lower power due toits low sampling rate and simple calculations involved (referto Figures 10a and 10b).
Table 14: Power usage
Power (mW)CPU Idle 25
CPU Awake 85Google 120
Baro 88
Table 14 shows the power consumption. The power val-ues listed for barometer and Google approaches include thebase CPU awake power, sensing power, as well as compu-tation power. Note that the Galaxy S3 phone used in Table2 was a different phone, which is why the base CPU awakepower is different, perhaps due to a difference in the Androidversion.
In spite of running continuously, the barometer-basedalgorithm consumes 32 mW lower power than theaccelerometer-based algorithm. Google consumes 35 mWover the base power, while barometer uses only 3 mW overthe base power, a significant improvement.
We had a detailed discussion with the authors of [25]on the measurement methodology. The power measurementmethodology in their work differs significantly from ours inseveral aspects. First, they run the power measuring app inforeground rather than background. Second, they do not pro-cess sensor data but log sensor readings to the sdcard. Fi-nally, the accelerometer and barometer were read and pro-cessed at different frequencies. Conversely, as we elaboratedat the beginning of this section, we run our power measuringapp in the background, process the sensor readings (eitherwith Google’s algorithm for the accelerometer or ours forthe barometer), and do not save the readings to sdcard.
6.5 Fusion of barometer and accelerometerWe can fuse both barometer and accelerometer algorithms
together to increase detection accuracy. Although the powerconsumption increases compared to using a single algorithm,with the advent of sensor hubs and offloading of activity de-tection into hardware, power consumption may reduce dras-tically, making it worthwhile to fuse multiple sensors forhigher context detection accuracy.
In this paper, we found that barometer and accelerometerhave complementary strengths and weaknesses: barometer isgood for IDLE and VEHICLE detection, but poor in WALK-ING detection, while accelerometer is good for WALKINGdetection, but poor in IDLE and certain VEHICLE detec-tions. A simple fusion technique can combine the strengths
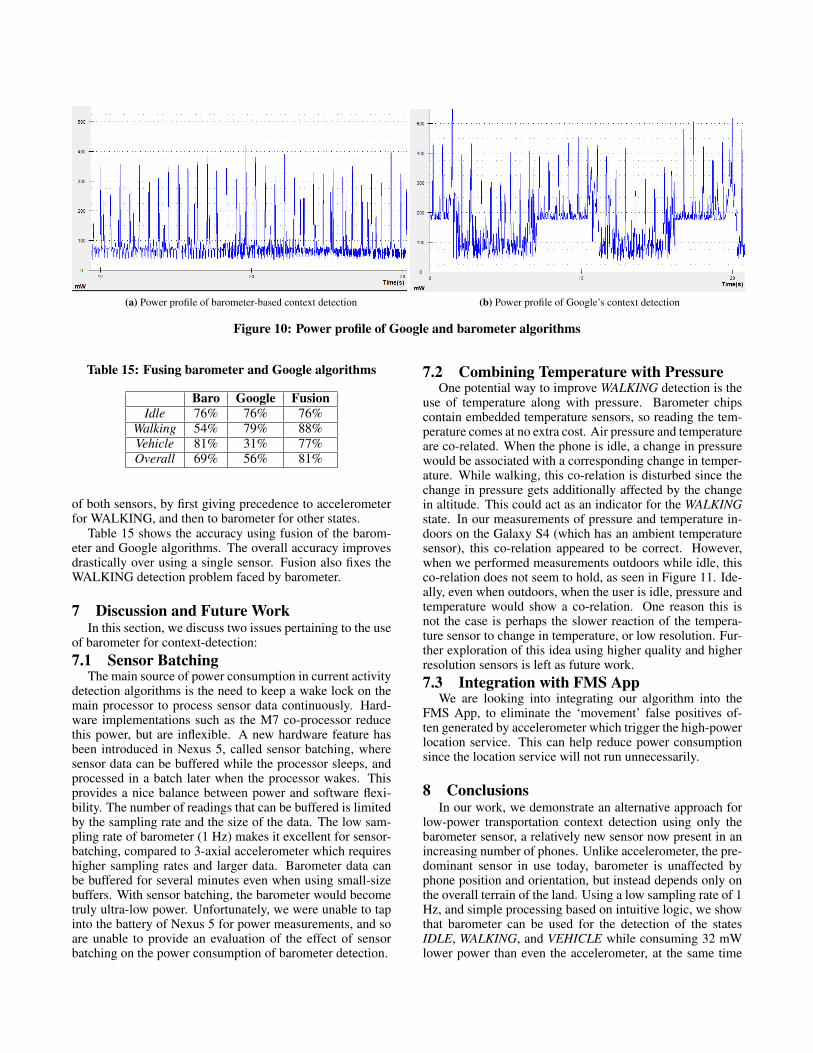
(a) Power profile of barometer-based context detection (b) Power profile of Google’s context detection
Figure 10: Power profile of Google and barometer algorithms
Table 15: Fusing barometer and Google algorithms
Baro Google FusionIdle 76% 76% 76%
Walking 54% 79% 88%Vehicle 81% 31% 77%Overall 69% 56% 81%
of both sensors, by first giving precedence to accelerometerfor WALKING, and then to barometer for other states.
Table 15 shows the accuracy using fusion of the barom-eter and Google algorithms. The overall accuracy improvesdrastically over using a single sensor. Fusion also fixes theWALKING detection problem faced by barometer.
7 Discussion and Future WorkIn this section, we discuss two issues pertaining to the use
of barometer for context-detection:7.1 Sensor Batching
The main source of power consumption in current activitydetection algorithms is the need to keep a wake lock on themain processor to process sensor data continuously. Hard-ware implementations such as the M7 co-processor reducethis power, but are inflexible. A new hardware feature hasbeen introduced in Nexus 5, called sensor batching, wheresensor data can be buffered while the processor sleeps, andprocessed in a batch later when the processor wakes. Thisprovides a nice balance between power and software flexi-bility. The number of readings that can be buffered is limitedby the sampling rate and the size of the data. The low sam-pling rate of barometer (1 Hz) makes it excellent for sensor-batching, compared to 3-axial accelerometer which requireshigher sampling rates and larger data. Barometer data canbe buffered for several minutes even when using small-sizebuffers. With sensor batching, the barometer would becometruly ultra-low power. Unfortunately, we were unable to tapinto the battery of Nexus 5 for power measurements, and soare unable to provide an evaluation of the effect of sensorbatching on the power consumption of barometer detection.
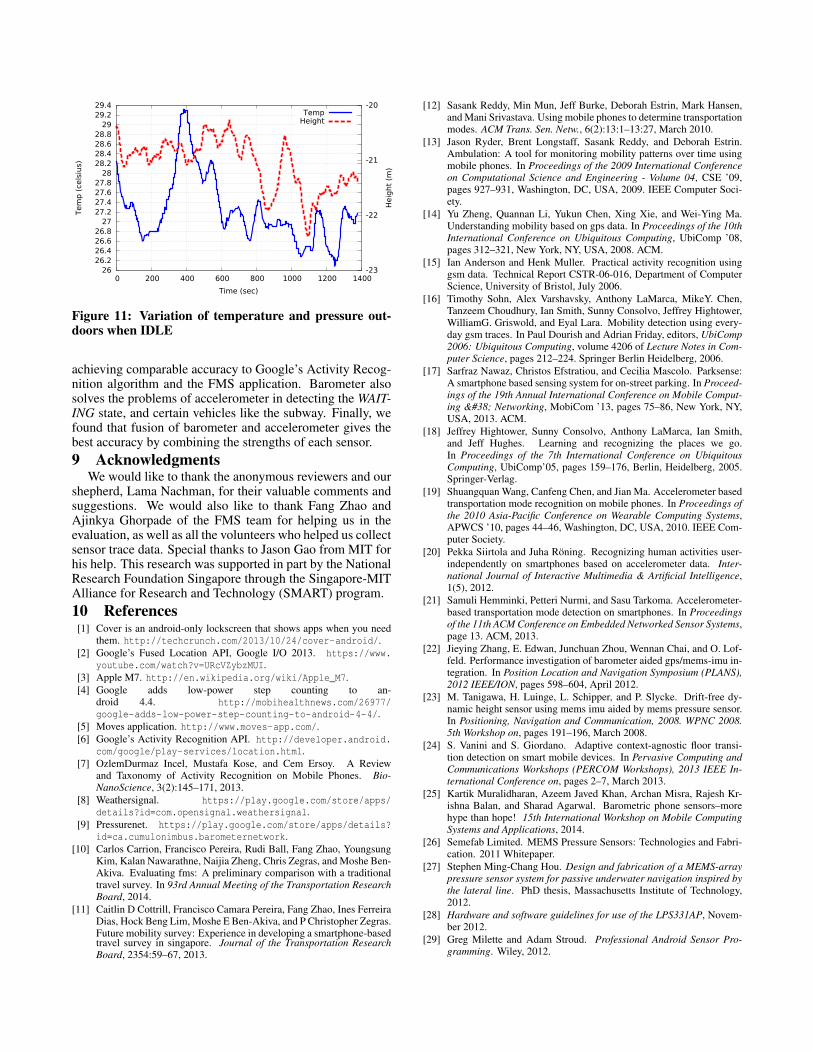
7.2 Combining Temperature with PressureOne potential way to improve WALKING detection is the
use of temperature along with pressure. Barometer chipscontain embedded temperature sensors, so reading the tem-perature comes at no extra cost. Air pressure and temperatureare co-related. When the phone is idle, a change in pressurewould be associated with a corresponding change in temper-ature. While walking, this co-relation is disturbed since thechange in pressure gets additionally affected by the changein altitude. This could act as an indicator for the WALKINGstate. In our measurements of pressure and temperature in-doors on the Galaxy S4 (which has an ambient temperaturesensor), this co-relation appeared to be correct. However,when we performed measurements outdoors while idle, thisco-relation does not seem to hold, as seen in Figure 11. Ide-ally, even when outdoors, when the user is idle, pressure andtemperature would show a co-relation. One reason this isnot the case is perhaps the slower reaction of the tempera-ture sensor to change in temperature, or low resolution. Fur-ther exploration of this idea using higher quality and higherresolution sensors is left as future work.7.3 Integration with FMS App
We are looking into integrating our algorithm into theFMS App, to eliminate the ‘movement’ false positives of-ten generated by accelerometer which trigger the high-powerlocation service. This can help reduce power consumptionsince the location service will not run unnecessarily.
8 ConclusionsIn our work, we demonstrate an alternative approach for
low-power transportation context detection using only thebarometer sensor, a relatively new sensor now present in anincreasing number of phones. Unlike accelerometer, the pre-dominant sensor in use today, barometer is unaffected byphone position and orientation, but instead depends only onthe overall terrain of the land. Using a low sampling rate of 1Hz, and simple processing based on intuitive logic, we showthat barometer can be used for the detection of the statesIDLE, WALKING, and VEHICLE while consuming 32 mWlower power than even the accelerometer, at the same time
26 26.2 26.4 26.6 26.8
27 27.2 27.4 27.6 27.8
28 28.2 28.4 28.6 28.8
29 29.2 29.4
0 200 400 600 800 1000 1200 1400-23
-22
-21
-20
Tem
p (
cels
ius)
Heig
ht
(m)
Time (sec)
TempHeight
Figure 11: Variation of temperature and pressure out-doors when IDLE
achieving comparable accuracy to Google’s Activity Recog-nition algorithm and the FMS application. Barometer alsosolves the problems of accelerometer in detecting the WAIT-ING state, and certain vehicles like the subway. Finally, wefound that fusion of barometer and accelerometer gives thebest accuracy by combining the strengths of each sensor.9 Acknowledgments
We would like to thank the anonymous reviewers and ourshepherd, Lama Nachman, for their valuable comments andsuggestions. We would also like to thank Fang Zhao andAjinkya Ghorpade of the FMS team for helping us in theevaluation, as well as all the volunteers who helped us collectsensor trace data. Special thanks to Jason Gao from MIT forhis help. This research was supported in part by the NationalResearch Foundation Singapore through the Singapore-MITAlliance for Research and Technology (SMART) program.10 References
[1] Cover is an android-only lockscreen that shows apps when you needthem. http://techcrunch.com/2013/10/24/cover-android/.
[2] Google’s Fused Location API, Google I/O 2013. https://www.youtube.com/watch?v=URcVZybzMUI.
[3] Apple M7. http://en.wikipedia.org/wiki/Apple_M7.[4] Google adds low-power step counting to an-
droid 4.4. http://mobihealthnews.com/26977/google-adds-low-power-step-counting-to-android-4-4/.
[5] Moves application. http://www.moves-app.com/.[6] Google’s Activity Recognition API. http://developer.android.
com/google/play-services/location.html.[7] OzlemDurmaz Incel, Mustafa Kose, and Cem Ersoy. A Review
and Taxonomy of Activity Recognition on Mobile Phones. Bio-NanoScience, 3(2):145–171, 2013.
[8] Weathersignal. https://play.google.com/store/apps/details?id=com.opensignal.weathersignal.
[9] Pressurenet. https://play.google.com/store/apps/details?id=ca.cumulonimbus.barometernetwork.
[10] Carlos Carrion, Francisco Pereira, Rudi Ball, Fang Zhao, YoungsungKim, Kalan Nawarathne, Naijia Zheng, Chris Zegras, and Moshe Ben-Akiva. Evaluating fms: A preliminary comparison with a traditionaltravel survey. In 93rd Annual Meeting of the Transportation ResearchBoard, 2014.
[11] Caitlin D Cottrill, Francisco Camara Pereira, Fang Zhao, Ines FerreiraDias, Hock Beng Lim, Moshe E Ben-Akiva, and P Christopher Zegras.Future mobility survey: Experience in developing a smartphone-basedtravel survey in singapore. Journal of the Transportation ResearchBoard, 2354:59–67, 2013.
[12] Sasank Reddy, Min Mun, Jeff Burke, Deborah Estrin, Mark Hansen,and Mani Srivastava. Using mobile phones to determine transportationmodes. ACM Trans. Sen. Netw., 6(2):13:1–13:27, March 2010.
[13] Jason Ryder, Brent Longstaff, Sasank Reddy, and Deborah Estrin.Ambulation: A tool for monitoring mobility patterns over time usingmobile phones. In Proceedings of the 2009 International Conferenceon Computational Science and Engineering - Volume 04, CSE ’09,pages 927–931, Washington, DC, USA, 2009. IEEE Computer Soci-ety.
[14] Yu Zheng, Quannan Li, Yukun Chen, Xing Xie, and Wei-Ying Ma.Understanding mobility based on gps data. In Proceedings of the 10thInternational Conference on Ubiquitous Computing, UbiComp ’08,pages 312–321, New York, NY, USA, 2008. ACM.
[15] Ian Anderson and Henk Muller. Practical activity recognition usinggsm data. Technical Report CSTR-06-016, Department of ComputerScience, University of Bristol, July 2006.
[16] Timothy Sohn, Alex Varshavsky, Anthony LaMarca, MikeY. Chen,Tanzeem Choudhury, Ian Smith, Sunny Consolvo, Jeffrey Hightower,WilliamG. Griswold, and Eyal Lara. Mobility detection using every-day gsm traces. In Paul Dourish and Adrian Friday, editors, UbiComp2006: Ubiquitous Computing, volume 4206 of Lecture Notes in Com-puter Science, pages 212–224. Springer Berlin Heidelberg, 2006.
[17] Sarfraz Nawaz, Christos Efstratiou, and Cecilia Mascolo. Parksense:A smartphone based sensing system for on-street parking. In Proceed-ings of the 19th Annual International Conference on Mobile Comput-ing & Networking, MobiCom ’13, pages 75–86, New York, NY,USA, 2013. ACM.
[18] Jeffrey Hightower, Sunny Consolvo, Anthony LaMarca, Ian Smith,and Jeff Hughes. Learning and recognizing the places we go.In Proceedings of the 7th International Conference on UbiquitousComputing, UbiComp’05, pages 159–176, Berlin, Heidelberg, 2005.Springer-Verlag.
[19] Shuangquan Wang, Canfeng Chen, and Jian Ma. Accelerometer basedtransportation mode recognition on mobile phones. In Proceedings ofthe 2010 Asia-Pacific Conference on Wearable Computing Systems,APWCS ’10, pages 44–46, Washington, DC, USA, 2010. IEEE Com-puter Society.
[20] Pekka Siirtola and Juha Roning. Recognizing human activities user-independently on smartphones based on accelerometer data. Inter-national Journal of Interactive Multimedia & Artificial Intelligence,1(5), 2012.
[21] Samuli Hemminki, Petteri Nurmi, and Sasu Tarkoma. Accelerometer-based transportation mode detection on smartphones. In Proceedingsof the 11th ACM Conference on Embedded Networked Sensor Systems,page 13. ACM, 2013.
[22] Jieying Zhang, E. Edwan, Junchuan Zhou, Wennan Chai, and O. Lof-feld. Performance investigation of barometer aided gps/mems-imu in-tegration. In Position Location and Navigation Symposium (PLANS),2012 IEEE/ION, pages 598–604, April 2012.
[23] M. Tanigawa, H. Luinge, L. Schipper, and P. Slycke. Drift-free dy-namic height sensor using mems imu aided by mems pressure sensor.In Positioning, Navigation and Communication, 2008. WPNC 2008.5th Workshop on, pages 191–196, March 2008.
[24] S. Vanini and S. Giordano. Adaptive context-agnostic floor transi-tion detection on smart mobile devices. In Pervasive Computing andCommunications Workshops (PERCOM Workshops), 2013 IEEE In-ternational Conference on, pages 2–7, March 2013.
[25] Kartik Muralidharan, Azeem Javed Khan, Archan Misra, Rajesh Kr-ishna Balan, and Sharad Agarwal. Barometric phone sensors–morehype than hope! 15th International Workshop on Mobile ComputingSystems and Applications, 2014.
[26] Semefab Limited. MEMS Pressure Sensors: Technologies and Fabri-cation. 2011 Whitepaper.
[27] Stephen Ming-Chang Hou. Design and fabrication of a MEMS-arraypressure sensor system for passive underwater navigation inspired bythe lateral line. PhD thesis, Massachusetts Institute of Technology,2012.
[28] Hardware and software guidelines for use of the LPS331AP, Novem-ber 2012.
[29] Greg Milette and Adam Stroud. Professional Android Sensor Pro-gramming. Wiley, 2012.