Embed Size (px)
Citation preview

University of Central Florida University of Central Florida
STARS STARS
Electronic Theses and Dissertations, 2004-2019
2017
Using Molecular Genetic and Demographic Tools to Improve Using Molecular Genetic and Demographic Tools to Improve
Management of Ex Situ Avian Populations Management of Ex Situ Avian Populations
Gina Ferrie University of Central Florida
Part of the Integrative Biology Commons
Find similar works at: https://stars.library.ucf.edu/etd
University of Central Florida Libraries http://library.ucf.edu
This Doctoral Dissertation (Open Access) is brought to you for free and open access by STARS. It has been accepted
for inclusion in Electronic Theses and Dissertations, 2004-2019 by an authorized administrator of STARS. For more
information, please contact [email protected].
STARS Citation STARS Citation Ferrie, Gina, "Using Molecular Genetic and Demographic Tools to Improve Management of Ex Situ Avian Populations" (2017). Electronic Theses and Dissertations, 2004-2019. 5709. https://stars.library.ucf.edu/etd/5709

USING MOLECULAR GENETIC AND DEMOGRAPHIC TOOLS TO IMPROVE MANAGEMENT OF EX SITU AVIAN POPULATIONS
by
GINA M. FERRIE B.A. Dartmouth College, 2004
M.A. Columbia University, 2007
A dissertation submitted in partial fulfillment of the requirements for the degree of Doctor of Philosophy
in the Department of Biology in the College of Sciences
at the University of Central Florida Orlando, Florida
Spring Term 2017
Major Professor: Eric A. Hoffman

ii
© 2017 Gina M. Ferrie

iii
ABSTRACT
Small populations, specifically those that are isolated from others, are more
prone to extinction than larger inter-connected populations. The risks that these small
isolated populations face include loss of genetic diversity due to founder effects and
inbreeding due to population bottlenecks, as well as demographic uncertainty due to
fluctuating fecundity and mortality rates and impacts of external environmental factors.
Ex situ populations, including those managed as conservation breeding programs with
species recovery aims, as well as those that do not have reintroduction goals but are
managed for long term population sustainability, suffer from the same extinction risks as
small and isolated natural populations. Using three separate avian species which have
different life histories and population structures, I investigated impacts of multiple
genetic and demographic management strategies on these ex situ populations. I
examined the use of molecular genetic datasets including microsatellites and single
nucleotide polymorphisms (SNPs) to determine their utility for reconstructing pedigrees,
examining individual relatedness within populations, and compared results of measuring
genetic diversity through theoretical methods verses those obtained from a molecular
dataset. These methods can then ultimately be applied to improve future management
including improving studbook datasets and to measure actual loss of genetic diversity. I
also used analytical strategies including population viability analysis to determine how
management practices influence demographic parameters and determine the future
probability of population extinction. The genetic and demographic analyses of both the

iv
historic management of an ex situ population, and its current status, are a first step in
hypothesizing the potential directions for future management and understanding the
likelihood of survival of an ex situ population.

v
ACKNOWLEDGMENTS
Throughout the last six to seven years of my academic journey, more people
than I can count have touched aspects of my academic and professional life. I hope that
I have expressed my gratitude to everyone along the way, for I am sure to miss people
here. I must start of course with my advisor Eric Hoffman, for welcoming me to his lab
and to UCF, and for providing me a challenging environment beyond my expectations.
Thanks to my committee members - Chris Parkinson and Pedro Quintana-Ascencio for
asking tough questions about my research, but also for always encouraging me. I am
indebted to Tammie Bettinger, for opening the door to this opportunity and many others.
Also, special thanks to the leadership at Disney’s Animal Kingdom® for providing
financial support so I could complete this research and for investing in me.
I need to thank the many Hoffman and Parkinson labmates that have come and
gone and who have all made me a better scientist and have shown me a supporting
environment that is focused on doing amazing research – kudos and thanks especially
to Sarah May, Alexa Trujillo, Alyson Fenwick, Jason Strickland, Jason Hickman, Greg
Territo, and MANY others.
My Disney and AZA family have made me love what I do and make me strive to
be better – not just for them, but for all the animals and species that need our care for
their future.

vi
Everyone needs those people that will be there for everything – Alison Grand and
Christie Eddie – thanks for being my best friends in every situation and I wish I had
more of you my life every day.
And finally, my parents, Ralph and Adrienne, have given me everything and
more.

vii
TABLE OF CONTENTS
LIST OF FIGURES ..........................................................................................................xi
LIST OF TABLES .......................................................................................................... xiii
CHAPTER ONE: INTRODUCTION ................................................................................. 1
References ................................................................................................................... 6
CHAPTER TWO: IDENTIFYING PARENTAGE USING MOLECULAR MARKERS:
IMPROVING ACCURACY OF STUDBOOK RECORDS FOR A CAPTIVE FLOCK OF
MARABOU STORKS (LEPTOPTILUS CRUMENIFERUS) ........................................... 10
Abstract ...................................................................................................................... 10
Introduction ................................................................................................................ 11
Materials and Methods ............................................................................................... 16
Study Subjects ........................................................................................................ 16
Sample Collection and DNA Extraction .................................................................. 16
Microsatellite Development and Genotyping .......................................................... 17
Basic Genetic Parameters ...................................................................................... 19
Parentage Analysis ................................................................................................. 19
Results ....................................................................................................................... 22
Discussion.................................................................................................................. 28
Conclusions ............................................................................................................... 33
Acknowledgments ...................................................................................................... 34
References ................................................................................................................. 35

viii
CHAPTER THREE: USING BEHAVIORAL OBSERVATIONS AND GENETIC
MARKERS TO CHARACTERIZE THE FLEXIBLE REPRODUCTIVE SYSTEM IN AN
EX SITU POPULATION OF CARMINE BEE-EATERS (MEROPS N. NUBICUS) ......... 41
Abstract ...................................................................................................................... 41
Introduction ................................................................................................................ 42
Materials and Methods ............................................................................................... 46
Study Species ......................................................................................................... 46
Behavioral Data Collection ..................................................................................... 47
Behavioral Analyses ............................................................................................... 48
Genetic Data Collection .......................................................................................... 49
Genetic Analyses .................................................................................................... 51
Application of Genetic Analyses to Investigate Behavior ........................................ 54
Results ....................................................................................................................... 55
Behavioral Analyses ............................................................................................... 55
Genetic Analyses .................................................................................................... 59
Application of Genetic Analyses to Investigate Behavior ........................................ 60
Discussion.................................................................................................................. 63
Acknowledgments ...................................................................................................... 69
References ................................................................................................................. 70
CHAPTER FOUR: USING A MOLECULAR GENETIC DATASET TO UNDERSTAND
POPULATION GENETIC HISTORY IN AN EX SITU MANAGED POPULATION OF
GUAM KINGFISHERS (TODIRAMPHUS CINNAMOMINUS) ....................................... 76

ix
Introduction ................................................................................................................ 76
Materials and Methods ............................................................................................... 83
Study Species ......................................................................................................... 83
Sample Collection and DNA Extraction .................................................................. 85
SNP Genotyping and Analysis ................................................................................ 86
Parentage Assignment ........................................................................................... 88
Family Cluster Analysis .......................................................................................... 90
Persistence of Gene Diversity................................................................................. 91
Results ....................................................................................................................... 92
Parentage Assignment ........................................................................................... 93
Family Cluster Analysis .......................................................................................... 95
Persistence of Gene Diversity................................................................................. 97
Discussion................................................................................................................ 100
Acknowledgments .................................................................................................... 106
References ............................................................................................................... 107
CHAPTER FIVE: POPULATION VIABILITY ANALYSIS FOR A SPECIES THAT IS
EXTINCT IN THE WILD: CONSIDERATIONS FOR MAINTAINING THE EX SITU
POULATION OF GUAM KINGFISHER (TODIRAMPHUS CINNAMOMINUS) ............ 118
Introduction .............................................................................................................. 118
Methods ................................................................................................................... 125
Demographic Parameters and Parameterization of Life Table ............................. 125
Viability Analysis of Ex Situ Population ................................................................. 128

x
Results ..................................................................................................................... 138
Discussion................................................................................................................ 146
References ............................................................................................................... 152
CHAPTER SIX: CONCLUSION AND SIGNIFICANCE ................................................ 160
References ............................................................................................................... 163
APPENDIX A: CHAPTER TWO LICENSE TERMS AND CONDITIONS ..................... 165
APPENDIX B: CHAPTER THREE SUPPORTING INFORMATION ............................ 172
Supporting Information – Expanded Methods and Results for Molecular Data
Collection and Parentage Analysis .......................................................................... 173
Genetic Data Collection ........................................................................................ 173
Parentage and Relatedness Analysis ................................................................... 175
Results ..................................................................................................................... 178
References ............................................................................................................... 180
APPENDIX C: GUAM KINGFISHER GENETIC SAMPLING INFORMATION ............. 182
Guam Kingfisher Genetic Samples .......................................................................... 183

xi
LIST OF FIGURES
Figure 1. Pedigree of Disney’s Animal Kingdom® marabou stork (Leptoptilus crumeniferus) flock based on COLONY [v2.0.3.0; Wang and Santure, 2009] best configuration results, paternity, maternity, full sib-ship and half sib-ship assignments. Individuals sampled for genetic analyses are labeled within squares (males), circles (females), and triangles (unknown sex). Year of hatch is listed below individual number. Probabilities of assignment for sires are to the left of the offspring node, and for dams to the right of the offspring node. Probability of assignment for full-siblings (FS) and half-siblings (HS) are below pedigree. Stars () represent relationships in the genetic pedigree that do not match the studbook records. These differences are numbered, and are discussed in the text in numerical order. * represents either unsampled putative sire or relationship unsubstantiated by genetic analyses (see text), # represents unsampled putative dams or relationship unsubstantiated by genetic analyses. In the case where a putative sire or dam is listed in the studbook, these are included under the * or #. ....... 27
Figure 2. Photo of adult carmine bee-eaters (Merops n. nubicus) visiting a nest cavity.48
Figure 3. Total enters to and exits of each nest tunnel per individual bird by year. The birds that had the highest number of enters/exits combined per year were considered the social parent of the eggs/chicks in the nest. Gray highlighted nest tunnels are those that had eggs/chicks present. The male and female with the most enters/exits to each nest are identified by ♂ and ♀ symbols. ........................................................................ 56
Figure 4. Average time in nest per entrance/exit (min hr-1) of all males and females during three nesting phases: excavation (M = 10, F = 10), incubation (M = 13, F = 11), and chick rearing (M = 10, F = 10). Mean ± SE for each phase. ................................... 58 Figure 5. A) Change in heterozygosity over time in the Guam kingfisher SSP from founding (1985) to current (2016) as determined by pedigree analysis from the studbook (left y-axis) and molecular analysis using SNPs (right y-axis). GD = gene diversity calculated as GD = 1 – MK where MK is the mean kinship of the population (Lacy 1995) calculated from the studbook of the birds living on 1 January of each year. HO = observed heterozygosity. uHE = unbiased expected heterozygosity. HO and uHE calculated from birds in the SNP dataset living on 1 January of each year. SNPs have a maximum of 0.5 as a biallelic marker. B) Change in heterozygosity over time as measures as a difference from the maximum value. ..................................................... 98 Figure 6. Change in heterozygosity over time in the Guam kingfisher SSP from founding to current (2016) as determined by pedigree analysis from the studbook. The bottom line represents the pedigree as it is used in current analyses and projections, which considers two sets of founders related as determined by Haig et al. (2015). The bottom line represents the loss of gene diversity if all founders were considered unrelated. .. 100

xii
Figure 7. Census of Guam kingfisher Species Survival Plan® population from 1984-1986. Census was taken on the last day of every year. .............................................. 126 Figure 8. Distribution of number of clutches per female per year from 1984-2016. ..... 131 Figure 9. Comparison of individual inbreeding level and survival to 30 days (A) or to one year (B) in all hatches in the Guam kingfisher population from 1984-2016. ................ 135 Figure 10. Baseline and Carrying Capacity Scenarios demonstrating predicted population size at the end of 100 years for the Guam kingfisher SSP®. ...................... 140 Figure 11. Sensitivity analysis of infant mortality on population probability of extinction in Guam kingfishers. ....................................................................................................... 142 Figure 12. Sensitivity analysis of adult female mortality on population probability of extinction in Guam kingfishers. ................................................................................... 143
Figure 13. Sensitivity analysis of adult male mortality on population probability of extinction in Guam kingfishers. ................................................................................... 144
Figure 14. Sensitivity analysis of percent of females breeding on population probability of extinction in Guam kingfishers. ............................................................................... 145

xiii
LIST OF TABLES
Table 1. Characterization of five microsatellite loci used in marabou stork (Leptoptilus crumeniferus) identity and parentage analysis. ............................................................. 23
Table 2. Sires and dams of offspring hatched in the Disney’s Animal Kingdom® marabou stork (Leptoptilus crumeniferus) flock determined from the studbook data [Schutz, 2011], and three methods of parentage assignment. .................................................... 25 Table 3. Characterization of eight microsatellite loci used in carmine bee-eater (Merops n. nubicus) identity and parentage analysis. Loci were amplified using PCR conditions described in the text. Three loci (identified by the symbol ‡) were originally identified in Dasmahapatra et al. 2004. Loci are sorted by rank of cumulative unbiased probability of identity (PI), which was calculated using Gimlet v1.33 (Valière 2002). Number of alleles and allelic richness (based on minimum sample size of 47 diploid individuals) were calculated with FSTAT 2.9.3 (Goudet 1995). Expected and observed heterozygosity were calculated in Gimlet v1.33. The asterisk (*) in the primer sequence denotes a 5’ tail (TGTAAAACGACGGCCAGT) attached to the primer sequence; + in the repeat motif represents an imperfect repeat in the sequence; Ta, annealing temperature; Hexp, expected heterozygosity; Hobs, observed heterozygosity; PIunbiased, unbiased probability of identity; PISIB, probability of identity in a population of all siblings. Note that values for PIunbiased and PISIB are cumulative, such that the value listed for Mnub104 is the cumulative effect of all loci. NE-PP is the non-exclusion probability of the parent pair from CERVUS (Kalinowski et al. 2007) results. ............................................................. 52
Table 4. Summary of parentage assignments from CERVUS 3.0 (Kalinowski et al. 2007). ............................................................................................................................ 94 Table 5. Best family cluster analysis of the birds sampled from the first and second generation from COLONY analyses (v 2.0; Jones and Wang 2009). Prob = probability of cluster, Father and Mother inferred from parentage analysis, SB# = studbook number of individual, Sire and Dam from studbook, Gen = generation from wild based on dam’s lineage, Founder = list of founders each individual is descended from based on pedigree analysis. ......................................................................................................... 96 Table 6. Sampling numbers and percentage of population sampled from the Guam kingfisher SSP from birds living on 1 January of six different time periods. Overall summary statistics from population genetic analyses of the molecular dataset are also presented. ..................................................................................................................... 99 Table 7. Guam kingfisher life table with demographic data of ex situ population from 1980-2016. .................................................................................................................. 127
xiv
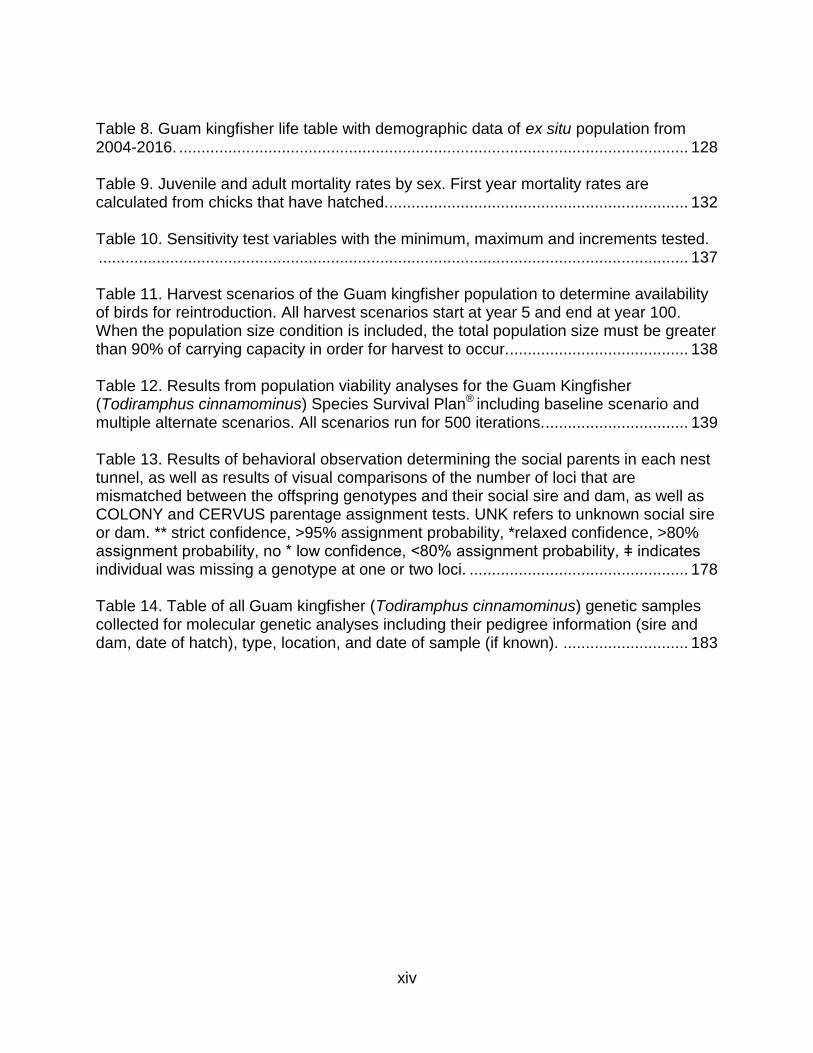
Table 8. Guam kingfisher life table with demographic data of ex situ population from 2004-2016. .................................................................................................................. 128 Table 9. Juvenile and adult mortality rates by sex. First year mortality rates are calculated from chicks that have hatched. ................................................................... 132 Table 10. Sensitivity test variables with the minimum, maximum and increments tested. .................................................................................................................................... 137
Table 11. Harvest scenarios of the Guam kingfisher population to determine availability of birds for reintroduction. All harvest scenarios start at year 5 and end at year 100. When the population size condition is included, the total population size must be greater than 90% of carrying capacity in order for harvest to occur. ........................................ 138 Table 12. Results from population viability analyses for the Guam Kingfisher (Todiramphus cinnamominus) Species Survival Plan® including baseline scenario and multiple alternate scenarios. All scenarios run for 500 iterations. ................................ 139 Table 13. Results of behavioral observation determining the social parents in each nest tunnel, as well as results of visual comparisons of the number of loci that are mismatched between the offspring genotypes and their social sire and dam, as well as COLONY and CERVUS parentage assignment tests. UNK refers to unknown social sire or dam. ** strict confidence, >95% assignment probability, *relaxed confidence, >80% assignment probability, no * low confidence, <80% assignment probability, ǂ indicates individual was missing a genotype at one or two loci. ................................................. 178 Table 14. Table of all Guam kingfisher (Todiramphus cinnamominus) genetic samples collected for molecular genetic analyses including their pedigree information (sire and dam, date of hatch), type, location, and date of sample (if known). ............................ 183

1
CHAPTER ONE: INTRODUCTION
Genetic diversity of small and isolated populations is greatly reduced by founder
effects and inbreeding due to population bottlenecks. The amount of diversity lost
depends on many factors, including the severity of the bottleneck, the size of the
founding population, the population growth, and mutation rates (Bouzat 2010, Wright
1931). As wildlife populations become smaller, a number of interacting stochastic
processes can destabilize populations, including genetic effects (inbreeding and loss of
adaptability) and volatility of the breeding structure (sex ratio imbalances, unstable age
distribution, and disrupted social systems) (Lacy 2000). In small populations, inbreeding
can greatly reduce the average individual fitness, and loss of genetic variability or
genetic erosion from random genetic drift can diminish future adaptability to a changing
environment (Bijlsma and Loeschcke 2012, Lande 1988). Maintenance of genetic
diversity is of particular concern for bottlenecked species, since population bottlenecks
may reduce the amount of genetic variation and consequently result in lowered fitness,
reduced potential for future adaptation, as well as elevated extinction rates (Jamieson
2015, Zhang et al. 2006).
Small populations, specifically those that are isolated from others such as island
populations, are more prone to extinction than larger inter-connected, or mainland
populations. For example, island endemic species typically have higher extinction rates
than non-endemic species (Frankham 1998, Loehle and Eschenbach 2011, Rybicki and
Hanski 2013). When immigration rates into isolated or insular populations are
sufficiently high, extinction rates are reduced (Brown and Kodric-Brown 1977). This is

2
due to the demographic and genetic contributions of immigrants which increase the size
and fitness of these populations, therefore reducing their probability of extinction (Brown
and Kodric-Brown 1977). Small populations, including insular species, typically suffer
increased inbreeding relative to large populations or meta-populations due to
bottlenecks at foundation and lower subsequent population sizes (Frankham 1998).
Evidence indicates that the majority of threatened species, including island endemics,
have lower genetic diversity than taxonomically related non-threatened species,
implying that factors such as inbreeding can increase the probability of extinction before
extinction events occur (Jamieson 2007). There is compelling evidence that inbreeding
depression and loss of genetic variation lead to increased extinction risk in laboratory
populations, and that inbreeding depression in wild populations can affect population
growth rates which ultimately contributes to population extinction risk (Frankham 2005,
Frankham et al. 2014, Hedrick and Garcia-Dorado 2016).
Despite having the ability to fly and seeming ease of dispersal, avian species are
at great risk for extinction, with more than 13% of all species considered threatened
(IUCN 2015). Those species predicted to be at highest risk of extinction are those found
in the geographic regions with high species richness, including most tropical regions, as
well as those species that are non-migratory or insular (Lee and Jetz 2011, Loehle and
Eschenbach 2011). Additionally, species-specific life history characteristics may impact
extinction risk in birds, including those with large body size, reduced fecundity, and/or
slow development (Bennett and Owens 1997; Lee and Jetz 2011). Most avian
extinctions within the past 200 years have been of insular species, with the causes of
extinction for these species including introduced predators, competitors, or disease

3
(Savidge 1987; Freed et al. 2008; Loehle and Eschenbach 2011). Avian species on
islands and those that exist in small populations continue to decline and lose suitable
habitat and therefore many species may become reliant on ex situ reproduction,
supplementation, or reintroduction to sustain them (Collar and Butchart 2014).
Ex situ populations, including those managed as conservation breeding
programs with species recovery aims, as well as those that do not have reintroduction
goals but are managed for long term population sustainability, suffer from the same
extinction risks as small, isolated natural populations. Small populations brought into ex
situ environments often experience a secondary bottleneck due to limited number of
founders and the inevitable inbreeding and genetic drift that occurs in populations with
extremely low or no migration. While theoretical models of loss of gene diversity have
long been used to document the loss of hypothetical alleles in ex situ managed
populations, measuring the direct loss through time of genetic diversity at the molecular
level has not yet been examined. The most commonly used models used to manage ex
situ populations and their loss or maintenance of gene diversity require a known
pedigree, or the ancestral linkages between individuals, to calculate genetic
characteristics of the population (Attard et al. 2016, Hammerly et al. 2013, Lacy 1995,
Lacy et al. 1995). There is also a lack of empirical evidence to address the assumptions
present in the theoretical models used to calculate loss of gene diversity. In most cases,
ex situ conservation projects do not incorporate genetic analyses prior to initiation, and
can thus suffer from inbreeding and/or outbreeding depression (Witzenberger and
Hochkirch 2011). Future ex situ management programs should aim to incorporate
measures of genetic diversity including founder relationships, observed and expected

4
heterozygosities, and inbreeding levels prior to establishing the population
(Witzenberger and Hochkirch 2011). Furthermore, detailed long-term viability analyses
of ex situ managed populations are few, and rarely do these studies look closely at the
genetic impacts of viability by incorporating measures of inbreeding depression and
projecting future loss of genetic diversity at the molecular or allelic level. Understanding
the processes contributing to loss of population viability and developing methods to
maintain the current levels of genetic diversity in small populations of both ex situ and
declining wild populations takes on immediate importance (Jamieson 2015, Haig and
Ballou 1995).
In this dissertation, I aimed to investigate impacts of genetic and demographic
management strategies on small ex situ populations of avian species. I first examined
the impacts that incorrect pedigree information can have on understanding relationships
and studbook data in a small flock of marabou stork (Leptoptilus crumeniferus; Ferrie et
al. 2013). Next, I examined the use of microsatellites to understand relationships in a
flock of carmine bee-eater (Merops n. nubicus). Because of species-specific behaviors
such as extra-pair fertilizations, mating multiply, and intraspecific nest parasitism, this
population has a completely unknown pedigree. I examined how behavior and genetic
relatedness information can help elucidate demographic and genetic characteristics of
this flock. Next, I examined the use of a genome-wide scan of molecular markers (single
nucleotide polymorphisms or SNPs) in a known pedigree population for a species that is
extinct in the wild and managed for eventual release or reintroduction, the Guam
kingfisher (Todiramphus cinnamominus). I examined the congruence between the
known pedigree and parentage assignment software using SNPs, as well as compared

5
the rate of loss of gene diversity when using the theoretical pedigree methods
compared to the measures of gene diversity obtained from the SNP information. As
current management strategies for ex situ populations are based on theoretical models,
there is often a demonstrated need to incorporate molecular genetic studies in ex situ
management and to validate those theoretical models with molecular data
(Witzenberger and Hochkirk 2011). Finally, I combined demographic factors such as
fecundity and mortality, husbandry factors such as management of clutch size, and
genetic factors including inbreeding depression and loss of gene diversity to develop a
model of population viability for the Guam kingfisher. Most current PVA-based risk
assessments ignore or do not adequately model genetic factors such as inbreeding
depression and genetic impacts on evolutionary potential (Frankham et al. 2014). This
work is paramount, as proper models of population viability which incorporate multiple
aspects of management including genetic data, impacts of inbreeding depression, and
husbandry factors, are rare and underutilized in studying small, closed populations,
such as those maintained in an ex situ setting or those populations which will serve as
the sole source for a future reintroduction. With the widespread evidence for increasing
extinction rates of taxa and the increasing impacts of climate change, new ex situ
approaches which are effectively integrated with in situ strategies becoming even more
necessary to conserve species (Pritchard et al. 2012). Overall, these studies show how
genetic information can and should be used to inform genetic decisions for reproductive
management as well as to evaluate loss of gene diversity which translates to eventual
loss of adaptive potential in ex situ managed programs. In addition, genetic and
demographic parameters should be incorporated into PVAs to provide insights into the

6
persistence of species and how that persistence might change if individuals are
removed to re-found a natural population.
References
Attard CRM, Möller LM, Sasaki M, Hammer MP, Bice CM, Brauer CJ, Carvalho DC,
Harris JO, Beheregaray LB. 2016. A novel holistic framework for genetic-based
captive-breeding and reintroduction programs. Conservation Biology 30: 1060-
1069.
Bennett PM, Owens IPF. 1997. Variation in extinction risk among birds: chance or
evolutionary predisposition? Proc. R. Soc. Lond. B. 264: 401-408.
Bijlsma R, Loeschcke V. 2012. Genetic erosion impedes adaptive responses to stressful
environments. Evolutionary Applications 5: 117-129.
Bouzat J. 2010. Conservation genetics of population bottlenecks: the role of chance,
selection, and history. Conservation Genetics 11: 463-478.
Brown JH, Kodric-Brown A. 1977. Turnover rates in insular biogeography: effect of
immigration on extinction. Ecology 58: 445-449.
Collar NJ, Butchart SHM. 2014. Conservation breeding and avian diversity: chances
and challenges. International Zoo Yearbook 48: 7-28.
Ferrie GM, Cohen OR, Schutz P, Leighty KA, Plasse C, Bettinger TL, Hoffman EA.
2013. Identifying parentage using molecular markers: improving accuracy of
studbook records for a captive flock of marabou storks (Leptoptilus
crumeniferus). Zoo Biology 32: 556-564.

7
Frankham R. 1998. Inbreeding and Extinction: Island Populations. Conservation Biology
12(3): 665-675.
Frankham R. 2005. Genetics and extinction. Biol. Conserv. 126: 131-140.
Frankham R, Bradshaw CJA, Brook BW. 2014. Genetics in conservation management:
Revised recommendations of the 50/500 rules, Red List criteria and population
viability analyses. Biological Conservation 170: 56-63.
Freed LA, Cann RL, Bodner GR. 2008. Incipient extinction of a major population of the
Hawaii akepa owing to introduced species. Evolutionary Ecology Research 10:
931-965.
Haig SM, Ballou JD. 1995. Genetic diversity in two avian species formerly endemic to
Guam. The Auk 112: 445-455.
Hammerly SC, Morrow ME, Johnson JA. 2013. A comparison of pedigree- and DNA-
based measures for identifying inbreeding depression in the critically endangered
Attwater’s Prairie-chicken. Molecular Ecology 22: 5313-5328.
Hedrick PW, Garcia-Dorado A. 2016. Understanding inbreeding depression, purging,
and genetic rescue. Trends in Ecology and Evolution 12: 940-952.
IUCN. 2015. The IUCN Red List of Threatened Species. Accessed at:
http://www.iucnredlist.org/.
Jamieson IG. 2015. Significance of population genetics for managing small natural and
reintroduced populations in New Zealand. New Zealand Journal of Ecology 39: 1-
18.
Jamieson IG. 2007. Has the debate over genetics and extinction of island endemics
truly been resolved? Animal Conservation 10: 139-144.

8
Lacy RC. 2000. Considering threats to the viability of small populations using individual-
based models. Ecological Bulletins 48: 39-51.
Lacy RC. 1995. Clarificatio of genetic terms and their use in the management of captive
populations. Zoo Biology 14: 565-578.
Lacy RC, Ballou JD, Princée F, Starfield A, Thompson EA. 1995. Pedigree analysis for
population management. In: Ballou JD, Gilpin M, Foose TJ. (Eds.). Population
Management for Survival and Recovery: Analytical Methods and Strategies in
Small Population Conservation. Columbia University Press: New York. Pp. 57-
75.
Lande R. 1988. Genetics and demography in biological conservation. Science 241:
1455-1460.
Lee TM, Jetz W. 2011. Unravelling the structure of species extinction risk for predictive
conservation science. Proc. R. Soc. Lon. B. 278: 1329-1338.
Loehle C, Eschenbach W. 2011. Historical bird and terrestrial mammal extinction rates
and causes. Diversity and Distributions 18: 84-91.
Pritchard DJ, Fa JE, Oldfield S, Harrop SR. 2012. Bring the captive closer to the wild:
redefining the role of ex situ conservation. Oryx 46: 18-23.
Rybicki J, Hanski I. 2013. Species-area relationships and extinctions caused by habitat
loss and fragmentation. Ecology Letters 16: 27-38.
Savidge JA. 1987. Extinction of an island forest avifauna by an introduced snake.
Ecology 68(3): 660-668.

9
Witzenberger KA, Hochkirch A. 2011. Ex situ conservation genetics: a review of
molecular studies on the genetic consequences of captive breeding programmes
for endangered animal species. Biodiversity and Conservation 9: 1843-1861.
Wright S. 1931. Evolution in Mendelian populations. Genetics 16:97-159.
Zhang B, Fang SG, Xi YM. 2006. Major histocompatibility complex variation in the
endangered crested ibis (Nipponia nippon) and implications for reintroduction.
Biochemical Genetics 44: 113-123.

Chapter Two was previously published. The reference for this paper is as follows: Ferrie GM, Cohen OR, Schutz P, Leighty KA, Plasse C, Bettinger TL, Hoffman EA. 2013. Identifying parentage using molecular markers: improving accuracy of studbook records for a captive flock of marabou storks (Leptoptilus crumeniferus). Zoo Biology 32: 556-564.
10
CHAPTER TWO: IDENTIFYING PARENTAGE USING MOLECULAR MARKERS: IMPROVING ACCURACY OF STUDBOOK RECORDS FOR
A CAPTIVE FLOCK OF MARABOU STORKS (LEPTOPTILUS CRUMENIFERUS)
Abstract
Extra-pair copulations (EPCs) leading to extra-pair fertilization (EPF) are
common in avian mating systems, despite the prevalence of observed social monogamy
in many species. Colonially-breeding birds are interesting species to investigate the
prevalence of EPCs and EPF because they show nesting habits including close
proximity of nest sites and sexual partners, which are proposed to promote alternative
reproductive tactics. Endemic to Africa, the colonial marabou stork (Leptoptilos
crumeniferus) is one of the most commonly held avian species in North American zoos.
The aims of this study were to use genetic information to verify parentage in a
population of marabou stork housed at Disney’s Animal Kingdom® based on five
microsatellite loci and to investigate reproductive behavior. We compared genetic
analyses of parents and offspring to studbook data collected through behavioral
observations of parental behavior at the nest. Using genetic analyses to reconstruct the
pedigree of the marabou stork flock using the program COLONY led to improvement of
studbook records by determining parentage of an individual that had previously
unknown parentage, and identified one individual that had a sire that differed genetically

11
from studbook records. An important contribution of our analyses was the identification
and verification of the most likely parents for offspring hatched in this colony and
improving incorrect or undocumented parentage in the studbook. Additionally, the
colonial nature of this species makes it difficult to observe and understand reproductive
behavior. Gaining better understanding of the mating system of a species is essential
for successful breeding and captive management.
Key Words: captive breeding, extra-pair paternity, microsatellite, parentage, pedigree,
studbook
Introduction
Avian mating systems vary widely, with many species practicing extra-pair
copulations (EPCs) and extra-pair fertilizations (EPFs) at much higher rates than
assumed, particularly those species previously thought to be both socially and
reproductively monogamous [Avise, 1996; Miño et al., 2011]. Parentage studies using
molecular techniques have improved understanding of the evolution and behavioral
ecology of birds, revealing unsolved aspects of their reproductive biology and natural
history [Avise, 2004]. With the application of various molecular genetic techniques,
extra-pair paternity has been found in 90% of all avian species studied, with over 11%
of offspring from socially monogamous species being the result of extra-pair paternity
and true genetic monogamy in less than 25% of socially monogamous species [Griffith
et al., 2002]. Using molecular techniques to determine genetic relatedness among

12
individuals and assess kinship is a powerful tool for investigating issues such as mating
systems, parental care, dispersal and other biological parameters in natural and captive
populations of birds [Frankham et al., 2002; Avise, 2004].
Colonially-breeding avian species are interesting species in which to investigate
the prevalence of EPCs and EPFs because they show nesting habits proposed to
promote alternative reproductive tactics such as close proximity of nest sites and sexual
partners [Miño et al., 2011]. Indeed, Møller and Birkhead [1992, 1993] reported that
extra-pair copulations are found to occur more frequently in colonial than dispersed
nesting birds. They interpreted this finding as the result of either increased proximity of
individuals or lower intensity of mate-guarding in colonial species. Species in the order
Ciconiiformes include examples of those that nest colonially and therefore have high
competition for nest sites [Burger, 1981]. Their proximity when nesting could easily lead
to EPCs, EPFs, and extra-pair paternity (EPP). Studies have documented non-
monogamous mating systems in Ciconiiformes such as the roseate spoonbill (Platalea
ajaja) and the wood stork [Mycteria americana; Miño et al., 2009].
One of the hypotheses proposed as to why females accept EPCs is to avoid the
potentially larger cost of rejecting a persistent or aggressive male [Kempenaers and
Dhondt, 1993]. In this case, females do not necessarily benefit directly from the EPC,
but instead avoid the costs associated with refusing the male. In colonial species with a
high level of nest-site competition or where nests can easily be destroyed, nest
guarding may prevent continuous mate guarding, and females may be left alone and
subsequently attacked and forced into extra-pair copulations by males [e.g. white ibis
(Eudocimus albus; Frederick, 1987b)]. It has also been suggested that aggressive male

13
behaviors and forced copulations are more common among colonial than solitary
species [Gowaty and Buschhaus, 1998]. Frederick [1987a] reported that white ibis
(Eudocimus albus) males were frequently observed biting and beating the heads of
females, while female were observed to “protest” and “lack cooperation” in copulation
attempts.
Native to tropical Africa, marabou storks (Leptoptilos crumeniferus) are the
largest storks of the Ciconiidae family, with an average height of 120 cm, wing-span of
2.9 m and pronounced sexual dimorphism [Hancock et al., 1992]. These birds are
colonial and have been observed to nest with a few to hundreds of other pairs. In
breeding season, male marabou storks establish and aggressively protect a nest-site.
Females in breeding condition will repeatedly visit the nest site despite overly
aggressive displays from the male that include threat displays and bodily assaults on
the female [Kahl, 1966]. Females respond with a submissive display and the male
eventually allows her to approach and remain at the nest-site [Kahl, 1966]. Once the
pair is formed, they begin work on nest construction or repair. It is during this nest
building phase that most copulations occur and eggs are laid soon after the nest is
completed [Kahl, 1966]. While many descriptions exist about the behavioral courtship
and pairing rituals between males and females in the marabou stork [Kahl, 1966;
Pomeroy, 1978] as well as demographic parameters of specific colonies including
fecundity [Monadjem, 2005] and juvenile dispersal [Monadjem et al., 2008], little
information is available about the interactions between pairs and non-paired individuals
at the colony site.

14
Marabou storks are one of the most commonly held birds in North American
zoos, yet many zoos are rarely successful in breeding this species [Terkel, 1994]. For
example, between 1978 and 2002, only eight North American institutions successfully
bred marabou storks out of approximately 25 institutions attempting to breed [Hejna,
2002]. Despite the challenges around successfully breeding this species, little research
exists on the causes of these reproductive impediments [Kuhar et al., 2004].
Furthermore, the captive population faces a significant challenge related to trauma-
related mortalities. Between 2006 and 2007, within the captive population held in
European institutions, 32% of deaths were attributed to intraspecific aggression, 16% to
interspecific aggression (from hoofed stock), and 18% to aggression of an unknown
source. Numerous other deaths from conspecifics at zoological institutions throughout
the world have been reported [Terkel, 1994]. There have been at least seven deaths
from intraspecific aggression in the North American population (Schutz, personal
communication) in addition to multiple conflicts resulting in injury requiring veterinary
intervention since 2007. It has been observed that females are most often the
recipients of this intraspecific aggression leading to a captive population that is heavily
skewed towards males [Schutz, 2011]. This skewed sex ratio further contributes to the
reproductive challenges facing the captive population and it is possible that the
presence of female-targeted aggression in this species could lead to forced copulations,
and thus extra-pair fertilizations in this species.
Breeding programs of many species managed by zoos and aquaria rely on a
studbook, which is a database comprised of the pedigree information and major life
history events for every individual in a defined population [Earnhardt et al., 2005]. This

15
studbook provides data for pedigree analyses, which are the foundation to analyzing
and managing the demographic and genetic health of captive populations [Ballou and
Foose, 1996]. Accurate pedigrees provide information on inbreeding, kinships among
individuals, and the distribution of individual founder contributions to a population [Ivy
and Lacy, 2010]. However, for pedigree analyses to be effective, the pedigree must be
accurate and complete. In the case of pedigrees with missing or incorrect information,
molecular genetic tools have the ability to improve breeding programs [see Ivy and
Lacy, 2010 for a detailed discussion]. The North American regional marabou stork
studbook was first published in 2002 [Hejna, 2002] and the data from the pedigree have
been used to analyze the population and publish two breeding plans for this species in
North American zoos [Schutz and Christman, 2009; Schutz and Ferrie, 2012].
The aim of this study was to use genetic information to verify parentage in an ex
situ population of marabou storks based on five microsatellite loci. Using molecular
genetic techniques, we reconstructed the pedigree of a colony of marabou storks to
determine if the genetic pedigree supports the presumed pedigree constructed using
parental behaviors observed over multiple breeding seasons. We also used the genetic
pedigree to interpret behavior during the breeding season in this colony. Our analyses
constitute the first attempt to clarify aspects of the genetic mating system in the
marabou stork, which is under-studied both in the wild and in captive populations.
Investigating these factors may improve the understanding of this species’ reproductive
behavior and the management of a colonial species in an ex situ population.

16
Materials and Methods
Study Subjects
Disney’s Animal Kingdom® was one of the most successful breeding institutions
for marabou stork in North America with the largest flock at one time [Schutz, 2011],
and as in other zoological institutions displaying this species, this flock had a history of
intraspecific aggression. From 1998 through 2012, Disney’s Animal Kingdom® exhibited
a flock of marabou storks that varied in number from six to 15 birds in an enclosure
approximately three acres in size.
Sample Collection and DNA Extraction
Blood samples were collected from 11 marabou storks as part of their routine
physical examinations. Twelve blood samples were also collected from four additional
institutions in the state of Florida to increase sample size as well as to include birds that
previously lived in the Disney’s Animal Kingdom® flock. Approximately 0.25g of liver
tissue preserved in 95% ETOH were also included from seven samples from deceased
birds. Blood samples were preserved by placing three to four drops of blood
(approximately 0.25 mL) into 1.5 mL tubes containing 1.0 mL of Longmire Buffer (100
mM Tris HCL pH 8.0, 100 mM EDTA, 10 mM NaCl, 0.5% SDS; Longmire et al., 1988).
Two samples were obtained from each bird. In total, we collected samples from 30

17
individual birds. Genomic DNA was extracted using a standard phenol-chloroform
extraction protocol [Sambrook and Russell, 2001] followed by an ethanol precipitation.
Samples were then re-suspended in double-distilled water and the DNA concentration
was determined using a Nano-Drop® ND-1000 Spectrophotometer (Thermo Scientific,
Wilmington, DE). Samples were then visualized on a 1% agarose gel to confirm that
genomic DNA had not fragmented during extraction. All samples were diluted with
double-distilled water to a final concentration of 20ng/μl.
Microsatellite Development and Genotyping
To isolate microsatellite loci, we generated random DNA fragments (~200-2500
bp) using degenerate oligonucleotide-primed polymerase chain reaction (DOP-PCR),
using the K6-MW primer and protocol [Macas et al., 1996]. Microsatellite enrichment of
the PCR-amplified genomic fragments employed a 3’-biotinylated (GATA)8 repeat motif
bound to streptavidin-coated particles (Promega Corporation, Madison, WI) enriched via
magnetic separation. Enriched DOP-PCR products were made double stranded by a
subsequent DOP-PCR and cloned using TOPO TA cloning kit (Invitrogen, Carlsbad,
CA). Clones positive for (CA)n or (GATA)n microsatellites were identified using the
screening procedure of Cabe and Marshall [2001]. In brief, we conducted two PCRs
per colony: one PCR included T3 and T7 primers while the second included the
(GATA)8 primer in addition to the T3 and T7 primers. We visualized the product of the
PCR reactions on a 2.0% agarose gel and positive clones (those containing
microsatellites) were identified by a distinctive smear in the (GATA)8 reaction. We then

18
sequenced positive clones and developed PCR primers from flanking regions of DNA
surrounding the microsatellite repeats. In total, we developed microsatellite primer sets
for 10 loci and genotyped 30 individuals at these loci.
PCRs for all loci were performed in a 20 μl reaction containing 1 μl of template
DNA diluted to 20 ng/μl, 2 μl of 10X PCR buffer, 1.25 μl of 25 mM of MgCl2, 200 μM of
each dNTP, 0.5 μl of 10 μM M13 labeled (Schuelke 2000) forward primer and 1 μl of 10
μM reverse primer, 1 μl of 10 μM fluorescently-labeled M13 primer, 0.2 μl dimethyl
sulfoxide, and 1 unit of Taq polymerase. The fluorescently labeled dyes were ABI DS-30
(6-FAM, HEX, NED; Applied Biosystems, Life Technologies Corporation, Carlsbad, CA).
We performed PCRs using a BioRad MyCycler thermalcycler (Bio-Rad Laboratories,
Hercules, CA). The initial denaturing step was 94 °C for 4 mins, followed by 35 cycles
of 30 secs at 94 °C, 30 secs at the annealing temperature, and 45 secs at 72 °C, then a
final extension cycle at 72 °C for 7 mins, and a hold at 4 °C. Annealing temperatures for
all loci are listed in Table 1. We visualized PCR products on a 2% agarose gel prior to
genotyping.
PCR products were sized using an ABI PRISM® 3730 DNA Analyzer (Applied
Biosystems, Life Technologies Corporation, Carlsbad, CA) in 5 μl multi-plexed reactions
at the University of Arizona Genetics Core (Tucson, AZ). Alleles were sized with respect
to size standard ROX (DS-30, Applied Biosystems, Life Technologies Corporation,
Carlsbad, CA) using the Peak-Scanner Software (v1.0, Applied Biosystems, Life
Technologies Corporation, Carlsbad, CA).

19
Basic Genetic Parameters
Five of the 10 loci were found to be polymorphic and were used for further
analyses (Table 1). We used the program Micro-checker (van Oosterhaut et al., 2004)
to check for the presence of null alleles and scoring errors such as peak stuttering or
allelic dropout. The software program FSTAT2.9.3 [Goudet, 1995] was used to test for
deviation from Hardy-Weinberg Equilibrium and for evidence of linkage disequilibrium
between pairs of loci, as well as to calculate number of alleles and allelic richness of
each locus.
We also estimated probability of identity (PID) in the five polymorphic loci using
the program Gimlet [v1.33, Valière, 2002]. PID estimates the likelihood of sampling the
same genotype by chance given the diversity of the loci used in the analysis, and in
general, should be less than 0.001 for a randomly sampled population and less than
0.05 in a population comprised of siblings [Schwartz and Monfort, 2008]. Gimlet was
also used to calculate the observed and expected heterozygosities for the microsatellite
loci used in this study. Basic genetic parameters were calculated with all individual birds
(N = 30).
Parentage Analysis
Of the 30 samples collected, 18 were used specifically for parentage analyses,
as these were birds that had lived in the Disney’s Animal Kingdom® flock and were
either offspring hatched in this flock or were potential parents. The remaining 12

20
individuals were excluded from parentage analyses as they were never a part of the
study flock, or lived in the flock after the study period. Between August 2002 to March
2007, 12 males and 15 females were present in this population of marabou storks. An
individual was determined to be a potential sire or dam if they were sexually mature
(greater than five years for males, and four years for females), and were present in the
flock during a portion of the timeline of this study and if chicks hatched during that time.
Institutional animal records were examined to determine each bird’s timeline of
presence in the flock. Comparing the timeline of each individual’s presence in the flock,
as well as when they became sexually mature, to the dates that the egg of each
offspring was laid allowed us to reduce the number of candidate sires and candidate
dams in the flock to eight for both sexes. We genetically sampled nine offspring
(individuals hatched at Disney’s Animal Kingdom®), 6 candidate sires and four
candidate dams. Therefore, the probabilities that the sire and dam were included in the
sampled dataset were 75% and 50% respectively. We used these a priori probabilities
in both CERVUS [v3.0.3; Kalinowski et al., 2007] and COLONY [v2.0.3.0; Wang and
Santure, 2009] for parentage screening. By examining dates of hatch and each
individual’s timeline of presence in the flock, we were able to exclude some candidate
males from paternity analysis for three offspring, and exclude some candidate females
from maternity analysis for all nine offspring.
Using the program CERVUS [v3.0.3; Kalinowski et al., 2007], which uses a pair-
wise likelihood comparison based approach to assigning parentage, we first ran an
allele frequency analysis on the five loci discussed above, which we used to calculate
multilocus parental exclusion probabilities [Selvin, 1980]. We then ran a parentage
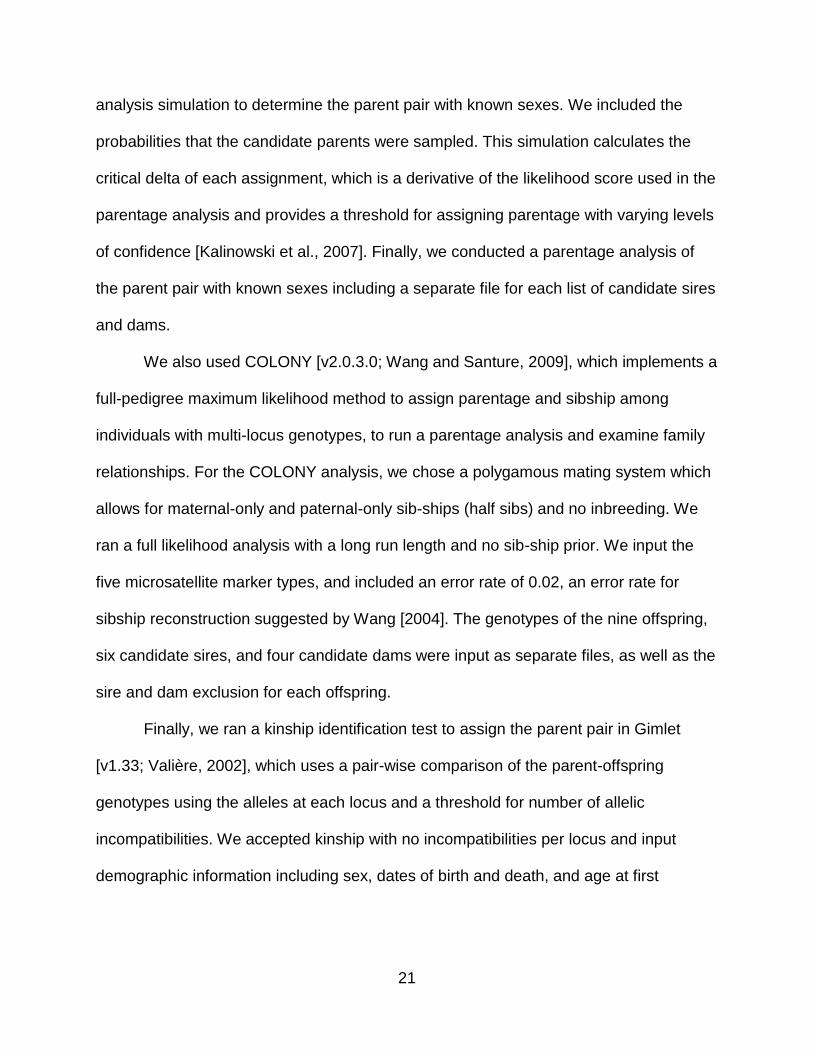
21
analysis simulation to determine the parent pair with known sexes. We included the
probabilities that the candidate parents were sampled. This simulation calculates the
critical delta of each assignment, which is a derivative of the likelihood score used in the
parentage analysis and provides a threshold for assigning parentage with varying levels
of confidence [Kalinowski et al., 2007]. Finally, we conducted a parentage analysis of
the parent pair with known sexes including a separate file for each list of candidate sires
and dams.
We also used COLONY [v2.0.3.0; Wang and Santure, 2009], which implements a
full-pedigree maximum likelihood method to assign parentage and sibship among
individuals with multi-locus genotypes, to run a parentage analysis and examine family
relationships. For the COLONY analysis, we chose a polygamous mating system which
allows for maternal-only and paternal-only sib-ships (half sibs) and no inbreeding. We
ran a full likelihood analysis with a long run length and no sib-ship prior. We input the
five microsatellite marker types, and included an error rate of 0.02, an error rate for
sibship reconstruction suggested by Wang [2004]. The genotypes of the nine offspring,
six candidate sires, and four candidate dams were input as separate files, as well as the
sire and dam exclusion for each offspring.
Finally, we ran a kinship identification test to assign the parent pair in Gimlet
[v1.33; Valière, 2002], which uses a pair-wise comparison of the parent-offspring
genotypes using the alleles at each locus and a threshold for number of allelic
incompatibilities. We accepted kinship with no incompatibilities per locus and input
demographic information including sex, dates of birth and death, and age at first

22
reproduction of four years for females and five years for males. We also limited kinship
to the potential sires and dams by timeline of presence in the flock as described above.
To compare parentage recorded from the studbook to the genetic analyses, we first
recorded each sire and dam listed in the North American regional marabou stork
studbook [Schutz, 2011] for each offspring hatched in population. These putative
parents were recorded in the studbook based on animal keepers’ observations of
nesting, incubation and chick-rearing behaviors. We then used the results of the
CERVUS, COLONY, and Gimlet parentage analysis to assign sires and dams based on
strict confidence (95%) and relaxed confidence (80%). Last, we built a pedigree of the
flock based on the parentage results, as well as the best configuration of families
provided by COLONY.
Results
Using FSTAT [v2.9.3; Goudet, 1995] the five polymorphic loci were found to be in
Hardy-Weinberg equilibrium using the Bonferroni corrected significance value of α =
0.01, and there was no evidence of linkage disequilibrium between the loci based on the
Bonferroni corrected significance value of α = 0.005. Locus Lcru101 shows signs of null
alleles when analyzing with Micro-checker; however, there was no evidence of scoring
error due to stuttering or of allelic dropout. Population mean expected heterozygosity
was 0.74 and mean observed heterozygosity was 0.69 (Table 1).

23
Table 1. Characterization of five microsatellite loci used in marabou stork (Leptoptilus crumeniferus) identity and parentage analysis.
Locus Primer Sequence (5’-3’) Ta (°C)
Repeat motif Size (bp)
Number of
Alleles
Allelic Richness
Hexp Hobs PIunbiased PISIB
Lcru105 F: *TTATAAAACGTGGCGGGAAG 54 (CA)14 164-192
11 10.583 0.80 0.67 0.04870 0.3673 R: CCATTTAGCACAAACAAATTCC
Lcru108 F: *CTTGGTGGGCACCTAGCAG 54 +(GATA)13 311-
331 7 6.862 0.75 0.77 0.004070 0.1470
R: CATGGCACCATGAAAAAGAG Lcru101 F: *CCCAAAAGGCAAATGCATAC 52
+(CA)41 184-
207 9 9.000 0.72 0.50 0.0003558 0.02482
R: GTTGAGGGGGAAGAAAATGC Lcru109 F: *TGCAGGAGCACAAGTAGATG 54
+(GATA)10 214-
234 6 5.900 0.74 0.90 0.00003207 0.05972
R: AGGGGTAAAAAGCGAAGCTG Lcru107 F: *ACTGAGAACGGGATTTGTCC 54
+(CATA)4(GATA)15
(CATA)4 246-266
5 4.999 0.70 0.60 0.000003977 0.01086 R: TTCTGGAAAAACCGAAGACC
Mean 0.74 0.69
Table 1 footnote: Loci were amplified using PCR conditions described in the text. Loci are sorted by rank of unbiased probability of identity (PI), which was calculated using Gimlet (v1.33; Valière 2002). Number of alleles and allelic richness (based on minimum sample size of 27 diploid individuals) were calculated with FSTAT (v2.9.3; Goudet, 1995). Expected and observed heterozygosity were calculated in Gimlet. The asterisk (*) in the primer sequence denotes a 5’ tail (TGTAAAACGACGGCCAGT) attached to the primer sequence; + in the repeat motif represents an imperfect repeat in the sequence; Ta, annealing temperature; Hexp, expected heterozygosity; Hobs, observed heterozygosity; PIunbiased, unbiased probability of identity; PISIB, probability of identity in a population of all siblings. Note that values for PIunbiased and PISIB are cumulative, such that the value listed for Lcru107 is the cumulative effect of all loci.

24
The cumulative unbiased probability of identity (over all loci) was 0.000003977,
suggesting that approximately one in 250,000 genotypes will match by chance alone.
The cumulative probability of identity in a population comprised of full siblings was
0.01086, suggesting that approximately one in 100 genotypes would match by chance if
all individuals were full siblings. These five loci therefore show sufficient discrimination
ability for this study and were used in parentage screening of the captive-hatched
individuals in the marabou stork population.
The parentage of each offspring hatched in the flock obtained from the studbook
and the three methods of assignment based on molecular markers (CERVUS, COLONY
and Gimlet) are shown in Table 2.

25
Table 2. Sires and dams of offspring hatched in the Disney’s Animal Kingdom® marabou stork (Leptoptilus crumeniferus) flock determined from the studbook data [Schutz, 2011], and three methods of parentage assignment.
Offspring Sampled
Hatch Year
Sex Sire Dam
Studbook CERVUS COLONY GIMLET Studbook CERVUS COLONY GIMLET
406 2002 F 296ǂ
296* 296/ 375 369§
415 2003 F 296
ǂ 296* 296** 296 369
§
427 2004 M 296ǂ
296* 296** 296/ 368+
369§
428 2004 M 375ǂ
375 383 371§
406 431 2005 F 296
ǂ 296** 296** 296/ 368
+ 369
§
432 2005 M 296ǂ
368** 368** 368+
369§
433 2007 M 368ǂ
352**
368** 368
364ǂ
364 364** 364 410 2002 U 368
ǂ 368 364
ǂ 364* 364** 364
n242 2002 U UNK 375* 368** 368+/ 375 UNK 381 364** 364
ǂ: Putative parent included in genetic sampling. §: Putative parent NOT included in genetic sampling. **: Assignment confidence >95%. *: Assignment confidence >80%. +: Missing allele in Gimlet analysis.
Table 2 footnote. Methods of parentage assignment include CERVUS v3.0.3 [Kalinowski et al., 2007], COLONY v2.0.3.0 [Wang and Santure, 2009], and Gimlet v1.22 [Valière, 2002]. Light gray shaded boxes are assigned parents that match the putative sire and dam with greater than 80% confidence. Dark gray shaded boxes reflect an individual with assigned parents in genetic analyses that do not match to putative parents from studbook. No allelic mismatches were present in assignments made with >95% or >80% confidence from CERVUS and COLONY results.

26
Of the three programs, analyses from COLONY resulted in more assignments (sires: 6
with strict, and 1 with relaxed confidence; dams: 3 with strict confidence), which were
made with higher confidence than CERVUS (sires: 3 with strict, and 3 with relaxed
confidence; dams: 1 with relaxed, and 2 with low confidence) and Gimlet (Table 2). The
results of assignment tests showed that five offspring had sires match the studbook
parentage and that two offspring had dams match the studbook with strict or relaxed
confidence. Two additional offspring were assigned sires that matched the studbook
with low confidence (<80%); studbook (SB) 428 was assigned sire SB 375, with low
confidence (77%, COLONY) but there were no mismatching alleles between sire and
offspring genotypes. SB 410 was assigned sire SB 368 with almost no confidence (4%,
COLONY). There was one mismatching allele between these two individuals, and a
missing genotype in SB 368.
Reconstructing the pedigree based on COLONY best family configuration results,
paternity, maternity, full sib-ship, and half sib-ship assignments resulted in three
discrepancies from the recorded studbook data (Fig. 1).

27
Figure 1. Pedigree of Disney’s Animal Kingdom® marabou stork (Leptoptilus crumeniferus) flock based on COLONY [v2.0.3.0; Wang and Santure, 2009] best configuration results, paternity, maternity, full sib-ship and half sib-ship assignments. Individuals sampled for genetic analyses are labeled within squares (males), circles (females), and triangles (unknown sex). Year of hatch is listed below individual number. Probabilities of assignment for sires are to the left of the offspring node, and for dams to the right of the offspring node. Probability of assignment for full-siblings (FS) and half-siblings (HS) are below pedigree. Stars () represent relationships in the genetic pedigree that do not match the studbook records. These differences are numbered, and are discussed in the text in numerical order. * represents either unsampled putative sire or relationship unsubstantiated by genetic analyses (see text), # represents unsampled putative dams or relationship unsubstantiated by genetic analyses. In the case where a putative sire or dam is listed in the studbook, these are included under the * or #.
First, we found one case of incorrect assignment of a sire that was assigned differently
from the studbook (Star 1, Fig.1). Studbook (SB) 296 was listed as the sire of offspring
SB 432 with dam SB 369. The daily observation notes of reproductive behavior list one
clutch of four eggs for this pair (SB 296 and SB 369) in 2005. In all three analyses
(CERVUS, COLONY, and Gimlet), SB 368 was assigned as the sire to SB 432, with
greater than 95% confidence (CERVUS and COLONY; Table 2). Offspring SB 432 was
laid as an egg in early May 2005, and at this time male SB 368 had just had a clutch fail
(April 2005) and was observed in breeding color and copulating with his mate (SB 364).

28
Thus it appears that offspring SB 432 is a result of an extra-pair copulation between
male SB 368, and female SB 369, who was not reproductively monogamous in 2005
(Fig. 1). Second, we were also able to determine parentage of an individual that had
previously unknown parentage (no parents listed in the studbook; Table 2). Following
assignment tests, offspring SB n242 assigned to sire SB 368 (97%, COLONY; Table 2)
and dam SB 364 (95%, COLONY; Table 2; Star 2; Fig. 1). Third, offspring SB 410,
which according to the studbook would have been a clutch-mate to SB n242 with the
recorded sire SB 368 and dam SB 364 did not assign to any sire in the other
assignment tests (Table 1; Star 3; Fig. 1). SB 410 did assign to dam SB 364 with strict
confidence in both CERVUS and COLONY (95%). However, the presence of a null
allele in the putative sire (SB 368), could explain this discrepancy. SB 368 was scored
as a homozygote at locus Lcru105, but if it was scored such that it was a heterozygote
exhibiting a null allele, it would yield a result that is consistent with a single family group;
therefore, the putative sire (SB 368) could have given the null allele to offspring SB 410.
Discussion
This study compared studbook data to genetic analyses of parents and offspring
from a captive population of marabou storks. Reconstructing the pedigree from genetic
analyses has shown that one pair in the flock housed at Disney’s Animal Kingdom® was
not reproductively monogamous and, like many other avian species, this species may
make use of a mating system other than strict monogamy. Pairs change mates between

29
years, and our evidence suggests that even within one clutch there is evidence for
extra-pair fertilization and multiple-paternity. Despite the small sample size in this study,
the identification of extra-pair fertilization in one captive flock of marabou storks
suggests that the rates of this behavior may be quite high in this species in the
appropriate environment. Evaluation of the studbook records suggest that data in the
studbook may be missing, with no known parents recorded for some offspring, or may
be incorrect, with a sire or dam listed that is not the genetic parent. While we did find
one individual that did not assign with any confidence to a sire (SB 410, Star 3; Fig. 1), it
is likely due to presence of a null allele, and provides a cautionary tale of adhering
strictly to genetic data, particularly in that the genetic data can have scoring or
sequencing errors. More microsatellite loci may have helped in resolving the parentage
of this individual by reducing effects of potential error. Overall, these genetic analyses
led us to two major findings in our pedigree that differed from studbook records. Both
inaccuracies in the studbook can have implications on future genetic and demographic
analyses or management of the population.
A common challenge in genetic parentage studies is that not all potential parents
are sampled. In our study only 75% of potential sires and 50% of potential dams were
included. In this study, we were not able to compare studbook data to genetic data for
most dam assignments, and two individuals assigned to sires with little to no confidence
(Table 2). SB 428 did not assign to a sire with confidence, and it is possible in this case
that the studbook could be incorrect and we did not sample the true genetic parent.
Alternatively, this may be a case that our data did not have the ability to discern the
parent. Using genetic data for parentage assignment, there is always the potential to

30
assign a parent incorrectly, particularly based on a limited sampling of the potential
parents, as in this study. However, there is also the ability to exclude a parent if
molecular analyses do not support that the parent listed in the studbook is the genetic
parent. We believe that we avoided potential errors of incorrect parent assignments by
carefully reviewing animal records and timelines to determine which exact individuals
were potential parents, and by adhering to assignments with high confidence and no
allelic mismatches. Future studies can avoid these challenges by including more
molecular markers (ie more microsatellites) to strengthen the parentage assignment
analysis methods. Opportunistic sampling and storage of genetic material of more
individuals and species in general can also help future studies reduce issues of missing
samples.
One of the most important contributions of our genetic analyses to pedigree
building was the identification and verification of the most likely parents for offspring
hatched in this colony. This study revealed that one female reproduced with a male who
was not her behavioral mate, resulting in one clutch in 2005 with multiple-paternity and
observations demonstrating that the chick resulting from this copulation was reared by
an individual other than its genetic parent. In this colony of marabou storks, sex ratio
was male biased leading to the presence of unpaired, potentially aggressive males, and
nest sites were all constructed less than a meter from each other simulating a situation
of high density nesting. Using the pedigree and observations of parental behavior that
led to determination of parents for the studbook allows us to examine the factors that
support an environment that promotes EPCs and the reproductive behavior observed in
this colony.

31
Both paired as well as unpaired males in colonial species have been observed
attempting to aggressively copulate with females besides their social mates [Gowaty
and Buschhausf, 1998]. Unpaired males direct aggressive "copulations" at unmated or
unguarded females or females moving unescorted in the environment [Gowaty and
Buschhausf, 1998]. Males may themselves create the dangerous environment for the
advantage they will accrue from completing copulation, especially those who might
otherwise have little or no opportunity to mate due to subordinate position or inability to
gain a mate [Gowaty and Buschhausf, 1998]. We have frequently observed increased
aggression between males and females at the nest site, even between birds assumed
to be monogamous and paired for multiple breeding seasons (not just in newly
established pairings). This female-targeted aggression often leads to visible injury in the
females (small lacerations to head and gular sac, and limping) and has at times
escalated to death of the female. At this point, we do not understand males’ motives for
this aggression, but it could be due to two situations. First, males may require females
to "trade" copulations for protection [Gowaty and Buschhausf, 1998] from other males
and the aggression could be a result of the female’s refusal. Second, the aggression
could be retribution for the female’s solicitation of an EPC. In social animals, there is
evidence that retaliatory aggression is common, and individuals often punish group
members to maintain dominance relationships, discourage cheats, and discipline sexual
partners [Clutton-Brock and Parker, 1995]. More information is needed to examine
these hypotheses.
High densities of breeding adults and nest sites can increase the chances of
encounters between fertile males and females, reducing the energetic costs for

32
individuals searching for extra-pair mates and favoring increased rates of extra-pair
copulations [Miño et al., 2011; Thusius et al., 2001; Westneat and Sherman, 1997].
Although extra-pair encounters might increase with increasing density of individuals in
the colony, at higher densities social mates are forced into greater proximity, which
should make it easier for males to see and repel intruders, to control female
movements, or to witness an EPC and perform compensatory within-pair copulation
[Westneat and Sherman, 1997]. Alternatively, increasing density may severely impair a
male's abilities to successfully guard his social mate, because either there are too many
males to chase away or nests are clustered at sites distant from other resources
important to males. In addition, habitat complexity allows females more opportunity to
escape from male surveillance and increasing density makes it more valuable for them
to do so [Westneat and Sherman, 1997]. In this colony of marabou storks, we observe
that nests are, in fact, clustered closely together, males are observed interacting
aggressively at the nest site, and the exhibit size and configuration of the environment
may allow females to remove themselves from being guarded by their mate.
Additionally, as a part of husbandry management in this colony, birds are often required
to enter a feeding pen to receive daily feedings, leading to a situation in which males
may choose to leave their females unguarded. Under these conditions, the skewed sex
ratio and unguarded females leads to a favorable environment for EPCs to occur.
This study further supports the fact that molecular data can be useful in verifying
recorded parentage and missing data in studbooks of captive populations [Ivy et al.,
2009; Jones et al., 2002] which are essential for pedigree analyses of the population’s
genetic composition and demographic history. Accurate studbook information can
33
provide information on mating system and behavior. Understanding the mating system
of a species is essential for successful breeding, captive management, and
conservation programs [Miño et al., 2009]. This study contributes to better
understanding of the mating system of a zoo-living colony of marabou storks by helping
to disentangle the relationships among the chicks hatched in this breeding colony and
supplementing or correcting records in this species’ studbook. At this point, little
information exists regarding the actual mating systems of wild marabou stork beyond
behavior of individuals during breeding season [Kahl, 1966]. Future work should
investigate the female’s role in accepting EPCs and EPFs and how these behaviors
may increase the genetic quality of offspring [Neff and Pitcher, 2005]. Other work may
examine the complex social and reproductive behaviors between individuals in a colony
of wild marabou stork, as well as to seek a greater understanding of the social structure
and aggressive interactions in these birds both in zoos and in the wild in order to assist
in management of captive populations of marabou storks and other colonial nesting
birds [Miño et al., 2009]. Finally, understanding how frequently extra-pair paternity
occurs in colonially nesting species will have implications for the genetic management
of captive avian populations.
Conclusions
1. Using genetic analyses to reconstruct the pedigree of the marabou stork flock led
to improvement of studbook records by determining parentage of an individual

34
that had previously unknown parentage, and identified one individual that had a
sire that differed genetically from studbook records, confirming one case of extra-
pair fertilization and extra-pair paternity in this species.
2. Our analyses contributed to the identification and verification of the most likely
parents for offspring hatched in one ex situ marabou stork colony and improved
some studbook records.
3. Using molecular genetic analyses can lead to a better understanding of the
mating system of species with cryptic or difficult to study reproductive behavior.
Understanding these behaviors can be essential for developing a successful
breeding and captive management program.
Acknowledgments
This research was approved by the Disney’s Animal Care and Welfare
Committee, as well as the University of Central Florida IACUC. We would like to thank
Disney’s Animals, Science and Environment for providing funding for this project, Julia
Hartert and Morgan Mingle for assisting with literature searches, and to the Disney’s
Animal Kingdom® marabou stork zoo managers, animal keepers and Department of
Animal Health for supporting sample collection. Also thanks to members of the Hoffman
and Parkinson Labs for their support and comments on this manuscript, particularly
Jason Strickland, Greg Territo, Vicki Villanova, and Dr. Chris Parkinson. We are very
grateful for the comments from Drs Jill Mellen and Andy Stamper, and two anonymous
35
reviewers, which greatly improved this manuscript. Samples were provided by Disney’s
Animal Kingdom®, Jacksonville Zoo and Gardens, Lion Country Safari, Lowry Park Zoo
and St. Augustine Alligator Farm.
References
Avise JC. 1996. Three fundamental contributions of molecular genetics to avian ecology
and evolution. In: Wingfield J, Coulson J, editors. Acta XXI Congressus
Internationalis Ornithologici. Ibis 138: 16-25.
Avise JC. 2004. Molecular markers: natural history and evolution, 2nd edition.
Sunderland, MA: Sinauer Associates Inc.
Ballou JD, Foose TJ. 1996. Demographic and genetic management of captive
populations. In: Kleiman DG, Lumpkin S, Allen M, Harris H, editors. Wild
Mammals in Captivity. Chicago, IL: University of Chicago Press. p 263-283.
Burger J. 1981. A model for the evolution of mixed-species colonies of Ciconiiformes. Q
Rev Biol 56: 143-167.
Cabe PR, Marshall KE. 2001. Microsatellite loci from the house wren (Troglodytes
aedon). Mol Ecol Notes 1: 155-156.
Clutton-Brock TH, Parker GA. 1995. Punishment in animal societies. Nature 373: 209-
216.
Earnhardt JM, Thompson SD, Willis K. 2005. ISIS database: An evaluation of records
essential for captive management. Zoo Biol 14: 493-508.

36
Frankham R, Ballou JD, Briscoe DA. 2002. Introduction to conservation genetics. United
Kingdom: Cambridge University Press.
Frederick PC. 1987a. Extrapair copulations in the mating system of white ibis
(Eudocimus albus). Behaviour 100: 170-201.
Frederick PC. 1987b. Responses of male white ibises to their mate’s extra-pair
copulations. Behav Ecol Sociobiol 21: 223-228.
Goudet J. 1995. FSTAT: A computer program to calculate F-statistics. J Hered 86: 485-
486.
Gowaty PA, Buschhaus N. 1998. Ultimate causation of aggressive and forced
copulation in birds: female resistance, the CODE hypothesis, and social
monogamy. Am Zool 38: 207-225.
Griffith SC, Owens IPF, Thuman KA. 2002. Extra pair paternity in birds: a review of
interspecific variation and adaptive function. Mol Ecol 11: 2195-2212.
Hancock JA, Kushlan JA, Kahl MP. 1992. Storks, Ibises and Spoonbills of the World.
San Diego, CA: Academic Press, Inc.
Hejna R. 2002. AZA North American Regional Studbook for Marabou Stork (Leptoptilos
crumeniferus). Silver Springs, MD: Association of Zoos and Aquariums.
Ivy JA, Lacy RC. 2010. Using molecular methods to improve the genetic management
of captive breeding programs for threatened species. In: DeWoody JA, Bickham
JW, Michler CH, Nichols KM, Rhodes Jr OE, Woeste KE, editors. Molecular
Approaches in Natural Resource Conservation and Management. New York:
Cambridge University Press. p 267-295.

37
Ivy JA, Miller A, Lacy RC, DeWoody JA. 2009. Methods and prospects for using
molecular data in captive breeding programs: an empirical example using parma
wallabies (Macropus parma). J Hered 100: 441-454.
Jones KL, Glenn TC, Lacy RC, Peirce JR, Unruh N, Mirande CM, Chavez-Ramirez F.
2002. Refining the whooping crane studbook by incorporating microsatellite DNA
and leg-banding analyses. Conserv Biol 16: 789-799.
Kahl MP. 1966. A contribution to the ecology and reproductive biology of the marabou
stork in East Africa. J Zool 143: 289-311.
Kalinowski ST, Taper ML, Marshall TC. 2007. Revising how the computer program
CERVUS accommodates genotyping error increases success in paternity
assignment. Mol Ecol 16: 1099-1106.
Kempenaers B, Dhondt AA. 1993. Why do females engage in extra-pair copulations? A
review of hypotheses and their predictions. Belg J Zool 123: 93-103.
Kuhar CW, Hernandez LM, Amos-Mongiello K. 2004. Preliminary findings on
reproduction of captive marabou storks. Avicultural Magazine 111: 56-63.
Longmire JL, Lewis AK, Brown NC, Buckingham JM, Clark LM, Jones MD, Meincke LJ,
Meyne J, Ratliff RL, Ray FA, Wagner RP, Moyzis RK. 1988. Isolation and
molecular characterization of a highly polymorphic centromeric tandem repeat in
the family Falconidae. Genomics 2: 14-24.
Macas J, Gualberti G, Nouzova M, Samec P, Lucretti S, Dolezel J. 1996. Construction
of chromosome-specific DNA libraries covering the whole genome of field bean
(Vicia faba L). Chromosome Res 4: 531-539.

38
Miño CI, Russello MA, Mussi Gonçalves PF, Del Lama SN. 2011. Reconstructing
genetic mating systems in the absence of parental information in colonial
breeding waterbirds. BMC Evol Biol 11: 196.
Miño CI, Sawyer GM, Benjamin RC, Del Lama SN. 2009. Parentage and relatedness in
captive and natural populations of the roseate spoonbill (Aves: Ciconiiformes)
based on microsatellite data. J Exp Zool 311A: 454-464.
Møller AP, Birkhead TR. 1992. A pairwise comparative method as illustrated by
copulation frequency in birds. Am Nat 139: 644-656.
Møller AP, Birkhead TR. 1993. Cuckoldry and sociality: a comparative study of birds.
Am Nat 142: 118-140.
Monadjem A. 2005. Breeding biology of the marabou stork (Leptoptilus crumeniferus) in
Swaziland. Ostrich 76: 185-189.
Monadjem A, Bamford AJ, Rasmussen M. 2008. Dispersal of juvenile marabou storks
Leptoptilus crumeniferus as determined by resightings. Ostrich 79: 187-189.
Neff BD, Pitcher TE. 2005. Genetic quality and sexual selection: an integrated
framework for good genes and compatible genes. Mol Ecol 14: 19-38.
Pomeroy DE. 1978. Biology of marabou storks in Uganda 2. Breeding biology and
general review. Ardea 66: 1-23.
Sambrook J, Russell DW. 2001. Commonly used techniques in molecular cloning,
Appendix 8. Molecular Cloning 3(3). Cold Spring Harbor, NY: Cold Spring Harbor
Laboratory Press.

39
Schuelke M. 2000. An economic method for the fluorescent labeling of PCR fragments:
A poor man’s approach to genotyping for research and high-throughput
diagnostics. Nat Biotechnol 18: 233-234.
Schutz P. 2011. AZA North American Regional Studbook for Marabou Stork (Leptoptilus
crumeniferus). Silver Springs, MD: Association of Zoos and Aquariums.
Schutz P, Christman J. 2009. Marabou Stork (Leptoptilus crumeniferus) AZA Population
Management Plan. Chicago, IL: Population Management Center, Lincoln Park
Zoo.
Schutz P, Ferrie GM. 2012. Marabou Stork (Leptoptilus crumeniferus) AZA Species
Survival Plan Yellow Program. Chicago, IL: Population Management Center,
Lincoln Park Zoo.
Schwartz MK, Monfort SL. 2008. Genetic and endocrine tools for carnivore surveys. In:
Long RA, Mackay P, Zielinksi WJ, Ray JC, editors. Noninvasive survey methods
for carnivores. Washington DC: Island Press. p 238-262.
Selvin S. 1980. Probability of nonpaternity determined by multiple allele codominant
systems. Am J Hum Genet 32: 276-278.
Thusius KJ, Dunn PO, Peterson KA, Whittingham LA. 2001. Extrapair paternity is
influenced by breeding synchrony and density in the common yellowthroat.
Behav Ecol 12: 633-639.
Terkel A. 1994. Breeding the marabou stork (Leptoptilos crumeniferus) at the Zoological
Center Tel Aviv and Noorder Zoo, Emmen. Int Zoo Yearbook 33: 55-62.

40
van Oosterhaut C, Hutchinson WF, Wills DPM, Shipley P. 2004. MICRO-CHECKER:
software for identifying and correcting genotyping errors in microsatellite data.
Mol Ecol Notes 4: 535-538.
Valière N. 2002. GIMLET: a computer program for analyzing genetic individual
identification data. Mol Ecol Notes 2: 377-379.
Wang J. 2004. Sibship reconstruction from genetic data with typing errors. Genetics
166: 1963-1979.
Wang J, Santure AW. 2009. Parentage and sib-ship inference from multilocus genotype
data under polygamy. Genetics 181: 1579-1594.
Westneat DF, Sherman PW. 1997. Density and extra-pair fertilizations in birds: a
comparative analysis. Behav Ecol Sociobiol 41: 205-215.

41
CHAPTER THREE: USING BEHAVIORAL OBSERVATIONS AND GENETIC MARKERS TO CHARACTERIZE THE FLEXIBLE
REPRODUCTIVE SYSTEM IN AN EX SITU POPULATION OF CARMINE BEE-EATERS (MEROPS N. NUBICUS)
Abstract
Combining behavioral observations with population genetic analyses in ex situ
populations can be used to evaluate factors that determine the success of a breeding
program. Avian species living in a colony accrue reproductive benefits by taking
advantage of multiple reproductive strategies. Growing evidence suggests that both
extra pair fertilizations (EPFs) and intra-specific nest parasitism (ISNP) are sufficiently
frequent in colonial birds to produce patterns of relatedness that differ from those
inferred from behavioral observations. The aim of this study was to use behavioral and
genetic information to examine relatedness and reproductive behaviors in an ex situ
colony of Northern carmine bee-eaters (Merops n. nubicus). We conducted behavioral
observations to determine social parents (i.e. the males and females that entered/exited
each nest with the highest frequency). We also used microsatellite marker to conduct
parentage analysis and calculate relatedness between individuals in the colony. Using
two methods of parentage analysis, we were able to determine one or both parents of
all offspring. Males and females differ in their parental behavior during the different
reproductive phases. Finally, both males and females were found to use reproductive
strategies other than monogamy. In general, EPFs and ISNP are two of the

42
consequences of social living, with multiple individuals utilizing these various strategies
for reproduction. In summary, our study found that Northern carmine bee-eaters use a
flexible social system that enables individuals within populations to take advantage of
suitable nest conditions and mating strategies as they arise, which allows for some
individuals in this ex situ colony to have improved reproductive success.
Keywords: behavior, colony, parentage, population, relatedness, reproduction
Introduction
Conducting research on ex situ avian populations not only provides information
that can be applied to the improvement of the daily management of that species, but
also presents the opportunity to gather comparative data to natural populations and
those species which are difficult to observe in the wild (Bouchard and Anderson 2011;
Leighton 2014). Studying reproductive behavior strategies with behavioral observations
combined with population genetic analyses can be used to evaluate factors that help
determine the success of ex situ breeding programs. For example, reproductive
behaviors, pedigree, and microsatellites have been used to compare effective number
of breeders in the in situ and ex situ populations of bearded vultures (Gypaetus
barbatus; Guatshi et al. 2003). Effects of inbreeding and levels of mitochondrial diversity
were compared to survival and reproduction in the pink pigeon (Columba mayeri;
Swinnerton et al. 2004) and in lesser kestrels (Falco naumanni), microsatellites were

43
used to examine individual reproductive success and overall genetic health of
individuals produced in ex situ breeding programs destined for reintroduction to the wild
(Alcaide et al. 2010). Molecular genetic analyses are particularly useful in evaluating the
breeding programs of avian populations of those species that live in large flocks or
colonies, as well as those that have more complex reproductive systems that are
difficult to track using basic pedigree information.
Colonial living in birds has been found to have both positive reproductive benefits
as well as costs to both sexes (Rolland et al. 1998; Covas and Griesser 2007).
Individuals living in a colony accrue reproductive benefits by taking advantage of the
density of individuals and the potential to utilize multiple reproductive strategies. Pairs
may have increased clutch size and higher offspring survival (Stacey and Koenig 1990;
Covas et al. 2006). From the perspective of a reproductive female, colonial nesting
provides opportunities for intra-specific nest parasitism (ISNP), or having others
incubate and care for her offspring (Emlen and Wrege 1986;Yom-Tov 2001; Covas et
al. 2006). Females may have increased production of offspring due to having multiple
male social and/or reproductive partners through extra-pair copulations (EPC; Li and
Brown 2002). Male-specific reproductive benefits include the opportunity for multiple
matings through extra-pair fertilizations (EPF) and the avoidance of some of the
expenses of parental investment (Covas et al. 2006). Although group living offers some
individuals the opportunity of benefitting at the expense of others (Emlen and Wrege
1986), there can also be costs to breeding in high densities. These include uncertain
parentage due to EPF, intra-specific cannibalism (Wittenberger and Hunt 1985), and
infanticide of chicks (Wittenberger and Hunt 1985; Danchin and Wagner 1997), as well

44
as inter-specific depredation of chicks (Rolland et al. 1998). When ISNP is present, it
can lead to reduced fitness in birds that are raising the chicks of non-relatives. Thus,
while offering reproductive benefits, colonial living also comes with potential costs.
The family of bee-eaters, Meropidae, consists of 26 species with considerable
diversity in social and breeding behaviors (Burt 2002; Boland 2004). They may be
sedentary or migratory, and pair-breeding and/or cooperative with some species having
extremely complex social organizations at nest sites (Burt 2002; Boland 2004). Because
of the variation in nesting behaviors, this group has been used to examine questions
related to costs and benefits of coloniality, sociality, and the presence of various
reproductive strategies such as cooperative breeding (Burt 2002). Wrege and Emlen
(1991) studied several colonies of white-fronted bee-eaters (Merops bullockoides) to
examine ISNP, finding that parasitizing females tend to remove host eggs from the nest,
and host females frequently discard eggs that are not their own (Elston et al. 2007). In
some species, nests are rarely left unguarded due to threats of predation and ISNP
(Burt 2002). In other species of bee-eaters, males guard their mates against EPCs, as
in the blue-tailed bee-eater (M. philippinus; Burt 2002). However, males frequently make
use of EPCs if provided an opportunity as a means to sire additional offspring without
the cost of parental investment (del Hoyo et al. 2001; Elston et al. 2007).
Growing evidence suggests that both EPCs and ISNP occur frequently enough in
birds to produce patterns of relatedness that differ appreciably from those inferred from
observational studies. The presence of these reproductive strategies could have major
effects when examining relatedness and the identities of birds performing behaviors
such as ISNP and multiple mating (Jones et al. 1991). Early studies examining
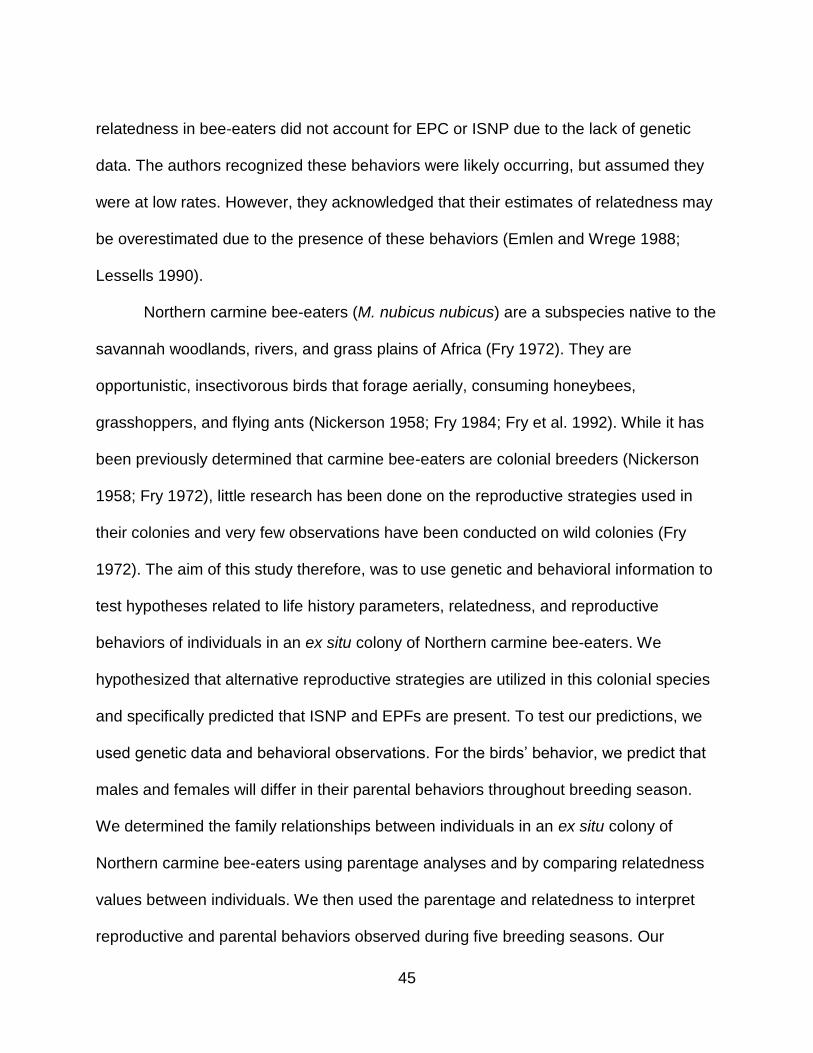
45
relatedness in bee-eaters did not account for EPC or ISNP due to the lack of genetic
data. The authors recognized these behaviors were likely occurring, but assumed they
were at low rates. However, they acknowledged that their estimates of relatedness may
be overestimated due to the presence of these behaviors (Emlen and Wrege 1988;
Lessells 1990).
Northern carmine bee-eaters (M. nubicus nubicus) are a subspecies native to the
savannah woodlands, rivers, and grass plains of Africa (Fry 1972). They are
opportunistic, insectivorous birds that forage aerially, consuming honeybees,
grasshoppers, and flying ants (Nickerson 1958; Fry 1984; Fry et al. 1992). While it has
been previously determined that carmine bee-eaters are colonial breeders (Nickerson
1958; Fry 1972), little research has been done on the reproductive strategies used in
their colonies and very few observations have been conducted on wild colonies (Fry
1972). The aim of this study therefore, was to use genetic and behavioral information to
test hypotheses related to life history parameters, relatedness, and reproductive
behaviors of individuals in an ex situ colony of Northern carmine bee-eaters. We
hypothesized that alternative reproductive strategies are utilized in this colonial species
and specifically predicted that ISNP and EPFs are present. To test our predictions, we
used genetic data and behavioral observations. For the birds’ behavior, we predict that
males and females will differ in their parental behaviors throughout breeding season.
We determined the family relationships between individuals in an ex situ colony of
Northern carmine bee-eaters using parentage analyses and by comparing relatedness
values between individuals. We then used the parentage and relatedness to interpret
reproductive and parental behaviors observed during five breeding seasons. Our

46
analyses allow us to clarify aspects of the behavioral and genetic mating system in the
Northern carmine bee-eater in an ex situ colony. Investigating these factors may
improve the understanding of this relatively under-studied species’ social and
reproductive behavior and yield improvements in the management of this and other
colonial species in an ex situ population by understanding the complex social structure
and balance in a breeding colony.
Materials and Methods
Study Species
The carmine bee-eater colony examined in this study is held in the behind-the-
scenes Avian Research Center (ARC) at Disney’s Animal Kingdom, Lake Buena Vista,
Florida, USA. The population increased in number from 9 individuals in 2006 to 27
individuals in 2012 through both reproduction and transfer into the colony from other
zoological collections. See Elston et al. (2007) for full description of enclosure, diet, and
husbandry protocols. In 2005, a new design to the artificial nest box was implemented
that gave animal keepers better access to nests and chicks, enhanced hygiene, and
provided both better airflow and space, in order to promote parental rearing of young
(Elston et al. 2007). We increased the number of nest tunnels and nest boxes in the
enclosure from 5 in 2005, to 9 in 2006-2010, to 21 in 2011. Additional husbandry
practices were also altered over time which improved fledging success, including

47
replacing viable eggs with dummy eggs and artificially incubating eggs until they were
externally pipped before returning them to the nest boxes to prevent breakage and
potential expulsion from the nest.
Behavioral Data Collection
Behavioral observations were performed during the excavation, nesting, and
chick-rearing phases, following the methods in Elston et al. (2007) from April through
July in the years 2005-2007, 2009, and 2011. This species’ breeding season is compact
and highly synchronized with the entire season from reproduction through fledging
lasting less than 10 weeks each year. The colony was observed for 15 minutes each in
the morning and in the afternoon, approximately 5 days per week for a total of 113.25
observer hours over five years. Birds were individually identified by colored bands. We
recorded all occurrences of birds visiting the nest platform (i.e. landing on the numbered
block outside the nest tunnel; see Fig. 2), entering, and exiting the nest cavity along with
the identification of each individual.
48
Figure 2. Photo of adult carmine bee-eaters (Merops n. nubicus) visiting a nest cavity.
Duration in the nest box was recorded when possible. We also recorded if the individual
was carrying a food item into the nest. A single data collector was utilized for each year
of data collection.
Behavioral Analyses
We segmented each breeding season into three periods: excavation of nest
tunnels, incubation of eggs, and rearing of chicks. Nests were considered active during
the excavation phase if an adult was observed entering and exiting during the
observations and if eggs/chicks were present in later phases. We counted the total
number of times all individuals visited each nest platform during observations each year,
which may be a behavior of males who are mate or nest-guarding, or of birds seeking
EPC or ISNP. All of the following comparisons between males and females were done

49
using mixed models with outcome variables log transformed before analysis. To
determine which birds were most likely to be guarding nests, we evaluated whether the
total number of visits per year between males and females, and between resident and
non-resident males were significantly different. To investigate which birds more
frequently performed parental behaviors (incubation, brooding, and chick provisioning),
we counted the total number of times each individual entered or exited a nest cavity
each year. The male and female with the highest frequency of entering and exiting
throughout each breeding season were determined to be the nest residents and the
social parents of the eggs laid in each nest cavity. All other birds that entered or exited
at lower frequencies were considered non-residents. Additionally, we tested for
differences between males and females in average time spent in nest during the three
stages of the breeding season to further examine parental investment. Finally, we
tested for differences in rates of food provisioning to the nest between male and female
parents. All statistics were calculated with JMP Pro 12.1.0 (2015 SAS Institute, Cary,
North Carolina, USA). Values reported in the Results are mean ± SE.
Genetic Data Collection
Blood samples were collected in 2009 from 15 bee-eaters during routine physical
examinations. Three to 4 drops of blood (~15 µL per drop) were placed into 1.5 mL
tubes containing 1.0 mL of Longmire Buffer (100 mM Tris HCL pH 8.0, 100 mM EDTA,
10 mM NaCl, 0.5% SDS; Longmire et al. 1988). Tissue (liver or muscle) was collected

50
from 32 deceased embryos or chicks between 2009 and 2012 and preserved in ethanol.
Contour feathers were also collected opportunistically from 14 juvenile bee-eaters in
2011 and 2012. In total, DNA samples from 61 individual birds (adults, embryos, or
chicks) were collected for this study. Sampling for this study began in 2010, so prior to
this year only living birds were sampled; however all fertile eggs, chicks and adults were
sampled in 2010 and 2011.
Genomic DNA from tissue and blood was extracted using a standard phenol-
chloroform extraction protocol (Sambrook and Russell 2001). Genomic DNA from
feathers was extracted using a DNeasy Blood & Tissue Kit (Quiagen, Valencia,
California, USA) with modifications as described in Bush et al. (2005). The
concentration of DNA in each sample was determined with a Nano-Drop ND-1000
Spectrophotometer (Thermo Scientific, Wilmington, Delaware, USA) and was visualized
on a 1% agarose gel. All samples were diluted with double-distilled water to a final
concentration of 20 ng µL-1.
We generated eight species-specific microsatellite loci and tested an additional
six loci originally isolated in Merops apiaster which also amplified in Merops ornatus
(Dasmahapatra et al. 2004; Adcock et al. 2006) for this study. We genotyped 61
individuals at these 14 loci. See Supplement 1 for microsatellite loci generation, PCR
conditions and genotyping methods.

51
Genetic Analyses
Eight of the 14 loci were found to be polymorphic and were therefore used for
further analyses (Table 3).

52
Table 3. Characterization of eight microsatellite loci used in carmine bee-eater (Merops n. nubicus) identity and parentage analysis. Loci were amplified using PCR conditions described in the text. Three loci (identified by the symbol ‡) were originally identified in Dasmahapatra et al. 2004. Loci are sorted by rank of cumulative unbiased probability of identity (PI), which was calculated using Gimlet v1.33 (Valière 2002). Number of alleles and allelic richness (based on minimum sample size of 47 diploid individuals) were calculated with FSTAT 2.9.3 (Goudet 1995). Expected and observed heterozygosity were calculated in Gimlet v1.33. The asterisk (*) in the primer sequence denotes a 5’ tail (TGTAAAACGACGGCCAGT) attached to the primer sequence; + in the repeat motif represents an imperfect repeat in the sequence; Ta, annealing temperature; Hexp, expected heterozygosity; Hobs, observed heterozygosity; PIunbiased, unbiased probability of identity; PISIB, probability of identity in a population of all siblings. Note that values for PIunbiased and PISIB are cumulative, such that the value listed for Mnub104 is the cumulative effect of all loci. NE-PP is the non-exclusion probability of the parent pair from CERVUS (Kalinowski et al. 2007) results.
Locus Primer Sequence (5’-3’) Ta (°C)
Repeat motif Size (bp)
Number of
Alleles
Allelic Richness
Hexp Hobs PIunbiased PISIB NE-PP
Be19.2‡
*GTCAAGTGGGCTGTTGGAG 59 (AC)9 189-211 9 8.796 0.82 0.82 0.04408 0.3517 0.16 AAGAGGGGCTACTTCCAAGC
Be2.31‡
*CTTCAGGCAAGTGACCACAG 61 (AC)13 183-211 11 10.719 0.79 0.61 0.002470 0.1315 0.18 CAGAGGGACACCAGAGCTTC
Mnub103 *TGTGATGCAAAAAGCCAAGAGG 62 (GATA)5(GACA)3 231-263 6 5.965 0.70 0.64 0.0003068 0.05731 0.13 CAGGCTGGCTGGTTTTGTCC
Mnub102 *GAATGATATGTCATGGGGGAAT 62 (GATA)8 163-179 5 4.783 0.58 0.59 0.00006349 0.01500 0.47 CAAAAAGGTTCGCCATCACT
Mnub107 *CATCAGCCCATTCACAAAAGACTG 51 (CTAT)5 231-247 5 4.887 0.58 0.46 0.00001394 0.007761 0.44 CATCCAGCTTGCAGAACACGA
Be2.46‡
*AATGGCTGTAAGTGGTCATGG 59 (AC)5n3(AC)3n8(AC)8 198-207 4 4.000 0.55 0.59 0.000003120 0.002197 0.49 TGATTTCATCCCAGATGTGC
Mnub105 *ACACATTGCCATGAGGACAGC 60 +(GATA)12 237-269 7 6.726 0.61 0.80 0.0000007052 0.02899 0.49
TGCACATGGATGCTTTTTGC Mnub104 *ACATTGCCATGGGGACAGC 60 (GATA)13 190-222 7 7.000 0.57 0.61 0.0000001874 0.004124 0.48
TGATTTGAATGCTGCTGTTTGC
Mean 0.65 0.64

53
The software program FSTAT2.9.3 (Goudet 1995) was used to test for deviation from
Hardy-Weinberg Equilibrium and for evidence of linkage disequilibrium. The program
Micro-checker (van Oosterhaut et al. 2004) was used to check for the presence of null
alleles and scoring errors such as peak stuttering or allelic dropout. We also estimated
probability of identity (PI) of the eight polymorphic loci using the program Gimlet (v1.33;
Valière 2002). Gimlet was also used to calculate the observed and expected
heterozygosities for the microsatellite loci used in this population.
From 2006 to 2011, 14 potential sires and 12 potential dams were present in the
colony. A bird was considered a potential parent if it was present when eggs were laid
(May and June of each year). Eleven candidate sires and 10 candidate dams were
genetically sampled, leading to a probability that the sire and dam were included in the
sampled dataset of 78.6% and 83.3% respectively. These a priori probabilities were
used in both CERVUS (v3.0.3; Kalinowski et al. 2007) and COLONY (v2.0; Jones and
Wang 2009) for parentage screening (see Supplement 1 for program settings). The
remaining potential parents (three potential sires and two potential dams) were not
sampled because they died before our samples were collected. During this time period,
we collected genetic samples from a total of 50 offspring (chicks or fertile
eggs/embryos). By examining dates of hatch and each potential parent individual’s
timeline of presence in the colony, we were able to exclude some candidate males from
paternity analysis for 29 of the offspring, and exclude some candidate females from
maternity analysis for all 50 offspring with varying number of potential sires and dams
for each offspring. In both programs, parentage is assigned with confidence levels of
95% (strict) and 80% (relaxed) confidence. We used both programs (CERVUS and

54
COLONY) for parentage screening because they use different methods to assign
parents, and are known to differ in levels of confidence in assignment, with COLONY
typically producing more assignments at a higher confidence level (Ferrie et al. 2013).
We also completed a visual comparison between the genotypes of the offspring and
those individuals identified as their social parents and determined how many loci were
mismatched between the offspring and social parents. Finally, to further examine the
relationships between all individuals in the colony, and to determine relationships that
were not assigned in parentage analyses, we estimated relatedness between all
individuals using Coancenstry (Wang 2011). All three programs assume a genotyping
error rate of 0.02 as suggested by Wang (2004).
Application of Genetic Analyses to Investigate Behavior
We examined life history parameters and occurrence of various reproductive
strategies for this species, including age at first and last reproduction, clutch size,
multiple paternity in clutches, ISNP, and males with multiple mates. In these analyses,
we only considered genetic parentage assignments that were assigned with >95%
confidence in both programs unless specifically noted. To investigate if inbreeding is
occurring, we also compared the relatedness of behavioral parents at each nest and,
when both parents of an egg were assigned with >95% confidence in both COLONY
and CERVUS, we examined relatedness of the genetic pair.

55
Results
Behavioral Analyses
In five years of observations, we determined 30 of the 50 offspring’s social
parents (individual male and female) through observations of birds entering/exiting the
nests (Fig. 3; Table 13 in Supplement).

56
Figure 3. Total enters to and exits of each nest tunnel per individual bird by year. The birds that had the highest number of enters/exits combined per year were considered the social parent of the eggs/chicks in the nest. Gray highlighted nest tunnels are those that had eggs/chicks present. The male and female with the most enters/exits to each nest are identified by ♂ and ♀ symbols.
The social parents were considered the resident of the nest tunnel, and all birds that
visited at lower rates were considered non-residents of that nest tunnel. Throughout all

57
stages of the breeding season (excavation, incubation, chick rearing), birds other than
the social parents were also observed visiting the nest tunnel. Total visits per year were
lognormally distributed, so we transformed to natural log of visits per year, and
considered year and bird ID as random effects in our mixed models. Males were
observed visiting the nest tunnels more often than females, although this was not
significant (t = -1.77, DFDen = 26.4 p = 0.09) and there was no evidence that males that
were the social parent or resident at the nest tunnel visited more than non-resident
males (t = -0.73, DFDen = 37.0, p = 0.47).
Prior to chicks hatching, multiple birds in addition to the social parents were
observed entering and exiting nest tunnels. Among all active nest tunnels and prior to
chicks hatching, 66.67% were entered/exited by non-social parents during excavation
and incubation. When examining differences during the three periods of the breeding
season and the two sexes, the duration of time spent in the nest tunnel was significantly
different between sex and period (Fig. 4; F5, 58 = 8.047, p < 0.0001) with females
spending longer time in the nest than males, and incubation period having the longest
entrances by females.

58
Figure 4. Average time in nest per entrance/exit (min hr-1) of all males and females during three nesting phases: excavation (M = 10, F = 10), incubation (M = 13, F = 11), and chick rearing (M = 10, F = 10). Mean ± SE for each phase.
When examining food provisioning (number of food items brought to cavity per hour) by
each parent, males brought food 0.67 ± 0.21, n = 10, times per hour, and females
brought food 0.51 ± 0.16, n = 10, times per hour. These data were also lognormally
distributed and after transforming and using a mixed model which examined difference
in sex with year and bird ID as random factors, there was no difference in the rate that
males and females provisioned nests (t = -0.78, DFDen = 25.1, p = 0.44). Food
provisioning by non-social parents was only observed twice throughout the study.

59
Genetic Analyses
The eight polymorphic loci were found to be in Hardy-Weinberg equilibrium using
the Bonferroni corrected significance value of α = 0.00625, and there was no evidence
of linkage disequilibrium between loci based on the Bonferroni corrected significance
value of α = 0.001786. Locus Be2.31 showed signs of null alleles when analyzed with
Micro-checker; however, there was no evidence of scoring error due to stuttering or of
allelic dropout. The cumulative unbiased probability of identity (PI; over all loci) was
1.874 x 10⁻⁷, suggesting that approximately one in 10 million genotypes will match by
chance alone and the PI in a population comprised of full siblings was 2.197 x 10⁻³,
suggesting that approximately one in 450 genotypes would match by chance if all
individuals were full siblings. Therefore, these eight loci show sufficient discrimination
ability and were used in parentage screening and relatedness analyses.
The parentage of each offspring hatched in the population obtained from the
behavioral observations and the two methods of assignment based on molecular
markers (COLONY and CERVUS) are shown in Table 13 in the supplemental materials.
We analyzed parentage in 50 offspring (embryos and chicks) and thus there were 50
potential pairings. Of the two assignment programs, analyses from COLONY resulted in
more assignments with higher confidence (sires: 35 with strict, 4 with relaxed
confidence, 7 with low confidence, and four offspring not assigned a sire; dams: 31 with
strict, 3 with relaxed confidence, 13 with low confidence, and two offspring not assigned
a dam) than the assignments from CERVUS (sires: 20 with strict, and 16 with relaxed
confidence, 13 with low confidence, and 1 offspring not assigned a sire; dams: 19 with

60
strict, 20 with relaxed confidence, 10 with low confidence, and one offspring not
assigned a dam; Table 13). In comparing the congruence of assignments between the
two programs, 34 assignments of sires were the same in both programs, and 35
assignments of dams were the same. Non matching assignments are also displayed in
Table 13.
Application of Genetic Analyses to Investigate Behavior
Basic life history parameters for this species were determined from the results of
parentage analyses. Both males and females were reproductively viable before they
reached one year (eggs are laid or fertilized at slightly older than 11 months). The oldest
male to have fertilized an egg was at least 17 years, and the oldest female to lay a
fertile egg was at least 13 years. Both of these birds were wild caught and have
estimated hatch years, so these ages may be underestimates. One female was
assigned as the dam to four eggs in 2010 with >95% confidence and an additional three
eggs with >80% confidence, suggesting females’ fecundity may be 1-7 eggs in one
breeding season. These eggs were spread out across three nests, such that total
fecundity is larger than clutch size, which was observed to be 1-5 eggs per nest with an
average of 2.8±1.08 in 2010 and 2011 (years for which complete nests were sampled,
see supplemental results, Table 13). Our observed clutch size is slightly greater than
previous estimates by Nickerson (1958), who determined that M. n. nubicus had clutch
size ranging from 1-3 in natural colonies.

61
When comparing the social parents to the genetic parents, we found that 15 sires
and 15 dams were both socially and genetically identified as parents, with both
assignment programs giving the same parentage assignment, although the confidence
ranged from no confidence to high confidence in the assignments (Table 13). In all of
these cases, where both programs assigned the same individual as the social parent,
the visual comparison of genotypes matched completely or in four cases there was just
one loci mismatched. Also, an additional 6 sires and 4 dams matched as social parent
and genetic parent in one of the assignment programs, and in these cases there were
two loci mismatches identified. However, there were 4 sires and 5 dams that the genetic
assignments were matching in both programs, yet the social parent assignment did not
match, suggesting the presence of EPF and/or ISNP. The number of loci mismatched in
these cases ranged from 0-7. We found clutches with multiple paternity in both 2010
and 2011 (Table 13). In 2010, tunnel 17 had two eggs laid by the same female that
were sired by different males (>95% sire assignments COLONY; Table 13). Females
were also found to parasitize the nest of other pairs; specifically, four instances of ISNP
were found in 2011(>95% dam assignments COLONY; Table 13). Males were found to
mate multiply and use a strategy of EPF. In 2011, in two cases we confirmed with >95%
confidence in parentage assignments males that had offspring with their social mate,
but also sired offspring with other females. In these cases where we suggest ISNP or
EPF, there are almost always mismatches in the genotypes between offspring and
social parents (Table 13). In total, when both methods assigned parentage with high
confidence, we found that 28.6% of all nests had ISNP by females (4 of 14) and 14.3%

62
of the nests had EPF by males (2 of 14) across the four years where both genetic and
behavior data were collected.
The average relatedness in the colony was 0.11 ± 0.004. Social pairs were
related to each other with an average relatedness of 0.14 ± 0.05, and genetic pairs that
were assigned to an offspring with >80% confidence had an average relatedness of
0.09 ± 0.05. Comparing the parentage results and relatedness values, we found that
most pairs, both social and genetic, were unrelated (11 of 16, and 10 of 12
respectively). However, we did observe both social and genetic pairings of parent-
offspring, full or half siblings, and grand-parent to grand-offspring. Only two of these
genetic pairings (one father-daughter, one half-sibling) resulted in living, inbred
offspring.
After chicks began hatching, 24.24% of tunnels had individuals that were not the
social parents enter or exit. The total time non-social parent individuals were observed
spending time in the tunnels was low (98.12 s ± 48.79) across the four weeks post
hatching. In just two cases, a non-social parent bird was observed entering with food.
Both observations were of male birds. We could not assess the relationship of the first
bird to the parents of this nest, as it was not included in our genetic sampling. The
second individual was likely unrelated to the male parent at this nest (r = 0.07) but was
the offspring of the female parent at this nest-box location from the previous year (r =
0.62, >95% confidence dam assignment in both COLONY and CERVUS).
63
Discussion
In this study, we observed behaviors during the breeding season related to
parental investment and reproductive output, and used genetic analyses to determine
parentage and relatedness between individual Northern carmine bee-eaters in an ex
situ colony. We examined behavioral differences in males and females parents, finding
differing levels of contribution in behaviors from each sex depending on phase of the
breeding season. Using two methods of parentage analysis, we were able to determine
one or both parents of all 50 offspring from the colony with at least 80% confidence, and
supplement the parentage assignments by performing a visual comparison of number of
loci mismatching between social parents and genetic assignments, as well as
calculating relatedness values between all individuals. Finally, we found that birds made
use of alternative reproductive strategies including ISNP and EPFs.
When examining behaviors that may play a role in reproduction and levels of
parental investment, males were observed visiting the nests more than females,
although this result was not significantly different. These results are similar to the nest-
visiting observed at the beginning of the breeding season in wild colonies of carmine
bee-eaters in which visiting nests, but not entering, may serve as a reproductive
strategy for either resident or non-resident males (Fry 1972). For the former, it may be
advantageous to guard exiting females or nest contents. For the latter, nest visiting can
provide EPF or nest-guarding opportunities (Burt 2002). In our study, females were
observed spending more time than males in the nest during the incubation period (Fig.
4) suggesting that females invest time incubating and tending to eggs, whereas males

64
may play a greater role in guarding the nest against intra- and inter-specific predation.
Indeed males were often observed perched nearby the holding box during the
incubation period (Elston et al. 2007). However, we found no difference in duration
spent in the nest between males and females during excavation and chick rearing
(Elston et al. 2007; Fig. 4). Females may reduce their maternal investment during these
phases due to the high energy requirements in laying and incubating eggs, and as a
measure against ISNP (Emlen and Wrege 1986) or they may be the sex more
biologically equipped to do the majority of incubation as obvious brood patches have
been described in the females of black-headed bee-eater (M. breweri; Schmidt and
Branch 2005). More research into sex differences in parental care and investment may
uncover why these differences exist.
When observing rates of food provisioning to chicks, we found no difference
between male and females, also agreeing with the findings of Elston et al. (2007),
suggesting that both parents provide equal investment during rearing, and males are
either confident in their paternity or cannot distinguish between chicks that are not
genetically their offspring. In fact, as part of the husbandry in this colony to reduce egg
breakage, eggs are incubated, and then not necessarily returned to the tunnel in which
they were laid. While this may be a confounding factor in studying parental behavior, we
do not have any evidence that suggests that the birds provide less care to chicks that
are not their own; indeed the rate of food provisioning to chicks was similar across nest
boxes (Elston et al. 2007, G. M. Ferrie personal observation) and males of many avian
species do not have the ability to discriminate kin (Kempenaers and Sheldon 1996).
These results suggest that Northern carmine bee-eaters provide equal investment in

65
feeding offspring regardless of parentage and future studies that specifically manipulate
which nests chicks are returned to could test kin recognition (Komdeur and Hatchwell
1999) and parental investment in this ex situ environment.
With regards to cooperative breeding in this species, we cannot confirm that
helpers are present during chick rearing. Provisioning by non-parental birds was only
observed twice in five years; in 2007 we observed an unpaired adult male enter one
nest with food three times, and in 2011 we observed a juvenile male that was paired
and successfully fledged chicks at a nearby nest provision the nest that was located
~0.5 m directly below his own nest three times as well. We could not assess the
relationship of the first bird to the parents of this nest and the second individual was only
related to the female parent. This one observation of helping at a related female’s nest
may have just been a random occurrence. While males are more commonly observed
as helpers in bee-eaters (Brooke 1994) and having grown offspring remain to assist in
rearing young is common (Emlen and Wrege 1992), more regular observation of
provisioning by non-parents will be necessary to confirm that helpers are present at the
chick rearing stage of breeding season in this ex situ colony (Boland 2004). We may not
have observed typical helping behavior in this colony for a few reasons. First, food
resources are provided to the birds, and while they are not unlimited, there is also not
much food competition, thus more birds can dedicate energy to reproductive attempts at
their own nest rather than needing to forage. At this point nest sites are also not limited,
as every year there are nests that do not get utilized. Second, the average relatedness
in the colony was ~0.11, or at a level less than half-siblings. Perhaps colony relatedness
needs to be higher before the benefits of helping kin outweigh the costs of attempting

66
reproduction. Finally, it is also possible that Northern Carmine Bee-eaters are not
cooperative at all, as in their sister taxon (Emlen 1990).
As predicted, both males and females were found to use reproductive strategies
other than monogamy. From the female’s perspective, we found clutches with multiple
paternity and they were also found to parasitize the nest of other pairs. Both fecundity
and clutch size were larger than wild populations, which may be an artefact of being in a
resource-rich ex situ environment, which may enhance the levels of ISNP leading to
larger clutches. Males were found to mate multiply and use a strategy of EPF. EPF may
occur more frequently in this population, as we only considered cases of high
confidence assignment which were supplemented with visual comparisons of number of
mismatches of loci in genotypes (supplemental information, Table 13). These behaviors
are all common methods that both males and females use to increase their reproductive
output, and reduce parental care. Paired males make use of a mixed mating strategy in
which the male, while remaining monogamously paired, takes advantage of extra pair
opportunities, made possible by synchronized colonial breeding (Trivers 1972; Emlen
and Wrege 1986; Rohwer and Freeman 1989). White-fronted bee-eater females were
found to parasitize the nests of parents or close relatives, suggesting that some hosts
will tolerate ISNP by close kin (Emlen and Wrege 1986). However, white-fronted bee-
eaters will toss eggs that have been dumped in their nest by parasitizing females and
they are highly territorial, ejecting intruders from their nests with physical contact (Emlen
and Wrege 1986; Boland 2004). In this population of Northern carmine bee-eaters, we
have observed eggs thrown out of nests and breakage within the nest, which may be
the results of females removing eggs that are not her own. We have also observed long

67
lasting aggressive interactions between individuals in the nest tunnels. ISNP may pose
the primary threat to certainty of parentage in bee-eaters, even more so than forced
copulations resulting in EPFs (Emlen and Wrege 1986). Future studies should compare
the rates of these behaviors to determine their frequency.
In general, forced or voluntary EPCs and ISNP are two of the consequences and
costs of social living (Emlen and Wrege 1986; Yom-Tov 2001), having fitness benefits
for some individuals, but not all. Birds remain in colonies and sustain these potential
costs, suggesting that the selective advantage of colonial living outweighs the costs
(Emlen and Wrege 1986). In some species, breeding pairs exhibit moderately high
levels of social monogamy, with pairs of European and white-fronted bee-eaters
renesting together at 88% and 87% of nests respectively (Lessells and Krebs 1989;
Emlen 1990) with both sedentary and migratory bee-eaters having similar rates of pair
fidelity (Boland 2004). However, in our colony, we found some pairings with the same
mate in following seasons (as in 3 pairs in 2004 and 2005 as in Elston et al. 2007),
whereas others paired with different individuals year after year. With more years of
observation on a greater number of pairs, we should be able to have a better
understanding of how often pairs choose the same mate the next year, and how often
they find a new mate; however the re-pairing rate in our colony may not be comparable
to large, migratory, natural populations, as our population is relatively small and does
not have a natural ability to migrate or disperse. In bee-eater species, inbreeding is
avoided by using a strategy in which females disperse to join new colonies and the
social organization is patrilocal extended family groups or clans (Emlen and Wrege
1992). At this time, our colony is not managed this way with no emigration from the

68
colony; however there is occasional immigration in the form of newly introduced birds.
There have been examples of inbreeding in the colony and we may be underestimating
inbreeding, as we have been conservative in accepting only parentage assignments
with >80% probability. Future colony management will need to include a strategy that
allows for dispersal of females to avoid inbreeding when choosing a mate.
In summary, our study found that bee-eaters in an ex situ setting use a flexible
social system that enables individuals to take advantage of suitable nest conditions and
mating strategies as they arise, including EPFs and ISNP (Boland 2004). These
strategies allow the birds to improve individual reproductive output while taking
advantage of the high density of individuals and nest sites and greater foraging
efficiency which are characteristic of colonial living (Beauchamp 1999). Future studies
or experiments could examine these reproductive behaviors to determine if individuals
maintain one or multiple strategies, or if they choose different strategies each year.
Also, as colony size increases and resources such as nest tunnels or living space
become more limited, will birds be more likely to choose a strategy based on their age
or experience or some other factor? We have seen our colony grow from nine to 27
individuals and the number of nest tunnels provided was increased from five to 21.
While nest tunnels have not yet been limiting (the maximum number excavated in 2011
was 16 and only eight of these tunnels were used by a pair throughout the entire
season) this is obviously a finite resource which has the potential to influence pair
success, mate choice, and other factors in reproduction (Yom-Tov 2001). This study
gave some insight into the various reproductive strategies present in an ex situ colony
of Northern carmine bee-eaters. Due to the small size of our colony compared to natural

69
settings, the specific frequency of these behaviors may not be generalizable to an in situ
colony, however little information currently exists from observational field studies on this
species. Therefore this study may serve as a comparative baseline for future studies on
the reproductive behavior of this species in their natural environment. Furthermore, this
study offers zoological managers concerned with reproduction of birds in an ex situ
setting a better understanding of the complexity of colonial managed species. Our
methods can be used to evaluate management consequences including effective
number of breeders and the impact on loss of genetic variability (Gautshi et al. 2003) in
a colonial setting.
Acknowledgments
We would like to thank Disney’s Animals, Science and Environment for providing
samples and funding for this project, members of the Science Team (J Bohling, J
Elston, K Finn, C Fuertges, A Meier, and C Tolliday) for assisting with data collection
and organization, to A Alba for being a statistical thought partner, and to the Disney’s
Animal Kingdom® aviary zoo managers (S Maher and J Mejeur), animal keepers at the
Avian Research Center (K Graham, E Moore, B Nelson, D Olsen, and G Quiñones) and
the Department of Animal Health, particularly V Sikorski, for supporting sample
collection. Thanks also to members of the Hoffman and Parkinson Labs for their
assistance in the lab and comments on this manuscript, particularly M LaFave, C Long,
M Lawrence, C Parkinson, A Sarto, J Strickland, G Territo, A Trujillo, and V Villanova.

70
Thank you to two anonymous reviewers for providing comments which improved this
manuscript. This research was approved by the Disney’s Animal Care and Welfare
Committee, as well as the University of Central Florida IACUC. The authors declare that
they have no conflict of interest.
References
Adcock G.J., Hodges K., Boland C.R.J., Cockburn A., Ebert C., Heinsohn R. (2006)
Microsatellite loci for behavioural studies of rainbow bee-eaters (Merops ornatus:
Aves). Mol Ecol Notes 6: 734-736.
Alcaide M., Negro J.J., Serrano D., Antolín J.L., Casado S., Pomarol M. (2010) Captive
breeding and reintroduction of the lesser kestrel Falco naumanni: a genetic
analysis using microsatellites. Cons Genetics 11: 331-338.
Beauchamp G. (1999) A comparative study of breeding traits in colonial birds. Evol Ecol
Res 1: 251-260.
Boland C. (2004) Breeding biology of rainbow bee-eaters (Merops ornatus): a migratory,
colonial, cooperative bird. The Auk 121: 811-823.
Bouchard L.C., Anderson M.J. (2011) Caribbean flamingo resting behavior and the
influence of weather variables. J of Ornith 152: 307-312.
Brooke M. (1994) Bereaved bee-eaters turn nursemaid to the relatives (behavior of
European bee-eaters). New Sci 142:15.

71
Burt D.B. (2002) Social and breeding biology of bee-eaters in Thailand. Wilson Bull 114:
275-279.
Bush K.L., Vinsky M.D., Aldridge C.L., Paszkowski C. (2005) A comparison of sample
types varying in invasiveness for use in DNA sex determination in an endangered
population of Greater Sage-Grouse (Centrocercus urophasianus). Conserv
Genetics 6: 867-870.
Covas R., Daleky A., Caizergues A., Doutrelant C. (2006) Kin associations and direct
vs indirect fitness benefits in colonial cooperatively breeding sociable weavers
Philetairus socius. Behav Ecol Sociobiol 60: 323-331.
Covas R., Griesser M. (2007) Life history and the evolution of family living in birds. Proc
R Soc B 274: 1349-1357.
Danchin E.,Wagner R.H. (1997) The evolution of coloniality: the emergency of new
perspectives. TREE 12: 342-347.
Dasmahapatra K.K., Lessells C.M., Mateman A.C., Amos W. (2004) Microsatellite loci in
the European bee-eater, Merops apiaster. Mol Ecol Notes 4: 500-502.
del Hoyo J., Elliott A., Sargatal J. (2001) Family Meropidae (bee-eaters). In: Handbook
of the birds of the world 6: Mousebirds to hornbills. Barcelona, Spain: Lyns
Edicions, 286-325.
Elston J.J., Carney J., Quinones G., Sky C., Plassé C., Bettinger T. (2007) Use of novel
nest boxes by carmine bee-eaters (Merops nubicus) in captivity. Zoo Biol 26: 27-
39.
Emlen S.T. (1990) White-fronted bee-eaters: helping in a colonially nesting species. In:
Stacy, P.B. and Koenig, W.D. (eds). Cooperative Breeding in Birds: Long term

72
Studies of Ecology and Behaviour. Cambridge, United Kingdom: Cambridge
University Press, 489-526.
Emlen S.T., Wrege P.H. (1986) Forced copulations and intraspecific parasitism: two
costs of social living in the White-fronted Bee-eater. Ethology 71: 2-29.
Emlen S.T., Wrege P.H. (1988) The role of kinship in helping decisions among white-
fronted bee-eaters. Behav Ecol Sociobiol 23: 305-315.
Emlen S.T., Wrege P.H. (1992) Parent-offspring conflict and the recruitment of helpers
among bee-eaters. Nature 356: 331-333.
Ferrie G.M., Cohen O.R., Schutz P., Leighty K.L., Plasse C., Bettinger T.L., Hoffman
E.A. (2013) Identifying parentage using molecular markers: improving accuracy
of studbook records for a captive flock of marabou stork (Leptoptilus
crumeniferus). Zoo Biol 32: 556-564.
Fry C.H. (1972) The social organization of bee-eaters (Meropidae) and cooperative
breeding in hot-climate birds. The Ibis 114: 1-14.
Fry C.H. (1984) The bee-eaters. San Diego, California: Academic Press.
Fry C.H., Fry K., Harris A. (1992) Kingfishers, bee-eaters, and rollers. Princeton, NJ:
Princeton University Press.
Gautshi B., Müller J.P., Schmid B., Shykoff J.A. (2003) Effective number of breeders
and maintenance of genetic diversity in the captive bearded vulture population.
Heredity 91: 9-16.
Goudet J. (1995) FSTAT (Version 1.2): a computer program to calculate F-statistics. J
Hered 86: 485-486.

73
Jones C.S., Lessells C.M., Krebs J.R. (1991) Helpers-at-the-nest in European Bee-
eaters (Merops apiaster): a Genetic Analysis. In: Burke, T., Dolf, G., Jeffreys,
A.J. and Wolff, R. (eds). DNA Fingerprinting: Approaches and Application. Basel,
Switzerland: Birkhauser Verlag, 169-192.
Jones O., Wang J. (2009) COLONY: a program for parentage and sibship inference
from multilocus genotype data. Mol Ecol Resour 10: 551-555.
Kalinowski S.T., Taper M.L., Marshall T.C. (2007) Revising how computer program
CERVUS accommodates genotyping error increases success in paternity
assignment. Mol Ecol 16: 1099-1106.
Kempenaers B., Sheldon B.C. (1996) Why do male birds not discriminate between their
own and extra-pair offspring? Anim Behav 51: 1165-1173.
Komdeur J., Hatchwell B. J. (1999) Kin recognition function and mechanism in avian
societies. TREE 14: 237-241.
Leighton G.M. (2014) Sex and individual differences in cooperative nest construction of
cooperative weavers Philetarius socius. J of Ornith. 155: 927-935.
Lessells C.M. (1990) Helping at the nest in European bee-eaters: who helps and why?
In: Blondel, J., Gosler, A.G., Lebreton, J.K., and McCleery, R.H. (eds).
Population Biology of Passerine birds: An integrated approach. NATO ASI
Series, 357-368.
Lessells C.M., Krebs J.R. (1989) Age and breeding performance of European bee-
eaters. The Auk 106: 375-382.
Li S., Brown J.L. (2002) Reduction of maternal care: a new benefit of multiple mating?
Behav Ecol 13: 87-93.

74
Longmire J.L., Lewis A.K., Brown N.C., Buckingham J.M., Clark L.M., Jones M.D.,
Meincke L.J., Meyne J., Ratliff R.L., Ray F.A., Wagner R.P., Moyzis R.K. (1988)
Isolation and molecular characterization of a highly polymorphic centromeric
tandem repeat in the family Falconidae. Genomics 2:14-24.
Nickerson B. (1958) Some observations on the carmine bee-eater merops nubicus
gmelin in the French Sudan. Ibis 100: 454-457.
Rohwer F.C., Freeman S. (1989) The distribution of conspecific nest parasitism in birds.
Can J Zool 67: 239-253.
Rolland C., Danchin E., de Frainpont M. (1998) The evolution of coloniality in birds in
relation to food, habitat, predation, and life-history traits: a comparative analysis.
The American Naturalist 151: 514-529.
Sambrook J., Russell D.W. (2001) Commonly used techniques in molecular cloning,
Appendix 8. In: Molecular Cloning 3(3). Cold Spring Harbor, New York: Cold
Spring Harbor Laboratory Press.
Schmidt B.K., Branch W.R. (2005) Nests and eggs of the black-headed bee-eater
(Merops breweri) in Gabon, with notes on other bee-eaters. Ostrich 76: 80-81.
Stacey P.B., Koenig W.D. (1990) Cooperative breeding in birds: long-term studies of
ecology and behaviors. Cambridge, United Kingdom: Cambridge University
Press.
Swinnerton K.J., Groombridge J.J., Jones C.G., Burn R.W., Mungroo Y. (2004).
Inbreeding depression and founder diversity among captive and free-living
populations of the endangered pink pigeon Columba mayeri. Animal
Conservation 7: 353-364.
75
Trivers R.L. (1972) Parental investment and sexual selection. In: Campbell, D. (ed).
Sexual Selection and the Descent of Man. Chicago, Illinois: Aldine Press, 136-
179.
Wang J. (2011) Coancestry: a program for simulating, estimating and analyzing
relatedness and inbreeding coefficients. Mol Ecol Resour 11: 141-145.
Wang J. (2004) Sibship reconstruction from genetic data with typing errors. Genetics
166: 1963-1979.
Wittenberger J.F., Hunt G.L. (1985) The adaptive significance of coloniality in birds. In:
Farner, D.S., King, J.R. and Parkes, R.C. (eds). Avian Biology Vol. 8. New York,
New York: Academic Press, 1-78.
Wrege P.H., Emlen S.T. (1991) Breeding seasonality and reproductive success of
White-fronted bee-eaters in Kenya. The Auk 108: 673-687.
Wrege P.H., Emlen S.T. (1987) Biochemical determination of parental uncertainty in
White-fronted Bee-eaters. Behav Ecol Sociobiol 20: 153-160.
Yom-Tov Y. (2001) An updated list and some comments on the occurrence of
intraspecific nest parasitism in birds. Ibis 143: 133-143.

76
CHAPTER FOUR: USING A MOLECULAR GENETIC DATASET TO UNDERSTAND POPULATION GENETIC HISTORY IN AN EX SITU
MANAGED POPULATION OF GUAM KINGFISHERS (TODIRAMPHUS CINNAMOMINUS)
Introduction
Biologists are becoming increasingly interested in using molecular genetic
approaches and understanding the transfer of genetic material from one generation to
the next in order to answer questions of ecological, evolutionary, and conservation
relevance (Manel et al. 2005). Contemporary events in population history can be
studied using assignment methods, which use genetic information to determine
population membership of individuals and answers questions related to classification
and clustering of individuals and populations (Manel et al. 2005). Traditional assignment
tests have been used to assign individuals to their population or location of origin and
have been applied to areas such as identifying the source of stranded common
bottlenose dolphins (Tursiops truncatus) in the Gulf of Mexico after the 2010 Deepwater
Horizon oil spill (Thomas et al. 2017), and in wildlife forensics to identify movement of
trafficked plant and animal materials, such as in corals (Ledoux et al. 2016). Genetic
mixture analysis aims to uncover genetic composition of a population and how those
populations change in space and time and is used extensively in fisheries management
to identify composition of specific stocks or commercial lineages (Liu et al. 2016).
Finally, parentage analysis, which involves assigning the parents of specific individuals,

77
has been used to understand mating structure and behavioral ecology of species
(Kaiser et al. 2016), detecting family groups within populations and tracing individuals,
such as captive-bred fishery-hatched fish when they escape or mix with wild populations
(Bylemans et al. 2016). Controlled breeding programs, for both commercial and
conservation purposes, extensively apply the assignment methods discussed above to
improve management and attain goals such as increased economic gain through
production goals in livestock (Raoul et al. 2016), selection of traits in agriculture or
aquaculture (Chavanne et al. 2016), or maintenance of gene diversity and adaptive
potential in endangered species (Attard et al. 2016). Although molecular genetic
techniques have been used extensively to study aspects of population genetics in
natural populations, more recently, these same techniques have been incorporated into
the study ex situ populations as a means to better manage these assurance
populations.
The goals of ex situ conservation breeding programs include maintaining
populations so that they are both demographically self-sustaining and genetically
healthy (Lacy 1994). From a genetic perspective, the specific goals of ex situ
management are to minimize the loss of genetic diversity in order to maintain future
adaptive potential in species that are candidates for eventual reintroduction to natural
habitats (Frankham 2008, Haig et al. 1990, Williams and Hoffman 2009). The objective
of genetic management is the preservation of the genetic variation of the population
from which the founders were drawn, as well as to improve on the rate of loss of genetic
variation that would be expected in random mating situations (Caballero and Toro
2000). Numerous studies have shown that genetic management based on pedigree

78
analysis produces the most genetically diverse populations, particularly through the
strategy of equalizing founder contribution through minimizing mean kinship (Ballou and
Lacy 1995, Haig et al. 1990).
Gene diversity (GD), also termed expected heterozygosity, is a common
measure of genetic variation within a population (Wright 1969, Nei 1973). In the
absence of new variation introduced to a population by mutation or immigration, in the
absence of natural selection, and in a randomly mating population of constant size,
gene diversity decays due to genetic drift according to
𝐺𝐷𝑡 = 𝐺𝐷0 × [1 −1
2N]
t
( 1 )
where t denotes number of generations, N is the number of individuals in each
generation, and 𝐺𝐷0 is initial gene diversity (Lacy 1995). Projections of the value of GD
at time t will differ based on the starting values used in the above equation, specifically
in the value of GD0 and in N. In pedigree management of ex situ populations, GD0 is
assumed to be one, given that the GD0 of the baseline population is not known and the
founders are assumed to be a representative sampling of the wild population (Lacy
1995). The value for N is the number of founders, which are also assumed to be
randomly sampled and unrelated.
In order to calculate gene diversity in a population as described above, an
accurate pedigree of the population in question is essential. Pedigree analysis, or
parentage testing, is a powerful tool in studies of population demographics (Launhardt

79
et al. 2001), ecology and behavior (Mitani et al. 2002) and estimation and minimization
of individual inbreeding (Bulmer 1973; Tzika et al. 2009). It has also been used in
conservation management for estimation of effective population size (Morin et al. 2004).
In cases where animals have an unknown pedigree, molecular markers can be used to
create a relative ranking of degrees of relatedness (Haig et al. 1995; Henkel et al. 2011)
and kinship (Blouin 2003), or given complete sampling, recreate a complete pedigree.
However, in an open system, where not all potential parents have been sampled, and
with limited genetic information and high genotyping error, exclusion methods may fail
to assign parentage or assign false parentage (Hauser et al. 2011). Additionally,
estimates of diversity based on pedigree are limited when parentage information is
missing (Henkel et al. 2011). Increasingly, managers of ex situ populations are
combining molecular genetic analyses with pedigree analyses to allow for calculations
of gene diversity in those populations where pedigree information is missing or
questionable, and if founders of the ex situ population were related to another (Henkel
et al. 2011, Russello and Amato 2004, Witzenberger and Hochkirch 2011). This is done
to provide a more accurate picture of the current genetic structure of the population
(Henkel et al. 2011) and to fill in gaps in pedigree information (Russello and Amato
2004). Depending on methods of genetic management, pedigree information and/or an
understanding of genetic structure is instrumental in understanding the exchange of
genetic material from parents to offspring and subsequent loss over time.
However, the calculations of loss of gene diversity in pedigree analysis are
theoretical and based on expected loss according to the pedigree. Two common
methods to estimate loss of diversity in a pedigree include gene-drop simulations, in

80
which hypothetical alleles are assigned to founders and Monte Carlo methods are used
to assign a random genotype for each descendant (MacCluer et al. 1986) and through
the use of mean kinship values, which calculate the probability that two alleles sampled
at random from homologous loci will be homozygous by descent from a common
ancestor (Lacy 1995). Both methods are based on two main assumptions 1) that the
founders of the pedigreed population are randomly sampled, unrelated, and thus
possess unique alleles (Lacy 1995; MacCluer et al. 1986), and 2) that the variance
effective population size (Ne) is representative of the reproduction in the population,
such that the genes transmitted to each generation are a random sample of the genes
of the previous generation (Lacy 1995). Calculating gene diversity using these methods
is the first step to understanding rate of loss of genetic diversity in ex situ managed
populations. However, these measurements of gene diversity have never been
validated by calculating direct loss of genetic diversity at the molecular level by knowing
the true relationships among the founders and how alleles are being passed on relative
to the individuals breeding in the population. Identifying the congruence of pedigree
gene diversity and gene diversity calculations from genetic markers is critical for future
conservation management goals. Ex situ assurance populations typically only use
pedigree data and natural populations typically only utilize molecular genetic data and
as the need for a continuum of management develops, or comparison between wild and
ex situ populations becomes more evident, the tools used to understand transfer of
genetic material between individuals and populations should be comparable.
Various genetic tools have been developed to help evaluate and quantify loss of
genetic diversity within populations. These tools can be used to empirically monitor and

81
test how well ex situ populations are being managed to effectively limit loss of diversity
in these populations (Lacy 2009). Previously, neutral microsatellite loci have been used
extensively to examine founder effects, bottlenecks (Hawley et al. 2006), population
fragmentation, genetic drift (Taylor et al. 2007), and effective population size (Johnson
et al. 2004). Theoretical models predict that small, bottlenecked populations will show
reduced levels of genetic variation at these neutral loci compared to pre-bottleneck
levels (e.g. Groombridge et al. 2000, Wisely et al. 2002). Single nucleotide
polymorphisms (SNPs) represent a more recently developed class of polymorphic
genetic marker common in most genomes now being used in population based studies
(Vignal et al. 2002). SNPs can be used to survey both neutral variation as well as genes
under selection in natural populations (Tokarska et al. 2009). SNPs offer the potential
for genome wide scans of selectively neutral or adaptive variation, with simple mutation
models, powerful analytical methods, and application to noninvasive and historical DNA
(Morin et al. 2009). It has been shown that using as few as 40 - 100 SNPs, depending
on level of heterozygosity, can provide high probabilities of parentage exclusions and
has the power to identify individuals (Morin et al. 2009), particularly when studying
historical demography, in which many unlinked nuclear loci may be needed to estimate
population genetic parameters with statistical confidence (Brumfield et al. 2003).
However, more recent studies have demonstrated that using reduced representation
libraries have enabled parentage analysis and other population specific questions with
more than one thousand SNPs in any non-model species (Ekblom and Galindo 2011,
Peterson et al. 2012). Overall, SNPs have been shown to be an effective tool to study
bottlenecked species in which heterozygosity of other markers such as microsatellites

82
may be low (Tokarska et al. 2009) and for reconstructing groups of kin, or assigning
parentage (Hauser et al. 2011). It is also possible to use this information to assess
population structure and size, follow population reductions and expansions, and
evaluate effective population size (Morin et al. 2004).
In this study, using a dataset of SNPs and the known pedigree of the Guam
kingfisher, I first test the ability of SNPs to assign parentage. I predict that given
complete sampling of parents, the SNP dataset will have high confidence of parentage
assignment. I also examine the loss of gene diversity in the same population by
examining the loss of heterozygosity over time as calculated with pedigree analyses
verses with the molecular data. I predict that the SNP dataset will have lower gene
diversity than in the current evaluations of levels of gene diversity with the pedigree
results due to the assumptions that are present in the pedigree based analysis that are
not in calculations of gene diversity using molecular data. I also use a SNP dataset from
deep within the pedigree (generations one and two) to examine the assumptions of
unrelated founders by analyzing the family clustering of these. I predict that these
individuals deep within the pedigree will have cluster together due to closer
relationships between founders than is assumed in the pedigree dataset, as found in
Haig et al. (1995). Finally, I aimed to use museum specimens as a means to estimate
levels of gene diversity in the wild population of Guam kingfishers prior to the drastic
bottleneck event which impacted the taxon and the subsequent founding of the ex situ
assurance population. I discuss these results with how they may impact future
consequences of genetic management in this conservation breeding population and
other ex situ management programs.

83
Materials and Methods
Study Species
The Guam kingfisher (Todiramphus cinnamominus) is an ideal species for
examining genetic questions in an ex situ managed population because this species is
an island endemic that has experienced severe population decline, habitat loss, and
introduction of an invasive predator. Inadvertent introduction of the brown tree snake
(Boiga irregularis) to Guam caused a precipitous decline or extinction for all of Guam’s
forest bird species (Savidge 1987). This kingfisher now exists solely in a small zoo-
managed population as the last of the Guam kingfishers in the wild were observed in
1988. From 1984 through 1986, 29 birds were captured to found the zoo population
(Haig and Ballou 1995); however, only 16 founders contributed genetically to the current
population.
In 1995, Haig and Ballou found no genetic diversity in Guam kingfishers using
allozyme analyses (29 enzymes screened). However, DNA profile analyses of founders
suggested that six to seven founders were close relatives from one family group (some
founders were likely siblings while others were likely more distant relatives; Haig et al.
1995). This was important information incorporated into the early breeding plans, as
most ex situ populations are managed with the goal of reducing the loss of gene
diversity by equalizing the contribution of founders under the assumption of unrelated

84
founders. The DNA profile analysis allowed for designating two sets of founders as
siblings (Haig and Ballou 1995). Also, early pedigree analyses suggested that as much
as 6% heterozygosity was lost in the first 10 years of ex situ management (1984-1993;
Bahner 1993), indicating that the severity of the bottleneck had increased since Guam
kingfishers were brought into zoos (Haig and Ballou 1995). In 2015, following pedigree
analyses, gene diversity was reported as 87.69% of the founding population and
inbreeding (F) was 0.0727 (Bahner and Ray 2015). Genetic diversity measured in the
kingfishers may reflect both a founder effect and the subsequent bottleneck of captive
populations (Haig and Ballou 1995). Monitoring actual genetic loss using molecular data
is rarely carried out for ex situ populations, and the unique opportunity is available to
examine loss of genetic diversity in this long-term managed conservation breeding
population.
Researchers on Guam have developed, tested and implemented numerous
control tools to reduce or eliminate brown tree snakes from key areas of the island in
order to prepare habitat for the reintroduction of the Guam kingfisher (Engeman and
Vice 2001; Johnston et al. 2002). In addition to predator-controlled release areas on
Guam, islands outside the kingfishers’ natural home range are being considered for
reintroduction efforts using the birds from the ex situ population. Island selection models
have analyzed various attributes to find suitable additional introduction sites in the
Pacific (Laws and Kesler 2015). With a plan for reintroduction to the wild on the horizon,
there is the unique opportunity to assess genetic diversity in a population that has been
through an intense bottleneck and subsequent ex situ management. Population growth
was low from initial founding in 1984 until 2000, due to the typical lag phase common in

85
managing a new species in human care (Fig. 1). As pairing success and hand-rearing
methods improved, the population has experienced a steady increase in size since
2000 (Fig. 1). Holding space for more individuals is being sought as the population will
soon need to increase even more in order to meet the demands for the reintroduction.
By analyzing single nucleotide polymorphisms found throughout the genome of T.
cinnamominus, levels of genetic diversity in this population from founding to its current
state can be compared, the extent of the bottleneck can be determined, and the
influence of genetic drift and loss of diversity can be estimated. Also, the strategy of
genetic management using gene drop analysis (Haig et al. 1990) and mean kinship can
be evaluated to determine if it was successful at reducing the loss of genetic diversity by
directly comparing pedigree analyses to calculations based on molecular analyses.
Sample Collection and DNA Extraction
DNA samples were collected from 208 individual Guam kingfishers from birds
that were currently living at time of sample collection, as well as historical samples of
birds from throughout the history of the ex situ population and from museum samples of
birds that were living on Guam prior to the population decline (see Appendix C for
sample details). From 86 living birds, blood samples were taken and preserved by
placing three to four drops (approximately 0.25 mL) into 1.5 mL tubes containing 1.0 mL
of Longmire Buffer (100 mM Tris HCL pH 8.0, 100 mM EDTA, 10 mM NaCl, 0.5% SDS;
Longmire et al., 1988). Approximately 0.25g of tissue (liver, heart, muscle) was

86
collected and stored in 95% ETOH from 44 deceased birds. I also obtained samples
from 38 museum skins (28 toe pads and 10 samples cut from the apterium). I collected
approximately 6-8 contour feathers from 13 living birds, and drops of blood from toe
clips on filter paper (3mm FTA card) from seven living birds. Finally, twenty pre-
extracted samples were obtained from the San Diego Zoo Institute for Conservation
Research Genetics Department (San Diego, CA, USA). A total of 85 birds living in 2015
were included in the sampling, with the remaining 123 individuals sampled from earlier
generations and birds that had lived on Guam.
Genomic DNA was extracted using Qiagen DNeasy Blood & Tissue Kit (Qiagen,
Valencia, California, USA) for blood and tissues or QIAamp DNA Micro Kit (Qiagen,
Valencia, California, USA) without the carrier RNA for feathers, blood cards, toe clips
and skin. RNase A (4 µl, 100 mg/ml) was added to each sample according to kit
instructions. Extractions were done in a laboratory that had not ever had avian DNA
present. Following extraction, the DNA concentration was determined using a Qubit®
3.0 Fluorometer (Invitrogen, ThermoFisher Scientific Inc., Waltham, MA, USA). Samples
were then visualized on a 1% agarose gel to confirm that genomic DNA had not
fragmented during extraction. All samples that had a final concentration greater than 50
ng/μl were diluted with double-distilled water to a final concentration of 50 ng/µl.
SNP Genotyping and Analysis
Samples were genotyped for single nucleotide polymorphisms (SNPs) using the
nextRAD (Nextera – tagmented reductively amplified DNA) genotyping-by-sequencing

87
(GBS) approach as implemented by SNPsaurus (Institute of Molecular Biology, Eugene,
OR, USA). Briefly, nextRAD uses selective primers to amplify fragments across the
genome, as opposed to using restriction enzymes followed by size selection as in
similar RADseq approaches (Etter & Johnson, 2012). Genomic DNA was fragmented
using the Nextera reagent (Illumina, Inc.) which also ligates short adapter sequences to
the ends of each fragment. Fragmented DNA was then amplified, with one of the
primers matching the adapter and extending nine arbitrary nucleotides into the genomic
DNA with the selective sequence (Russello et al. 2015; Siliceo-Cantero et al. 2016).
Each reaction utilized 20 ng of genomic DNA and GBS was completed with a NextSeq
500 Desktop Sequencer (Illumina, Inc.) at the Institute of Molecular Biology, Eugene,
OR to generate sequencing reads 75 bp in length. The genotyping analysis used
customs scripts (SNPsaurus, LLC) that created a de novo reference from abundant
reads across the combined set of samples (Russello et al. 2015).
In order to examine which samples may have had bacterial contamination
prior to sequencing, two hundred sequences from each kingfisher sample were blasted
against sequences from 158 other species with data obtained from GenBank. This
information was also used to test how closely the Guam kingfisher sample sequences
aligned to other species. All samples that had greater than 10% matches to the blasted
sequences were examined closely at the genotype level to determine if data were low
quality or if they were missing a significant proportion of the genotypes and thus should
be removed from analyses.

88
Parentage Assignment
SNP genotypes were used to run simulations of paternity analysis using
CERVUS and COLONY to verify the genetic relationships obtained with SNPs with the
historic recorded pedigree. These programs differ in their approach to parentage
assignment. CERVUS uses simulated parents and offspring to determine a cut-off point
of log-likelihood (LOD) scores for true parents, which are then used to identify parent-
offspring pairs in empirical data (Kalinowski et al. 2007). Additionally, CERVUS only
considers parent-offspring relationships, therefore ignoring information intrinsic in larger
family groups (Hauser et al. 2011). COLONY uses a group-wise method to find the most
likely configuration of full-sib and half-sib families in the data, as well as provides
estimation of probabilities of parent-offspring assignments (Jones and Wang 2009,
Wang and Santure 2009). Because offspring sharing the same parents must
necessarily be full-sibs, COLONY uses more information in the data and is more
powerful under most circumstances (Walling et al. 2010).
Using CERVUS 3.0, which uses a pair-wise likelihood comparison based
approach to assign parentage, I first ran an allele frequency analysis on the 1361 SNPs,
which are used to calculate multilocus parental exclusion probabilities (Selvin 1980). I
then ran a parentage analysis simulation of the parent pair with known sexes. A total of
73 candidate dams and 90 candidate sires were sampled. These values were entered
under the “Simulated Genotypes”. There have been 98 total males in the population that
have reproduced, and of these, 45 were sampled. Thus, the probability that the sire was
sampled and included in the sampling was entered as 46%. There have been 104 total

89
females that produced chicks or fertile eggs, and of these, 42 were sampled. Thus, the
probability that the dam is included was 40%. Default values calculated by CERVUS
were used for proportion of loci typed and proportion of loci mistyped (0.01) as well as
minimum loci typed (680 loci). This parentage analysis simulation calculates the critical
delta of each assignment, which is a derivative of the likelihood score used in parentage
analysis and provides a threshold for assigning varying levels of confidence in the
parentage analysis (Kalinowski et al. 2007). Finally, I conducted a parentage analysis of
the parent pair with known sexes including all sampled individuals as candidate sires
and dams for each offspring. This analysis assigns the most likely candidate parent pair
using the likelihood score, and the predetermined confidence levels of 95% (strict
confidence) and 80% (relaxed confidence). Analyses returned the two most likely sires
and dams for each offspring.
I also used COLONY (v2.0; Jones and Wang 2009), which implements a full-
pedigree maximum likelihood method to assign parentage and sib-ship among
individuals with multi-locus genotypes, to run a parentage analysis and examine family
relationships. For the COLONY analysis, I chose a polygamous mating system for both
sexes due to the management history of the population in which both sexes of birds
may have multiple mates in their lifetime and based on the software constraints which
allows for maternal-only and paternal-only sib-ships (half-sibs). I also chose to include
inbreeding, with the a priori information that there is some level of inbreeding in the
pedigree, particularly in recent generations. I specified that the species is diploid, and
ran a full likelihood analysis with a long run length with medium likelihood precision,
which considers more configurations in the simulated annealing process (Jones and

90
Wang 2009). For the run specifications, I used program defaults (no updating of allele
frequencies, sibship scaling, a single run), and a weak sib-ship prior. I input the SNP
markers, and included an error rate of 0.01 (Anderson 2010). The genotypes of the 169
potential offspring, which is the complete dataset as all individuals included were zoo-
hatched, as well as the 90 candidate sires, and 73 candidate dams were input as
separate files, the same probabilities of sampling the candidate parents as above (46%
for sires and 40% for dams). All males and females were included in the lists of potential
parents in order to test the ability of the SNPs to determine parentage in a larger
sample. Known paternal/maternal sibships and excluded paternity/maternity were both
entered as “0” to again test the ability of the SNP data to determine true parentage out
of the entire sample of individuals.
Finally, parentage assignment results were compared against studbook data to
examine rates of assignment with SNP data that matched the recorded parents in the
studbook. In both programs CERVUS and COLONY, parentage is assigned with
confidence levels of 95% and 80%.
Family Cluster Analysis
I performed a second parentage analyses using the same input parameters as
described above for the COLONY analysis (Jones and Wang 2009), this time with the
20 individuals from my sample dataset that were in the first or second generation of the
managed breeding population. Generation was followed from the dam’s lineage, as
generations are not discrete in this population. When both males and females are

91
specified as polygamous, as in our analysis, some offspring who do not share parents
may still be linked in the pedigree (Wang 2016). This analysis can also be used to
examine those relationships of the first generation birds, whose founder parents are
assumed unrelated. If there is some relatedness present, these birds should cluster
together as a family. I also examined the pedigree to determine from which founders
each of these birds was descended.
Persistence of Gene Diversity
To examine loss of gene diversity, or rate of loss of heterozygosity in the ex situ
population, I first calculated the population’s gene diversity by year using the program
PMx 1.4 (Ballou et al. 2016). I exported the pedigree file from Poplink 2.4 (Faust et al.
2012) using a filter of 1980 – present (October 2016) and all animals living in North
America (which includes Guam) for the demographic filter, and for the genetics filter, all
animals living in North America (including Guam) from 1980 – present (October 2016).
In PMx, the project was created using the .ped file and the genetics and demographics
.csv moves files. PMx calculates gene diversity based on the kinship matrix (GD = 1 –
MK; Lacy 1995). For each year, this value was calculated for all birds living on 1
January. The pedigree of the current, managed population has two pairs of founder
birds that were identified as siblings by Haig et al. (1995). I compared the loss of gene
diversity from the pedigree with these relationships included verses the original
assumption such that all founder birds were unrelated.

92
Then, to examine loss of heterozygosity as measured in the genotyped portion of
the population, I grouped individuals living on 1 January for every five years from 1985-
2015, and calculated observed and unbiased expected heterozygosity for this subset of
birds using the program GenAlEx 6.503 (Peakall and Smouse 2006, 2012). I then
calculated the linear regression using JMP Pro 12 for each of these three measures of
gene diversity over from 1990 through 2015 to examine whether diversity is lost, gained,
or remains the same over this time period.
Results
A total of 1361 SNPs were generated through nextRAD GBS and a total of 180
samples were genotyped by sequencing. Of the original 208 samples collected, 28
samples were not genotyped due to the low quality of the DNA after extraction. This
included all museum skins of birds collected from the wild. Therefore, I was unable to
complete my aim to quantify genetic diversity of the wild Guam kingfisher population
prior to the bottleneck. After examining the genotyped individuals that had 10% or
greater of their sequences match to the blasted sequences of other species from
GenBank, as well as examining the genotypes of these individuals to determine what
percentage of the SNP genotyping data was missing, 11 additional individuals were
removed from further downstream analysis. These samples were missing most (greater
than 50%) or all of their genotypes. Nine of these samples came from museum skins,
and thus had degraded DNA after extraction, although not all museum samples were

93
excluded. An additional two samples were from very low concentration DNA from the
samples sent by San Diego Zoo. After removing the 39 individuals listed above, the 169
remaining individuals were used for population wide descriptive analyses as described
below.
According to CERVUS, 182 of the 1361 loci (13.4%) showed evidence of null
alleles or F(null) value greater than 0.05. A locus with a large positive estimate of null
allele frequency indicates an excess of homozygotes but does not necessarily imply that
a null allele is present and in the absence of known parent-offspring relationships it is
difficult to identify a null allele with certainty and thus parentage results from CERVUS
should consider this in the results (Pemberton et al. 1995). Because the population is
known to have inbreeding present, non-random mating (Bahner and Ray 2015), and an
excess of homozygotes at many loci (average expected heterozygosity across all
individuals at all loci = 0.35 from CERVUS and GenALEx analyses), all SNPs were used
for further downstream parentage analysis.
Parentage Assignment
A total of 168 birds were assigned sires and dams with CERVUS providing the
two most likely parents for both sire and dam (see Table 4 for overall parentage results).

94
Table 4. Summary of parentage assignments from CERVUS 3.0 (Kalinowski et al. 2007).
Confidence (%) Critical Delta Assignments Assignment Rate
Observed Expected Observed Expected Dam alone Strict 95.0 0.00 120 19 71% 11% Relaxed 80.0 0.00 120 19 71% 11% Unassigned 48 149 29% 89% Sire alone Strict 95.0 0.00 126 22 75% 13% Relaxed 80.0 0.00 126 22 75% 13% Unassigned 42 146 25% 87% Parent pair Strict 95.0 0.00 42 5 25% 3% (sexes known) Relaxed 80.0 0.00 42 5 25% 3% Unassigned 126 163 75% 97%
A total of 41 individuals had their sire assigned the same as the studbook at the strict
confidence level and a total of 45 individuals had their dam assigned the same as the
studbook with strict confidence. An additional 29 males and 29 females had parentage
which matched the studbook assigned at a lower confidence level with a different
individual assigned either at the strict or same lower confidence level. In cases where
the matching studbook parent was not assigned with strict confidence but another
individual was assigned with strict confidence most of these assignments (106 of 109
for sires and 100 of 101 for dams) were of other high order relationships such as parent,
full sibling, or offspring (as recorded in the studbook).
From the COLONY parentage results, a total of 23 sires were assigned, 21 at
100% probability and two at 73% probability. When comparing the recorded sires from
the studbook, the 21 individuals that were returned as a sire with 100% probability
matched in both the recorded sire and the sire determined by SNPs. For the two
individuals that were assigned sires with 73%, one of the assigned sires was a full
sibling of that individual from the same clutch, and the other assigned the offspring as
sire rather than the sire itself (which was not included in the genetic sampling). For the
maternity assignments, a total of 27 dams were assigned with 100% probability. When

95
comparing the recorded dams from the studbook 26 of 27 assigned dams matched the
dam from the studbook. For the one individual that did not match, the assigned dam
was an offspring of this individual.
Family Cluster Analysis
Using the birds from the first and second generation, I examined the best family
cluster for these birds to estimate relationships of founders. Ten clusters were
differentiated by COLONY. Table 5 shows these clusters, the probability of the cluster,
the inferred father and mother identified from the software, as well as the sire and dam
recorded in the studbook and the list of founders from which they descended.
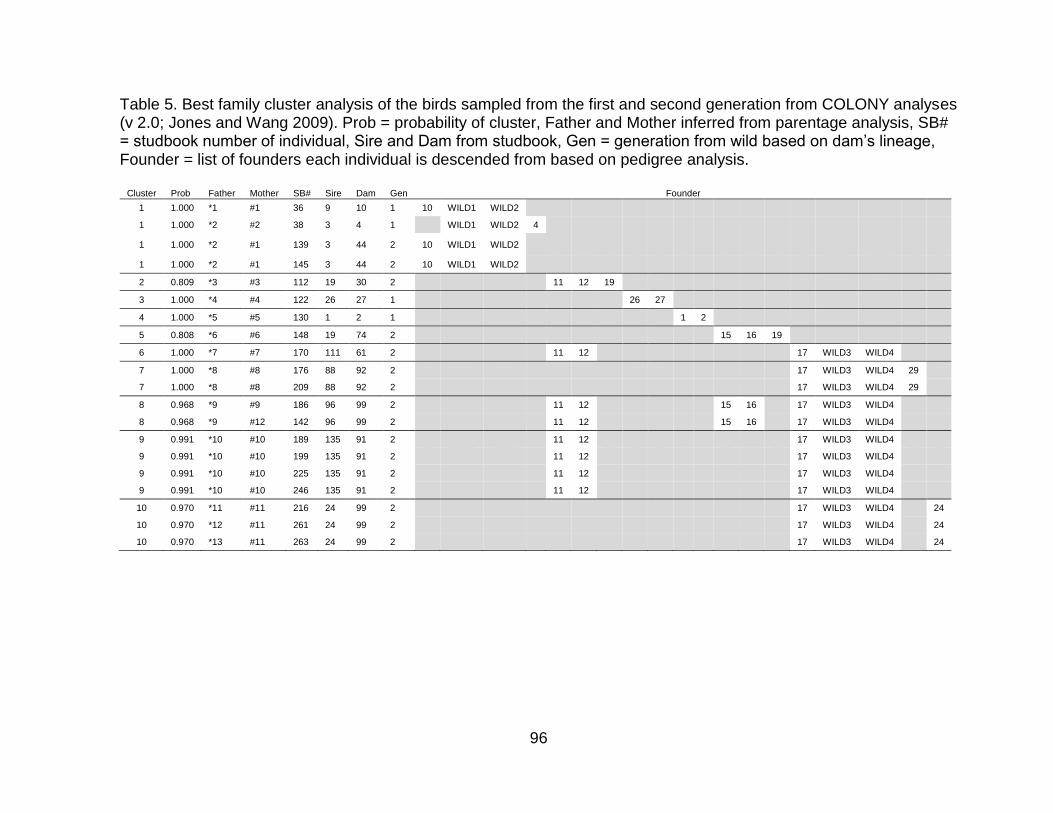
96
Table 5. Best family cluster analysis of the birds sampled from the first and second generation from COLONY analyses (v 2.0; Jones and Wang 2009). Prob = probability of cluster, Father and Mother inferred from parentage analysis, SB# = studbook number of individual, Sire and Dam from studbook, Gen = generation from wild based on dam’s lineage, Founder = list of founders each individual is descended from based on pedigree analysis.
Cluster Prob Father Mother SB# Sire Dam Gen Founder
1 1.000 *1 #1 36 9 10 1 10 WILD1 WILD2
1 1.000 *2 #2 38 3 4 1
WILD1 WILD2 4
1 1.000 *2 #1 139 3 44 2 10 WILD1 WILD2
1 1.000 *2 #1 145 3 44 2 10 WILD1 WILD2
2 0.809 *3 #3 112 19 30 2
11 12 19
3 1.000 *4 #4 122 26 27 1
26 27
4 1.000 *5 #5 130 1 2 1
1 2
5 0.808 *6 #6 148 19 74 2
15 16 19
6 1.000 *7 #7 170 111 61 2
11 12
17 WILD3 WILD4
7 1.000 *8 #8 176 88 92 2
17 WILD3 WILD4 29
7 1.000 *8 #8 209 88 92 2
17 WILD3 WILD4 29
8 0.968 *9 #9 186 96 99 2
11 12
15 16
17 WILD3 WILD4
8 0.968 *9 #12 142 96 99 2
11 12
15 16
17 WILD3 WILD4
9 0.991 *10 #10 189 135 91 2
11 12
17 WILD3 WILD4
9 0.991 *10 #10 199 135 91 2
11 12
17 WILD3 WILD4
9 0.991 *10 #10 225 135 91 2
11 12
17 WILD3 WILD4
9 0.991 *10 #10 246 135 91 2
11 12
17 WILD3 WILD4
10 0.970 *11 #11 216 24 99 2
17 WILD3 WILD4
24
10 0.970 *12 #11 261 24 99 2
17 WILD3 WILD4
24
10 0.970 *13 #11 263 24 99 2
17 WILD3 WILD4
24

97
Most birds clustered based on first order families, with those with the same parents and
same founders clustering together. One bird, SB#170 clustered separately from the
birds that had the same founder lineages, but this bird also had different parents
(clusters 6 and 9; Table 11). Another bird, SB# 38 is the only descendant of Founder
SB#4. This bird clustered with three other birds that shared two of the same founders
(WILD1/WILD2), although it was half siblings with two other birds in its cluster and a first
cousin to the third bird according to the pedigree relationships.
Persistence of Gene Diversity
Loss of gene diversity in the Guam kingfisher population from founding in 1985 to
present (i.e. 2016) as determined by pedigree analysis and mean kinship of the
population, as well as the observed and unbiased expected heterozygosity is shown in
Figure 5.

98
A)
B)
Figure 5. A) Change in heterozygosity over time in the Guam kingfisher SSP from founding (1985) to current (2016) as determined by pedigree analysis from the studbook (left y-axis) and molecular analysis using SNPs (right y-axis). GD = gene diversity calculated as GD = 1 – MK where MK is the mean kinship of the population (Lacy 1995) calculated from the studbook of the birds living on 1 January of each year. HO = observed heterozygosity. uHE = unbiased expected heterozygosity. HO and uHE calculated from birds in the SNP dataset living on 1 January of each year. SNPs have a maximum of 0.5 as a biallelic marker. B) Change in heterozygosity over time as measures as a difference from the maximum value.

99
Each of the six time segments used to calculate these population statistics with the
molecular dataset included a varying number of individuals, which was based on the
individuals living on 1 January of the specified year (Table 6).
Table 6. Sampling numbers and percentage of population sampled from the Guam kingfisher SSP from birds living on 1 January of six different time periods. Overall summary statistics from population genetic analyses of the molecular dataset are also presented.
Year Number of Individual Sample
Total Number of Birds Living
Percentage of Population
Sampled
Ho uHe F Ne
1990 5 59 8.47% 0.43 0.32 -0.31 1.56
1995 13 51 25.49% 0.45 0.35 -0.24 1.58
2000 19 59 32.20% 0.44 0.35 -0.23 1.58
2005 34 72 47.22% 0.44 0.35 -0.21 1.59
2010 65 117 55.56% 0.44 0.35 -0.20 1.59
2015 85 157 54.14% 0.44 0.35 -0.20 1.59
Ho = observed heterozygosity = number of heterozygotes / N uHe = unbiased heterozygosity = (2N/(2N-1))*He F = fixation index = (He – Ho)/He = 1 – (Ho/He) Ne = number of effective alleles = 1/(sum pi^2) Where pi is the frequency of the ith allele for the population and the sum pi^2 is the sum of the squared population allele frequencies.
Using pedigree analysis from the studbook, the maximum population gene diversity was
reached in 1990 (92.42%), and declined to 87.80% in 2016 (y = 6.11 - 0.0026x, R2 =
0.95, p < 0.0001; Figure 6, Table 5). For heterozygosity calculated from the molecular
data, observed heterozygosity has remained consistent (43.30% in 1990 and 43.90% in
2015; y = 0.26 + 0.00009x, R2 = 0.04, p = 0.69; Figure 5) and unbiased expected
heterozygosity has declined slightly although not significantly (35.60% in 1990 to
34.90% in 2015; y = 0.82 - 0.0002x, R2 = 0.62, p = 0.06; Figure 5). Additionally,
comparing the current pedigree analyses which includes the relationship between two
sets of founders as full siblings to a pedigree where all founders are assumed unrelated

100
demonstrates that less gene diversity is lost in the pedigree with unrelated founders
(Figure 6).
Figure 6. Change in heterozygosity over time in the Guam kingfisher SSP from founding to current (2016) as determined by pedigree analysis from the studbook. The bottom line represents the pedigree as it is used in current analyses and projections, which considers two sets of founders related as determined by Haig et al. (2015). The bottom line represents the loss of gene diversity if all founders were considered unrelated.
Discussion
In this study, I used a dataset of SNPs to test the ability of these genetic markers
to assign parentage in the Guam kingfisher SSP® and to compare loss of genetic
diversity as predicted from a pedigree versus estimated from molecular markers. I found
that the molecular dataset had high confidence in parentage assignment, although

101
sometimes these assignments were mis-identified for other first-order relatives. I also
found that the SNP dataset had lower level of gene diversity than what is calculated with
the pedigree methods, however more gene diversity has been maintained over time
than assumed. These differences are likely due to the assumptions that are present in
the pedigree based analysis that are not in calculations of gene diversity using
molecular data. I also examined the relationships of birds from the first and second
generation, early in the populations’ history, to examine the assumptions of unrelated
founders by analyzing the family clustering of these individual. My results support the
original results of Haig et al. (1995) for the relatedness of early founders. I discuss the
implications for future use of these methods in understanding genetic structure and loss
of diversity and how they may impact future consequences of genetic management in a
conservation breeding population and other ex situ managed programs.
Parentage results from both CERVUS and COLONY provided high confidence
assignments for many individuals. While the CERVUS results provided more parentage
assignments, the number of assignments that did not match the assigned parentage in
the studbook yet returned a first order relative was high (63% of total sire assignments
and 60% of dam assignments). Labuschagne et al. (2015) used a set of N = 15 SNPs to
complete parentage assignment to compare to studbook records in the ex situ African
penguin (Spheniscus demersus) population in South Africa and also found high success
rate in assignment in CERVUS. They did however, also encounter incorrect
assignments made with high confidence, although they do not discuss which birds were
assigned in lieu of the parent recorded in the studbook (Labuschagne et al. 2015). A
similar analysis was undertaken within the Tasmanian devil ex situ population

102
(Sarcophilus harrisii) in which 267 SNPs were used to conduct parentage assignment
and 68% of individuals without pedigree information failed to have parents assigned
(Wright et al. 2015). Results from both studies, as well as this current analysis on the
Guam kingfisher, suggest that when the “true” parent is not included in the candidate
parent list, there is a higher likelihood of incorrect assignment. Ultimately, this is a
consequence of incomplete sampling that must be considered when attempting to
reconstruct a pedigree, or could be uncovered in cases where studbook data is wrong,
either through the recording of incorrect parents in animal records, or if biology of the
species is not considered (e.g. presence of extra-pair copulations, Ferrie et al. 2013). In
the Guam kingfisher population, the birds are maintained as monogamous pairs. While
it is possible there are errors in the studbook, they would be as a result of human error
in data entry, and likely found during studbook data validation since both parents would
need to be at the same location at the time a chick was hatched. Therefore, in our
parentage assignments in this study, it is more likely that incorrect assignments were
due to incomplete sampling.
Based on the parentage results described above, it appears that if a goal of
applying a SNP dataset to population genetic analyses is to reconstruct a pedigree that
has missing parentage information, it is likely that first-order relationships may be
confused, assigning offspring or siblings as parents and vice versa, and incorrect
assignments are likely to occur even at high likelihood when there are gaps in the
sampling effort through the depth of the pedigree. However, if the goal of doing
parentage assignments using a SNP dataset is to evaluate kinship or relatedness for
population level analyses, these incorrect parentage assignments can still be useful in

103
evaluating and defining a kinship value between individuals, particularly in that full
siblings and parent-offspring relationships are the same first-order kinship relationships
(Hauser et al. 2011; Ivy et al. 2016).
With the major assumption in pedigree management of unrelated founders, there
is always a concern that ex situ populations may have higher inbreeding than assumed,
and may have lower gene diversity than projected. Numerous studies have therefore
utilized molecular genetic data to uncover these founder relationships, clarify studbook
records and improve genetic management, such as in the whooping crane (Grus
americana, Jones et al. 2002), St. Vincent parrot (Amazona guildingii, Russello and
Amato 2004) and Guam rail (Rallus owstoni, Haig et al. 1994). In an attempt to
determine if the founders were related in order to provide more information to the
baseline of the pedigree analysis, I performed a family cluster parentage analysis with
the first and second generation birds. The cluster analysis separated all birds into
clusters based on their founder lineages, and did not provide any additional information
into founder relationships. One founder, SB# 4 did cluster with three other founders, but
that cluster likely occurred more based on the relationship of the individuals descended
from founders WILD1/WILD2 rather than SB# 4 being related to those founders (Table
5). Because this founder line died out after the second generation, and only produced
three descendants, we cannot look at this founder line in more detail, nor does it impact
the current pedigree analysis. The traditional methods of assuming unrelated founders
in ex situ populations will lead to inaccurate evaluations of mean kinship, inbreeding,
and levels of gene diversity (da Silva et al. 2010).

104
The loss of gene diversity in a closed population is inevitable. Furthermore,
calculations of loss of gene diversity done with a pedigree include assumptions that
assume there are no prior relationships between the founders. The goal of maintaining
gene diversity through management focuses on a strategy that leads to retention of
founders’ gene diversity (Lacy et al. 1995). The loss of gene diversity in the Guam
kingfisher SSP as measured by the pedigree is shown in Figures 5 and 5. The rate of
loss shown here is susceptible to those assumed parameters discussed above, namely
that founders are completely unrelated. More likely, and as discovered by Haig et al.
(1995), the founders in this population had some prior level of relationships. Haig et al.
(1995) used allozymes to examine parentage in the Guam kingfishers by visually
comparing bands on a gel of putative parents and offspring. Putative parents were
assumed to be true genetic parents when offspring DNA profiles contained fewer
mismatched bands than could be attributed to mutation (Haig et al. 1995). All parents
were identified correctly using this method, which is expected, given that pairs are
housed in monogamous pairs (Haig et al. 1995). The authors used UPGMA clustering
of genetic distances and found that three clusters of founders had higher similarity than
expected for unrelated birds. Their results suggested linking two sets of founders as
siblings (Haig et al. 1995). In calculating the loss of gene diversity with all founders
assumed to be unrelated as well as with the relationships determined by Haig et al.
(1995) which are the founder relationships used in management today (since these
results became available), the loss of gene diversity occurs at different levels (Figure 6).
As expected, the pedigree which assumes all founders are unrelated demonstrates
improved levels of gene diversity (Figure 6), and when founder relationships are

105
incorporated, gene diversity measures are lower. These results reinforce the importance
of uncovering founder relationships to best model loss of gene diversity, and for future
planning of conversation breeding programs, to aim to sample unrelated founders from
multiple populations or sites and to uncover any relationships in these founders prior to
intensive breeding management (Witzenberger and Hochkirch 2011).
When examining the comparisons in loss of gene diversity between the
theoretical calculation (i.e. pedigree) verses actual loss, the molecular data, both in
observed and expected heterozygosity, shows little to no decline (Fig. 5). The absolute
difference from the maximum (Fig. 5B) shows that unbiased expected heterozygosity
(uHe) is lower than both observed heterozygosity and pedigree calculations. This value
may be the more appropriate representation of the gene diversity as measured from the
SNP dataset as uHe accounts for the related individuals and presence of inbreeding in
the sampled population. There may be little to no decline at the molecular level due to
the success of the management strategy which aims to minimize mean kinship applied
by this program (Montgomery et al. 1997). Ito et al. (2016) recently compared actual
genetic diversity as calculated by two mitochondrial genes to pedigree analyses in two
species of zebra and found similar results with little correlation in diversity measures.
They suggest that this pattern is being driving by the assumptions related to founder
relationships (Ito et al. 2016).
For the broader perspective of conservation breeding programs and ex situ
populations and their relationships to conserving species, the results from this paper
suggest that for most breeding programs up until this point in time, managers have
relied exclusively on theoretical analyses as derived from a pedigree to understand the

106
loss of genetic diversity (Ito et al. 2016). I have also demonstrated that even in a
species with a known pedigree, there are limitations to the theoretical methods that
should caution managers in making decisions and interpreting the genetic analyses,
and comparisons between managed programs, even closely related species, should not
be made (Ballou et al. 2010, Ito et al. 2016). With the molecular methods demonstrated
in this paper becoming more widely available and economical, greater efforts should be
made to understand the actual genetic diversity in managed populations and in
comparing them to their wild counterparts (Forstmeier et al. 2007, Ito et al. 2016,
Witzenberger and Hochkirch 2011). Beyond understanding loss of diversity, these
markers are also useful in undertaking analyses on inbreeding levels, non-neutral
markers such as MHC or other genes that may demonstrate adaptations to having lived
in an ex situ environment (Pelletier et al. 2009, Witzenberger and Hochkirch 2011).
Having a better comprehension of genetic diversity and composition of all populations,
whether under human care, or in the wild, will provide quantitative points of reference
for which conservation goals can be measured and achieved.
Acknowledgments
Thank you to all of the AZA Guam kingfisher SSP participating institutions,
particularly those that provided genetic samples used in this study.

107
References
Attard CRM, Brauer CJ, Van Zoelen JD, Sasaki M, Hammer MP, Morrison L, Harris JO,
Möller LM, Beheregaray LB. 2016. Multi-generational evaluation of genetic
diversity and parentage in captive southern pygmy perch (Nannoperca australis).
Conserv Genet. doi: 10.1007/s10592-016-0873-y.
Bahner B. 1993. Micronesian Kingfisher (Halcyon cinnamomina cinnamomina). Pp 218-
220 in R.J. Wiese, K. Willis, J. Bowdoin, and M. Hutchins (Eds.). American
Association of Zoological Parks and Aquaria Annual Report on Conservation and
Science 1992-1993. American Association of Zoological Parks and Aquaria:
Bethesda, Maryland.
Bahner B, Ray J. 2015. Guam Kingfisher (Todiramphus cinnamominus) AZA Species
Survival Plan Yellow Program. Population Management Center, Lincoln Park
Zoo: Chicago, IL.
Ballou JD, Lacy RC. 1995. Identifying genetically important individuals for management
of genetic diversity in pedigreed populations. In: Ballou JD, Gilpin M, Foose TJ
(Eds.). Population Management for Survival & Recovery: Analytical Methods and
Strategies in Small Population Conservation. New York: Columbia University
Press. pp 76-111.
Ballou JD, Lacy RC, Pollak JP. 2016. PMx: Software for demographic and genetic
analysis and management of pedigreed populations (Version 1.4.20161017).
Chicago Zoological Society, Brookfield, Illinois, USA. Available from
http://www.vortex10.org/PMx.aspx

108
Ballou JD, Lees C, Faust LJ, Long S, Lynch C, Bingaman Lackey L, Foose TJ. 2010.
Demographic and genetic management of captive populations. In: Wild mammals
in captivity: principles and techniques for zoo management. Pp. 219.
Blouin MS. 2003. DNA-based methods for pedigree reconstruction and kinship analysis
in natural populations. TRENDS in Ecology and Evolution 18(10): 503-511.
Bulmer MG. 1973. Inbreeding in great-tit. Heredity 30: 313-325.
Brumfield RT, Beerli P, Nickerson DA, Edwards SV. 2003. The utility of single
nucleotide polymorphisms in inferences of population history. TRENDS in
Ecology and Evolution 18: 249-256.
Bylemans J, Maes GE, Diopere E, Cariani A, Senn H, Taylor MI, Helyar S, Bargelloni L,
Bonaldo A, Carvalho G, Guarniero I, Komen H, Martinsohn JT, Nielsen EE, Tinti
F, Vockaert FAM, Ogden R. 2016. Evaluating genetic traceability methods for
captive-bred marine fish and their applications in fisheries management and
wildlife forensics. Aquaculture Environment Interactions 8: 131-145.
Caballero A, Toro MA. 2000. Interrelations between effective population size and other
pedigree tools for the management of conserved populations. Genet. Res.,
Camb. 75: 331-343.
Chavanne H, Janssen K, Hofherr J, Contini F, Haffray P, Consortium A, Komen H,
Nielsen EE, Bargelloni L. 2016. A comprehensive survey on selective breeding
programs and see market in the European aquaculture fish industry. Aquaculture
International 24: 1287-1307.

109
da Silva AG, Lalonde DR, Quse V, Shoemaker A, Russello MA. 2010. Genetic
approaches refine ex situ lowland tapir (Tapirus terrestris) conservation. J Hered
101: 581-590.
Engeman RM, Vice DS. 2001. Objectives and integrated approaches for the control of
brown tree snakes. Integrated Pest Management Reviews 6(1): 59-76.
Ekblom R, Galindo J. 2011. Applications of next generation sequencing in molecular
ecology of non-model organisms. Heredity 107: 1-15.
Etter PD, Johnson A. 2012. RAD paired-end sequencing for local de novo assembly
and SNP discovery in non-model organisms. In: Pompanon F, Bonin A, eds.
Data production and analysis in population genomics: methods and protocols.
New York: Human Press, 135-151.
Faust LJ, Bergstrom YM, Thompson SD, Bier, L. 2012. PopLink Version 2.4. Lincoln
Park Zoo. Chicago, IL.
Forstmeier W, Segelbacher G, Mueller JC, Kempenaers B. 2007. Genetic variation and
differentiation in captive and wild zebra finches (Taeniopygia guttata). Molecular
Ecology 16: 4039-4050.
Frankham R. 2008. Genetic adaptation to captivity in species conservation programs.
Molecular Ecology 17: 325-333.
Groombridge JJ, Jones CG, Bruford MW, Nichols RA. 2000. ‘Ghost’ alleles of the
Mauritius kestrel. Nature 403:616.
Haig SM, Ballou JD. 1995. Genetic diversity in two avian species formerly endemic to
Guam. The Auk 112(2): 445-455.

110
Haig SM, Ballou JD, Casna NJ. 1994. Identification of kin structure among Guam rail
founders: a comparison of pedigrees and DNA profiles. Molecular Ecology 3:
109-119.
Haig SM, Ballou JD, Casna NJ. 1995. Genetic identification of kin in Micronesian
kingfishers. Journal of Heredity 86: 423-431.
Haig SM, Ballou JD, Derrickson SR. 1990. Management options for preserving genetic
diversity: reintroduction of Guam rails to the wild. Conservation Biology 4(3): 290-
300.
Hauser L, Baird M, Hilborn R, Seeb LW, Seeb JE. 2011. An empirical comparison of
SNPs and microsatellites for parentage and kinship assignment in a wild sockeye
salmon (Oncorhynchus nerka) population. Molecular Ecology Resources 11
(Suppl 1): 150-161.
Hawley DM, Hanley D, Dhondt AA, Lovette IJ. 2006. Molecular evidence for a founder
effect in invasive house finch (Carpodacus mexicanus) populations experiencing
an emergent disease epidemic. Molecular Ecology 15(1): 263-275.
Henkel JR, Jones KL, Hereford SG, Savoie ML, Leibo SP, Howard JJ. 2011. Integrating
microsatellite and pedigree analyses to facilitate the captive management of the
endangered Mississippi sandhill crane (Grus Canadensis pulla). Zoo Biology 30:
1-14.
Ito H, Ogden R, Langenhorst T, Inoue-Murayama M. 2016. Contrasting results from
molecular and pedigree-based population diversity measures in captive zebra
highlight challenges facing genetic management of zoo populations. Zoo Biology
10.1002/zoo21342.

111
Ivy JA, Putnam AS, Navarro AY, Gurr J, Ryder OA. 2016. Applying SNP-derived
molecular coancestry estimates to captive breeding programs. Journal of
Heredity 107: 403-412.
Johnson JA, Bellinger MR, Toepfer JE, Dunn P. 2004. Temporal changes in allele
frequencies and low effective population size in greater prairie-chickens.
Molecular Ecology 13(9): 2617-2630.
Johnston JJ, Savarie PJ, Primus TM, Eisemann JD, Hurley JC, Kohler DJ. Risk
assessment of acetaminophen baiting program for chemical control of brown tree
snakes on Guam: Evaluation of baits, snake residues, and potential primary and
secondary hazards. Environ. Sci. Technol. 36: 3827-3833.
Jones KL, Glenn TC, Lacy RC, Pierce JR, Unruh N, Mirande CM, Chavez-Ramirez F.
2002. Refining the whooping crane studbook by incorporating microsatellite DNA
and leg-banding analyses. Conservation Biology 16: 789-799.
Jones O., Wang J. (2009) COLONY: a program for parentage and sibship inference
from multilocus genotype data. Mol Ecol Resour 10: 551-555.
Kaiser SA, Taylor SA, Chen N, Sillett TS, Bondra ER, Webster MS. 2016. A
comparative assessment of SNP and microsatellite markers for assigning
parentage in a socially monogamous bird. Molecular Ecology Resources. doi:
10.1111/1755-0998.12589.
Kalinowski ST, Taper ML, Marshall TC. 2007. Revising how computer program
CERVUS accommodates genotyping error increases success in paternity
assignment. Molecular Ecology 16: 1099-1106.

112
Labuschagne C, Nupen L, Kotzé A, Grobler PJ, Dalton DL. 2015. Assessment of
microsatellite and SNP markers for parentage assignment in ex situ African
Penguin (Spheniscus demersus) populations. Ecology and Evolution 15: 4389-
4399.
Lacy RC. 2009. Stopping evolution: genetic management of captive populations. In:
Amato G. (Ed.). Conservation genetics in the age of genomics. New York:
Columbia University Press.
Lacy RC. 1995. Clarification of genetic terms and their use in management of captive
populations. Zoo Biology 14: 565-578.
Lacy RC. 1994. Managing genetic diversity in captive populations of animals. In: Bowles
ML, Whelan CJ (Eds.). Restoration and recovery of endangered plants and
animals. Cambridge, UK: Cambridge University Press.
Lacy RC, Ballou JD, Princeé F, Starfield A, Thompson EA. 1995. Pedigree Analysis for
Population Management. In: Population Management for Survival and Recovery.
New York: Columbia University Press. Pp 57-75.
Lande R. 1988. Genetics and demography in biological conservation. Science 241:
1455-60.
Launhardt K, Borries C, Hardt C, Epplen JT, Winkler P. 2001. Paternity analysis of
alternative male reproductive routes among the langurs (Semnopithecus
entellus) of Ramnagar. Animal Behaviour 61(1):53-64.
Laws RJ, Kesler DC. 2012. A Bayesian network approach for selecting translocation
sites for endangered island birds. Biological Conservation 155: 178-185.

113
Ledoux J, Antunes A, Haguenauer A, Pratong M, Costantini F, Abbiati M, Aurelle D.
2016. Molecular forensics into the sea: How molecular markers can help to
struggle against poaching and illegal trade in precious corals? In: Goffredo S,
Dubinsky Z (Eds). The Cnidaria, Past, Present and Future. Springer International
Publishing: Switzerland. Pp 729-745.
Liu S, Palti Y, Martin KE, Parsons JE, Rexroad III CE. 2017. Assessment of genetic
differentiation and genetic assignment of commercial rainbow trout strains using
a SNP panel. Aquaculture 468: 120-125.
Longmire JL, Lewis AK, Brown NC, Buckingham JM, Clark LM, Jones MD, Meincke LJ,
Meyne J, Ratliff RL, Ray FA, Wagner RP, Moyzis RK. 1988. Isolation and
molecular characterization of a highly polymorphic centromeric tandem repeat in
the family Falconidae. Genomics 2: 14-24.
MacCluer JW, VandeBerg JL, Read B, Ryder OA. 1986. Pedigree analysis by computer
simulation. Zoo Biology 5:147-160.
Manel S, Gaggiotti OE, Waples RS. 2005. Assignment methods: matching biological
questions with appropriate techniques.TRENDS in Ecology and Evolution 20:
136-142.
Mitani JC, Watts DP, Pepper JW, Merriwether DA. 2002. Demographic and social
constraints on male chimpanzee behaviour. Animal Behaviour 64(5): 727-737.
Montgomery ME, Ballou JD, Nurthen RK, England PR, Briscoe DA, Frankham R. 1997.
Minimizing kinship in captive breeding programs. Zoo Biology 16: 377-389.
Morin PA, Luikart G, Wayne RK, the SNPwg. 2004. SNPs in ecology, evolution and
conservation. Trends in Ecology & Evolution 19(4): 208-216.

114
Morin PA, Martien KK, Taylor BL. 2009. Assessing statistical power of SNPs for
population structure and conservation studies. Molecular Ecology Resources
9:66-73.
Morton NE, Crow JF, Muller HJ. 1956. An estimate of the mutational damage in man
from data on consanguineous marriages. Proc Nat Acad Sci 42: 855-863.
Nei M. 1973. Analysis of gene diversity in subdivided populations. Proc Nat Acad Sci
70: 3321-3323.
O'Grady JJ, Brook BW, Reed DH, Ballou JD, Tonkyn DW, Frankham R. 2006. Realistic
levels of inbreeding depression strongly affect extinction risk in wild populations.
Biological Conservation 133: 42-51.
Ostermann SD, Deforge JR, Edge D. 2001. Captive breeding and reintroduction
evaluation criteria: a case study of peninsular bighorn sheep. Conservation
Biology 15: 749-760.
Peakall R, Smouse PE. 2012. GenAlE 6.5: genetic analysis in Excel. Population genetic
software for teachign and research - an update. Bioinformatics 28: 2537-2539.
Peakall R, Smouse PE. 2006. GENALEX 6: genetic analysis in Excel. Population
genetic software for teaching and research. Molecular Ecology Notes 6: 288-295.
Pelletier F, Réale D, Watters J, Boakes EH, Garant D. 2009. Value of captive
populations for quantitative genetics research. Trends in Ecology & Evolution 24:
263-270.
Pemberton JM, Slate J, Bancroft DR, Barrett JA. 1995. Non-amplifying alleles at
microsatellite loci: a caution for parentage and population studies. Molecular
Ecology 4: 249-252.

115
Peterson BK, Weber JN, Kay EH, Fisher HS, Hoekstra HE. 2012. Double digest
RADseq: An inexpensive method for de novo SNP discovery and genotyping in
model and non-model species. PLOS ONE 7: e37135. doi:
10.1371/journal.pone.0037135.
Penn AM, Sherwin WB, Gordon G, Lunney D, Melzer A, Lacy RC. 2000. Demographic
forecasting in koala conservation. Conservation Biology 14: 629-638.
Ralls K, Ballou JD, Templeton A. 1988. Estimates of lethal equivalents and the cost of
inbreeding in mammals. Conservation Biology 2, 185-193.
Raoul J, Palhière I, Astruc JM, Elsen JM. 2016. Genetic and economic effects of the
increase in female paternal filiations by parentage assignment in sheep and goat
breeding programs. Journal of Animal Science. doi: 10.2527/jas.2015-0165.
Rodriguez-Clark KM, Sanchez-Mercado A. 2006. Population management of threatened
taxa in captivity within their natural ranges: Lessons from Andean bears
(Tremarctos ornatus) in Venezuela. Biological Conservation 129: 134-148.
Russello MA, Amato G. 2004. Ex situ population management in the absence of
pedigree information. Molecular Ecology 13: 2829-2840.
Russello MA, Waterhouse MD, Etter PD, Johnson EA. 2015. From promise to practice:
pairing non-invasive sampling with genomics in conservation. PeerJ 3: e1106.
Savidge JA. 1987. Extinction of an island forest avifauna by an introduced snake.
Ecology 68(3): 660-668.
Selvin S. (1980) Probability of nonpaternity determined by multiple allele codominant
systems. Am J Hum Genet 32: 276-278.

116
Siliceo-Cantero HH, Garcia A, Reynolds RG, Pacheco G, Lister BC. 2016. Dimorphism
and divergence in island and mainland anoles. Biological Journal of the Linnean
Society 0:00-00.
Taylor SS, Jamieson IG, Wallis GP. 2007. Historic and contemporary levels of genetic
variation in two New Zealand passerines with different histories of decline.
Journal of Evolutionary Biology 20(5): 2035-2047.
Thomas L, Booth CG, Rosel PE, Hohn A, Litz J, Schwacke LH. 2017. Where were they
from? Modelling the source stock of dolphins stranded after the Deepwater
Horizon oil spill using genetic and stable isotope data. Endang Species Res 33:
253-264.
Tokarska M, Marshall T, Kowalczyk R, Wojcik JM, Pertoldi C, Kristensen TN,
Loeschcke V, Gregersen VR, Bendixen C. 2009. Effectiveness of microsatellite
and SNP markers for parentage and identity analysis in species with low genetic
diversity: the case of the European bison. Heredity 103: 326-332.
Tzika AC, Remy C, Gibson R, Milinkovitch MC. 2009. Molecular genetic analysis of a
captive-breeding program: the vulnerable endemic Jamaican yellow boa.
Conservation Genetics 10: 69-77.
Vignal A, Milan D, SanCristobal M, Eggen A. 2002. A review on SNP and other types of
molecular markers and their use in animal genetics. Genet. Sel. Evol. 34: 275-
305.
Walling CA, Pemberton JM, Hadfield JD, Kruuk LEB. 2010. Comparing parentage
inference software: reanalysis of a red deer pedigree. Molecular Ecology 19:
1914-1928.
117
Wang J. 2011. Coancestry: a program for simulating, estimating and analyzing
relatedness and inbreeding coefficients. Mol Ecol Resour 11: 141-145.
Wang J. 2016. User’s guide for software: COLONY Version 2.0.6.2. Zoological Society
of London.
Wang J, Santure AW. 2009. Parentage and sibship inference from multilocus genotype
data under polygamy. Genetics 181: 1579-1594.
Williams S, Hoffman EA. 2009. Minimizing genetic adaptation in captive breeding
programs: A review. Biological Conservation 142: 2388-2400.
Wisely SM, Buskirk SW, Fleming MA, McDonald DB, Ostrander EA. 2002. Genetic
diversity and fitness in black-footed ferrets before and during a bottleneck.
Journal of Heredity 93: 231-237.
Witzenberger KA, Hochkirch A. 2011. Ex situ conservation genetics: a review of
molecular studies on the genetic consequences of captive breeding programmes
for endangered animal species.
Wright B, Morris K, Grueber CE, Willet CE, Gooley R, Hogg CJ, O’Meally D, Hamede R,
Jones M, Wade C, Belov K. 2015. Development of a SNP-based assay for
measuring genetic diversity in the Tasmanian devil insurance populatoin. BMC
Genomics 16: 791. DOI: 10.1186/s12864-015-2020-4.
Wright S. 1969. Evolution and the genetic of populations, vol. II: The theory of gene
frequencies. University of Chicago Press: Chicago, Il.
Zhang B, Fang SG, Xi YM. 2006. Major histocompatibility complex variation in the
endangered crested ibis (Nipponia nippon) and implications for reintroduction.
Biochemical Genetics 44: 113-123.

118
CHAPTER FIVE: POPULATION VIABILITY ANALYSIS FOR A SPECIES THAT IS EXTINCT IN THE WILD: CONSIDERATIONS FOR
MAINTAINING THE EX SITU POULATION OF GUAM KINGFISHER (TODIRAMPHUS CINNAMOMINUS)
Introduction
Demographic stochasticity is the random variation in the numbers of births,
deaths, and the sex ratio in a population that results from the outcomes of probabilistic
events of reproduction, mortality, and sex determination (Shaffer 1981). Recent
analyses have shown that some populations can be quite sensitive to these stochastic
processes, often in unexpected ways (Lacy 2000, Lee et al. 2017) and the impact of
demographic stochasticity is magnified by small sample size (Sim et al. 2011).
Demographic stochasticity arises because, at any time, individuals of a given age or
developmental stage have differing probabilities of survival and reproduction (Lande
1988). Additionally, inbreeding depression acting on demographic rates can become a
significant contributor to population decline in populations smaller than several hundred
individuals, even if genetic problems are not the primary threat (Lacy 2000). When the
increases in demographic fluctuations of small populations are taken into consideration,
rates of loss of genetic variation and accumulation of inbreeding can be much faster
than has been previously suggested (Lacy 2000). Demographic models can be used as
an objective tool to evaluate the risk of various management scenarios, to identify the
demographic parameters to which the populations are most sensitive, and to indicate

119
where research is more urgently needed to provide the information necessary for
management of the population (Bustamante 1996, Converse et al. 2013, Di Minin and
Griffiths 2011). In addition, demographic modeling allows for a quantitative assessment
of population status, diagnosing potential causes of population decline and comparing
strategies that might change the population’s trajectory (Faust et al. 2006).
Population viability analysis (PVA) is a quantitative analysis of population
dynamics, used to evaluate data and model various scenarios in order to anticipate the
likelihood that a population will persist into the future (Gilpin and Soulé 1986). PVA
incorporates the demographic parameters specific to a population and their sensitivity to
potential changes in these values, as well as genetic processes that may affect
persistence. Quantitative and mathematical complexity vary among models and can
include aspects of spatially explicit models, sensitivity analyses, and genetic data, and
the use of packaged viability computer programs has become common (Lethbridge and
Strauss 2015, Reed et al. 2002). Recent advances in PVA have led to the incorporation
of new types of information, such as molecular genetic data for understanding molecular
ecology and processes (Hoban 2014) and improved methods for evaluating and
incorporating parameter uncertainty (Heard et al. 2013, McGowan et al. 2011) and
individual uncertainty (Kendall and Fox 2002, Moore et al. 2012). Therefore, it is
important to consider carefully which PVA model is most appropriate for a particular
analysis. An individual-based simulation program that models the stochastic process of
small populations can account for factors such as fluctuations in sex ratio, mate
availability, and inbreeding (Lacy 2000). Individual-based PVA models best approximate
the dynamics of small populations, particularly those with low intrinsic growth rates and

120
stable social systems such as mammalian and avian systems (Lacy 2000). Individual-
based modeling is a powerful alternative approach to matrix-based modeling that allows
for the incorporation of characteristics of individuals that may impact demography. A
model that uses these individual data can more realistically simulate the potential for
growth of a closed population in short- and long-term time frames (Faust et al. 2006).
While individual-based PVA has been frequently applied to conservation and
management strategies of wild populations (Carroll et al. 2014, Moore et al. 2012),
detailed demographic and genetic analyses examining the viability of ex situ populations
are much less common and usually focused on long-lived, charismatic species. For
example, Bustamante et al. (1996) examined the ex situ population of the bearded
vulture (Gypaetus barbatus) and the viability of extraction rates for release and
determined the need to improve hatchling survival to support expanded releases. Faust
et al. (2006) evaluated the declining ex situ population of Asian elephants (Elephas
maximus) in the United States and found that multiple management changes,
particularly related to increasing the number of births per year, improving reproductive
rates, and altering the birth sex ratio towards females, were all necessary to reverse the
negative population trajectory. To evaluate the success of ex situ-born, reintroduced
bighorn sheep (Ovis Canadensis), Ostermann et al. (2001) compared the survival and
recruitment ability of the reintroduced individuals compared to wild sheep, and found
similar survival and low recruit recruitment rates in both groups, and determined that the
supplemented population was neither growing nor viable for an extended period of time.
These studies, and others, have examined such factors as the probability of persistence
of the species in ex situ settings (Faust et al. 2006, Sukumar et al. 1997, Wiese 2000),

121
the sensitivity of a population to change in demographic parameters (Bustamante 1996,
Earnhardt et al. 2009, Faust et al. 2006, Rodriguez-Clark and Sanchez-Mercado 2006,
Wiese 2000, Zeoli et al. 2008), and the integration of the ex situ population into in situ
management of the species (Bustamante 1996, Osterman et al. 2001, Rodriguez-Clark
and Sanchez-Mercado 2006, Zeoli et al. 2008).
In this paper, I implement a PVA to study the ex situ population of Guam
kingfishers. Conducting a PVA is an important management tool at this point in the
population’s history due to the availability of extensive information on the individuals in
the population, its management history, as well as the existence of specific goals for the
short and long term management. There are few, if any, taxa that have gone extinct in
the wild, and for which a scientific PVA was published prior to reintroduction, with the
aim of maintaining the sole source population. Even in such well known recovery
programs as the California condor (Gymnogyps californianus), no published PVA exists
from the early history of the reintroduction program. Only simplistic models have been
completed for G. californianus, and these have focused on basic demography of the
reintroduced birds (Meretsky et al. 2000), but no PVAs have focused on maintenance of
the ex situ source population. With the development of the field of reintroduction, there
is a need to improve and inform future reintroductions through the application of a
hypothetico-deductive method with models derived from observation and data collection
and hypotheses subject to testing (Seddon et al. 2007). In order to optimize effective ex
situ management strategies prior to and during initial phases of reintroduction, I
conducted individual-based stochastic simulations that incorporate demographic and
genetic information, as well as factors related to the management of this species in zoos

122
to address a number of questions relative to the future management of this species.
Specifically, I developed and tested scenarios related to future changes in carrying
capacity, evaluated impacts of inbreeding depression, changes in genetic management
methods, tested the sensitivity in various demographic parameters, and examined the
impacts of harvesting birds for a reintroduction.
The baseline scenario was constructed with data obtained from both the Guam
kingfisher studbook (Bahner 2015) and the most recent breeding and transfer plan and
population analysis (Bahner and Bryan 2016) in order to represent the most recent
history of management in this population. The first altered scenario examined changes
in carrying capacity. Based on population simulations that find larger population sizes
retain higher levels of heterozygosity (Lacy 1987), I predict that an increase in carrying
capacity will lead to improved maintenance of gene diversity and maintain a low
probability of population extinction.
The fact that inbreeding depression plays a role in the extinction of populations is
not a controversy in itself. However, the magnitude of the effect and the role it plays in
relationship to other factors is debated (Charlesworth and Charlesworth 1987, Lynch
1991). In a meta-analysis by O’Grady et al. (2006), it was determined that disregarding
the influence of inbreeding depression on extinction risk will lead to serious
overestimates of the survival prospects of threatened mammalian and avian taxa. While
the number of lethal alleles and effects of inbreeding depression have not previously
been studied in the Guam kingfisher, inbreeding depression should be considered as
inbreeding is likely to continue increasing in this population, and inbreeding depression
effects may become prominent. I predict than an increase in lethal alleles in the Guam

123
kingfisher population will have negative impacts on the probability of survival in this
population.
In addition to inbreeding depression, other genetic scenarios are important to
consider. The population is currently managed with a strict set of guidelines typical of ex
situ populations including creating pairs that are well matched in mean kinship, and
avoiding pairings that create inbred offspring (Ballou and Lacy 1995). These strategies
are incorporated in the baseline, but I test scenarios of altering these guidelines. I
predict that changing genetic management strategies will have impacts on the
percentage of gene diversity maintained after 100 years.
Sensitivity analysis allows for the exploration of the effect of alterations of
different parameters and to investigate the consequences of measurement errors or
alteration related to management or threats (Boyce 1992, Penn et al. 2000). Sensitivity
analysis is conducted by varying a parameter by a small amount around its estimated
value and calculating the change in population growth rate given an absolute change in
a single demographic element (Crooks et al. 1998). Sensitivity testing is essential to
document the uncertainty in the model projections that result from uncertainty in input
parameter values (Lacy 1993). A sensitivity analysis of the baseline scenario was
conducted to determine which vital rates are most critical to the population’s dynamics.
If the model’s results are highly sensitive to a parameter, there are two interpretations:
1) that the parameter is a good target for management actions if it can be altered in
practice, or 2) that if there is any uncertainty in the value of the parameter, it is important
to estimate correctly and effort should be put into collecting more data or studies
focused on this parameter (Hosack et al. 2002). I expect that alterations in demographic

124
parameters such as mortality rates and reproductive rates will influence the persistence
of this population.
This population of Guam kingfishers will serve as the sole source for
reintroduction of this species back to the wild. Therefore, it is imperative to examine the
effect on various scenarios related to removal of individuals for reintroduction while
maintaining the population at a specified population size and maximizing gene diversity.
Many projects focus on the rate of extraction needed to support the supplementation or
augmentation to create a viable wild populations (e.g. Ostermann et al. 2001), but rarely
do these PVAs consider the health of the ex situ source populations. However,
Bustamante (1996) did examine the rate of extraction and the number of hatchlings
needed to support that reintroduction. Because the Guam kingfisher is extinct in the
wild, there is little room for error when harvesting birds for a future reintroduction, and I
predict that age of harvest, number of birds harvested, and the population size needed
to maintain the ex situ population will impact population persistence.
While the information in these analyses is specific to Guam kingfishers, these
questions and methods apply to a range of species managed in ex situ populations,
particularly for those conservation breeding programs that would like to determine long
term impacts on population viability when making specific management changes, or in
those programs that have a reintroduction component.

125
Methods
Demographic Parameters and Parameterization of Life Table
Realistic population modeling relies on estimates of vital rates for the species in
question (Doak et al. 1994), particularly quantification of life history such as mortality
and reproductive rates. Age specific vital rates, or the differences in mortality and
fecundity in each age class, are known to vary among the stages observed in managed
populations (Ballou and Foose 1996). Those rates will differ during the founding stage
of a population compared to when the population is managed at its space capacity. In
order to calculate parameters for the PVA that are representative of the biology of the
species as well as those that are representative of the recent management strategies, I
examined the census of the population (Figure 7), and calculated multiple life tables to
understand how different time periods of management have influenced demographic
parameters.

126
Figure 7. Census of Guam kingfisher Species Survival Plan® population from 1984-1986. Census was taken on the last day of every year.
The current SSP management plan uses demographic data from 1980-2016 (Bahner
and Bryan 2016) but I also examined the time period of rapid growth from 2004-2016 to
determine if fecundity and/or mortality rates differed between these datasets. The
demographic life tables were calculated using the program PMx (Ballou et al. 2016)
using the most recently published studbook data (Bahner 2015) and demographic vital
rates extracted from the studbook database were used for viability analysis of the ex
situ population under various projected scenarios described below. Male and female life
tables incorporate Kaplan-Meier estimates of survivorship (lx), annual age-specific
survival and mortality rates (px and qx), life expectancy (Ex), fecundity (Mx), and the
sample size used to calculate those rates. Therefore, a range of possible rates for
mortality and fecundity were investigated based on different stages of management of

127
the ex situ population to ensure the rates are most representative of the current
population. Life tables from PMx (Ballou et al. 2016) are included as Tables 7 and 8.
Table 7. Guam kingfisher life table with demographic data of ex situ population from 1980-2016.
Males Females
Age (years)
Qx Risk Qx Lx Mx Risk Mx Ex
Qx Risk Qx Lx Mx Risk Mx Ex
0 0.41 209.60 1.00 0.00 209.60 6.65
0.40 195.70 1.00 0.00 195.70 4.85
1 0.07 184.50 0.59 0.05 184.50 9.56
0.05 176.60 0.60 0.08 176.60 6.39
2 0.07 170.80 0.55 0.18 170.80 9.24
0.10 165.40 0.57 0.27 165.40 5.67
3 0.07 159.50 0.51 0.25 159.50 8.84
0.17 146.00 0.51 0.44 146.00 5.21
4 0.08 137.30 0.47 0.34 137.30 8.45
0.13 115.30 0.42 0.70 115.30 5.09
5 0.08 111.30 0.43 0.43 111.30 8.13
0.15 94.70 0.37 0.48 94.70 4.69
6 0.11 94.40 0.40 0.41 94.40 7.78
0.10 77.00 0.31 0.46 77.00 4.34
7 0.12 77.00 0.35 0.55 77.00 7.60
0.23 60.20 0.28 0.38 60.20 3.70
8 0.09 62.70 0.31 0.45 62.70 7.53
0.16 41.70 0.22 0.18 41.70 3.49
9 0.09 54.60 0.28 0.17 54.60 7.19
0.44 26.50 0.19 0.11 26.50 2.95
10 0.12 47.00 0.26 0.12 47.00 6.77
0.17 14.50 0.10 0.11 14.50 3.49
11 0.12 38.10 0.23 0.12 38.10 6.57
0.31 8.60 0.09 0.00 8.60 3.00
12 0.09 28.20 0.20 0.12 28.20 6.37
0.01 5.70 0.06 0.08 5.70 2.88
13 0.14 21.60 0.18 0.14 21.60 5.93
0.40 3.70 0.06 0.00 3.70 1.90
14 0.15 18.50 0.16 0.06 18.50 5.71
0.50 1.20 0.04 0.00 1.20 1.50
15 0.06 15.50 0.13 0.20 15.50 5.54
1.00 0.60 0.02 0.00 0.60 1.00
16 0.00 15.00 0.12 0.23 15.00 4.84
1.00 0.00 0.00 0.00 0.00 0.00
17 0.15 12.30 0.12 0.29 12.30 3.84
1.00 0.00 0.00 0.00 0.00 0.00
18 0.25 8.90 0.10 0.00 8.90 3.36
1.00 0.00 0.00 0.00 0.00 0.00
19 0.15 6.60 0.08 0.08 6.60 3.13
1.00 0.00 0.00 0.00 0.00 0.00
20 0.26 4.90 0.07 0.00 4.90 2.52
1.00 0.00 0.00 0.00 0.00 0.00
21 0.34 3.30 0.05 0.00 3.30 2.05
1.00 0.00 0.00 0.00 0.00 0.00
22 0.41 2.00 0.03 0.00 2.00 1.59
1.00 0.00 0.00 0.00 0.00 0.00
23 1.00 0.00 0.02 0.00 0.00 1.00
1.00 0.00 0.00 0.00 0.00 0.00
24 1.00 0.00 0.00 0.00 0.00 0.00 1.00 0.00 0.00 0.00 0.00 0.00

128
Table 8. Guam kingfisher life table with demographic data of ex situ population from 2004-2016.
Males
Females
Age (years)
Qx Risk Qx Lx Mx Risk Mx Ex
Qx Risk Qx Lx Mx Risk Mx Ex
0 0.32 123.40 1.00 0.00 123.40 8.36
0.37 110.20 1.00 0.00 110.20 5.52
1 0.06 117.30 0.68 0.05 117.30 10.85
0.03 103.40 0.63 0.08 103.40 7.12
2 0.07 108.10 0.64 0.18 108.10 10.46
0.12 96.10 0.62 0.28 96.10 6.30
3 0.06 95.50 0.59 0.19 95.50 10.18
0.15 82.90 0.54 0.48 82.90 6.01
4 0.06 81.80 0.56 0.28 81.80 9.77
0.10 66.60 0.46 0.56 66.60 5.88
5 0.10 65.50 0.52 0.44 65.50 9.32
0.10 58.90 0.42 0.45 58.90 5.43
6 0.14 52.50 0.47 0.43 52.50 9.23
0.06 50.60 0.38 0.32 50.60 4.91
7 0.05 42.50 0.41 0.56 42.50 9.52
0.19 41.60 0.35 0.28 41.60 4.14
8 0.05 35.60 0.39 0.49 35.60 8.95
0.17 26.90 0.29 0.16 26.90 3.87
9 0.03 33.60 0.37 0.12 33.60 8.40
0.43 16.60 0.24 0.08 16.60 3.47
10 0.12 30.90 0.36 0.13 30.90 7.62
0.09 8.80 0.14 0.00 8.80 4.33
11 0.08 25.80 0.31 0.08 25.80 7.55
0.00 4.60 0.12 0.00 4.60 3.67
12 0.05 20.10 0.29 0.00 20.10 7.09
0.00 4.00 0.12 0.13 4.00 2.67
13 0.06 16.40 0.28 0.09 16.40 6.38
0.50 2.70 0.12 0.00 2.70 1.67
14 0.13 15.00 0.26 0.07 15.00 5.74
0.67 1.00 0.06 0.00 1.00 1.33
15 0.08 12.50 0.23 0.13 12.50 5.41
1.00 0.90 0.02 0.00 0.90 1.00
16 0.00 12.30 0.21 0.00 12.30 4.78
1.00 0.00 0.00 0.00 0.00 0.00
17 0.18 10.80 0.21 0.00 10.80 3.78
1.00 0.00 0.00 0.00 0.00 0.00
18 0.21 7.20 0.17 0.00 7.20 3.40
1.00 0.00 0.00 0.00 0.00 0.00
19 0.15 5.70 0.14 0.00 5.70 3.04
1.00 0.00 0.00 0.00 0.00 0.00
20 0.32 3.90 0.11 0.00 3.90 2.40
1.00 0.00 0.00 0.00 0.00 0.00
21 0.34 3.00 0.08 0.00 3.00 2.05
1.00 0.00 0.00 0.00 0.00 0.00
22 0.41 2.00 0.05 0.00 2.00 1.59
1.00 0.00 0.00 0.00 0.00 0.00
23 1.00 0.00 0.03 0.00 0.00 1.00
1.00 0.00 0.00 0.00 0.00 0.00
24 1.00 0.00 0.00 0.00 0.00 0.00 1.00 0.00 0.00 0.00 0.00 0.00
Viability Analysis of Ex Situ Population
This study enables the predictive estimates of how well the current management
strategies will foster persistence of the ex situ population of the Guam kingfisher.
Specifically, the models investigated here allowed me to test altered management
strategies to determine how these strategies impact long-term persistence.
Comparisons of these models enabled me to address the following questions:
(1) Under current practices, what is the risk of population decline or extinction?

129
(2) If the space available to the ex situ population was increased, how does this
increase impact the risk of extinction?
(3) What change in demographic rates would lead to a population decline or
increase in extinction risk?
(4) What is the impact of current genetic management practices on the loss in
genetic diversity?
(5) What role may inbreeding depression play on the potential for extinction?
(6) How many individuals and what age class can be removed for a
reintroduction program without leading to risk of population decline?
Under all scenarios, I summarized probability of extinction in 100 years, as well as
resulting levels of gene diversity to determine success of the specific strategy. The
following scenarios and inputs were used to examine these questions:
Scenario 1 – Baseline:
The baseline scenario used parameters that most closely represent the current
(i.e. 2016) management strategy of the Guam Kingfisher Species Survival Plan (SSP®).
In the baseline scenario, an individual-based simulation was run using Vortex 10.0.7.9
(released 28 January 2015; Lacy and Pollack 2014) in which each individual survives
with the probability determined by its age and sex, and number of offspring produced by
each female is sampled from a Poisson distribution with the mean set to the age-
specific fecundity, under the constraint that there must be sufficient adult males
available for the breeding females (Lacy et al. 2012). Stochastic projections are more

130
realistic for smaller population size, as skewed sex ratio and other chance events will
typically depress and cause large variation in population growth (Lacy 2000).
The scenario settings were input with one population (the current ex situ
population), with extinction defined as when only one sex remains. I ran 500 iterations
for 100 years each. The reproductive system for this species is long-term monogamy,
with the age of first offspring being five years for males and four years for females
(median age at first hatch calculated from studbook data). The maximum age of
reproduction was entered as 19 for males and 12 for females. These data are from the
maximum ages at which reproduction has occurred in the studbook dataset in the
history of ex situ management. The maximum lifespan was entered as 24, as the oldest
male in the population lived to be slightly older than 23 years old.
While biologically possible for females to produce seven clutches in a year by
removing eggs and artificially incubating so that females re-clutch, management
strategies in recent years have limited females to six clutches per year to reduce the
physical demand on the female to produce eggs. The model was therefore adjusted to
allow for no more than 6 clutches in a year and the maximum number of progeny per
clutch is three. The scenario included a 1:1 sex ratio at hatch (total hatches of known
sex individuals from 1980-2016 = 446, χ2 = 1.085, df = 1, p = 0.30). I used Poplink 2.4’s
(Faust et al. 2012) to estimate the average proportion of females breeding in a given
year as the proportion of females of reproductive age that produced a fertile egg, which
averaged 52.7% of females over the past 10 years. The distribution of clutches per year
from 1984-2016 laid by a female in a year is shown Figure 8.

131
Figure 8. Distribution of number of clutches per female per year from 1984-2016.
A total of 269 clutches were laid during this time with a clutch defined as eggs laid by a
single female within a period of seven days. The distribution of number of offspring per
female per clutch is one offspring = 65.19%, two offspring = 33.33%, three offspring =
1.48%. These values were determined from reproductive reports in Poplink 2.4 and are
determined by the predetermined hatch date range for clutchmates of seven days.
Mortality (qx) rates are extracted from the life table for both males and females
(from Table 7) for the age classes of 0-1, 1-2, 2-3, 3-4, and after 4 (for females), and 4-5
and after 5 (for males) are listed in Table 9.

132
Table 9. Juvenile and adult mortality rates by sex. First year mortality rates are calculated from chicks that have hatched.
Age class Females (% age class) Age class Males (% age class)
0-1 40.0 0-1 41.0 1-2 5.0 1-2 7.0 2-3 10.0 2-3 7.0 3-4 17.0 3-4 7.0 After 4 24.0 4-5 8.0 After 5 15.0
For mate monopolization values, because the reproductive system is long-term
monogamy, all males in the population are available to breed (100%). Carrying capacity
was set at K = 150, which is the approximate size of the population at the start of 2016.
The initial population was input from the studbook with living birds as of 1 January 2016
and the pedigree of the population. The population starting size on this date was N =
148 and the starting age structure of the population was defined by this input file. The
scenario included genetic management setting to pair according to mean kinship with a
static mean kinship list, to as closely match the history of genetic management of the ex
situ population as possible. This scenario was also set to calculate the number of
pairings required each year to bring or maintain the population at its carrying capacity.
Finally, this scenario was set to prevent pairings between birds with kinships greater
than 0.25 since at this point in the population’s genetic management pairings between
siblings have been purposefully avoided.

133
Scenario 2 – Carrying Capacity:
There is a proposal to build an additional 1-2 breeding centers in the next 5-10
years. If these breeding centers can hold five breeding pairs or approximately 10
offspring for a total of 10 additional birds, this would increase the carrying capacity to
160 or 170. Also, a population target size of 250 was previously set as the goal for the
managed population to reach prior to conducting releases or removing birds for
supplementing a release population. Therefore, I examined the probability of extinction
under models of expanded carrying capacity. Given the plans for growth of the Guam
kingfisher ex situ population, I tested three additional carrying capacity scenarios of 160,
170, and 250. All remaining model parameters matched those of the baseline model.
Scenario 3 – Inbreeding Depression:
Previously, 3.14 lethal equivalents were used in most Vortex PVAs in cases
where number of lethal equivalents was unknown. This value, obtained from Ralls
(1988) study of captive mammals, had been the only comprehensive reference
examining lethal equivalents in multiple species. However, in O’Grady et al.’s (2006)
meta-analysis, they presented diploid lethal equivalents in avian species affecting
fecundity and survival varying from 0.74 to >13.44. Based on recent arguments that ex
situ populations are likely to have lower lethal alleles than wild populations due to their
sheltered environment in which they are impacted by fewer stressors (Lacy et al. 2015),

134
the mid-point of O’Grady’s suggested values of 6.29 is now a more commonly assumed
value.
Vortex models inbreeding depression as a reduction in the vital rate for first-year
survival among inbred individuals. I first examined this assumption in Guam kingfisher
population by conducting a logistic regression comparing the inbreeding value for each
individual hatched in the population to survival to 30 days and to one year. There is no
evidence at this point that there is inbreeding depression occurring in first year survival
for 30 days (N = 637, p>0.32, Figure 9A) or to one year (N = 637, p>0.74, Figure 9B).

135
A)
B)
Figure 9. Comparison of individual inbreeding level and survival to 30 days (A) or to one year (B) in all hatches in the Guam kingfisher population from 1984-2016.
However, even though there is not evidence for inbreeding depression in first year
survival at this time, it may be present in another aspect of this population such as
reduced fecundity or reduced adult survival, or as inbreeding levels increase, may have

136
impacts on the population into the future. Since no inbreeding depression was included
in the baseline scenario, in this scenario I tested the impacts of including both the
values of 3.14 and 6.29 lethal equivalents, with the default of 50 percent due to
recessive lethal alleles.
Scenario 4 – Genetic Management:
Most ex situ populations are managed such that when breeding
recommendations and pairings are made, a static mean kinship list is used where the
kinship of each individual is left unchanged within each year as pairs are selected. The
Guam kingfisher population is managed with a static mean kinship list, which is the
more appropriate strategy if many pairings fail. The dynamic mean kinship list is
projected to preserve genetic diversity if most males and females that are paired do
produce the expected offspring (i.e. the % females breeding is high, Lacy et al. 2015).
Because the percent of females breeding in the baseline scenario is above 50%, I
tested a scenario in which a dynamic mean kinship was used to determine the predicted
improvement in maintenance of gene diversity.
In addition to changing the way pairs are made, another genetic management
strategy related to inbreeding avoidance is also used. In the baseline, I chose to avoid
pairings that would result in offspring with inbreeding levels of 0.25, or of that of full
siblings. In the history of genetic management of this population, just one individual with
this level of inbreeding was hatched. Therefore, I chose to test a scenario where the

137
restrictions on inbreeding would be even greater with no individuals paired that would
produce offspring with an inbreeding level of 0.125, or half-siblings.
Scenario 5 – Sensitivity Analysis of Mortality and Reproduction:
For the sensitivity testing scenario, I examined changes in first year mortality of
both sexes, adult mortality of both sexes, and a change in the percentage of females
breeding. The minimum and maximum as well as the range of the parameter space
tested are listed in Table 10.
Table 10. Sensitivity test variables with the minimum, maximum and increments tested.
Test Description Base Value Minimum Maximum Increment
First Year Mortality 40 15 65 5 Female Adult Mortality 25 5 50 5 Male Adult Mortality 15 5 50 5 Percent of Females Breeding 53 25 75 2
I used 100 samples of each parameter with the single-factor testing option. After
completing the sensitivity analysis, I completed a standard least square ANOVA to
examine the impact of the four parameters and their relationship to probability of
extinction.
Scenario 6 – Removal for Reintroduction (Harvest):
In the final scenario, I varied the proportion of various age classes to determine
an appropriate number of available birds (i.e. harvested individuals) for reintroduction

138
throughout the next 100 years. All scenarios started with first harvest occurring in five
years, and with a frequency of recurrence of every five years after for the next 100
years. I examined extraction of juveniles in age classes two and three, as well as
scenarios with adult birds only and tested different numbers of birds in these scenarios
(Table 11). I also tested these simulations under the current carrying capacity of 150,
and the higher carrying capacity of 250 individuals (Table 11).
Table 11. Harvest scenarios of the Guam kingfisher population to determine availability of birds for reintroduction. All harvest scenarios start at year 5 and end at year 100. When the population size condition is included, the total population size must be greater than 90% of carrying capacity in order for harvest to occur.
Harvest Scenarios Sex Ratio Age Class Carrying Capacity
Adults 5 males, 5 females After 5 males, After 4 females 150 Adults 5 males, 5 females After 5 males, After 4 females 250 Adults 3 males, 3 females After 5 males, After 4 females 150 Adults 3 males, 3 females After 5 males, After 4 females 250 Juveniles 4 males, 4 females 2 individuals from age 2-3, and 2 from
age 3-4 from both sexes 150
Juveniles 4 males, 4 females 2 individuals from age 2-3, and 2 from age 3-4 from both sexes
250
Results
The results of the baseline scenario predict that there is a 0.00% probability of
extinction in 100 years with 83.64% of gene diversity projected to remain after the 100
years. Summary statistics of all scenarios, probability of extinction after 100 years, and
projected gene diversity in 100 years are in Table 12.

139
Table 12. Results from population viability analyses for the Guam Kingfisher (Todiramphus cinnamominus) Species Survival Plan® including baseline scenario and multiple alternate scenarios. All scenarios run for 500 iterations.
Scenario Det-R Stoch-R SD (Stoch-R) PE N-extant SD (N-extant) GeneDiv SD (GD)
Baseline 0.044 0.010 0.061 0.00 144.49 7.19 0.8364 0.0402 Carrying Capacity – N = 160 0.044 0.011 0.060 0.00 154.19 8.74 0.8412 0.0384 Carrying Capacity – N = 170 0.044 0.011 0.059 0.00 164.94 8.93 0.8384 0.0426 Carrying Capacity – N = 250 0.044 0.013 0.055 0.00 244.52 7.24 0.8551 0.0356 Inbreeding Depression - 3.14 0.044 0.000 0.067 0.02 128.00 31.33 0.8230 0.0507 Inbreeding Depression - 6.29 0.044 -0.022 0.093 0.35 58.05 42.60 0.7638 0.1036 Dynamic Mean Kinship 0.044 0.010 0.061 0.00 144.33 8.32 0.8335 0.0471 Prevent Inbreeding 0.125 0.044 -0.031 0.107 0.94 6.48 3.88 0.7516 0.0930 Harvest Adults – 5.5, K = 150 0.044 -0.005 0.097 0.20 125.81 26.79 0.8187 0.0524 Harvest Adults – 5.5, K = 250 0.044 0.001 0.088 0.17 228.67 34.48 0.8385 0.0430 Harvest Adults – 3.3, K = 150 0.044 0.004 0.073 0.04 135.38 17.93 0.8257 0.0434 Harvest Adults – 3.3, K = 250 0.044 0.009 0.065 0.02 238.38 21.47 0.8459 0.0403 Harvest Juveniles – 4.4, K = 150 0.044 0.004 0.073 0.02 132.75 20.38 0.8278 0.0488 Harvest Juveniles – 4.4, K = 250 0.044 0.008 0.065 0.03 234.94 25.23 0.8464 0.0404

140
Under all strategies in the increased carrying capacity scenarios, the populations
reach their target carrying capacity (Figure 10) and the risk of extinction is 0.00%.
Figure 10. Baseline and Carrying Capacity Scenarios demonstrating predicted population size at the end of 100 years for the Guam kingfisher SSP®.
This model also found that the population with 250 spaces is predicted to retain the
highest level of gene diversity at 85.51%, although the standard deviations between this
projection and the baseline projection do overlap (Table 12).
When including inbreeding depression in the baseline model, the probability of
extinction increases and depends on the number of lethal equivalents that are included.
If the population has 3.14 lethal equivalents per bird, probability of extinction is 2%, but
if the population has 6.29 lethal equivalents, that probability increases to 35.0% (Table
12).

141
In the genetic management scenarios, using the dynamic mean kinship list when
creating breeding pairs each year did not lead to increased gene diversity at 100 years
compared to the baseline. However, changing the inbreeding avoidance to preventing
pairings that would result in an inbreeding level of 0.125 had a detrimental impact on
probability of extinction, leading to a 94% chance of extinction in 100 years (Table 12).
The sensitivity testing demonstrated impacts on probability of extinction of three
of the four parameters tested (complete model: F = 26.98, DF = 4, p < 0.0001),
including infant mortality (F = 14.92, p = 0.0003), adult female mortality (F = 31.60, p <
0.0001), and percent of females breeding (F = 62.26, p < 0.0001). Male adult mortality
did not contribute significantly to the model. For infant mortality, the values between
15% - 50% maintained a low probability of extinction (0.00% – 0.04%) and infant
mortality above 55% had the greatest impact (Figure 11).

142
Figure 11. Sensitivity analysis of infant mortality on population probability of extinction in Guam kingfishers.
With female adult mortality, the results were extremely variable. The values from 5% -
30% adult female mortality predicted a low probability of extinction (0.00 – 4%) but
increasing mortality to 35% - 50% predicted a 41% - 100% probability of extinction
(Figure 12).

143
Figure 12. Sensitivity analysis of adult female mortality on population probability of extinction in Guam kingfishers.
However, across most values tested for male adult mortality, probability of extinction
remained between 0.00% - 4%, with only male mortality of 45% and 50% predicting a
probability of extinction of 19% and 56% respectively (Figure 13).

144
Figure 13. Sensitivity analysis of adult male mortality on population probability of extinction in Guam kingfishers.
Finally, altering the percentage of females breeding had the most variable impact. When
45% - 75% of females reproduced, probability of extinction was between 0.00 – 4%.
However, once the value dropped from 31% - 43%, probability of extinction ranged from
12% - 97%, and for values of 25% - 29%, extinction probability was 100% (Figure 14).

145
Figure 14. Sensitivity analysis of percent of females breeding on population probability of extinction in Guam kingfishers.
Finally, in the scenarios which examined harvesting birds for reintroduction, the
PVA models estimated that population size had little impact on probability of extinction
and maintenance of gene diversity than expected, but number and age class of birds
had large impacts on probability of survival (Table 12). Extracting six adults (three
males, three females) every five years had a low probability of extinction (2% - 4%) and
I found similar results for extracting eight juveniles (four males, four females, two from
each of the 2-3 and 3-4 age classes) with probability of extinction of 2% - 3%.

146
Discussion
In this paper, I use a PVA to test both the current management strategies and
alternate scenarios in the Guam kingfisher assurance population. The baseline scenario
suggests that under current strategies, there will be 0% probability of extinction in 100
years with greater than 83% genetic diversity retained (Table 12). However, as this
population is extinct in the wild, and serves as an assurance population which will serve
as the single source for future reintroductions, it is necessary to consider how potential
management changes will impact this population’s future trajectory. Therefore, I tested
numerous scenarios and considered the implications of the scenario results in terms of
future management of this species.
As expected, our analyses of carrying capacity indicated that an increase in
space above the baseline capacity maintained a 0% probability of extinction (Table 12).
An increase in carrying capacity also led to the maintenance of increased levels of gene
diversity (Table 12). The small increases did not have a noticeable impact, particularly
when considering the standard deviation of the results, although the highest carrying
capacity of N = 250 did result in the highest projections of future gene diversity (Table
12). Baker (2007) recommends a population size of 200 to be considered a minimally
viable ex situ population. However, for populations to be self-sustaining with no net loss
of genetic diversity, where drift and mutation are thought to be in balance, the minimum
population size is predicted to be Ne = 500 where Ne is the effective population size
(Frankham et al. 2002). Increased population size is directly linked to maintaining high
levels of gene diversity, with smaller populations at risk for impacts of genetic drift,
inbreeding depression, and stochastic events (Bouzat 2010, Soulé and Wilcox 1980).

147
However, carrying capacity becomes an important management variable when
considering future harvests for reintroduction, particularly as projections are likely to
change as birds are extracted (Dimond and Armstrong 2007), particularly if the goal is
to maintain the population at a specific size.
The results from the inbreeding depression and genetic management scenarios
demonstrated the potential impacts of genetic composition that may soon affect this
population. With the incorporation of inbreeding depression at conservative (3.14 lethal
equivalents) to moderate (6.29 lethal equivalents) levels, probability of extinction was
higher (2% and 35%) than baseline. Because of the resulting broad variation from a
small change in lethal equivalents used in this model, more research, specifically on the
genetic load that is present in the Guam kingfisher, is warranted to create more
accurate predictions. The meta-analysis by O’Grady et al. (2006) found that
disregarding the influence of inbreeding depression can lead to serious overestimates of
survival prospects of threatened taxa and can lead to the development of inappropriate
recovery plans. While it does not appear that inbreeding depression is yet impacting this
population, it is likely to become a concern as the presence of inbred individuals in the
population increases and the impacts of inbreeding depression may accumulate across
multiple life history stages (Grueber et al. 2010). The genetic management scenario
indicated that the population would have a very high probability of extinction (94%) if
matings that would lead to individuals with inbreeding levels of 0.125 were avoided
(Table 12). These results are likely driven by the increase in inbreeding that is already
occurring, and the inability to create pairs under these somewhat strict genetic
management guidelines. In order to decrease probability of extinction, higher levels of

148
inbreeding will need to be tolerated, which in turn will likely lead to increased impacts of
inbreeding depression and therefore a greater loss of genetic diversity (Lacy 1993).
While not always considered as impactful as demographic factors, inbreeding
depression and reduced genetic diversity can in some cases be the primary factors that
threaten population viability (del Castillo et al. 2011, Menges and Dolan 1998).
The interpretation and application of the results of sensitivity testing should be
considered within their ability and capacity to change in a real world situation, i.e. either
there is historic evidence of variation in the key vital rate, there is ability to make the
suggested alterations based on the results, or more data are required to have a better
estimate of the parameter in question (Reed et al. 2002). Of the three vital rates that
showed to be impactful in my model (infant mortality, adult female mortality, and percent
of females breeding), percentage of females breeding had the greatest impact, and also
the greatest variation on the probability of extinction at 100 years (Figure 14). Managers
should therefore consider this variable in future efforts to grow this population and
determine if there are ways to increase from the baseline value of 53% of females
breeding per year. More research may be needed around this variable and
understanding of what is driving this result. For example, are some females not being
given the opportunity for breeding based on their kinship value and the need to maintain
the population at its current carrying capacity, or are many females paired and not
successfully reproducing? The other important variables in this sensitivity analysis
related to infant and adult female mortality may have less of a capacity for change.
Attempts should be made to uncover causes of infant and female mortality to determine
if there are strategies to mitigate this, and therefore reduce mortality in these age

149
classes. Many studies focused on understanding the viability of avian populations have
also found similar results demonstrating that either juvenile or adult mortality may be the
most sensitive vital rate (Sӕther and Bakke 2000), although these results may also be
driven by other biological aspects of demography such as life-span, or by type of model
implemented (Mortenson and Reed 2016).
The final scenarios tested were related to rates of extraction or harvesting for
eventual reintroduction of Guam kingfishers back to the wild. I predicted that an
increased carrying capacity would better support the harvesting of more birds for
reintroduction, however I found that both scenarios with 10 adult birds extracted had the
highest probability of extinction (Table 12). Based on the results of the additional
scenarios, it appears that age class and/or a reduced number of birds are better
indicators of population survival when harvest is included. A harvest of six adults or
eight juveniles both had low probabilities of extinction. Because different strategies and
different factors appear to have similar probabilities of success in maintaining the
population, other avian reintroductions have made use of an adaptive approach to
harvesting source populations for reintroductions, re-evaluating their viability analysis
and harvest model after each extraction (Dimond and Armstrong 2007). Finally, while
the extraction scenarios completed here considered age class and number, there was
not a consideration of which birds, from a genetic perspective, would best to extract and
yet maintain the genetic health of the ex situ population. The genetic trade-offs of which
individuals should be harvested relative to the goals of the reintroduction and
maintenance of the source population will need to be considered in the future
(Earnhardt 1999).

150
While the results of the PVA provide a baseline of projections for the future
trajectory of the Guam kingfisher population, one of the limitations of this current model
(as well as many others, see Conner and White 1999) is the lack of detailed
understanding and incorporation of individual variation and its impact on the estimation
of extinction risk. Individual variation may be attributed to genotypic or phenotypic
variation (Conner and White 1999). Overall, demographic stochasticity results from the
differences among individuals and higher variance in demographic rates can lead to
greater extinction risks (Kendall and Fox 2002). Populations comprised of uniform
individuals are more extinction-prone than populations comprised of variable individuals
(Jager 2001). However, most PVAs, including this one, assume that the fates of all
individuals are identical such that the stochasticity from each vital rate is modeled from
a pre-determined, often over-simplified distribution (Conner and White 1999, Fox and
Kendall 2002, Kendall and Fox 2002). Recent analyses have determined that if there is
more variation among individuals in a population than is included in the models, existing
PVA’s may overestimate variance and thus the overall extinction risk may be lower than
expected (Conner and White 1999, Fox and Kendall 2002, Jager 2001, Kendall and Fox
2002). Individual variation can be further investigated in this Guam kingfisher PVA by
evaluating specific functions of demographic rates. For example, by specifying that
demographic rates are functions of the alleles carried by an individual, it is possible to
model more in depth genetic process and consider the genetically based individual
variation in demographic rates, such as breeding success or lifetime reproductive
succession (Conner and White 1999, Lacy et al. 2015). Additional scenarios may
examine the heritability of traits, such as high fitness and high survival, and consider

151
that the presence of individuals with these extreme traits that can survive and reproduce
under adverse conditions may extend the probability of a population’s persistence
(Conner and White 1999, Jager 2001).
The ex situ population of Guam kingfishers is on the verge of major changes in
management, with population managers considering testing release strategies for the
birds, and preparing to increase the population size and increase reproduction. Because
of these potential changes, conducting a PVA for this population prior to implementing
these changes can better inform and help prioritize the future recovery strategy. The
importance of conducting this PVA goes beyond the management of the Guam
kingfisher. While most ex situ populations have short term goals of reaching and
maintaining a target population size, retaining gene diversity and avoiding inbreeding
(Lees and Wilcken 2009), very few use a PVA to understand how best to reach these
same goals in a longer timeframe. For the Guam kingfisher, this becomes even more
significant as this species is extinct in the wild, and there is less room for error in
managing the population to meet its goals. Finally, most research of the impacts of
reintroductions has been retrospective and gained from post hoc interpretations of
monitoring results (Seddon et al. 2007). There is a need to develop better methods of
modeling approaches and experiments related to improving outcomes from the release
of ex situ animals as well as a better use of simulation modeling to identify factors
affecting the viability of the reintroduced population (Seddon et al. 2007). These needs
should be extended to not just reintroduced populations, but also to conservation
breeding programs and in management of species with conservation significance.

152
References
Bahner B. 2015. North American regional studbook for the Guam Micronesian kingfisher
(H. cinnamomina cinnamomina). Association of Zoos and Aquariums: Silver
Springs, MD.
Bahner B, Bryan CG. 2016. Population Analysis and Breeding and Transfer Plan: Guam
Kingfisher (Todiramphus cinnamominus) AZA Species Survival Plan® Yellow
Program. Population Management Center: Chicago, IL.
Baker A. 2007. Animal ambassadors: an analysis of the effectiveness and conservation
impact of ex situ breeding efforts. In: Zimmermann A, Hatchwell M, Dickie L,
West C. (Eds). Zoos in the 21st Century: Catalysts for Conservation? Zoological
Society of London: London, UK.
Ballou JD, Foose T. 1996. Demographic and genetic management of captive
populations. In: Kleiman D, Allen M, Thompson K, Lumpin S. (Eds). Wild
mammals in captivity: principles and techniques. Chicago: University of Chicago
Press. pp 263-314.
Ballou JD, Lacy RC. 1995. Identifying genetically important individuals for management
of genetic diversity in pedigreed populations. In: Ballou JD, Gilpin M, Foose TJ.
(Eds). Population management for survival and recovery. Columbia Press: New
York, NY.
Ballou JD, Lacy RC, Pollak JP. 2016. PMx: Software for demographic and genetic
analysis and management of pedigreed populations (Version 1.4.20161017).

153
Chicago Zoological Society, Brookfield, Illinois, USA. Available from
http://www.vortex10.org/PMx.aspx
Bouzat JL. 2010. Conservation genetics of population bottlenecks: the role of chance,
selection, and history. Conservation Genetics 11: 463-478.
Boyce MS. 1992. Population viability analysis. Ann. Rev. Ecol. Syst. 23: 481-506.
Bustamante J. 1996. Population viability analysis of captive and released bearded
vulture populations. Conservation Biology 10: 822-831.
Carroll C, Fredrickson RJ, Lacy RC. 2014. Developing metapopulation connectivity
criteria from genetic and habitat data to recover the endangered Mexican wolf.
Conservation Biology 28: 76-86.
Charlesworth D, Charlesworth B. 1987. Inbreeding depression and its evolutionary
consequences. Ann. Rev. Ecol. Syst. 18: 237-268.
Conner MM, White GC. 1999. Effects of individual heterogeneity in estimating the
persistence of small populations. Natural Resource Modeling 12: 109-127.
Converse SJ, Moore CT, Armstrong DP. 2013. Demographics of reintroduced
populations: Estimation, modeling, and decision analysis. The Journal of Wildlife
Management 7: 1081-1093.
Crooks KR, Sanjayan MA, Doak DF. 1998. New insights on cheetah conservation
through demographic modeling. Conservation Biology 12: 889-895.
del Castillo RF, Trujillo-Argueta S, Sanchez-Vargas N, Newton AC. 2011. Genetic
factors associated with population size may increase extinction risks and
decrease colonization potential in a keystone tropical pine. Evolutionary
Applications 4: 574-588.

154
Di Minin E, Griffiths RA. 2011. Viability analysis of a threatened amphibian population:
modelling the past, present and future. Ecography 34: 162-169.
Dimond WJ, Armstrong DP. 2007. Adaptive harvesting of source populations for
translocation: a case study with New Zealand robins. Conservation Biology 21:
114-124.
Doak D, Kareiva P, Klepetka B. 1994. Modeling population viability for the desert
tortoise in the Western Mojave Desert. Ecological Applications 4: 446-460.
Earnhardt JM. 1999. Reintroduction programmes: genetic trade-offs for populations.
Animal Conservation 2: 279-286.
Earnhardt JM, Thompson SD, and Faust LJ. 2009. Extinction risk assessment for the
Species Survival Plan (SSP®) population of the Bali mynah (Leucopsar
rothschildi). Zoo Biology 28: 230-252.
Faust LJ, Bergstrom YM, Thompson SD, Bier L. 2012. Poplink Version 2.4. Lincoln Park
Zoo. Chicago, IL.
Faust LJ, Thompson SD, and Earnhardt JM. 2006. Is reversing the decline of Asian
elephants in North American zoos possible? An individual-based modeling
approach. Zoo Biology 25: 201-218.
Fox GA, Kendall BE. 2002. Demographic stochasticity and the variance reduction effect.
Ecology 83: 1928-1934.
Frankham R, Ballou J, Briscoe D. 2002. An introduction to conservation genetics.
Cambridge University Press: Cambridge, UK.

155
Gilpin ME, Soulé ME. 1986. Minimum viable populations: process of species
extinctions. In: Soulé ME (Ed). Conservation biology: the science of scarcity and
diversity. Sinauer Associates: Sunderland, MA.
Grueber CE, Laws RJ, Nakagawa S, Jamieson IG. 2010. Inbreeding depression
accumulation across life-history stages of the endangered tahake. Conservation
Biology 24: 1617-1625.
Haig SM, Ballou JD, Derrickson SR. 1990. Management options for preserving genetic
diversity: reintroduction of Guam rails to the wild. Conservation Biology 4(3): 290-
300.
Heard GW, McCarthy MA, Scroggie MP, Baumgartner JB, Parris KM. 2013. A Bayesian
model of metapopulation viability, with application to an endangered amphibian.
Diversity and Distributions 19: 555-566.
Hedrick PW. 2000. Genetics of Populations. Jones and Bartlett Publishers:
Massachusetts.
Hoban S. 2014. An overview of the utility of population simulation software in molecular
ecology. Molecular Ecology 23: 2383-2401.
Hosack DA, Miller PS, Hervert JJ, Lacy RC. 2002. A population viability analysis for the
endangered Sonoran pronghorn, Antilocapra Americana sonoriensis. Mammalia
66: 207-229.
Jager HI. 2001. Individual variation in life history characteristics can influence extinction
risk. Ecological Modelling 144: 61-76.
Kendall BE, Fox GA. 2002. Variation among individuals and reduced demographic
stochasticity. Conservation Biology 16: 109-116.

156
Lacy RC. 1987. Loss of genetic diversity from managed populations: interacting effects
of drift, mutation, immigration, selection, and population subdivision.
Conservation Biology 1: 143-158.
Lacy RC. 1993. Impacts of inbreeding in natural and captive populations of vertebrates:
implications for conservation. Perspectives in Biology and Medicine 36: 480-496.
Lacy RC. 2000. Considering threats to the viability of small populations using individual-
based models. Ecological Bulletins 48: 39-51.
Lacy RC, Miller PS, Traylor-Holzer K. 2015. Vortex 10 User’s Manual. 19 January 2015
update. IUCN SSC Conservation Breeding Specialist Group, and Chicago
Zoological Society, Apple Valley, Minnesota, USA.
Lacy RC, Pollack JP. 2014. Vortex: a stochastic simulation of the extinction process.
Version 10.0. Chicago Zoological Society, Brookfield, Illinois, USA.
Lacy RC, Ballou JD, Pollack JP. 2012. PMx: software package for demographic and
genetic analysis and management of pedigreed populations. Methods in Ecology
and Evolution 3:433-437.
Lande R. 1988. Genetics and demography in biological conservation. Science 241:
1455-1460.
Lee AM, Reid JM, Beissinger SR. 2017. Modelling effects of nonbreeders on population
growth estimates. Journal of Animal Ecology 86: 75-87.
Lees C, Wilcken J. 2009. Sustaining the Ark: the challenges faced by zoos in
maintaining viable populations. International Zoo Yearbook 43: 6-18.

157
Lethbridge MR, Strauss JC. 2015. A novel dispersal algorithm in individual-based,
spatially-explicit Population Viability Analysis: A new role for genetic measures in
model testing? Environmental Modelling and Software 68: 83-97.
Lynch M. 1991. The genetic interpretation of inbreeding depression and outbreeding
depression. Evolution 45: 622-629.
McGowan CP, Runge MC, Larson MA. 2011. Incorporating parametric uncertainty into
population viability analysis models. Biological Conservation 144: 1400-1408.
Menges ES, Dolan RW. 1998. Demographic viability of populations of Siene regia in
midwestern prairies: relationships with fire management, genetic variation,
geographic location, population size, and isolation. Journal of Ecology 86: 63-78.
Meretzsky VJ, Snyder NFR, Beissinger SR, Clendenen DA, Wiley JW. 2000.
Demography of the California condor: implications for reestablishment.
Conservation Biology 957-967.
Moore CT, Converse SJ, Folk MJ, Runge MC, Nesbitt SA. 2012. Evaluating release
alternatives for a long-lived bird species under uncertainty about long-term
demographic rates. Journal of Ornithology 152: S339-S353.
Mortensen JL, Reed JM. 2016. Population viability and vital rate sensitivity of an
endangered avian cooperative breeder, the white-breasted thrasher
(Ramphocinclus brachyurus). PLoS One 11: e0148928.
doi:10.1271/journal.pone.0148928.
Morton NE, Crow JF, Muller HJ. 1956. An estimate of the mutational damage in man
from data on consanguineous marriages. Proceedings of the National Academy
of Sciences 42: 855-863.

158
O'Grady JJ, Brook BW, Reed DH, Ballou JD, Tonkyn DW, Frankham R. 2006. Realistic
levels of inbreeding depression strongly affect extinction risk in wild populations.
Biological Conservation 133: 42-51.
Ostermann SD, Deforge JR, Edge D. 2001. Captive breeding and reintroduction
evaluation criteria: a case study of peninsular bighorn sheep. Conservation
Biology 15: 749-760.
Penn AM, Sherwin WB, Gordon G, Lunney D, Melzer A, Lacy RC. 2000. Demographic
forecasting in koala conservation. Conservation Biology 14: 629-638.
Ralls K, Ballou JD, Templeton A. 1988. Estimates of lethal equivalents and the cost of
inbreeding in mammals. Conservation Biology 2, 185-193.
Reed JM, Mills LS, Dunning Jr JB, Menges ES, McKelvey KS, Frye R, Beissinger SR,
Anstett M, Miller P. 2002. Emerging issues in population viability analysis.
Conservation Biology 16: 7-19.
Rodriguez-Clark KM, Sanchez-Mercado A. 2006. Population management of threatened
taxa in captivity within their natural ranges: Lessons from Andean bears
(Tremarctos ornatus) in Venezuela. Biological Conservation 129: 134-148.
Sӕther B, Bakke Ø. 2000. Avian life history variation and contribution of demographic
traits to the population growth rate. Ecology 81: 642-653.
Seddon PJ, Armstrong DP, Maloney RF. 2007. Developing the science of reintroduction
biology. Conservation Biology 21: 303-312.
Shaffer ML. 1981. Minimum population sizes for species conservation. BioScience 31:
131-134.

159
Sim IMW, Rebecca GW, Ludwig SC, Grant MC, Reid JM. 2011. Characterizing
demographic variation and contributions to population growth rate in a declining
population. Journal of Animal Ecology 80: 159-170.
Soulé ME, Wilcox BM. 1980. Conservation biology: an evolutionary-ecological
perspective. Sinauer: Sunderland MA.
Sukumar R, Krishnamurthy V, Wemmer C, Rodden M. 1997. Demography of captive
Asian elephants (Elephas maximus) in Southern India. Zoo Biology 263-272.
Wiese RJ. 2000. Asian elephants are not self-sustaining in North America. Zoo Biology
19: 299-309.
Zeoli LF, Sayler RD, Wielgus R. 2008. Population viability analysis for captive breeding
and reintroduction of the endangered Columbia basin pygmy rabbit. Animal
Conservation 11: 504-512.

160
CHAPTER SIX: CONCLUSION AND SIGNIFICANCE
Management of species in ex situ environments for conservation purposes,
including eventual reintroduction, should incorporate details of the species ecology,
especially its life history and demography as well as its genetic composition (Ballou et
al. 2010), which may require larger populations than has been suggested on genetic
grounds alone (Frankham et al. 2014, Lande 1988). The immediate practical need in
biological conservation for understanding the interaction of demographic and genetic
factors in the extinction of small populations, therefore, may provide a focus for
fundamental advances at the interface of ecology and evolution (Lande 1988). The
analyses and results presented in this dissertation demonstrate the testing and
improvement of tools related to genetic, demographic, and husbandry management of
ex situ breeding programs. The papers presented here should provide guidance for
more efficient and comprehensive ex situ breeding programs that, in turn, could be used
as the starting point of a reintroduction program or a conservation breeding program
with the goals to increase the probability of the long-term survival of the species
(Canessa et al. 2016, Tzika et al. 2009).
The genetic and demographic analyses of both the historic management of an ex
situ population, and its current status, are a first step in hypothesizing the potential
directions for future population management (Maunder and Byers 2005). In addition,
aspects of species biology including behavior, natural mating systems, evolutionary
perspectives such as adaptation to the ex situ environment, and management factors

161
should be incorporated into setting specific goals for a conservation breeding program
(Schulte-Hostedde and Mastromonaco 2015). Moreover, the testing of various
proposed management strategies should be utilized as a means further understand the
impacts that these strategies may have on the future trajectory of the population. In this
dissertation I demonstrated how molecular genetic data can be used to strengthen
pedigrees (Ferrie et al. 2013), as well as discuss the need for better understanding of
species biology, particularly in reproductive behaviors, and how this knowledge can be
translated to planning future reproduction in a species (Ferrie et al. 2013; and see
Chapters Three). I also determined that when evaluating genetic diversity at a molecular
level with single nucleotide polymorphisms, more diversity is being maintained than
projected through the theoretical methods of pedigree analysis currently used to
evaluate loss of genetic diversity in a population. Therefore, the strategy of prioritizing
breeding pairs with low and well-matched mean kinship is proving more successful than
predicted (see Chapter Four). Finally, I demonstrated through a population viability
analysis, the importance of specific biological and management factors in influencing a
population’s long term sustainability, and the impacts that these factors can have on
setting short and long term strategic goals for conserving, and potential reintroduction of
a population (see Chapter Five). There is a need to continue to build more advanced
population viability analyses which incorporate population genomics into new
approaches in order to better understand the influence of evolutionary processes on
population persistence (Pierson et al. 2014).
Zoological institutions and ex situ conservation breeding centers work
cooperatively, sharing best practices in animal husbandry, health and welfare,

162
population management, and broader conservation goals (Conway 2011, Lees and
Wilcken 2009). Analytical tools have been in place to inform ex situ population
management for quite some time; however as habitat continues to disappear and in situ
population sizes decline, there is an even greater need to develop an integrated
approach to population management for species conservation (Byers et al. 2013). Ex
situ populations can and do function as sources of genetic variation for reintroduction
programs, although typical recommendations include a meta-population management
approach where mutual and continuous gene flow between wild populations and the ex
situ population occurs to ensure long-term survival of the species (Ochoa et al. 2016).
However, as discussed for the Guam kingfisher, the species is extinct in the wild, so
genetic management for reintroduction becomes even more pertinent.
This dissertation has provided insight into some of the many factors important in
managing ex situ populations for conservation goals demonstrating the need for ever-
evolving tools to promote improved science in conservation breeding. In general, the
outcomes of these collective studies, and the methods used to achieve these outcomes,
should be incorporated broadly into many ex situ management programs. Finally, as the
need for more intensely managed wild populations develops, and the continuum that
bridges ex situ to in situ population management becomes more evident (Byers et al.
2013), the application of new and scientifically sound management strategies to inform
conservation becomes paramount.

163
References
Ballou JD, Lees C, Faust LJ, Long S, Lynch C, Bingaman Lackey L, Foose TJ. 2010.
Demographic and genetic management of captive populations. In: Wild Mammals
in Captivity: Principles and Techniques for Zoo Management. Pp. 219.
Byers O, Lees C, Wilcken J, Schwitzer C. 2013. The One Plan Approach: The
philosophy and implementation of CBSG’s approach to integrated species
conservation planning. WAZA Magazine 14: 2-5.
Canessa S, Converse SJ, West M, Clemann N, Gillespie G, McFadden M, Silla AJ,
Parris KM, McCarthy MA. 2016. Planning for ex situ conservation in the face of
uncertainty. Conservation Biology 30: 599-609.
Conway WG. 2011. Buying time for wild animals with zoos. Zoo Biology 30: 1-8.
Ferrie GM, Cohen OR, Schutz P, Leighty KA, Plasse C, Bettinger TL, Hoffman EA.
2013. Identifying parentage using molecular markers: improving accuracy of
studbook records for a captive flock of marabou storks (Leptoptilus
crumeniferus). Zoo Biology 32: 556-564.
Frankham R, Bradshaw CJA, Brook BW. 2014. Genetics in conservation management:
Revised recommendations for the 50/500 rules, Red List criteria and population
viability analysis. Biological Conservation 170: 56-63.
Lande R. 1988. Genetics and demography in biological conservation. Science 241:
1455-60.
Lees CM, Wilcken J. 2009. Sustaining the Ark: the challenges faced by zoos in
maintaining viable populations. International Zoo Yearkbook 43: 6-18.

164
Maunder M, Byers O. 2005. The IUCN technical guidelines on the management of ex
situ populations for conservation: reflecting major changes in the application of
ex situ conservation. Oryx 39: 95-98.
Ochoa A, Wells SA, West G, Al-Smadi M, Redondo SA, Sexton SR, Culver M. 2016.
Can captive populations function as sources of genetic variation for
reintroductions into the wild? A case study of the Arabian oryx from the Phoenix
Zoo and th Shaumari Wildlife Reserve, Jordan. Conservation Genetics 17: 1145-
1155.
Pierson JC, Beissinger SR, Bragg JG, Coates DJ, Oostermeijer JGB, Sunnucks P,
Schumaker NH, Trotter MV, Young AG. 2014. Incorporating evolutionary
processes into population viability models. Conservation Biology 29: 755-764.
Schulte-Hostedde AI, Mastromonaco GF. 2015. Integrating evolution in the
management of captive zoo populations. Evolutionary Applications 8: 413-422.
Tzika AC, Remy C, Gibson R, Milinkovitch MC. 2009. Molecular genetic analysis of a
captive-breeding program: the vulnerable endemic Jamaican yellow boa.
Conservation Genetics 10: 69-77.
Haig SM, Ballou JD, Derrickson SR. 1990. Management options for preserving genetic
diversity: reintroduction of Guam rails to the wild. Conservation Biology 4(3): 290-
300.
Zhang B, Fang SG, Xi YM. 2006. Major histocompatibility complex variation in the
endangered crested ibis (Nipponia nippon) and implications for reintroduction.
Biochemical Genetics 44: 113-123.

165
APPENDIX A: CHAPTER TWO LICENSE TERMS AND CONDITIONS

166
This Agreement between Gina M Ferrie ("You") and John Wiley and Sons ("John
Wiley and Sons") consists of your license details and the terms and conditions
provided by John Wiley and Sons and Copyright Clearance Center.
License Number 4057941216147
License date
Licensed Content Publisher John Wiley and Sons
Licensed Content Publication Zoo Biology
Licensed Content Title Identifying parentage using molecular markers: Improving accuracy of studbook records for a captive flock of marabou storks (Leptoptilus crumeniferus)
Licensed Content Author Gina M. Ferrie,Ocean R. Cohen,Paul Schutz,Katherine A. Leighty,Chelle Plasse,Tammie L. Bettinger,Eric A. Hoffman
Licensed Content Date Aug 19, 2013
Licensed Content Pages 9
Type of use Dissertation/Thesis
Requestor type Author of this Wiley article
Format Print and electronic
Portion Full article
Will you be translating? No
Title of your thesis / dissertation USING MOLECULAR GENETIC AND DEMOGRAPHIC TOOLS TO IMPROVE MANAGEMENT OF EX SITU AVIAN POPULATIONS
Expected completion date Apr 2017
Expected size (number of pages)
250
Requestor Location Gina M Ferrie 1701 Garvin St ORLANDO, FL 32803 United States Attn: Gina M Ferrie
Publisher Tax ID EU826007151
Billing Type Invoice
Billing Address Gina M Ferrie 1701 Garvin St ORLANDO, FL 32803 United States Attn: Gina M Ferrie
Total 0.00 USD

167
Terms and Conditions
TERMS AND CONDITIONS This copyrighted material is owned by or exclusively licensed to John Wiley & Sons, Inc. or one of its group companies (each a"Wiley Company") or handled on behalf of a society with which a Wiley Company has exclusive publishing rights in relation to a particular work (collectively "WILEY"). By clicking "accept" in connection with completing this licensing transaction, you agree that the following terms and conditions apply to this transaction (along with the billing and payment terms and conditions established by the Copyright Clearance Center Inc., ("CCC's Billing and Payment terms and conditions"), at the time that you opened your RightsLink account (these are available at any time at http://myaccount.copyright.com).
Terms and Conditions
The materials you have requested permission to reproduce or reuse (the "Wiley Materials") are protected by copyright.
You are hereby granted a personal, non-exclusive, non-sub licensable (on a stand-alone basis), non-transferable, worldwide, limited license to reproduce the Wiley Materials for the purpose specified in the licensing process. This license, and any CONTENT (PDF or image file) purchased as part of your order, is for a one-time use only and limited to any maximum distribution number specified in the license. The first instance of republication or reuse granted by this license must be completed within two years of the date of the grant of this license (although copies prepared before the end date may be distributed thereafter). The Wiley Materials shall not be used in any other manner or for any other purpose, beyond what is granted in the license. Permission is granted subject to an appropriate acknowledgement given to the author, title of the material/book/journal and the publisher. You shall also duplicate the copyright notice that appears in the Wiley publication in your use of the Wiley Material. Permission is also granted on the understanding that nowhere in the text is a previously published source acknowledged for all or part of this Wiley Material. Any third party content is expressly excluded from this permission.
With respect to the Wiley Materials, all rights are reserved. Except as expressly granted by the terms of the license, no part of the Wiley Materials may be copied, modified, adapted (except for minor reformatting required by the new Publication), translated, reproduced, transferred or distributed, in any form or by any means, and no derivative works may be made based on the Wiley Materials without the prior permission of the respective copyright owner.For STM Signatory Publishers clearing permission

168
under the terms of the STM Permissions Guidelines only, the terms of the license are extended to include subsequent editions and for editions in other languages, provided such editions are for the work as a whole in situ and does not involve the separate exploitation of the permitted figures or extracts, You may not alter, remove or suppress in any manner any copyright, trademark or other notices displayed by the Wiley Materials. You may not license, rent, sell, loan, lease, pledge, offer as security, transfer or assign the Wiley Materials on a stand-alone basis, or any of the rights granted to you hereunder to any other person.
The Wiley Materials and all of the intellectual property rights therein shall at all times remain the exclusive property of John Wiley & Sons Inc, the Wiley Companies, or their respective licensors, and your interest therein is only that of having possession of and the right to reproduce the Wiley Materials pursuant to Section 2 herein during the continuance of this Agreement. You agree that you own no right, title or interest in or to the Wiley Materials or any of the intellectual property rights therein. You shall have no rights hereunder other than the license as provided for above in Section 2. No right, license or interest to any trademark, trade name, service mark or other branding ("Marks") of WILEY or its licensors is granted hereunder, and you agree that you shall not assert any such right, license or interest with respect thereto
NEITHER WILEY NOR ITS LICENSORS MAKES ANY WARRANTY OR REPRESENTATION OF ANY KIND TO YOU OR ANY THIRD PARTY, EXPRESS, IMPLIED OR STATUTORY, WITH RESPECT TO THE MATERIALS OR THE ACCURACY OF ANY INFORMATION CONTAINED IN THE MATERIALS, INCLUDING, WITHOUT LIMITATION, ANY IMPLIED WARRANTY OF MERCHANTABILITY, ACCURACY, SATISFACTORY QUALITY, FITNESS FOR A PARTICULAR PURPOSE, USABILITY, INTEGRATION OR NON-INFRINGEMENT AND ALL SUCH WARRANTIES ARE HEREBY EXCLUDED BY WILEY AND ITS LICENSORS AND WAIVED BY YOU.
WILEY shall have the right to terminate this Agreement immediately upon breach of this Agreement by you.
You shall indemnify, defend and hold harmless WILEY, its Licensors and their respective directors, officers, agents and employees, from and against any actual or threatened claims, demands, causes of action or proceedings arising from any breach of this Agreement by you.
IN NO EVENT SHALL WILEY OR ITS LICENSORS BE LIABLE TO YOU OR ANY OTHER PARTY OR ANY OTHER PERSON OR ENTITY FOR ANY SPECIAL, CONSEQUENTIAL, INCIDENTAL, INDIRECT, EXEMPLARY OR PUNITIVE DAMAGES, HOWEVER CAUSED, ARISING OUT OF OR IN CONNECTION WITH THE DOWNLOADING, PROVISIONING, VIEWING OR USE OF THE MATERIALS REGARDLESS OF THE FORM OF ACTION, WHETHER FOR BREACH OF CONTRACT, BREACH OF WARRANTY, TORT, NEGLIGENCE, INFRINGEMENT OR

169
OTHERWISE (INCLUDING, WITHOUT LIMITATION, DAMAGES BASED ON LOSS OF PROFITS, DATA, FILES, USE, BUSINESS OPPORTUNITY OR CLAIMS OF THIRD PARTIES), AND WHETHER OR NOT THE PARTY HAS BEEN ADVISED OF THE POSSIBILITY OF SUCH DAMAGES. THIS LIMITATION SHALL APPLY NOTWITHSTANDING ANY FAILURE OF ESSENTIAL PURPOSE OF ANY LIMITED REMEDY PROVIDED HEREIN.
Should any provision of this Agreement be held by a court of competent jurisdiction to be illegal, invalid, or unenforceable, that provision shall be deemed amended to achieve as nearly as possible the same economic effect as the original provision, and the legality, validity and enforceability of the remaining provisions of this Agreement shall not be affected or impaired thereby.
The failure of either party to enforce any term or condition of this Agreement shall not constitute a waiver of either party's right to enforce each and every term and condition of this Agreement. No breach under this agreement shall be deemed waived or excused by either party unless such waiver or consent is in writing signed by the party granting such waiver or consent. The waiver by or consent of a party to a breach of any provision of this Agreement shall not operate or be construed as a waiver of or consent to any other or subsequent breach by such other party.
This Agreement may not be assigned (including by operation of law or otherwise) by you without WILEY's prior written consent.
Any fee required for this permission shall be non-refundable after thirty (30) days from receipt by the CCC.
These terms and conditions together with CCC's Billing and Payment terms and conditions (which are incorporated herein) form the entire agreement between you and WILEY concerning this licensing transaction and (in the absence of fraud) supersedes all prior agreements and representations of the parties, oral or written. This Agreement may not be amended except in writing signed by both parties. This Agreement shall be binding upon and inure to the benefit of the parties' successors, legal representatives, and authorized assigns.
In the event of any conflict between your obligations established by these terms and conditions and those established by CCC's Billing and Payment terms and conditions, these terms and conditions shall prevail.
WILEY expressly reserves all rights not specifically granted in the combination of (i) the license details provided by you and accepted in the course of this licensing transaction, (ii) these terms and conditions and (iii) CCC's Billing and Payment terms and conditions.
This Agreement will be void if the Type of Use, Format, Circulation, or Requestor Type was misrepresented during the licensing process.
This Agreement shall be governed by and construed in accordance with the laws of the State of New York, USA, without regards to such state's conflict of law rules. Any legal action, suit or proceeding arising out of or relating to

170
these Terms and Conditions or the breach thereof shall be instituted in a court of competent jurisdiction in New York County in the State of New York in the United States of America and each party hereby consents and submits to the personal jurisdiction of such court, waives any objection to venue in such court and consents to service of process by registered or certified mail, return receipt requested, at the last known address of such party.
WILEY OPEN ACCESS TERMS AND CONDITIONS Wiley Publishes Open Access Articles in fully Open Access Journals and in Subscription journals offering Online Open. Although most of the fully Open Access journals publish open access articles under the terms of the Creative Commons Attribution (CC BY) License only, the subscription journals and a few of the Open Access Journals offer a choice of Creative Commons Licenses. The license type is clearly identified on the article. The Creative Commons Attribution License The Creative Commons Attribution License (CC-BY) allows users to copy, distribute and transmit an article, adapt the article and make commercial use of the article. The CC-BY license permits commercial and non- Creative Commons Attribution Non-Commercial License The Creative Commons Attribution Non-Commercial (CC-BY-NC)License permits use, distribution and reproduction in any medium, provided the original work is properly cited and is not used for commercial purposes.(see below) Creative Commons Attribution-Non-Commercial-NoDerivs License The Creative Commons Attribution Non-Commercial-NoDerivs License (CC-BY-NC-ND) permits use, distribution and reproduction in any medium, provided the original work is properly cited, is not used for commercial purposes and no modifications or adaptations are made. (see below) Use by commercial "for-profit" organizations Use of Wiley Open Access articles for commercial, promotional, or marketing purposes requires further explicit permission from Wiley and will be subject to a fee. Further details can be found on Wiley Online Library http://olabout.wiley.com/WileyCDA/Section/id-410895.html
Other Terms and Conditions:

171
v1.10 Last updated September 2015
Questions? [email protected] or +1-855-239-3415 (toll free in the US) or +1-978-646-2777.

172
APPENDIX B: CHAPTER THREE SUPPORTING INFORMATION

173
Supporting Information – Expanded Methods and Results for Molecular Data Collection
and Parentage Analysis
Genetic Data Collection
To isolate species-specific microsatellite loci for genetic analyses, we generated
random DNA fragments (~200-2500 bp) using degenerate oligonucleotide-primed
polymerase chain reaction (DOP-PCR), using the K6-MW primer and protocol (Macas
et al. 1996; Degner et al. 2009). Microsatellite enrichment of the PCR-amplified
genomic fragments employed a 3’-biotinylated (GATA)8 repeat motif bound to
streptavidin-coated particles (Promega Corporation, Madison, Wisconsin, USA)
enriched via magnetic separation. Enriched DOP-PCR products were made double
stranded by a subsequent DOP-PCR and cloned using TOPO TA cloning kit (Invitrogen,
Carlsbad, California, USA). Clones positive for (CA)n or (GATA)n microsatellites were
identified using the screening procedure of Cabe and Marshall (2001). In brief, we
conducted two PCRs per colony: one PCR included T3 and T7 primers while the
second included the (GATA)8 primer in addition to the T3 and T7 primers. We
visualized the product of the PCR reactions on a 2.0% agarose gel and positive clones
(those containing microsatellites) were identified by a distinctive smear in the (GATA)8
reaction. We then sequenced positive clones (Applied Biosystems 3730 DNA Analyzer,
Applied Biosystems, Life Technologies Corporation, Carlsbad, California, USA) and

174
developed PCR primers from flanking regions of DNA surrounding the microsatellite
repeats. In total, we developed microsatellite primer sets for eight loci.
PCRs for all loci were performed in 20 µL reactions containing 1 μL of template
DNA diluted to 20 ng μL-1, 2 μL of 10X PCR buffer, 1.25 μL of 25 mM of MgCl2, 200 μM
of each dNTP, 0.5 μL of 10 μM M13 labeled (Schuelke 2000) forward primer and 1 μL of
10 μM reverse primer, 1 μL of 10 μM fluorescently-labeled M13 primer, 0.2 μL dimethyl
sulfoxide, and 1 unit of Taq polymerase. The fluorescently labeled dyes were ABI DS-30
dye set (6-FAM, HEX, NED; Applied Biosystems, Life Technologies Corporation,
Carlsbad, California, USA). PCRs were performed using a BioRad MyCycler
thermalcycler (Bio-Rad Laboratories, Hercules, California, USA). The initial denaturing
step was 94 °C for 4 minutes, followed by 35 cycles of 30 seconds at 94 °C, 30-35
seconds at the annealing temperature, and 45 seconds at 72 °C, then a final extension
cycle at 72 °C for 7 minutes, and a hold at 4 °C. Annealing temperatures for all loci are
listed in Table 3. PCR products were visualized on a 2% agarose gel before genotyping.
PCR products were sized using an ABI PRISM® 3730 DNA Analyzer (Applied
Biosystems, Life Technologies Corporation, Carlsbad, California, USA) in 5 μL multi-
plexed reactions at the University of Arizona Genetics Core (Tucson, Arizona, USA).
Alleles were sized with respect to size standard ROX (DS-30, Applied Biosystems, Life
Technologies Corporation, Carlsbad, California, USA) using the Peak-Scanner Software
(v1.0, Applied Biosystems, Life Technologies Corporation, Carlsbad, California, USA).
Allele sizes were checked for accuracy by double-genotyping some individuals at each
locus.

175
Parentage and Relatedness Analysis
Using CERVUS, which uses a pair-wise likelihood comparison based approach
to assign parentage, we first ran an allele frequency analysis on the eight polymorphic
loci discussed above, which we used to calculate multilocus parental exclusion
probabilities (Selvin 1980). We then ran a parentage analysis simulation of the parent
pair with known sexes, including the a priori probabilities of sampling of candidate
parents shown in the main text. This simulation calculates the critical delta of each
assignment, which is a derivative of the likelihood score used in parentage analysis and
provides a threshold for assigning varying levels of confidence in the parentage analysis
(Kalinowski et al. 2007). Finally, we conducted a parentage analysis of the parent pair
with known sexes including a list of candidate sires and dams for each offspring. To be
included in analysis, the minimum number of loci typed per individual was four. This
analysis assigns the most likely candidate parent pair using the likelihood score, and the
predetermined confidence levels of 95% and 80%.
We also used COLONY (v2.0; Jones and Wang 2009), which implements a full-
pedigree maximum likelihood method to assign parentage and sib-ship among
individuals with multi-locus genotypes, to run a parentage analysis and examine family
relationships. For the COLONY analysis, we chose a polygamous mating system which
assumes no inbreeding and allows for maternal-only and paternal-only sib-ships (half-
sibs). We ran a full likelihood analysis with a long run length, which considers more
configurations in the simulated annealing process (Jones and Wang 2009) and no sib-
ship prior. We input the eight microsatellite marker types, and included an error rate of

176
0.02 (Wang 2004). The genotypes of the 50 offspring, 11 candidate sires, and 10
candidate dams were input as separate files. In both programs, parentage is assigned
with confidence levels of 95% and 80% confidence.
The program Coancestry (Wang 2011) implements 7 different methods to
estimate pair-wise relatedness between individuals and allows for comparison between
estimators using simulated data with predefined relationships. We first conducted an
analysis using simulated genotypes with the observed allele frequencies at each locus,
the proportion of genotypes missing at each locus, and the genotyping error rate of 0.02
(Wang 2004) to calculate correlation coefficients between estimated and true simulated
relatedness values. One hundred dyads each of six known relationships (parent-
offspring, full-sibs, half-sibs, first cousins, second cousins, and unrelated) were
simulated with genotyping errors accounted for in the likelihood calculations. Ninety-five
percent confidence intervals (CIs) were calculated with 1000 bootstraps. To determine
which method of calculating relatedness was most representative of our data, we tested
correlations between the relatedness values of simulated and known relationships in
JMP Pro 9.0.0 (2010 SAS Institute, Cary, North Carolina, USA). To obtain relatedness
estimates between individuals in our colony, we then conducted an analysis of the
empirical data with observed allele frequencies. We included 100 reference individuals
used in the triadic likelihood methods and 1000 bootstrapping samples to calculate 95%
CIs. Finally, we accounted for potential error in genotyping with the error rate of 0.02 at
all loci (Wang 2004).
Based on the comparisons in Coancestry between simulated genotypes and
relatedness values between known relationships, the TrioML method of calculating

177
relatedness (Wang 2007) yielded the highest correlation between genetic (simulated)
and true estimates (r = 0.76, p < 0.001) and also had the lowest variance (0.03) of the
seven methods. When the dataset contains relatively unrelated individuals, the triadic
likelihood method of calculating relatedness best accounts for genotype error in the data
(Wang 2007) and gives the most prudent method of inferring relationships between
pairs of individuals (Doutrelant et al. 2011).

178
Results
Table 13. Results of behavioral observation determining the social parents in each nest tunnel, as well as results of visual comparisons of the number of loci that are mismatched between the offspring genotypes and their social sire and dam, as well as COLONY and CERVUS parentage assignment tests. UNK refers to unknown social sire or dam. ** strict confidence, >95% assignment probability, *relaxed confidence, >80% assignment probability, no * low confidence, <80% assignment probability, ǂ indicates individual was missing a genotype at one or two loci.
Egg/Chick ID Nest Tunnel Year Social Sire Genetic Sire Social Dam Genetic Dam
Visual Comparison # Loci Mismatched
COLONY CERVUS Visual Comparison # Loci Mismatched
COLONY CERVUS
M. nub10 15 2005 010555 N/A M. nub7 M. nub9 0 M. nub9** M. nub9** M. nub2 9 2006 010555 N/A M. nub7 M. nub9 0 M. nub9 M. nub9* M. nub12 14 2006 010554 N/A M. nub7 010561 N/A M. nub11 M. nub10* M. nub16 9 2009 M. nub4 0 M. nub4** M. nub4** M. nub12 0 M. nub12** M. nub12** M. nub14 10 2009 M. nub2 2 M. nub7** M. nub7* 070304 N/A M. nub10 M. nub10* M. nub15 10 2009 M. nub2 0 M. nub2** M. nub2** 070304 N/A M. nub8 M. nub17 10 2009 M. nub2 0 M. nub2 M. nub2* 070304 N/A M. nub11** M. nub11* M. nub6 12 2009 M. nub1 0 M. nub1** M. nub1** M. nub9 0 M. nub9** M. nub10 M. nub19 9 2010 UNK N/A M. nub6** M. nub6* UNK N/A M. nub10** M. nub10* M. nub20 9 2010 UNK N/A M. nub1** M. nub6* UNK N/A M. nub9** M. nub10 M. nub26 9 2010 UNK N/A M. nub1** M. nub6* UNK N/A M. nub9** M. nub10 M. nub27 9 2010 UNK N/A M. nub6** M. nub6* UNK N/A M. nub10** M. nub10** M. nub57 10 2010 UNK N/A M. nub4** M. nub4** UNK N/A M. nub11** M. nub12 M. nub58 10 2010 UNK N/A M. nub2 M. nub2 UNK N/A M. nub13** M. nub13** M. nub60 10 2010 UNK N/A M. nub4** M. nub4* UNK N/A M. nub11** M. nub11* M. nub18 12 2010 UNK N/A M. nub7* UNK N/A M. nub11* M. nub12* M. nub24 12 2010 UNK N/A M. nub6** M. nub6** UNK N/A M. nub10** M. nub10* M. nub30 12 2010 UNK N/A M. nub5 UNK N/A M. nub9** M. nub59 12 2010 UNK N/A M. nub6** M. nub6* UNK N/A M. nub10** M. nub10 M. nub22 14 2010 UNK N/A M. nub6** M. nub6* UNK N/A M. nub10 M. nub10* M. nub47 14 2010 UNK N/A M. nub2* M. nub2** UNK N/A M. nub13** M. nub15** M. nub61 14 2010 UNK N/A M. nub2** M. nub2** UNK N/A M. nub13** M. nub13** M. nub21 15 2010 UNK N/A M. nub7** M. nub7** UNK N/A M. nub10 M. nub10* M. nub28 15 2010 UNK N/A M. nub7** M. nub7* UNK N/A M. nub10 M. nub10*
M. nub23 17 2010 UNK N/A M. nub3** M. nub2** UNK N/A M. nub15** M. nub15** M. nub29 17 2010 UNK N/A M. nub5** M. nub2 UNK N/A M. nub15** M. nub15** M. nub25 19 2010 UNK N/A M. nub3** M. nub3** UNK N/A M. nub15** M. nub15** M. nub31 19 2010 UNK N/A M. nub4** M. nub4** UNK N/A M. nub12 M. nub12* M. nub32 4 2011 M. nub4 1 M. nub4 M. nub4 M. nub11 1 M. nub11 M. nub11 M. nub34 8 2011 M. nub6 0 M. nub6* M. nub6 M. nub10 0 M. nub10* M. nub59** ǂM. nub37 8 2011 M. nub6 0 M. nub6** M. nub6* M. nub10 0 M. nub10** M. nub10** M. nub43 8 2011 M. nub6 0 M. nub6 M. nub6* M. nub10 0 M. nub10 M. nub10* ǂM. nub50 8 2011 M. nub6 5 M. nub4** M. nub4* M. nub10 2 M. nub11** M. nub11* M. nub33 9 2011 M. nub1 1 M. nub1** M. nub1** M. nub9 0 M. nub9** M. nub59** M. nub36 9 2011 M. nub1 1 M. nub1** M. nub6* M. nub9 0 M. nub9** M. nub9*
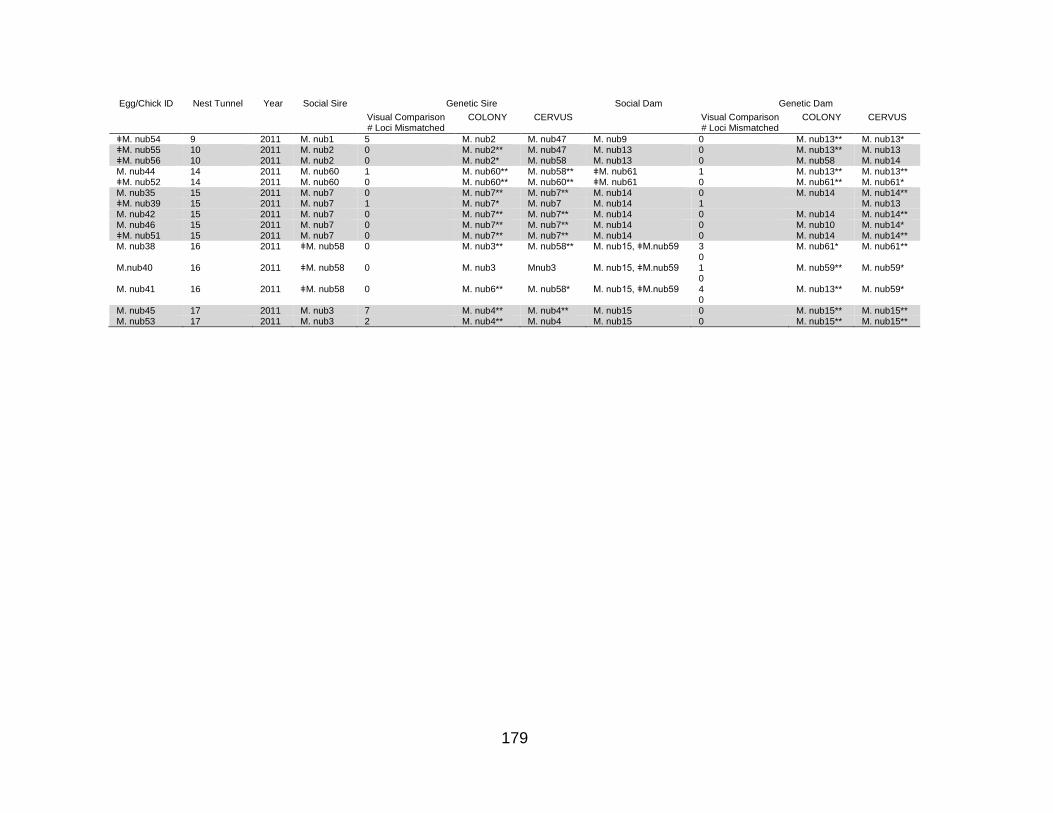
179
Egg/Chick ID Nest Tunnel Year Social Sire Genetic Sire Social Dam Genetic Dam
Visual Comparison # Loci Mismatched
COLONY CERVUS Visual Comparison # Loci Mismatched
COLONY CERVUS
ǂM. nub54 9 2011 M. nub1 5 M. nub2 M. nub47 M. nub9 0 M. nub13** M. nub13* ǂM. nub55 10 2011 M. nub2 0 M. nub2** M. nub47 M. nub13 0 M. nub13** M. nub13 ǂM. nub56 10 2011 M. nub2 0 M. nub2* M. nub58 M. nub13 0 M. nub58 M. nub14 M. nub44 14 2011 M. nub60 1 M. nub60** M. nub58** ǂM. nub61 1 M. nub13** M. nub13** ǂM. nub52 14 2011 M. nub60 0 M. nub60** M. nub60** ǂM. nub61 0 M. nub61** M. nub61* M. nub35 15 2011 M. nub7 0 M. nub7** M. nub7** M. nub14 0 M. nub14 M. nub14** ǂM. nub39 15 2011 M. nub7 1 M. nub7* M. nub7 M. nub14 1 M. nub13 M. nub42 15 2011 M. nub7 0 M. nub7** M. nub7** M. nub14 0 M. nub14 M. nub14** M. nub46 15 2011 M. nub7 0 M. nub7** M. nub7** M. nub14 0 M. nub10 M. nub14* ǂM. nub51 15 2011 M. nub7 0 M. nub7** M. nub7** M. nub14 0 M. nub14 M. nub14** M. nub38 16 2011 ǂM. nub58 0 M. nub3** M. nub58** M. nub15, ǂM.nub59 3
0 M. nub61* M. nub61**
M.nub40 16 2011 ǂM. nub58 0 M. nub3 Mnub3 M. nub15, ǂM.nub59 1 0
M. nub59** M. nub59*
M. nub41 16 2011 ǂM. nub58 0 M. nub6** M. nub58* M. nub15, ǂM.nub59 4 0
M. nub13** M. nub59*
M. nub45 17 2011 M. nub3 7 M. nub4** M. nub4** M. nub15 0 M. nub15** M. nub15** M. nub53 17 2011 M. nub3 2 M. nub4** M. nub4 M. nub15 0 M. nub15** M. nub15**

180
References
Cabe P.R., Marshall K.E. (2001) Microsatellite loci from the house wren (Troglodytes
aedon). Mol Ecol Notes 1: 155-156.
Degner J.F., Hether T.D., Hoffman E.A. (2009) Eight novel tetranucleotide and five
cross-species dinucleotide microsatellite loci for the ornate chorus frog
(Pseudacris ornata). Mol Ecol Resour 9: 622-624.
Doutrelant C., Dalecky A., Covas, R. (2011) Age and relatedness have an interactive
effect on the feeding behavior of helpers in cooperatively breeding sociable
weavers. Behaviour 148: 1399-1417.
Macas J., Gualberti G., Nouzova M., Samec P., Lucretti S., Dolezel J. (1996)
Construction of chromosome-specific DNA libraries covering the whole genome
of field bean (Vicia faba L). Chromosome Res 4: 531-539.
Schuelke M. (2000) An economic method for the fluorescent labeling of PCR fragments:
A poor man’s approach to genotyping for research and high-throughput
diagnostics. Nat Biotechnol 18: 233-234.
Selvin S. (1980) Probability of nonpaternity determined by multiple allele codominant
systems. Am J Hum Genet 32: 276-278.
Wang J. (2004) Sibship reconstruction from genetic data with typing errors. Genetics
166: 1963-1979.
Wang J. (2007) Triadic IBD coefficients and applications to estimating pairwise
relatedness. Genet Res 89: 135-153.

181
Wang J. (2011) Coancestry: a program for simulating, estimating and analyzing
relatedness and inbreeding coefficients. Mol Ecol Resour 11: 141-145.

182
APPENDIX C: GUAM KINGFISHER GENETIC SAMPLING INFORMATION
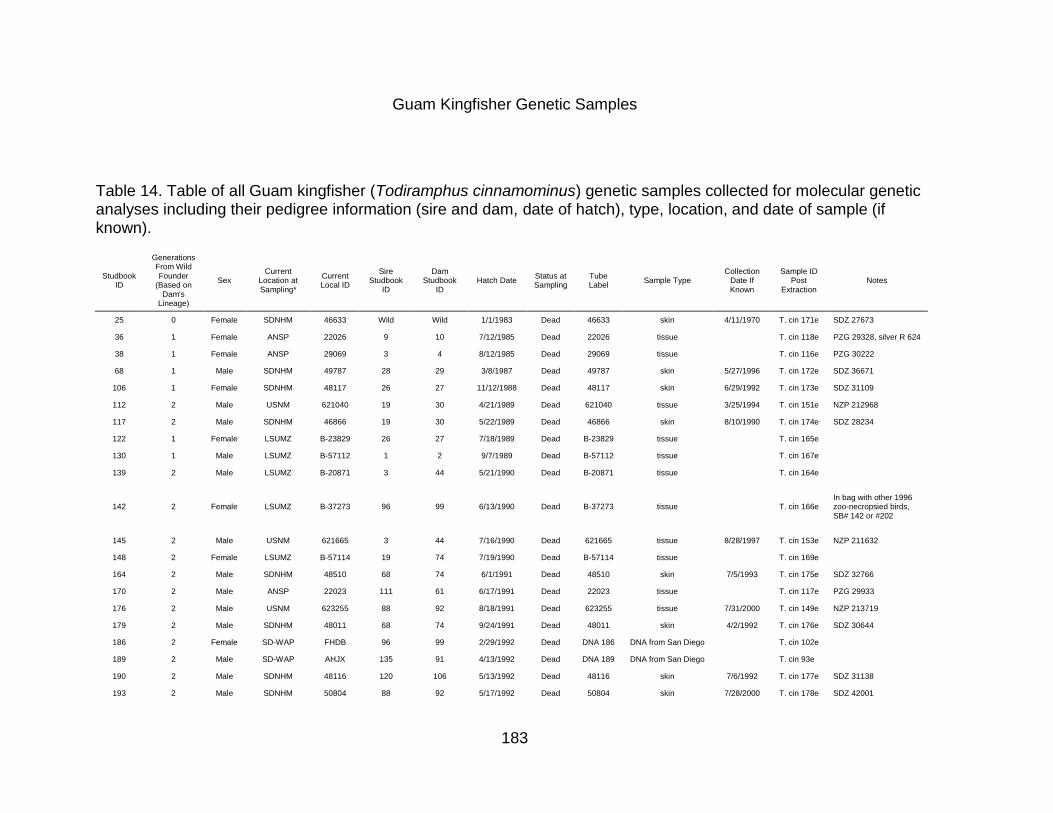
183
Guam Kingfisher Genetic Samples
Table 14. Table of all Guam kingfisher (Todiramphus cinnamominus) genetic samples collected for molecular genetic analyses including their pedigree information (sire and dam, date of hatch), type, location, and date of sample (if known).
Studbook ID
Generations From Wild Founder
(Based on Dam's
Lineage)
Sex Current
Location at Sampling*
Current Local ID
Sire Studbook
ID
Dam Studbook
ID Hatch Date
Status at Sampling
Tube Label
Sample Type Collection
Date If Known
Sample ID Post
Extraction Notes
25 0 Female SDNHM 46633 Wild Wild 1/1/1983 Dead 46633 skin 4/11/1970 T. cin 171e SDZ 27673
36 1 Female ANSP 22026 9 10 7/12/1985 Dead 22026 tissue
T. cin 118e PZG 29328, silver R 624
38 1 Female ANSP 29069 3 4 8/12/1985 Dead 29069 tissue
T. cin 116e PZG 30222
68 1 Male SDNHM 49787 28 29 3/8/1987 Dead 49787 skin 5/27/1996 T. cin 172e SDZ 36671
106 1 Female SDNHM 48117 26 27 11/12/1988 Dead 48117 skin 6/29/1992 T. cin 173e SDZ 31109
112 2 Male USNM 621040 19 30 4/21/1989 Dead 621040 tissue 3/25/1994 T. cin 151e NZP 212968
117 2 Male SDNHM 46866 19 30 5/22/1989 Dead 46866 skin 8/10/1990 T. cin 174e SDZ 28234
122 1 Female LSUMZ B-23829 26 27 7/18/1989 Dead B-23829 tissue
T. cin 165e
130 1 Male LSUMZ B-57112 1 2 9/7/1989 Dead B-57112 tissue
T. cin 167e
139 2 Male LSUMZ B-20871 3 44 5/21/1990 Dead B-20871 tissue
T. cin 164e
142 2 Female LSUMZ B-37273 96 99 6/13/1990 Dead B-37273 tissue
T. cin 166e In bag with other 1996 zoo-necropsied birds, SB# 142 or #202
145 2 Male USNM 621665 3 44 7/16/1990 Dead 621665 tissue 8/28/1997 T. cin 153e NZP 211632
148 2 Female LSUMZ B-57114 19 74 7/19/1990 Dead B-57114 tissue
T. cin 169e
164 2 Male SDNHM 48510 68 74 6/1/1991 Dead 48510 skin 7/5/1993 T. cin 175e SDZ 32766
170 2 Male ANSP 22023 111 61 6/17/1991 Dead 22023 tissue
T. cin 117e PZG 29933
176 2 Male USNM 623255 88 92 8/18/1991 Dead 623255 tissue 7/31/2000 T. cin 149e NZP 213719
179 2 Male SDNHM 48011 68 74 9/24/1991 Dead 48011 skin 4/2/1992 T. cin 176e SDZ 30644
186 2 Female SD-WAP FHDB 96 99 2/29/1992 Dead DNA 186 DNA from San Diego
T. cin 102e
189 2 Male SD-WAP AHJX 135 91 4/13/1992 Dead DNA 189 DNA from San Diego
T. cin 93e
190 2 Male SDNHM 48116 120 106 5/13/1992 Dead 48116 skin 7/6/1992 T. cin 177e SDZ 31138
193 2 Male SDNHM 50804 88 92 5/17/1992 Dead 50804 skin 7/28/2000 T. cin 178e SDZ 42001

184
Studbook ID
Generations From Wild Founder
(Based on Dam's
Lineage)
Sex Current
Location at Sampling*
Current Local ID
Sire Studbook
ID
Dam Studbook
ID Hatch Date
Status at Sampling
Tube Label
Sample Type Collection
Date If Known
Sample ID Post
Extraction Notes
199 2 Female SANDIEGOZ NHXX 135 91 4/5/1993 Dead DNA 199 DNA from San Diego
T. cin 103e
201 3 Female USNM 587855 131 137 5/25/1993 Dead 587855 tissue 5/26/1994 T. cin 161e Phoenix 6993
205 3 Male SANDIEGOZ 305520 131 137 6/26/1993 Dead OR5700 tissue 12/1/2014 T. cin 127e
206 3 Male DISNEY AK NHXX 131 137 6/27/1993 Dead tissue 206
tissue
T. cin 108e
209 2 Female USNM 623227 88 92 7/31/1993 Dead 623227 tissue 5/2/2001 T. cin 155e NZP 213724
216 2 Male DISNEY AK 80107 24 99 5/31/1994 Living None feathers, filter paper 12/14/2012 T. cin 129e
225 2 Male AGANA 301 135 91 8/5/1994 Living 9 blood
T. cin 9e
246 2 Male USNM 623242 135 91 7/2/1995 Dead 623242 tissue 5/26/2000 T. cin 159e NZP 214152
259 3 Male DISNEY AK 110190 68 186 5/4/1996 Living None feathers, filter paper 12/14/2012 T. cin 130e
261 2 Male ST LOUIS 991873 24 99 5/12/1996 Living 50 blood
T. cin 36e
263 2 Male DISNEY AK FHAB 24 99 6/30/1996 Dead tissue 263
tissue
T. cin 109e
330 3 Male SD-WAP 497202 178 199 12/13/1997 Living 330 feathers in bags
T. cin 143e
331 3 Female USNM 638592 178 199 1/9/1998 Dead 638592 tissue 11/14/2007 T. cin 163e NZP 215616
342 3 Male USNM 631753 189 209 7/3/1998 Dead 631753 tissue 8/15/2002 T. cin 156e NZP 214083
343 3 Female SD-WAP CHXX 135 186 7/30/1998 Dead DNA 343 DNA from San Diego
T. cin 105e
344 3 Male USNM 646629 135 186 8/1/1998 Dead 646629 tissue 3/6/2010 T. cin 152e NZP 215769
352 3 Female DISNEY AK NHXX 189 209 1/31/1999 Dead tissue 352
tissue
T. cin 111e
369 4 Male USNM 631786 178 327 4/3/2000 Dead 631786 tissue 1/29/2002 T. cin 162e NZP 214848
377 4 Female SANDIEGOZ NHXX 24 239 5/21/2000 Dead DNA 377 DNA from San Diego
T. cin 101e
382 3 Male AGANA 30335 26 260 6/24/2000 Living 11 blood
T. cin 11e
384 3 Male AGANA 313 207 339 7/18/2000 Living 3 blood
T. cin 3e
386 4 Male USNM 623245 176 251 7/19/2000 Dead 623245 tissue 8/20/2000 T. cin 160e NZP 214643
388 3 Female USNM 638606 26 260 7/21/2000 Dead 638606 tissue 10/31/2006 T. cin 154e NZP 214846
389 3 Male SDNMH 50805 26 260 7/25/2000 Dead 50805 skin 11/25/2001 T. cin 179e SDZ 43754
389 3 Male SANDIEGOZ NHXX 26 260 7/25/2000 Dead DNA 389 DNA from San Diego
T. cin 95e
393 4 Female CHICAGOLP 20762 205 345 5/31/2001 Living 121 feathers in bags
T. cin 137e
397 4 Female SD-WAP NHXX 263 354 7/31/2001 Dead DNA 397 DNA from San Diego
T. cin 98e
403 4 Male CHICAGOLP 22666 365 251 3/7/2002 Living 122 feathers in bags
T. cin 136e
406 4 Male SANDIEGOZ NHXX 259 381 5/3/2002 Dead DNA 406 DNA from San Diego
T. cin 104e
411 4 Male USNM 641556 26 239 5/24/2002 Dead 641556 tissue 9/16/2007 T. cin 157e NZP 215615
421 4 Female AGANA NONE 259 381 4/24/2003 Living 2 blood
T. cin 2e
424 4 Female SD-WAP NHN 259 381 6/1/2003 Dead DNA 424 DNA from San Diego
T. cin 91e

185
Studbook ID
Generations From Wild Founder
(Based on Dam's
Lineage)
Sex Current
Location at Sampling*
Current Local ID
Sire Studbook
ID
Dam Studbook
ID Hatch Date
Status at Sampling
Tube Label
Sample Type Collection
Date If Known
Sample ID Post
Extraction Notes
425 4 Male AGANA NONE 259 381 6/6/2003 Living 8 blood
T. cin 8e
427 4 Female DISNEY AK 110756 259 381 8/7/2003 Living None feathers, filter paper 12/14/2012 T. cin 131e
434 5 Male SD-WAP NHXX 344 377 5/5/2004 Dead DNA 434 DNA from San Diego
T. cin 106e
435 5 Male METROZOO 10B037 330 393 5/8/2004 Living 47 blood
T. cin 33e
440 5 Female SANDIEGOZ NHXX 344 377 6/8/2004 Dead DNA 440 DNA from San Diego
T. cin 89e
441 5 Male HOUSTON 22303 330 393 6/10/2004 Living 104 blood
T. cin 67e
446 4 Female NY BRONX NHXX 360 354 6/30/2004 Dead N2009-
503 tissue
T. cin 124e
447 5 Female ST LOUIS 106534 330 393 7/12/2004 Living 52 blood
T. cin 38e
449 4 Male DISNEY AK 110076 367 352 7/15/2004 Living None feathers, filter paper 12/14/2012 T. cin 132e
451 5 Female SANDIEGOZ 404134 344 377 7/16/2004 Dead OR5599 tissue 12/1/2014 T. cin 128e
451 5 Female SANDIEGOZ 404134 344 377 7/16/2004 Living 153 blood
T. cin 76e
452 4 Female SANDIEGOZ 308384 373 387 7/17/2004 Dead OR5587 tissue 12/1/2014 T. cin 126e
454 4 Male NY BRONX FHAL 351 374 8/1/2004 Dead N2006-
844 tissue
T. cin 123e
463 4 Male SAN ANTON Y07020 373 387 10/12/2004 Living 33 blood
T. cin 21e
464 4 Female NY BRONX FHXX 373 387 11/18/2004 Dead N2007-
17 tissue
T. cin 120e
485 5 Male CHICAGOLP 21530 330 393 7/9/2005 Living 119 feathers in bags
T. cin 139e
487 4 Male AGANA 297 384 340 7/10/2005 Living 7 blood
T. cin 7e
489 5 Male NZP-CRC 215731 403 397 8/1/2005 Living 489 feathers in bags
T. cin 147e
492 4 Male CHICAGOBR 2447 351 374 8/11/2005 Living 161 blood
T. cin 78e
493 4 Female LSUMZ B-91955 373 387 8/12/2005 Dead B-91955 tissue
T. cin 170e
496 4 Male AGANA 296 384 340 8/25/2005 Living 4 blood
T. cin 4e
497 4 Female AGANA NHN 384 340 8/26/2005 Dead 12 blood
T. cin 12e
499 5 Male SAN ANTON Y07031 403 397 9/11/2005 Living 34 blood
T. cin 22e
505 5 Male SANDIEGOZ NHXX 344 377 4/24/2006 Dead DNA 505 DNA from San Diego
T. cin 96e
518 5 Female USNM 644528 344 377 5/26/2006 Dead 644528 tissue 6/15/2009 T. cin 158e NZP 215739
520 5 Male PITTS CA 7711 461 439 5/29/2006 Living 37, 38,
pen blood, blood, liver
T. cin 24e
522 5 Male NY BRONX B08025 330 393 6/2/2006 Living N2012-1032
tissue
T. cin 119e
528 6 Male SANDIEGOZ FHDX 406 451 6/22/2006 Dead DNA 528 DNA from San Diego
T. cin 94e
530 5 Female USNM 644527 344 377 6/26/2006 Dead 644527 tissue 8/22/2009 T. cin 150e NZP 215732
535 4 Female DISNEY AK 60217 351 374 7/12/2006 Living None feathers, filter paper 12/14/2012 T. cin 133e
536 4 Male NZP-WASH 215737 351 374 7/13/2006 Living None feathers 1/16/2013 T. cin 141e
538 4 Female HOUSTON 22666 373 387 7/17/2006 Living 46 blood
T. cin 32e

186
Studbook ID
Generations From Wild Founder
(Based on Dam's
Lineage)
Sex Current
Location at Sampling*
Current Local ID
Sire Studbook
ID
Dam Studbook
ID Hatch Date
Status at Sampling
Tube Label
Sample Type Collection
Date If Known
Sample ID Post
Extraction Notes
540 5 Male BUSCH TAM 64365 461 439 7/18/2006 Living 79 blood, feathers
T. cin 57e
543 4 Female CHICAGOLP 22026 359 420 8/17/2006 Living 178 tissue
T. cin 114e
545 5 Female SAN ANTON F08018 461 439 9/21/2006 Living 545 feathers in bags
T. cin 145e
549 5 Male SEA WORLD MK0002 403 397 3/7/2007 Living 69 blood
T. cin 49e
555 6 Male SEA WORLD MK0001 434 424 4/19/2007 Living 67 blood
T. cin 47e
557 4 Female METROZOO B90044 359 420 5/6/2007 Living 103 blood
T. cin 66e
558 4 Male PHILADELP 205739 359 420 5/8/2007 Living 57 blood, feathers
T. cin 43e
561 5 Female SANDIEGOZ 309053 330 393 5/17/2007 Living 27 blood
T. cin 15e
567 6 Male METROZOO B90116 174 447 7/19/2007 Living 45 blood
T. cin 31e
568 6 Male CHICAGOLP NHXX 174 447 7/21/2007 Dead 177 tissue
T. cin 115e
569 5 Female HOUSTON 24645 461 439 7/30/2007 Living 44 blood
T. cin 30e
571 6 Male SDNMH 52932 406 451 8/9/2007 Dead 52932 skin 9/19/2008 T. cin 180e SDZ 51441
571 6 Male SANDIEGOZ NHXX 406 451 8/9/2007 Dead DNA 571 DNA from San Diego
T. cin 99e
574 5 Male BUSCH TAM 65040 403 397 2/13/2008 Living 74 blood, feathers 10/8/2013 T. cin 52e
575 5 Female RIO GRAND B10012 403 397 2/15/2008 Living 39 blood
T. cin 25e
577 5 Female NZP-WASH 215852 403 397 4/24/2008 Living None feathers 1/16/2013 T. cin 140e
578 5 Female SANDIEGOZ NHAA 403 397 4/24/2008 Dead DNA 578 DNA from San Diego
T. cin 97e
582 6 Female PHILADELP 205741 406 451 4/23/2008 Living 59 blood, feathers
T. cin 45e
583 6 Female BUSCH TAM 64398 406 451 6/10/2008 Living 32 blood
T. cin 20e
592 6 Male SAN ANTON N09041 434 424 7/17/2008 Living 31 blood
T. cin 19e
593 5 Female SD-WAP NHXX 403 397 9/13/2008 Dead DNA 593 DNA from San Diego
T. cin 100e
594 5 Female PHILADELP 205740 403 397 9/15/2008 Living 58 blood, feathers
T. cin 44e
595 6 Male BUSCH TAM 64780 522 508 12/21/2008 Living 82 blood, feathers 10/10/2013 T. cin 60e
597 6 Female SEA WORLD MK0004 522 508 1/2/2009 Living 68 blood
T. cin 48e
604 5 Female AGANA NONE 487 443 4/6/2009 Living 5 blood
T. cin 5e
609 5 Female DISNEY AK 100748 403 397 4/27/2009 Living None feathers, filter paper 12/14/2012 T. cin 134e
610 5 Female LONG B AQ UNK 492 439 5/5/2009 Living 110 blood
T. cin 69e
612 6 Male DISNEY AK 90195 461 484 5/13/2009 Living 113 blood, feathers 12/29/2012 T. cin 70e
617 6 Female BUSCH TAM 65124 485 543 6/2/2009 Living 73 blood, feathers 10/10/2013 T. cin 51e
623 6 Male DISNEY AK 90310 461 484 6/14/2009 Living None feathers, filter paper 12/14/2012 T. cin 135e
624 6 Female DISNEY AK NHN 461 484 6/15/2009 Dead tissue 624
tissue
T. cin 110e
625 6 Unkno
wn SANDIEGOZ NHXX 406 451 6/16/2009 Dead DNA 625 DNA from San Diego
T. cin 90e

187
Studbook ID
Generations From Wild Founder
(Based on Dam's
Lineage)
Sex Current
Location at Sampling*
Current Local ID
Sire Studbook
ID
Dam Studbook
ID Hatch Date
Status at Sampling
Tube Label
Sample Type Collection
Date If Known
Sample ID Post
Extraction Notes
627 5 Male PHILADELP 205832 492 439 6/17/2009 Living 60 blood, feathers
T. cin 46e
630 4 Male AGANA NONE 384 421 7/3/2009 Living 10 blood
T. cin 10e
631 4 Female AGANA NONE 384 421 7/5/2009 Living 6 blood
T. cin 6e
639 7 Female BUSCH TAM 64772 507 539 8/17/2009 Living 81 blood, feathers 10/10/2013 T. cin 59e
640 4 Male AGANA NONE 384 421 8/23/2009 Living 1 blood
T. cin 1e
655 6 Male SAN ANTON A10015 499 545 4/9/2010 Living 25 blood
T. cin 13e
655 6 Male ST LOUIS 111037 499 545 4/9/2010 Living 51 blood
T. cin 37e
656 6 Male DISNEY AK 100100 461 484 4/9/2010 Living 114 blood, feathers 12/29/2012 T. cin 71e
660 6 Female SANDIEGOZ 410045 563 561 4/19/2010 Dead OR6061 tissue 12/1/2014 T. cin 125e
660 6 Female SANDIEGOZ 410045 563 561 4/19/2010 Living 160 blood
T. cin 77e
665 6 Male DISNEY AK 100144 461 484 5/1/2010 Living 115 blood, feathers 12/29/2012 T. cin 72e
669 7 Male ST LOUIS 107996 507 539 5/14/2010 Living 53 blood
T. cin 39e
671 7 Female BUSCH TAM 64605 540 583 5/18/2010 Living 102 blood
T. cin 65e
673 6 Male SANDIEGOZ 410061 563 561 5/19/2010 Dead OR5114 DNA from San Diego 12/1/2014 T. cin 87e
675 6 Male SANDIEGOZ 313847 461 484 5/21/2010 Living 144 blood
T. cin 73e
679 6 Male CHICAGOLP 22520 485 543 6/3/2010 Living 109 blood
T. cin 68e
680 6 Female CHICAGOLP 22522 485 543 6/5/2010 Living 26 blood
T. cin 14e
682 6 Male SANDIEGOZ NHN 563 561 6/13/2010 Dead DNA 682 DNA from San Diego
T. cin 92e
687 6 Unkno
wn DISNEY AK AHN 461 484 7/27/2010 Dead
tissue 687
tissue
T. cin 107e
696 6 Female HOUSTON 25662 441 538 9/11/2010 Living 70 blood
T. cin 50e
699 6 Unkno
wn NY BRONX IHXX 448 581 1/13/2011 Dead
N2011-29
tissue
T. cin 122e
700 6 Unkno
wn NY BRONX IHXX 448 581 1/13/2011 Dead
N2011-30
tissue
T. cin 121e
701 6 Female SAN ANTON J11023 499 545 1/29/2011 Living 29 blood
T. cin 17e
701 6 Female SANDIEGOZ 813036 499 545 1/29/2011 Living 167 blood, feathers
T. cin 84e
704 7 Male BUSCH TAM 64876 595 639 4/21/2011 Living 75 blood, feathers 10/10/2013 T. cin 53e
706 6 Male HOUSTON 26356 441 538 4/27/2011 Living 40 blood
T. cin 26e
707 6 Female HOUSTON 26368 441 538 4/29/2011 Living 41 blood
T. cin 27e
709 6 Male SANDIEGOZ 411051 563 561 5/17/2011 Living 162 blood
T. cin 79e
711 6 Female HOUSTON 26494 441 538 6/5/2011 Living 43 blood
T. cin 29e
717 6 Male SAN ANTON L11011 499 545 7/6/2011 Living 30 blood
T. cin 18e
719 6 Male PHILADELP 205825 558 594 7/21/2011 Living None feathers
T. cin 148e
723 6 Male HOUSTON 26589 373 569 7/25/2011 Living 42 blood
T. cin 28e
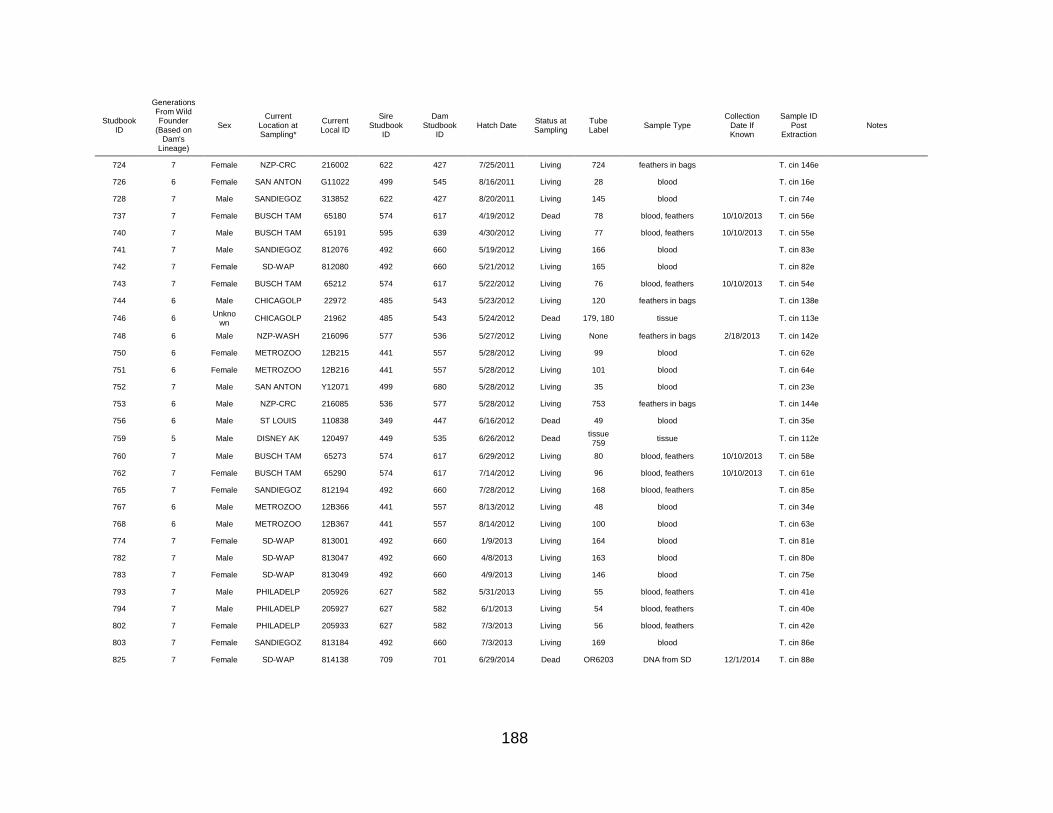
188
Studbook ID
Generations From Wild Founder
(Based on Dam's
Lineage)
Sex Current
Location at Sampling*
Current Local ID
Sire Studbook
ID
Dam Studbook
ID Hatch Date
Status at Sampling
Tube Label
Sample Type Collection
Date If Known
Sample ID Post
Extraction Notes
724 7 Female NZP-CRC 216002 622 427 7/25/2011 Living 724 feathers in bags
T. cin 146e
726 6 Female SAN ANTON G11022 499 545 8/16/2011 Living 28 blood
T. cin 16e
728 7 Male SANDIEGOZ 313852 622 427 8/20/2011 Living 145 blood
T. cin 74e
737 7 Female BUSCH TAM 65180 574 617 4/19/2012 Dead 78 blood, feathers 10/10/2013 T. cin 56e
740 7 Male BUSCH TAM 65191 595 639 4/30/2012 Living 77 blood, feathers 10/10/2013 T. cin 55e
741 7 Male SANDIEGOZ 812076 492 660 5/19/2012 Living 166 blood
T. cin 83e
742 7 Female SD-WAP 812080 492 660 5/21/2012 Living 165 blood
T. cin 82e
743 7 Female BUSCH TAM 65212 574 617 5/22/2012 Living 76 blood, feathers 10/10/2013 T. cin 54e
744 6 Male CHICAGOLP 22972 485 543 5/23/2012 Living 120 feathers in bags
T. cin 138e
746 6 Unkno
wn CHICAGOLP 21962 485 543 5/24/2012 Dead 179, 180 tissue
T. cin 113e
748 6 Male NZP-WASH 216096 577 536 5/27/2012 Living None feathers in bags 2/18/2013 T. cin 142e
750 6 Female METROZOO 12B215 441 557 5/28/2012 Living 99 blood
T. cin 62e
751 6 Female METROZOO 12B216 441 557 5/28/2012 Living 101 blood
T. cin 64e
752 7 Male SAN ANTON Y12071 499 680 5/28/2012 Living 35 blood
T. cin 23e
753 6 Male NZP-CRC 216085 536 577 5/28/2012 Living 753 feathers in bags
T. cin 144e
756 6 Male ST LOUIS 110838 349 447 6/16/2012 Dead 49 blood
T. cin 35e
759 5 Male DISNEY AK 120497 449 535 6/26/2012 Dead tissue 759
tissue
T. cin 112e
760 7 Male BUSCH TAM 65273 574 617 6/29/2012 Living 80 blood, feathers 10/10/2013 T. cin 58e
762 7 Female BUSCH TAM 65290 574 617 7/14/2012 Living 96 blood, feathers 10/10/2013 T. cin 61e
765 7 Female SANDIEGOZ 812194 492 660 7/28/2012 Living 168 blood, feathers
T. cin 85e
767 6 Male METROZOO 12B366 441 557 8/13/2012 Living 48 blood
T. cin 34e
768 6 Male METROZOO 12B367 441 557 8/14/2012 Living 100 blood
T. cin 63e
774 7 Female SD-WAP 813001 492 660 1/9/2013 Living 164 blood
T. cin 81e
782 7 Male SD-WAP 813047 492 660 4/8/2013 Living 163 blood
T. cin 80e
783 7 Female SD-WAP 813049 492 660 4/9/2013 Living 146 blood
T. cin 75e
793 7 Male PHILADELP 205926 627 582 5/31/2013 Living 55 blood, feathers
T. cin 41e
794 7 Male PHILADELP 205927 627 582 6/1/2013 Living 54 blood, feathers
T. cin 40e
802 7 Female PHILADELP 205933 627 582 7/3/2013 Living 56 blood, feathers
T. cin 42e
803 7 Female SANDIEGOZ 813184 492 660 7/3/2013 Living 169 blood
T. cin 86e
825 7 Female SD-WAP 814138 709 701 6/29/2014 Dead OR6203 DNA from SD 12/1/2014 T. cin 88e

189
Studbook ID
Generations From Wild Founder
(Based on Dam's
Lineage)
Sex Current
Location at Sampling*
Current Local ID
Sire Studbook
ID
Dam Studbook
ID Hatch Date
Status at Sampling
Tube Label
Sample Type Collection
Date If Known
Sample ID Post
Extraction Notes
??? ??? Male LSUMZ B-57113 Unknown Unknown Unknown Dead B-57113 tissue
T. cin 168e
Two male birds died at HOUSTON on 12/21/1999 - SB#s 197 or 348
None WILD Female MVZ Bird 123479 Wild Wild Unknown Dead 123479 toe pad 5/4/1905 T. cin 181e see Ornis search results for more details
None WILD Male MVZ Bird 95154 Wild Wild Unknown Dead 95154 toe pad 4/28/1905 T. cin 182e see Ornis search results for more details
None WILD Male MVZ Bird 95156 Wild Wild Unknown Dead 95156 toe pad 4/28/1905 T. cin 183e see Ornis search results for more details
None WILD Male MVZ Bird 95157 Wild Wild Unknown Dead 95157 toe pad 4/28/1905 T. cin 184e see Ornis search results for more details
None WILD Male MVZ Bird 95158 Wild Wild Unknown Dead 95158 toe pad 4/28/1905 T. cin 185e see Ornis search results for more details
None WILD Male MVZ Bird 95159 Wild Wild Unknown Dead 95159 toe pad 4/28/1905 T. cin 186e see Ornis search results for more details
None WILD Female MVZ Bird 95160 Wild Wild Unknown Dead 95160 toe pad 4/28/1905 T. cin 187e see Ornis search results for more details
None WILD Female MVZ Bird 95161 Wild Wild Unknown Dead 95161 toe pad 4/28/1905 T. cin 188e see Ornis search results for more details
None WILD Female MVZ Bird 95162 Wild Wild Unknown Dead 95162 toe pad 4/28/1905 T. cin 189e see Ornis search results for more details
None WILD Unkno
wn MVZ Bird 95155 Wild Wild Unknown Dead 95155 toe pad 4/28/1905 T. cin 190e
see Ornis search results for more details
None WILD Male USNM 377969 Wild Wild Unknown Dead 377969 toe pad 6/6/1945 T. cin 191e
see Smithsonian results for more details on sample collection location
None WILD Male USNM 377973 Wild Wild Unknown Dead 377973 toe pad 3/8/1945 T. cin 192e
see Smithsonian results for more details on sample collection location
None WILD Male USNM 377977 Wild Wild Unknown Dead 377977 toe pad 6/4/1945 T. cin 193e
see Smithsonian results for more details on sample collection location

190
Studbook ID
Generations From Wild Founder
(Based on Dam's
Lineage)
Sex Current
Location at Sampling*
Current Local ID
Sire Studbook
ID
Dam Studbook
ID Hatch Date
Status at Sampling
Tube Label
Sample Type Collection
Date If Known
Sample ID Post
Extraction Notes
None WILD Male USNM 377978 Wild Wild Unknown Dead 377978 toe pad 6/16/1945 T. cin 194e
see Smithsonian results for more details on sample collection location
None WILD Male USNM 377980 Wild Wild Unknown Dead 377980 toe pad 5/25/1945 T. cin 195e
see Smithsonian results for more details on sample collection location
None WILD Female USNM 377981 Wild Wild Unknown Dead 377981 toe pad 6/14/1945 T. cin 196e
see Smithsonian results for more details on sample collection location
None WILD Female USNM 377984 Wild Wild Unknown Dead 377984 toe pad 5/25/1945 T. cin 197e
see Smithsonian results for more details on sample collection location
None WILD Female USNM 377985 Wild Wild Unknown Dead 377985 toe pad 6/19/1945 T. cin 198e
see Smithsonian results for more details on sample collection location
None WILD Female USNM 377987 Wild Wild Unknown Dead 377987 toe pad 5/26/1945 T. cin 199e
see Smithsonian results for more details on sample collection location
None WILD Female USNM 377990 Wild Wild Unknown Dead 377990 toe pad 6/28/1945 T. cin 200e
see Smithsonian results for more details on sample collection location
None WILD Male USNM 384866 Wild Wild Unknown Dead 384866 toe pad 7/6/1945 T. cin 201e
see Smithsonian results for more details on sample collection location
None WILD Female USNM 384870 Wild Wild Unknown Dead 384870 toe pad 7/18/1945 T. cin 202e
see Smithsonian results for more details on sample collection location
None WILD Unkno
wn ANSP 21389 Wild Wild Unknown Dead 21389 toe pad Unknown T. cin 203e
None WILD Unkno
wn ANSP 21390 Wild Wild Unknown Dead 21390 toe pad Unknown T. cin 204e
None WILD Unkno
wn ANSP 21391 Wild Wild Unknown Dead 21391 toe pad Unknown T. cin 205e
None WILD Unkno
wn ANSP 21392 Wild Wild Unknown Dead 21392 toe pad Unknown T. cin 206e
None WILD Female AMNH 332419 Wild Wild Unknown Dead 332419 toe pad 8/11/1931 T. cin 207e

191
Studbook ID
Generations From Wild Founder
(Based on Dam's
Lineage)
Sex Current
Location at Sampling*
Current Local ID
Sire Studbook
ID
Dam Studbook
ID Hatch Date
Status at Sampling
Tube Label
Sample Type Collection
Date If Known
Sample ID Post
Extraction Notes
None WILD Female AMNH 332420 Wild Wild Unknown Dead 332420 toe pad 8/11/1931 T. cin 208e