Embed Size (px)
Citation preview
llOPEN ACCESS
iScience
Perspective
Using natural travel paths to inferand compare primate cognition in the wild
Karline R.L. Janmaat,1,2,3,* Miguel de Guinea,4 Julien Collet,5 Richard W. Byrne,6,7 Benjamin Robira,8,9
Emiel van Loon,10 Haneul Jang,11 Dora Biro,5,12 Gabriel Ramos-Fernandez,13,14 Cody Ross,11 Andrea Presotto,15
Matthias Allritz,16 Shauhin Alavi,17,18,19 and Sarie Van Belle20
1Evolutionary and PopulationBiology, Institute forBiodiversity and EcosystemDynamics, University ofAmsterdam, Amsterdam, theNetherlands
2Department of CognitivePsychology, Faculty of SocialSciences, Leiden University,Leiden, the Netherlands
3ARTIS Amsterdam Royalzoo, Amsterdam, theNetherlands
4Department of SocialSciences, Oxford BrookesUniversity, Oxford, UK
5Oxford Navigation Group,Department of Zoology,OxfordUniversity, Oxford, UK
6
SUMMARY
Within comparative psychology, the evolution of animal cognition is typicallystudied either by comparing indirect measures of cognitive abilities (e.g., relativebrain size) across many species or by conducting batteries of decision-making ex-periments among (typically) a few captive species. Here, we propose a third, com-plementary approach: inferring and comparing cognitive abilities through obser-vational field records of natural information gradients and the associatedvariation in decision-making outcomes, using the ranging behavior of wild ani-mals. To demonstrate the feasibility of our proposal, we present the results ofa global survey assessing the availability of long-term ranging data sets fromwild primates and the willingness of primatologists to share such data. Weexplore three ways in which such ranging data, with or without the associatedbehavioral and ecological data often collected by primatologists, might beused to infer and compare spatial cognition. Finally, we suggest how ecologicalcomplexity may be best incorporated into comparative analyses.
Centre for Social Learningand Cognitive Evolution,School of Psychology andNeuroscience, University of StAndrews, St Andrew, UK
7Scottish Primate ResearchGroup, Scotland, UK
8Centre d’EcologieFonctionnelle et Evolutive,Universite de Montpellier,Montpellier, France
9Eco-anthropologie,Museum National d’HistoireNaturelle, CNRS, Universitede Paris, Paris, France
10Theoretical andComputational Ecology,Institute for Biodiversity andEcosystem Dynamics,University of Amsterdam,Amsterdam, the Netherlands
11Department of HumanBehavior, Ecology andCulture, Max Planck Institutefor EvolutionaryAnthropology, Leipzig,Germany
12Department of Brain andCognitive Sciences,University of Rochester,Rochester, USA
13Department ofMathematical Modelling ofSocial Systems, Institute forResearch on Applied
Continued
INTRODUCTION
Comparative analyses are fundamental to understanding the evolution and development of cognition
(Harvey and Krebs, 1990; Nunn, 2011; Romanes, 1884). Given the definition of cognition as a set of mech-
anisms that enable individuals to acquire, store, integrate, and act upon information (Shettleworth, 2010),
decision-making tasks represent a useful window into cognitive abilities. Most studies of animal cognition
are experimental and conducted on captive subjects (e.g., see Janmaat, 2019 for a review focused on pri-
mates; Morand-Ferron et al., 2016). These studies often include decision-making experiments designed for
cross-species comparisons (e.g., ManyPrimates et al., 2019a). Captive experimentation enables control
over potentially confounding factors and allows researchers to distinguish between alternative cognitive
hypotheses (Jacobs and Menzel, 2014).
Exclusive reliance on lab-based studies, however, has downsides. First, the socio-ecological relevance of
experimental cognitive tasks and the cognitive abilities observedmay not generalizewell outside of the exper-
imental context (Calisi and Bentley, 2009). Second, experimental approaches generally restrict the number of
species, populations, and developmental conditions available for comparative study (ManyPrimates et al.,
2019b). Third, exclusive reliance on captive studies limits our understanding of local adaptations in cognition
(Croston et al., 2015) and risks focusing on individuals with cognitive specializations not representative of the
species as a whole, due to differences in challenges across development (e.g., a lack of foraging in large-scale
space, escaping predators, or interaction with neighboring groups) (Janmaat, 2019; Ricklefs and Wikelski,
2002). Captivity-imposed restrictions on movement can give rise to diminished navigation performances (Ja-
cobs andMenzel, 2014; Janmaat, 2019;Menzel and Beck, 2000), and there is evidence of important effects that
socio-ecological environments have on even basic cognitive mechanisms, from the neural (e.g., Bogart et al.,
2014; Henrich et al., 2010) to the behavioral level (e.g., Haun et al., 2011). To gain further insights into the devel-
opment, plasticity, and evolutionary drivers of cognition, it is therefore essential to extend the taxonomic
coverage of our study species and to also study populations within their natural habitats.
An alternative approach to studying cognition uses proxy variables for cognitive abilities that can be ac-
quired without having to observe animals in situ. These proxies typically consist of brain measurements
iScience 24, 102343, April 23, 2021 ª 2021 The Authors.This is an open access article under the CC BY license (http://creativecommons.org/licenses/by/4.0/).
1
llOPEN ACCESS
iSciencePerspective
(e.g., hippocampus size, neo-cortex ratios, relative or absolute brain volume, or neuron counts; Barks et al.,
2015; Barton, 1996; DeCasien et al., 2017). Such studies then attempt to relate these variables to predictor
variables measuring socio-ecological challenges, via comparative phylogenetic methods (Byrne, 1996).
Nonetheless, conclusions are limited by uncertainty about the functional relationship between brain mea-
sures and cognitive abilities (Chittka and Niven, 2009; Healy and Rowe, 2007; Isler and van Schaik, 2006;
Logan et al., 2018).
Here, we propose a third, complementary approach: studying ‘‘decision-making in wild animal populations
using unmanipulated field observations’’. Specifically, our aim is to develop ways of measuring and
comparing indicators of cognition that (1) are naturally exhibited by animals, (2) require no experimental
manipulation, and (3) can be collected at all field sites, allowing large-scale comparisons. We focus on an-
imal ranging behavior (i.e., Global Positioning System [GPS] tracks) because large amounts of such data are
available (Cagnacci et al., 2010; Kays et al., 2015; Nathan et al., 2008; Tomkiewicz et al., 2010; Williams et al.,
2020). Ranging behavior is key to many biological imperatives influencing natural selection (including
acquisition and defense of food, locating mates and shelter, and avoidance of predators and competitors)
and involves numerous distinct components and types of cognition (e.g., procedural, declarative memory
[e.g., episodic memory], categorization, intuitive statistics, serial learning, spatial reasoning, and future
planning; see Glossary) (Fagan et al., 2013; Janmaat et al., 2016; Trapanese et al., 2019).
Mathematics and Systems,Universidad NacionalAutonoma de Mexico,Mexico City, Mexico
14Center for ComplexitySciences, UniversidadNacional Autonoma deMexico, Mexico City, Mexico
15Department of Geographyand Geosciences, SalisburyUniversity, Salisbury, MA,USA
16School of Psychology andNeuroscience, University of StAndrews, Scotland, UK
17Department for the Ecologyof Animal Societies, MaxPlanck Institute of AnimalBehaviour, Konstanz,Germany
18Centre for the AdvancedStudy of CollectiveBehaviour, University ofKonstanz, Konstanz,Germany
19Department of Biology,University of Konstanz,Konstanz, Germany
20Department ofAnthropology, University ofAustin at Texas, Austin, TX,USA
*Correspondence:[email protected]
https://doi.org/10.1016/j.isci.2021.102343
COGNITION IN RANGING BEHAVIOR
Field researchers routinely record the movement of their study individuals or groups, accumulating such
data over decades. Moreover, recent years have seen enormous advances in bio-logging technology,
yielding large longitudinal data sets (Cagnacci et al., 2010; Kays et al., 2015; Tomkiewicz et al., 2010; Wil-
liams et al., 2020). Such data sets offer a potentially powerful opportunity to infer cognition from travel data
(Fagan et al., 2013; Janmaat, 2019; Nathan et al., 2008; Ross et al., 2018). However, to date, relatively few
movement ecology papers have addressed cognitive questions (e.g., Fagan et al., 2013; Joo et al., 2020;
Pacheco-Cobos et al., 2019).
Inferring cognition from movement data is not straightforward. Multiple factors can explain where, when,
and how an animal travels (Codling et al., 2008; Janson and Byrne, 2007; Nathan et al., 2008). For instance,
travel paths can be influenced by locomotor and energetic constraints, the heterogeneous distribution of
resources in the landscape, and/or the animal’s internal motivation (Nathan et al., 2008; Wilson et al., 2013).
Moreover, an observedmovement pattern can often be explained by several cognitive hypotheses that are
difficult to tease apart. For example, straightline travel could arise from traveling along a sensory gradient,
path integration, group inertia, or navigation based on use of direct spatial memory (a map-like mental rep-
resentation of a given area), see Glossary (Nathan et al., 2008). Similarly, the same cognitive adaptation can
be expressed through different types of behavior; for example, memories of key points of interest may give
rise to (1) faster travel, (2) straighter travel, (3) changes in travel direction, (4) longer approach distances, (5)
frequent revisits, and/or (6) non-random sequential orders of revisits to important locations (Table 1).
Because ranging data usually allow for measurement of each of these indicator variables, such suites of
behavioral indicators can be used to our advantage to test more robustly the underlying cognitive
processes.
In this paper, we will focus on primate ranging data, although our methodology is relevant to other taxa as
well (e.g., Collet and Weimerskirch, 2020). We focus on primates for several reasons: (1) the primate order
contains at least 505 species (Rowe and Myers, 2016) and is well-suited for comparative analyses, which
require large data sets with known phylogenetic branch lengths (Arnold et al., 2010), (2) most primates
are diurnal and can be followed for the entire period of their activity, enabling identification of motivations
and goal-directed actions (e.g., Byrne et al., 2009), (3) high levels of site fidelity allow researchers to relocate
individuals in subsequent years and thus enable longitudinal studies under changing socio-ecological con-
ditions (e.g., Janmaat et al., 2009; Van Belle et al., 2018), and (4) although studies of cognition in wild pri-
mates are growing in frequency (Trapanese et al., 2019; Zuberbuhler and Janmaat, 2010), there is an ur-
gency to this work, as key habitats are rapidly disappearing, and with them the opportunities to study
the development and evolution of primate cognition (Estrada et al., 2017; Junker et al., 2020).
The rest of the paper runs as follows: we first assess the availability and extent of primate ranging data using
a global survey. Then, we discuss how cognitive abilities can be studied using the decision-making
2 iScience 24, 102343, April 23, 2021
Glossary
1. Cognition: mechanisms by which animals acquire, process, store, and act on information from the environment.
2. Navigation: the cognitive process involved in moving from one place to another.
3. View matching (also called view-dependent place recognition or landmark-based image matching): a method that guides movement decisions by
comparing the current view with a template, which is a snapshot memory of the visual panorama surrounding a goal location. The animal moves such
as to minimize the discrepancy between the current retinal image and the template. Matching may include multiple consecutive images, incorpo-
rating how sizes, edges or angles in a scene are expected to change upon approach, or multiple templates from different vantage points for the same
goal.
4. Path integration (also called dead reckoning, a corruption of ‘‘deduced reckoning’’): a method of keeping track of one’s current location relative to a
known ‘home’ location by adding vectors of the separate effects of each sector of travel. It requires repeated estimations of speed, time and di-
rection, and without instruments errors from these estimated vectors accumulate reducing accuracy. Path integration yields a travel vector from the
‘home’ location; reversing the vector allows direct return travel in a beeline, potentially aided with intimate knowledge of a small area around the
home base to correct for any errors from path integration (e.g., by means of view matching).
5. Procedural memory (also called implicit memory, unconscious memory, or automatic memory): a category of long-term memory that stores infor-
mation on how to perform certain procedures (e.g., the procedure of brachiating, go straight and turn right at the tree), and aids in performing
certain tasks without the need for conscious control or attention.
6. Declarative memory (also called explicit memory): a category of long-term memory that refers to making a mental representation of experiences,
events, facts, and information used in everyday living. As opposed to procedural knowledge, which is ‘‘knowing what to do’’, declarative memory
refers to ‘‘knowing what is there’’ (e.g., that the goal is located 100 m to the east of the tree). It may include both semantic memory (storage of factual
knowledge independent of personal experience) and episodic memory (storage of personal experiences, and events in life).
7. Episodic memory: the memory system that encodes, stores, and retrieves a unique, personal experience associated with a precise spatial and tem-
poral context. It supports an individual’s ability to consciously re-experience past events and possibly to pre-experience future events. The content
of episodic memory is composed of information regarding what, where and when a specific event occurred.
8. Spatio-temporal memory: umbrella term for memory processes that involve encoding, storing and retrieving the location of objects or places in the
environment and/or temporal patterns of specific resources (e.g., fruit production patterns of trees, caches expiration rate). The spatial (where) and
temporal (when) elements of memory can be stored independently from each other or in combination. Re-experiencing the original encoding of the
memory (= episodic memory) does not need to be involved in retrieval.
9. Serial learning: the learning of a sequence of stimuli, items, locations, or responses, allowing the individual to recall or execute the same set of items
or responses in a specific order. In the context of animal movement, serial learning may be relevant to navigation by memorising a specific chain of
landmarks or locations visited, a specific sequence of movement vectors and directional shifts, or both.
10. Intuitive statistics: the ability to make inferences about the frequency of a trait in a population (e.g., the number of fruit-bearing trees within a tree
species). This inference can be from samples to population, e.g., inferring, from seeing a few individual trees, an expectation about the general
frequency of trees of the same species that are currently bearing fruit; or the inference can be population to sample, inferring, from seeing a number
of trees, an expectation that a specific individual tree is also bearing fruit. This ability can, for example, enable primates to keep track of proportions
of fruit-bearing trees within tree species (e.g., species with high synchrony in fruiting where all individual trees fruit simultaneously), irrespective of
their density.
11. Future Planning: the ability to act for a future motivational state - an ability to perform a combination of unique actions (e.g., nest positioning and
breakfasting), with the time of the planning action (e.g., nest positioning) being separated from the future activity (e.g., breakfasting) by a period of
other activities, (e.g., climbing, nest building, and sleeping). Note that planning on its own can be defined as: The ability to act in accordance with a
future goal, independent of its current motivation.
12. Heuristic: a simple and efficient rule employed in problem solving that is not necessarily an optimal approach yet yields a satisfactory solution. Ex-
amples are trial-and-error, rules of thumb, and educated guesses, and can decrease the cognitive load associated with making decisions.
13. Constancy: a component of predictability based on information theory; it is the reverse of variability. As an example, if the productivity of a patch has
a high value of constancy, a primate sampling it at a given time may gain information on its future state. In contrast, low values imply that sampling
such patch, in the absence of any other variable, does not provide information of the future productivity of that patch.
14. Contingency: another component of predictability based on information theory, quantifying the degree to which one variable is statistically depen-
dent on another variable. For example, if the fruiting time series of two plant species is statistically dependent on one another, perhaps with a time
lag, then a primate sampling the fruiting state of one species may gain information on the present and/or future fruiting state of the other species.
15. Sensory gradient: rate of regular ascent or descent of cues emitted by a target (e.g., a food source) that can be perceived by the olfactory, auditory or
visual senses of an animal that travels towards that target.
llOPEN ACCESS
iScience 24, 102343, April 23, 2021 3
iSciencePerspective
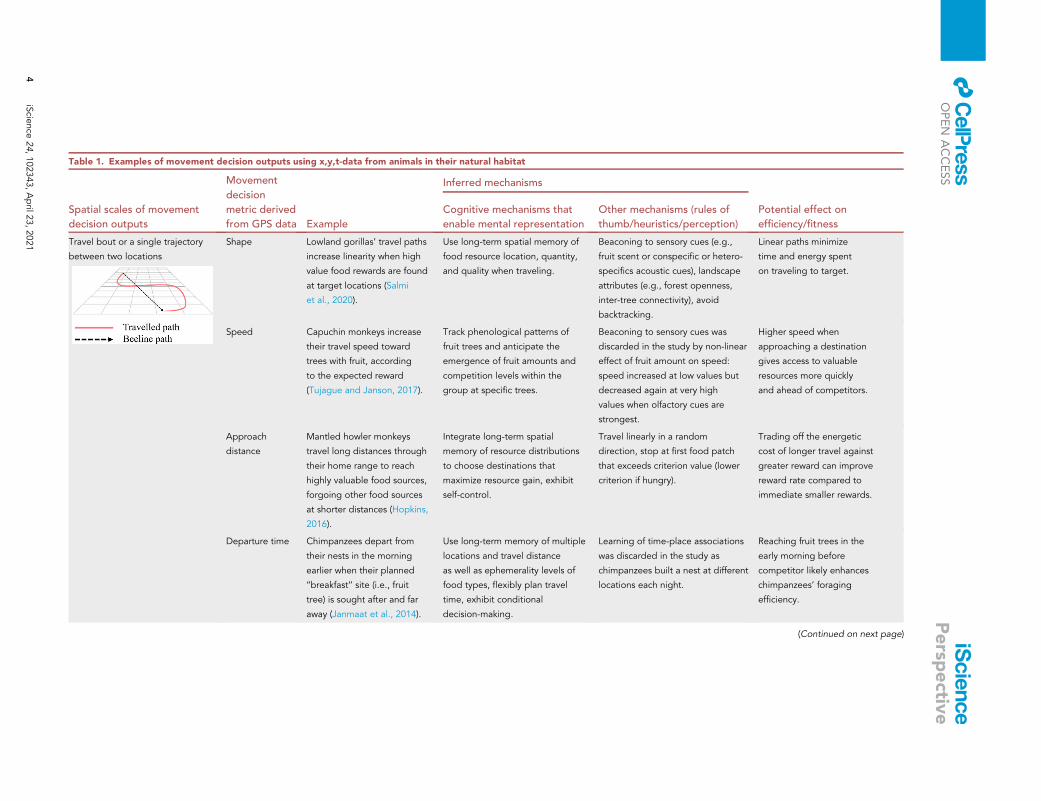
Table 1. Examples of movement decision outputs using x,y,t-data from animals in their natural habitat
Spatial scales of movement
decision outputs
Movement
decision
metric derived
from GPS data Example
Inferred mechanisms
Potential effect on
efficiency/fitness
Cognitive mechanisms that
enable mental representation
Other mechanisms (rules of
thumb/heuristics/perception)
Travel bout or a single trajectory
between two locations
Shape Lowland gorillas’ travel paths
increase linearity when high
value food rewards are found
at target locations (Salmi
et al., 2020).
Use long-term spatial memory of
food resource location, quantity,
and quality when traveling.
Beaconing to sensory cues (e.g.,
fruit scent or conspecific or hetero-
specifics acoustic cues), landscape
attributes (e.g., forest openness,
inter-tree connectivity), avoid
backtracking.
Linear paths minimize
time and energy spent
on traveling to target.
Speed Capuchin monkeys increase
their travel speed toward
trees with fruit, according
to the expected reward
(Tujague and Janson, 2017).
Track phenological patterns of
fruit trees and anticipate the
emergence of fruit amounts and
competition levels within the
group at specific trees.
Beaconing to sensory cues was
discarded in the study by non-linear
effect of fruit amount on speed:
speed increased at low values but
decreased again at very high
values when olfactory cues are
strongest.
Higher speed when
approaching a destination
gives access to valuable
resources more quickly
and ahead of competitors.
Approach
distance
Mantled howler monkeys
travel long distances through
their home range to reach
highly valuable food sources,
forgoing other food sources
at shorter distances (Hopkins,
2016).
Integrate long-term spatial
memory of resource distributions
to choose destinations that
maximize resource gain, exhibit
self-control.
Travel linearly in a random
direction, stop at first food patch
that exceeds criterion value (lower
criterion if hungry).
Trading off the energetic
cost of longer travel against
greater reward can improve
reward rate compared to
immediate smaller rewards.
Departure time Chimpanzees depart from
their nests in the morning
earlier when their planned
‘‘breakfast’’ site (i.e., fruit
tree) is sought after and far
away (Janmaat et al., 2014).
Use long-term memory of multiple
locations and travel distance
as well as ephemerality levels of
food types, flexibly plan travel
time, exhibit conditional
decision-making.
Learning of time-place associations
was discarded in the study as
chimpanzees built a nest at different
locations each night.
Reaching fruit trees in the
early morning before
competitor likely enhances
chimpanzees’ foraging
efficiency.
(Continued on next page)
llOPEN
ACCESS
4iScie
nce
24,102343,April2
3,2021
iScience
Persp
ectiv
e

Table 1. Continued
Spatial scales of movement
decision outputs
Movement
decision
metric derived
from GPS data Example
Inferred mechanisms
Potential effect on
efficiency/fitness
Cognitive mechanisms that
enable mental representation
Other mechanisms (rules of
thumb/heuristics/perception)
Daily path Shape (e.g.,
change points)
White handed gibbons’
significant directional
changes are located at
preferred fruit trees that
are ripening (Asensio
et al., 2011).
Use spatial memory of location of
preferred fruit trees and plan direct
travel bouts between them.
Beaconing to sensory cues or
landscape attributes surrounding
the fruit trees produce goal-
directed movement.
Iterative goal-directed
movement toward locations
where biologically meaningful
events are likely to occur (e.g.,
fruit ripening) increases
likelihood of reaching these at
optimum times.
Order of visits Bumble bees optimize
the order in which nectar
flowers are visited with
experience based on the
distance between resources
and the production of
pollen and nectar in each
flower (Lihoreau et al., 2010).
Use long-term memory of multiple
locations and travel distance as
well as food amount, compute
shortest path connecting a set of
flowers, exhibit route planning.
Beaconing to sensory cues,
random search, nearest neighbor
rule (e.g., move to nearest feeding
site consistently), convex hull
strategy (e.g., approach feeding
sites based on their distance to the
edge of the feeding area).
Minimizing overall distance
traveled between
destinations saves time and
energy, maximizes reward rate.
Weekly, monthly, annual,
multi-annual paths
Revisits Mangabey monkeys avoid
revisiting trees they
depleted during previous
visits and monitor those
they did not feed in yet
(Janmaat et al., 2006).
Use long-term spatial memory of
recent feeding events and their
locations.
Beaconing to sensory cues was
discarded in the study as both tree
types did not bear fruit, random
search was discarded as revisiting
patterns were not random.
Avoiding previously visited
and depleted feeding sites
saves time and energy.
Path recursion/
overlap
African elephants repeatedly
reuse paths in the periphery
of their home range but
engage in more flexible
movements within the core
area (Presotto et al., 2019).
Use a vector (coordinate-based)
or network map in familiar areas
while relying on landmarks and
memorized routes outside of
familiar areas.
React to landscape attributes
(e.g., steep slopes and availability
of substrate to navigate) that can
constrain movement in the
periphery.
Reuse of known paths
minimizes energetic cost of
travel in heterogeneous/
unfamiliar landscape; flexible
movement allows shorter travel
between targets and fosters
exploration for new resources.
Path networks Bees travel between flowers
more optimally with increasing
experience but only at large
spatial scales when the cost of
non-optimal foraging behavior
is thought to be higher
(Pasquaretta et al., 2017).
Use a vector (coordinate-based)
or network map of the large-scale
resource distribution, compute
approximate optimal path
connecting set of targets at large
spatial scales.
Beaconing to sensory (panoramic
visual) cues when navigating in
large-scale space but not in
small scale space. Using information
of distant valuable locations
from others in the nest (waggle
dance).
Minimizing overall distance
traveled between destinations
saves time and energy,
maximizes reward rate.
Also shown are inferred cognitive mechanisms as potential explanations and the hypothesized effect of these outputs on efficiency/fitness.
Related literature: (1) travel bout [shape: Jang et al., 2019; Janmaat et al., 2006; Normand and Boesch, 2009; Toledo et al., 2020; speed: Jang et al., 2019; Janmaat et al., 2006; Noser and Byrne, 2007; Tujague
and Janson, 2017; approach distance: Ban et al., 2014; Polansky et al., 2015; departure time: Abrahms et al., 2019; Bracis and Mueller, 2017]; (2) daily path [shape: Byrne et al., 2009; de Guinea et al., 2021;
Janmaat et al., 2013; order of visits: Lihoreau et al., 2010; Riotte-Lambert et al., 2017; Teichroeb, 2015]; and (3) weekly, monthly and annual paths [revisits: Berger-Tal and Bar-David, 2015; Bracis et al.,
2018; Janmaat et al., 2013; path recursion/overlap: Bracis and Mueller, 2017; de Guinea et al., 2019; Di Fiore and Suarez, 2007; Presotto et al., 2019; Presotto and Izar, 2010; path networks: Green et al.,
2020b; Latty et al., 2011; Pasquaretta et al., 2020].
llOPEN
ACCESS
iScie
nce
24,102343,April2
3,2021
5
iScience
Persp
ectiv
e

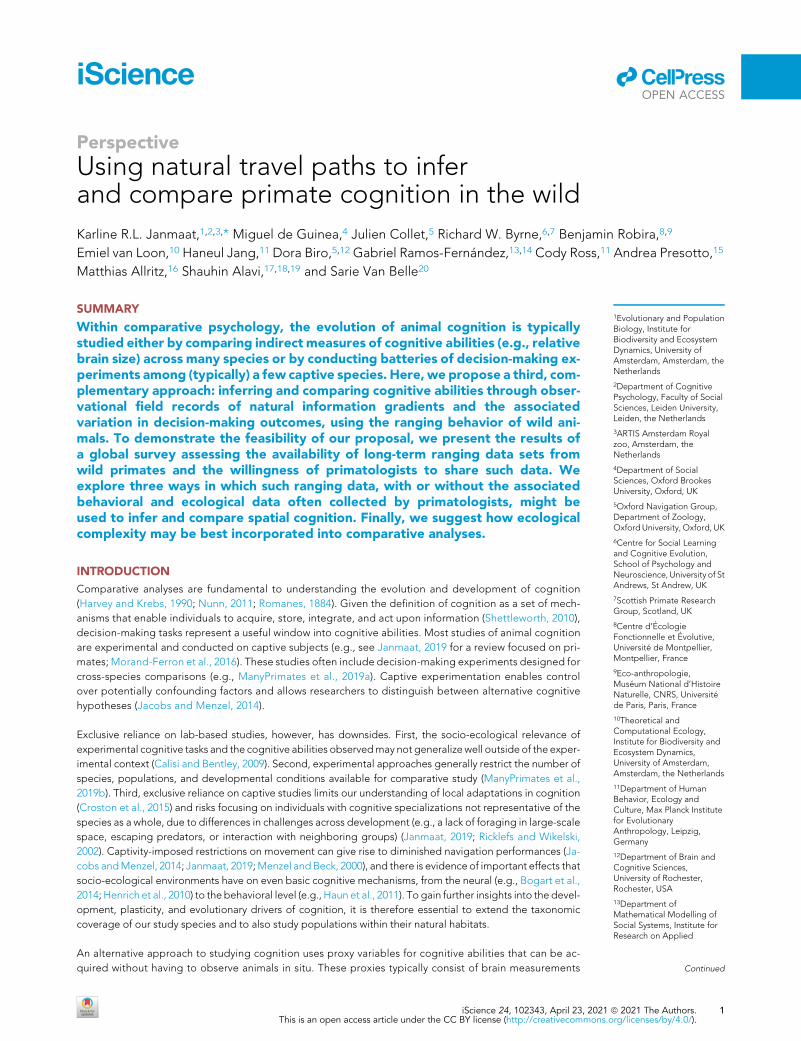
Figure 1. Results from the global survey
(A–D) (A) Cladogram showing the primate genera represented in the survey (gray); percentages of studies according to
(B) their duration, (C) the frequency with which GPS waypoints were recorded, and (D) the accuracy of the GPS unit(s) at the
field site.
llOPEN ACCESS
iSciencePerspective
outcomes recorded in the movement patterns of wild primates. We present three conceptual approaches
to analyzing such ranging data. We conclude with a discussion of how estimates of ecological complexity
can be improved and incorporated into our proposed comparative analyses.
SURVEY ON AVAILABILITY OF PRIMATE RANGING DATA
We invited over 300 primatologists to fill in a survey about ranging data for each of their field sites and study
species. Although our survey does not represent an exhaustive list of field researchers, it appears nonethe-
less largely representative of the variation in the field. In the survey, 177 entries from 123 primatologists
indicate that ranging data have been collected as part of their field protocols. The data represent at least
105 species (Figure 1A) at 120 field sites, representing 164 primate populations in 36 countries.
Most studies (72%) lasted >1 year (Figure 1B). Slightly over half (55%) collected ranging data relatively
frequently (at % 15-min intervals, Figure 1C), and these data were accurate to at least a 10 m radius in
77% of the studies (Figure 1D). In addition, respondents also indicated that they collected data on the study
subjects’ behavior (83%), food tree locations (69%), sleep tree locations (64%), food availability (55%), and
nutritional values of food items (23%). Topographic information is freely available online via open-source
repositories, but 31% of the participants reported having high resolution topographical information of their
study area. Laser Imaging Detection and Ranging (LiDAR) information on forest structure is available in only
6% of the cases.
Only 10% of the respondents indicated that they had published all aspects they had planned pertaining to
their ranging data. Many respondents had either published part (42%) or none (48%), respectively. Clearly
there is a wealth of ranging data that have not been made available through publications. Furthermore,
89% of respondents claimed that they would be willing to share their ranging data (only 9% said that
they would like to publish prior to data sharing, and only 2% of respondents said that they had reservations
toward sharing their data).
THE COMPARATIVE APPROACH: LINKING DECISION-MAKING OUTCOMES TO
VARIATION IN INFORMATION GRADIENTS IN NATURAL HABITATS
In controlled experiments, cognition can be empirically studied by manipulating the amount of infor-
mation provided to study subjects and subsequently examining how it affects their behavioral
6 iScience 24, 102343, April 23, 2021

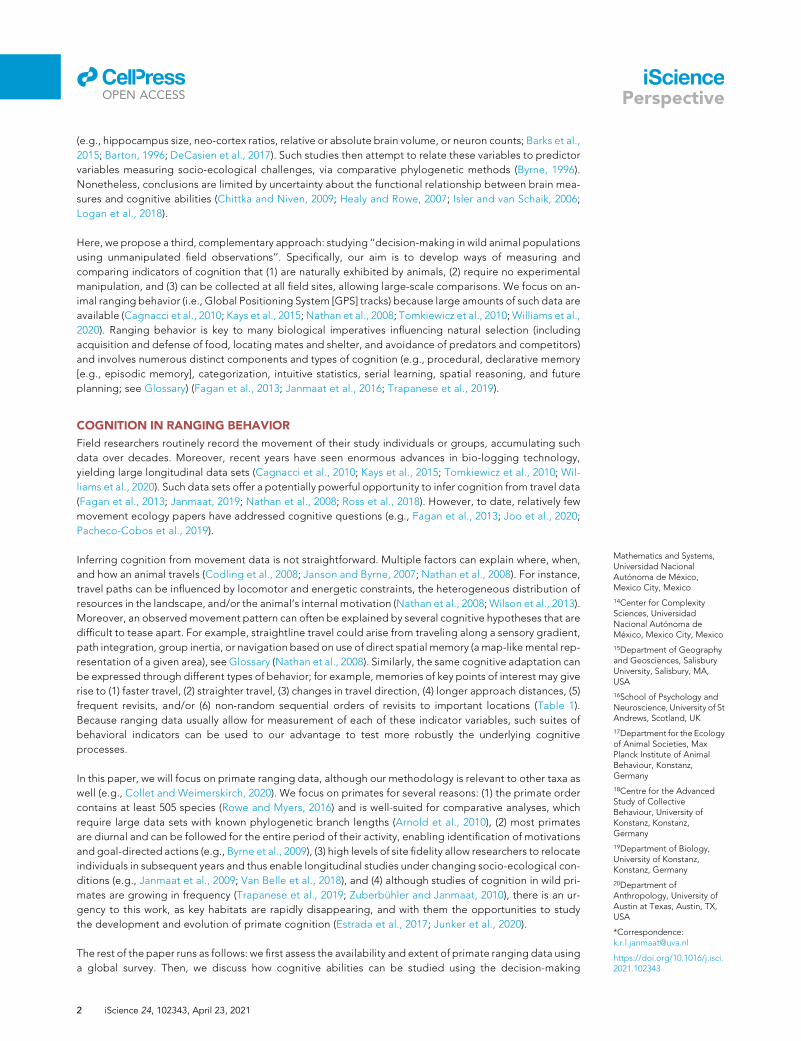
Figure 2. Graphic representation of the comparative
framework
Cognition can be studied in each species or population
in the wild by comparing behavioral decision outputs
(e.g., travel path linearity) when primates are naturally
provided with different input of information (e.g.,
ranging within familiar vs less familiar areas). In this
hypothetical example, we expect a spider monkey and
baboon group (solid line and dotted line, respectively;
slopes >0) but not a colobus group (dashed line; slope
�0) to increase travel linearity with increasing familiarity
with the area, suggesting more effective spatial
learning in the first two groups but not in the latter.
llOPEN ACCESS
iSciencePerspective
outcomes (Shettleworth, 2010). For our comparative approach, we propose examining the correlation
between a measure of the variation in information available to wild animals (the ‘‘information gradient’’)
and the ranging decisions they make in their natural habitats. For example, an increasing number of
visits to a specific area should increase an animal’s experience with that habitat and thus give an indi-
rect measure of acquired information. We can then measure the characteristics of a travel path (a ‘‘de-
cision output’’) to assess whether travel paths between key points of interest within a habitat become
more efficient (e.g., more linear) with increasing information/experience. The resulting regression slope
between these two variables (e.g., past visits and path linearity) then gives insight into the cognitive
process of the animal (Figure 2). For example, with repeated visits, animals are expected to learn
through repeated trial and error and navigate to rewarding locations more efficiently as memories of
locations, route directions, and intermediate landmarks become more salient and accurate. When in-
dividuals revisit the area, this ever more precise information can become available to spatial cognitive
processes like view matching and path integration, leading to further increases in path linearity. Addi-
tional examples of cognitively relevant decision outputs and natural gradients in information available
to animals are provided in Tables 1 and 2. Table 1 provides a detailed overview of what potential cogni-
tive processes can be inferred, ranging from making cognitive representations to using rules of thumb.
For decision outputs, we focus on movement decisions, but the same idea could be applied to other
behavioral measures. Likewise, we focus on information accumulated through experience, but mea-
surements of empirical environmental gradients such as a gradient of fruit odor can also be analyzed
(e.g., see our third example in the last row of Table 2).
Standardizing themeasures of information andbehavioral output across different individuals, social groups,
populations, or specieswill enable us to compare cognitiveperformances andprocesses (Figure 2). The next
step is then to investigate the evolutionary drivers of differences in cognitive processes by designing multi-
variate statistical models that integrate socio-ecological complexity variables, potential confounding fac-
tors, and phylogenetic controls. In the following three sections, we detail three examples of such models
as ‘‘in-concept’’ approaches to investigate the evolution and development of cognitive abilities.
EXAMPLE 1: LINEARITY OF TRAVEL
When a primate makes a beeline from one resource to another over distances well exceeding its line of
sight, it might seem obvious that it has used spatial knowledge to compute an efficient path, but there
are many other possibilities (Byrne, 2000). Perhaps, although the resource itself is only visible at close
range, it may be reliably associated with long-distance cues: a small waterhole, for instance, may be de-
tected at long range by tall trees that only grow there; fruit-eating birds, such as hornbills or toucans,
can visually scan vast areas of forest to detect trees with ripe fruit, and their subsequent flight paths and
calls may be used as cues by primates; a whole tree of ripe fruit may even emit a scent plume that primates
can simply home in upon. Even where subtle cues can be ruled out, traveling on a linear pathmay not reflect
optimal efficiency (de Guinea et al., 2019; Guilford and Biro, 2014; Jang et al., 2019). Least-effort paths will
depend on environmental features: slope angles, obstruction by cliffs or vegetation, and diversions to
iScience 24, 102343, April 23, 2021 7

Table 2. Examples of natural gradients in information available to animals making movement decisions, which can
be measured to study cognition in the wild
Information gradient associated
with variation in .
Quantification of information
gradient Related literature
. How many times a place has been
previously visited
Number of previous visits recorded
at location
Janmaat et al. (2013)
How long animals have been ranging
in the area
Time elapsed since first records of
presence in the area
Isbell et al. (1990, 1993)
Age or experience of group members Mean or maximum age of group
members
Teitelbaum et al. (2016)
How long ago a location was last visited Time since last visit Benhamou and Riotte-
Lambert (2012); Watanuki
et al. (2003)
Regularity of previous visits (clustered
or regularly spaced in time)
Variance in delay between past
consecutive visits to location
Henderson et al. (2006)
Sensory access to cues or goals (visibility
from topography, vegetation density,
weather; wind direction; etc.)
Distance/direction to nearest cue
relative to estimated max perception
distance/direction
Janmaat et al. (2006, 2013);
Noser and Byrne (2007)
llOPEN ACCESS
iSciencePerspective
exploit foraging opportunities along the way. And in the absence of any spatial knowledge, highly linear
travel (a correlated random walk; Ross et al., 2018) between resource patches is a good heuristic strategy
that avoids wasteful backtracking. As such, since it makes sense to slow or stop when a valuable resource is
encountered, observations of beeline travel ‘‘to’’ a resource may result even when no spatial knowledge
was involved in the decision-making process.
These difficulties mean that studies successfully using travel paths to index primate knowledge of large-
scale space have been restricted to those with very detailed recording of individual animals’ foraging
histories (Janmaat et al., 2006), estimations of detection distances and elaborate survey data of nutri-
tional and other resources over the entire home range (Jang et al., 2019; Janmaat et al., 2013), or others
who simply grabbed lucky breaks, where opportune circumstances have set up a ‘‘natural experiment’’
in the field (Garber, 1989). Here, we propose an approach that can be applied more generally, even
when only x,y,t-data (x and y coordinates plus time) are available: by analyzing ‘‘how primates improve
their route linearity with experience’’. If we observe that travel gradually increases in linearity, in less
frequented areas, from the first to the last time an individual traveled between two points of interest,
and we have reasonable evidence that the conditions of movement (e.g., obstacles, motivation) do not
vary much between the first and last visits, then we can make a strong case for information use and
spatial cognition. To test such predictions, hierarchical regression models can be used to test for a sig-
nificant positive slope between linearity (the decision output) and experience (the information
gradient). In principle, the rate of increase in linearity with experience is an index of spatial cognition
that can be compared between different populations and species (Figure 3). To do so, confounding
factors that are measurable across data sets (e.g., slope, distance to the goal, visibility of the goal, vari-
ance in approach direction) can be included as covariates, with additional controls for individual- or
group-specific factors (random effects).
More generally, we can test how travel linearity between points of interest in large-scale space depends on
the time elapsed between successive visits to compare the length of memory windows. In addition, we can
measure effects of visit regularity (variance in time between previous successive visits), the duration of pre-
vious visits, and the profitability of previous visits. Comparison between the core range of a group and pe-
ripheral areas can also help: in highly familiar areas, we might expect spatial knowledge to be at a plateau,
but in peripheral areas, repeated visits may increase movement efficiency. The factors needed to test such
predictions are, in principle, extractable from pure x,y,t-data.
Finally, we can use this general approach to test specific comparative hypotheses about the evolution of
cognition, by including predictor variables that are indicative of the challenges faced by each primate
group. For instance, we might expect that learning would be more effective in species that necessarily
8 iScience 24, 102343, April 23, 2021

Linearity
0
0.5
1
1 3 5 7 9
Visit
0
0.5
1
1 3 5 7 90
0.5
1
1 3 5 7 90
0.5
1
1 3 5 7 9
Frugivory gradient
Primate grouPrimate grouPrimate group A Primate gro B C D
Figure 3. Illustration of a design for a comparative analysis of spatial performance
Each data point represents linearity values (decision output) of a travel path at the xth number of visits to the same end
location (the information gradient). We predict a correlation between the regression slopes and a descriptor of an
ecological challenge in the primate group’s environment, such as percentage of fruit, or the average ephemerality level of
the fruit species in the diet. Pairs of given start and end locations should be included as a random effect in the regression
model. The presented data are hypothetical.
llOPEN ACCESS
iSciencePerspective
confront higher ecological complexity. The percentage of fruit in the diet has often been used as a proxy for
foraging complexity: we might expect the slope of the relationship between experience and travel linearity
to be steeper in more frugivorous species (Figure 3).
In cases where only x,y,t-data are available (i.e., points of interest are not known from focal observation), the
researcher can make use of significant change points in travel trajectories to identify key locations of inter-
est (Asensio et al., 2011; Byrne et al., 2009; de Guinea et al., 2021; Janmaat et al., 2013). Results of such an-
alyses can subsequently be compared to results gleaned from populations in which more detailed behav-
ioral and ecological data from on-the-ground focal follows are available (e.g., food tree locations), in order
to assess their robustness. Annotated data on group size could, in addition, distinguish individual knowl-
edge from collective knowledge in fission-fusion societies or during dispersal activities.
For this approach to work, one needs to account for variation in how data were collected across sites and
populations. To estimate familiarity, several methods are available (see Kie et al., 2010), but utilization dis-
tributions (location or movement-based kernel density estimates; Benhamou, 2011; Noonan et al., 2019)
are now widely used to define animals’ home ranges and estimate space usage based on x,y,t-data. Our
approach can be similarly useful for exploring the effects of between-group and between-population vari-
ation in ecological variables within species.
EXAMPLE 2: ROUTE NETWORK EFFICIENCY
Our second example concerns a comparative analysis of travel efficiency of different primate groups, where
familiarity with different areas of the home range represents the information gradient. Within a home
range, primates learn to travel efficiently toward many resource sites. To do so, individuals may calculate
a novel path from their current location to the target or they may travel along previously used paths. The
first option requires individuals to memorize and calculate distances and angles among many locations
(Garber, 2000; Tolman, 1948) and has been reported in only few primate populations (chimpanzees, Pan
troglodytes, Normand and Boesch, 2009; black capuchin monkeys, Sapajus nigritus, Presotto and Izar,
2010; humans, Homo sapiens, Haun et al., 2011). The latter option, considered ubiquitous among primate
species (and other animals; Trapanese et al., 2019), is thought to be less cognitively demanding. Less in-
formation needs to be stored when restrictingmovements to a finite number of travel paths that are repeat-
edly traveled (de Guinea et al., 2019; Green et al., 2020a; Warren, 2019). Recurrent travel through the same
areas allows individuals to generate a network of habitually used routes joined by ‘‘nodes’’, locations where
movement decisions take place (Garber, 2000; Perna and Latty, 2014; Presotto et al., 2018). Though less
cognitively demanding, route networks can differ dramatically in complexity and efficiency across groups,
iScience 24, 102343, April 23, 2021 9

llOPEN ACCESS
iSciencePerspective
populations, and species (Gallotti et al., 2016), even when controlling for the number of nodes and environ-
mental attributes (Barrat et al., 2005; Perna and Latty, 2014).
We propose that comparing route network structure across different populations can provide powerful in-
sights into their relative spatial competence: specifically, their ability to construct networks that optimize
travel effort among a set of resource sites. To do so, we need standardized methods for determining
the location of routes and nodes. The Habitual Route Analysis Method tool (HRAM; script available on
Git-hub: https://github.com/apresotto/Habitual-Route-Analysis-Method) identifies habitual routes sys-
tematically (Curry and Presotto, 2018). The detection of nodes can be systematized by applying the change
point test (CPT; Byrne et al., 2009) to the movement patterns of the study population. If significant direc-
tional changes are detected in the proximity of an intersection between habitual routes, we may conclude
that the study population takes directional decisions at this location and, therefore, that the location can be
considered as a node within the route network (Presotto et al., 2018).
Route networks can then be compared across groups or populations at different, complementary levels to
enhance our understanding of the variation in cognitive capacity (e.g., learning speed and long-term memory
storage) across primate species. First, we can gain insight into the complexity of a route network by calculating
the number of nodes and the links between them. Second, by characterizing the structure of networks as
weightedgraphs, we can infer the efficiency and complexity of these networks (Barthelemy, 2011). For instance,
calculatinghowmany timeseachnodeappears in the shortest pathbetweenotherpairs of nodes (i.e., between-
ness centrality) or how connected it is to other well connected nodes (i.e., eigenvector centrality) will indicate
whether primates primarily navigate through a limited set of nodes to reach their goals or use a large number
of nodes at comparable frequencies (Bast et al., 2016; Figure 4). Third, we can also quantify the information
involved inmakingmovementdecisionsusingentropy-derivedmeasuresasproxies for thecognitive load faced
by individuals (Gallotti et al., 2016). For instance, themore interconnected and complex a route network is, the
more information will be required to compute movement decisions through it (Gallotti et al., 2016).
Route networks generated by wild primates are also influenced by landscape attributes and the spatial dis-
tribution of food resources (de Guinea et al., 2019; Presotto et al., 2018). To investigate the efficiency of an
empirical route network on a given landscape, it is therefore important to compare the network structure
of the observed movement patterns against those of simulated networks. Simulations based on random
walk patterns (Suarez et al., 2014) canbe conductedusing themetrics ofmovement patterns (e.g., step length,
turning angle, probability of behavioral shifts; Patterson et al., 2008) observed in agiven species or population
and can include a resistance layer that reflects the probability that study subjects move across different land-
scape attributes (e.g., steep slope; Quaglietta and Porto, 2019). We can then use HRAMandCPT to construct
a route network and determine nodes for the simulated data (Figure 4) sets and subsequently compare the
observedand simulatednetworks by themean route factor (or detour index) to calculate a relativemean route
factor. This is a commonmeasure of efficiency based on the difference between the direct Euclidean distance
between pairs of nodes and the shortest possible distance between them along routes within the route
network (Barthelemy, 2011). We would predict that primate species with more flexible spatial cognitive abil-
ities would show networks with lower mean route factors than those of simulated networks.
If route network complexity indeed varies with spatial cognition, the value of the relative mean route factor
should decrease with experience in the landscape. To test this, we can design a hierarchical regression
model that includes the difference between the mean observed route factor with the simulated one as a
response variable and the familiarity of the primate group with different areas in home range (e.g., the
core areas versus the periphery) as a predictor variable. Specific comparative hypotheses about the devel-
opment and evolution of spatial cognition can be examined by adding socio-ecological descriptors of each
primate group as covariates in the statistical model.
EXAMPLE 3: CONSTANCY AND CONTINGENCY OF REVISIT INTERVALS
With many important food resources only available at scattered locations in the landscape and during
limited time periods (Janmaat et al., 2016; Milton, 1981), cognitive abilities that enable a primate to
know when to go where are expected to be crucial for efficient foraging. A food source may be depleted
by competitors if an individual arrives late, but an early arrival canmean that energy is wasted in locomotion
to a food source that is not yet consumable (Janmaat, 2019). Our third example concerns assessing primate
species’ abilities in acting upon spatiotemporal variation in food availability. Our approach builds on the
10 iScience 24, 102343, April 23, 2021

Figure 4. Graphical representation of route network efficiency
(A) observed ranging patterns of four wild populations and the corresponding route networks described after applying
the Habitual Route Analysis Method tool and change point test. (B) Simulated random ranging patterns based on metrics
(e.g., step length, turning angle) derived from the observed movement patterns of each population. Colors indicate the
number of times that the study populations traveled between a given pair of nodes. The presented data are hypothetical.
llOPEN ACCESS
iSciencePerspective
concepts of ‘‘constancy’’ and ‘‘contingency’’, introduced by Colwell (1974) to describe periodic and uncer-
tain phenomena—mainly environmental variables—in nature. More recently, Riotte-Lambert and Matthio-
poulos (2020) proposed that these concepts are wide-ranging constraints that dictate foraging strategies
and survival across animal species.
Average patterns in resource visit schedules may provide clues about the use of learning and memory to
model spatiotemporal variation. We propose two measures (decision outputs) to express this average
pattern, corresponding to the environmental regularities in constancy and contingency: (1) ‘‘regularity’’
(the constancy in interval between revisits to a food patch), and (2) ‘‘connectedness’’ (the degree to which
visits to food patches can be predicted from the food patches visited prior). Both measures have been
applied in recursive movement analysis (Berger-Tal and Bar-David, 2015; Morrison et al., 2021). We hypoth-
esize that revisiting at regular intervals reflects an awareness of periodic resource availability or regenera-
tion time (e.g., ripening fruit, nectar replenishment) and that revisiting correlated with prior food patches
reflects an awareness of relationships among different food resources (e.g., non-seasonal but synchronous
fruiting). For example, if a primate has learned that certain fruit species emerge simultaneously, this may be
reflected in a higher connectedness for food sources belonging to this species (Figure 5). These two mea-
sures can thus be used as proxies for spatiotemporal cognition; their variation with experience in each envi-
ronment provides an index of the species’ use of cognition in dealing with predictable variation. An analysis
of the temporal pattern in which patches are visited complements our example 2 in which the spatial effi-
ciency of a route was evaluated using network metrics. A spatial network of visits could appear as inefficient
because of the temporal correlation between visited patches: two patches that are far apart could be
visited in sequence precisely because of their synchronous fruiting timing.
To derive regularity and connectedness metrics from x,y,t-data, we first need to operationalize a ‘‘food
patch’’ (e.g., a location where the animal was stationary or engaged in highly tortuous movement for a
given period of time) and then represent patches and the trajectories between them as a directed graph
depicting spatial (patch locations), temporal (visit order), and topological (connectedness) characteristics
(Figure 5A; Pasquaretta et al., 2020). Regularity is measured by the coefficient of variation in the time it takes
for a primate group to return to a patch visited before (Figure 5B). Connectedness is calculated by first es-
tablishing a frequency matrix summarizing (for all patches) the frequencies with which two patches are
visited in sequence (effectively a Markov transition matrix, Figure 5C) and subsequently calculating Cram-
er’s V for this matrix. This matrix quantifies the association between its rows (arrival patch) and columns (de-
parture patch) (Figure 5C). The higher the association between the rows and columns, the higher the
iScience 24, 102343, April 23, 2021 11

1 2 3 2 1 3 1 2
Time sequence:
a b c d e f g h
Res
ourc
e
t
From patch
FREQUENCY MATRIX:
To p
atch
1 2 3
3
2
1
2b,h
1 f
1e
1c
1g
1d
From patch
SPATIAL MATRIX:
To p
atch
1 2 3
3
2
1 0
100
175
100
0
150
175
150
0
Primate group A
1 1 1 1 12 2 2 2 23 3 3 3 3
1 2 3Revisit interval cv: = 0.82 = 0.82 = 0.5
Primate group B
1 1 1 1 12 2 2 2 2 3 3 3 3 3
1 2 3Revisit interval cv: = 27.31 = 5.72 = 8.37
A C
B
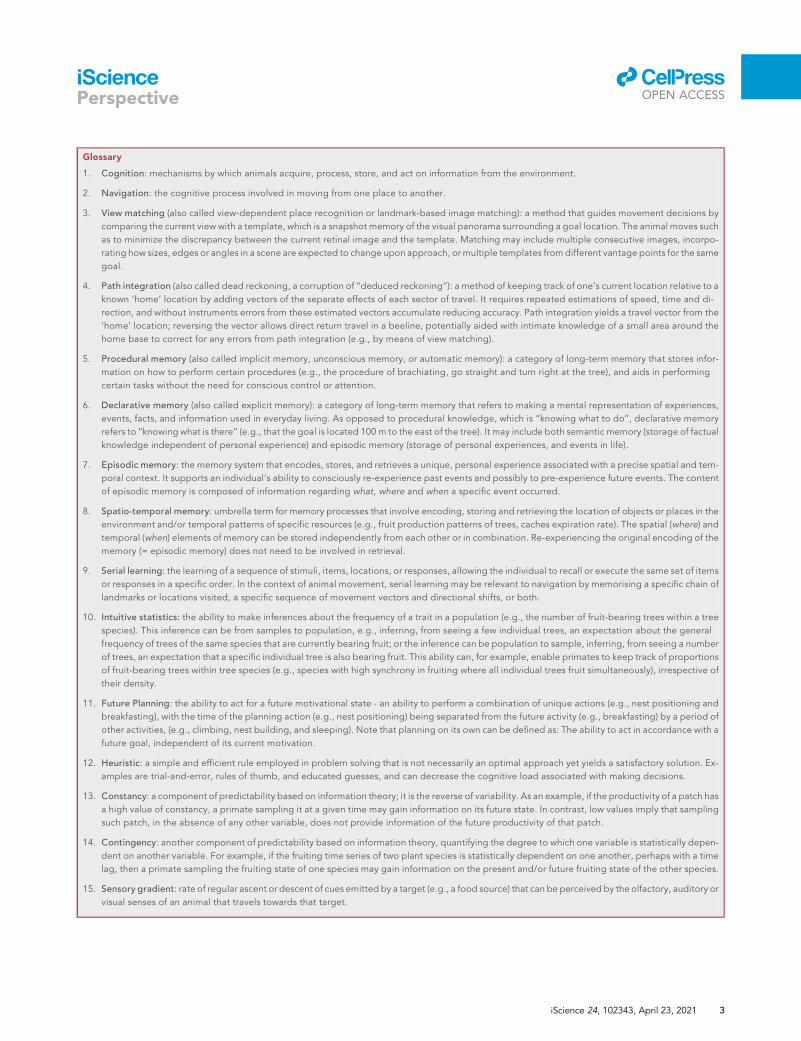
Figure 5. Illustration of a temporal pattern analysis using constancy and contingency to compare cognition
(A) Schematic example of x,y,t-movement data translated into a travel network with locations of three food patches
(identified by numbers) belonging to two species (identified by color) as nodes, interconnected by travel paths (identified
by letters). The arcs depict the geographical location of the travel paths and are colored according to the patch where
they originate. The time sequence below the travel network is subdivided into equal-duration segments, showing both
the order of visiting the patches as well as the time spent within each patch. A segment during which a food patch was
visited is colored according to the corresponding patch color, and the numbers corresponding with the different travel
paths are shown below in the time sequence. In this example, each of the two species has its own fructification pattern
with similar length but not overlapping in time. Both species fruit synchronously—here represented by the use of two
Gaussian distributions with small variance.
(B) Two distinct time sequences of food patch visits, illustrating revisit patterns associated with high regularity values
(group A, upper sequence) and low regularity values (group B, lower sequence). Group A is characterized by regular revisit
intervals and (corresponding) low coefficients of variation; group B shows the reverse: irregular revisit intervals and a high
coefficient of variation. It is noteworthy that the constancy of revisit intervals may be different for different patches (as
apparent in the second timeline) and can thus be analyzed at multiple levels to reveal more about the function of different
patches.
(C) Two matrices, summarizing the situation shown in the travel network in A. In the spatial matrix, each cell shows the
geographical distances between two patches that were visited consecutively. In the frequency matrix, each cell shows the
number of times two patches were visited consecutively; for example, the number 2 in the first column states that there are
two travel paths that originate at patch 1 and lead to patch 2. This matrix can be treated as a contingency table, and the
overall strength of association between the categories in the rows and columns can be expressed by Cramer’s V.
llOPEN ACCESS
iSciencePerspective
connectedness of ranging and the better one can predict the sequence in which patches are visited. In or-
der to control for the spatial relationships between patches, which could be a simple reason why patches
are visited in sequence, one can calculate the expected sequential visit matrix based on spatial proximity
between patches and subsequently calculate the chi-squared statistic and Cramer’s V. This estimate of
Cramer’s V expresses strength of association among food patches, after taking spatial proximity into ac-
count. Another way to control for spatial proximity would be to compare the observed sequences of visits
to the sequence that would be obtained by visiting patches along the shortest path between patches, as in
12 iScience 24, 102343, April 23, 2021

llOPEN ACCESS
iSciencePerspective
our second example. If the observed sequence is different, reflecting the species identity of synchronous
species rather than the spatial relationships between patches, then again, we would have evidence that
spatiotemporal cognition is playing a role in determining an animal’s sequence of visits.
As with examples 1 and 2, we propose to relate these decision outputs (regularity and connectedness) to an
information gradient: experience. Experience may be measured between groups—e.g., by contrasting the
maximum or mean age of group members—or within groups—e.g., by changes in group composition
over years. Other things being equal, positive correlations between experience and regularity or connected-
ness suggest learning to exploit seasonal patterns of resource availability. (In contrast, an increase in the use
of sensory ability would lead to more opportunistic food patch use, rather than revisiting previously used re-
sources at regular intervals.) The analysis would again use a hierarchical regression model design, with reg-
ularity or connectedness as a response variable, experience as a predictor variable, and group as a random
effect. If foodavailability data are present, the connectednessmodel couldbeextendedby includingan inter-
action between experience and the synchrony level of the respective food patch species, predicting that
more experienced primate groups will performwith a higher connectedness, but only for highly synchronous
food species. Finally, socio-ecological descriptors could be added in a similar way as was proposed for ex-
amples 1 and 2, and, as an extension, it would also be revealing to first measure constancy and contingency
of crucial resources within the home ranges for the primate groups to evaluate whether these environmental
indices explain the corresponding movement-based counterparts (regularity and connectedness).
INCLUDING ECOLOGICAL CHALLENGES INTO COMPARATIVE ANALYSES
The ultimate aim of our approach is to gain insight into the evolution and development of spatial cognition.
For this, we propose to include in the comparative phylogenetic models, for each conceptual analysis, the
estimates of the socio-ecological descriptors that primates face in their natural environment. Our survey re-
vealed that currently a substantial amount of data are available to estimate ecological descriptors for many
primate groups, populations, and species. Below, we discuss briefly how we can use such data to improve
traditional descriptors and in what way such descriptors can best be included into our proposed models.
Several comparative phylogenetic studies have suggested that ecological complexity is an important
driver of the evolution of animal cognition (Barton, 1996; Croston et al., 2015; DeCasien et al., 2017; van
Woerden et al., 2010, 2012). However, when we look at specific measures of ecological challenges, these
seem disappointingly simplistic: home range size, range overlap, percentage of fruit in the diet, seasonality
of foods. Though readily available, these broad parameters may not be sufficient for describing the envi-
ronmental complexity that a successful forager must navigate.
For instance, the positive relationship between percentage of dietary fruit and spatial memory or a rela-
tively larger brain (Barks et al., 2015; Barton, 1996; DeCasien et al., 2017; Rosati, 2017) may imply that in-
dividuals with a larger spatial memory or hippocampus are better at finding low-density food, such as fruit,
especially when locomotor costs are high (Janmaat, 2019; Janmaat et al., 2016). However, the positive rela-
tionship could equally mean that energy-rich food, such as fruit, enables larger brains and ‘‘more costly’’
cognition to be maintained (Barton, 1996; DeCasien et al., 2017) or that energy-poor food requires larger
guts to digest and hence larger bodies, so ‘‘relatively’’ smaller brains may be a consequence of selection on
body size (Byrne, 1996). To distinguish between these explanations, we need more detailed measures of
the ecological challenges faced and more rigorous thinking about our model designs. For example, we
can include the mean ephemerality levels or spatial density of the different fruit species in the diet as pre-
dictor variables, while controlling for the percentage of dietary fruit. In more than half of the studies from
our survey, food availability data have been collected, making the testing of such a model a realistic pos-
sibility. Such amodel could providemuchmore convincing evidence that brain evolution was indeed driven
by the ecological challenge of finding ephemeral foods (Houle et al., 2014; Janmaat et al., 2014, 2016).
With the growing variety and amount of ecological data now being collected by field researchers, the range
of complexity indicators can be extended. Specifically, we can use some of the detailed measures devel-
oped by ecologists to describe the ecological complexity of a system (reviewed in Beissinger and Gibbs,
1993; Parrott, 2010). To narrow down the number of measures, we recommend first asking what ‘‘handles’’
primates can use to predict the environment. For instance, since we know that the synchronous appearance
of certain fruits helps monkeys to forage efficiently (de Guinea et al., 2021; Janmaat et al., 2012; Menzel,
1991), variation in fruiting synchrony could be a candidate ecological challenge. Other examples of
iScience 24, 102343, April 23, 2021 13

llOPEN ACCESS
iSciencePerspective
ecological challenges that can be tackled by use of cognition are the variation in fruit production intervals
between individual trees or their productivity (Janmaat et al., 2016) as well as the relative number of fruit
species in a primate’s home range.
Once we have selected informative socio-ecological measures, the next step is to make a priori predictions
as to the effects they may have on cognition. Many of these effects will not be linear. For instance, home
range size often shows a significant linear relationship with proxies for cognition but not always (e.g., Bar-
ton, 2000). The discovery that home range size scales with body mass according to a power function
(Noonan et al., 2020) helps explain these inconsistencies. Non-linear relationships may be more general
than this and may even be hump shaped. Consider the problem of locating food in an environment. As
Grassberger (1986) has pointed out, the environment one would intuitively call ‘‘most complex’’ is neither
the most ordered—imagine one where all food is at equal distance and direction of each other—nor the
most disordered one. The first case is unchallenging, while the latter is near-random—chaotic and impos-
sible to predict. In neither case would enhanced cognitive abilities improve foraging efficiency: cognition is
most useful within the ‘‘zone of possibility’’, where mental modeling of the environment is feasible but chal-
lenging (Riotte-Lambert and Matthiopoulos, 2020).
Apart from the need to consider non-linear effects of ecological descriptors in comparative models, it is
similarly important to think about potential interaction effects of these descriptors on the evolution of
cognition. For example, we might expect that the ability to plan an efficient foraging route will especially
be beneficial when a primate lives in a large home range compared to a small range but only when food
availability and search costs are equal for both. That is, there could be interactive effects of range size,
food density, and search costs on route planning performance. In sum, we believe that there is an oppor-
tunity in future comparative analyses to (1) incorporate more detailed and informative measures of socio-
ecological challenges, (2) generate specific a priori expectations of their effects, including non-linear ef-
fects, and (3) make predictions about the interactions of these effects.
CONCLUSION
The study of primate movement data with cutting edge methods can provide important insights into the
development and evolution of primate cognition. Extant ranging data from animals in natural habitats
thus has considerable untapped potential. Our survey reveals that extensive ranging data, as well as cor-
responding socio-ecological measures, are already available for at least 164 primate populations, which
creates a unique opportunity to conduct large-scale comparisons of spatiotemporal cognition and their
phylogenetic and socio-ecological correlates. We have presented a conceptual framework (Figure 2) high-
lighting several ways in which these data can be analyzed. Many of these analyses can be conducted using
only x,y,t-data; nevertheless, behaviorally annotated x,y,t-data and associated socio-ecological data would
bolster the strength of these relatively simple analyses. For many study sites, such data are also available.
Our aims in presenting these conceptual analyses are twofold to inspire young scholars to (1) operation-
alize our ideas and conduct these and similar analyses and (2) to collect comparable data on other, as
yet unstudied, primate populations. The second aim is particularly urgent: the current generation of young
scholars may be one of the last to be able to collect data on primates living in natural settings.
ACKNOWLEDGMENTS
We thank Oxford Brookes University in Oxford andMax Planck Institute for Animal Behavior in Konstanz for
providing the logistical and financial support for two workshops that enabled us to exchange, develop, and
write up our ideas. We especially thank Meg Crofoot, Roger Mundry, Tamara Vallina, Chloe Bracis, Kamran
Safi, Kavel Ozturk, and Bryndan van Pinxteren for their valuable contributions to our discussions and idea
development. We also thank our colleagues who completed the survey: Adamu E., Aggimarangsee N.,
Agostini I., Aureli F., Baden A., Ban S., Basabose A., Berthet M., Boutlib F., Bowler M., Boyle S., Brivodoro
M., Brotcorne F., Brown M., Camperio Ciani a., Carretero Pinzon X., Caselli C., Catherine M., Chapman C.,
Chaves O., Cheyne S., Chie H., Colquhoun I., Cords M., Crofoot M., Daniel M., Danquah E., Davenport T.,
Dela J., Dellatore D., Demissie M., Di Fiore A., Digby L., Dolch R., Ebang Ella G., El Alami A., Eniang E.,
Eppley T., Erb W., Fashing P., Fernandez-Duque E., Fischer J., Fourrier M., Furiuchi T., Garber P., Gazagne
E., Gilby I., Girard-Buttoz C., Goossens B., Green S., Gregoire K., Grueter C., He T., Hendershott R., Hogan
J., Holmes S., Isbell L., Izar P., Johnson S., Kakule K., Kambire S., Kankam B., Kauffman L., Koirala S., Kumara
H., Leca J., Lucchesi S., Majolo B., Mallott L., Martinez J., Martins W., Mayoukou R., Moscovice L., Msindai
J., Nagy-Reis M., Ndeloh D., Ndiaye P., Nekaris K., Nizeyimana F., Ogunjemite B., Oktaviani R., Olupot W.,
14 iScience 24, 102343, April 23, 2021
llOPEN ACCESS
iSciencePerspective
O’Mara T., Ordonez-Gomez J., Ostner J., Perry S., Pebsworth P., Pfoh R., Piel A., Pinacho Guendulain B.,
Porter L., Pozzan Paim F., Presotto A., Price E., Rafalinirina A., Rangel-Negrın R., Ravaloharimanitra M., Ra-
zanaparany T., Reichard U., Reyna-Hurtado R., Rezende G., Robbins M., Ruppert N., Salmi R., Sandel A.,
Schoof V., Setz E., Shanee S., Shein N., Shun H., Silva S., Stevenson P., Strandburg-Peshkin A., Strier K.,
Strum S., Suarez S., Talebi M., Tecot S., Teichroeb J., Wallace R., Willems E., Willie J., Yamamoto S., and
Yi Y. We thank the editor and the anonymous reviewer for constructive comments to an earlier version
of this manuscript.
AUTHOR CONTRIBUTIONS
K.J., S.V.B., and M.d.G. conceived the idea and organized the workshops, discussion meetings, and paper
editing sessions. S.V.B. and H.J. designed the survey and analyzed its results. All authors contributed to
developing ideas, writing sections of the paper, reviewing previous drafts, and gave final approval for pub-
lication. Figures were created by S.V.B., B.R., M.d.G., E.v.L., and J.C.
DECLARATION OF INTERESTS
The authors declare no competing interests.
REFERENCES
Abrahms, B., Hazen, E.L., Aikens, E.O., Savoca,M.S., Goldbogen, J.A., Bograd, S.J., Jacox, M.G.,Irvine, L.M., Palacios, D.M., and Mate, B.R. (2019).Memory and resource tracking drive blue whalemigrations. Proc. Natl. Acad. Sci. 116, 5582–5587.Arnold, C., Matthews, L.J., and Nunn, C.L. (2010).The 10kTrees website: a new online resource forprimate phylogeny. Evol. Anthropol. Issues NewsRev. 19, 114–118.
Asensio, N., Brockelman, W.Y., Malaivijitnond, S.,and Reichard, U.H. (2011). Gibbon travel pathsare goal oriented. Anim. Cogn. 14, 395–405.
Ban, S.D., Boesch, C., and Janmaat, K.R.L. (2014).Taı chimpanzees anticipate revisiting high-valuedfruit trees from further distances. Anim. Cogn. 17,1353–1364.
Barks, S.K., Calhoun, M.E., Hopkins, W.D.,Cranfield, M.R., Mudakikwa, A., Stoinski, T.S.,Patterson, F.G., Erwin, J.M., Hecht, E.E., Hof, P.R.,and Sherwood, C.C. (2015). Brain organization ofgorillas reflects species differences in ecology.Am. J. Phys. Anthropol. 156, 252–262.
Barrat, A., Barthelemy, M., and Vespignani, A.(2005). The effects of spatial constraints on theevolution of weighted complex networks. J. Stat.Mech. Theor. Exp. 2005, P05003.
Barthelemy, M. (2011). Spatial networks. Phys.Rep. 499, 1–101.
Barton, R.A. (2000). Ecological and social factorsin primate brain evolution. In On the Move: HowandWhy Animals Travel in Groups, S. Boinski andP. Garber, eds. (University of Chicago Press),pp. 204–237.
Barton, R.A. (1996). Neocortex size andbehavioural ecology in primates. Proc. R. Soc. BBiol. Sci. 263, 173–177.
Bast, H., Delling, D., Goldberg, A., Muller-Hannemann, M., Pajor, T., Sanders, P., Wagner,D., and Werneck, R.F. (2016). Route planning intransportation networks. In AlgorithmEngineering: Selected Results and Surveys, L.Kliemann and P. Sanders, eds. (Springer),pp. 19–80.
Beissinger, S.R., and Gibbs, J.P. (1993). Arevariable environments stochastic? A review ofmethods to quantify environmentalpredictability. In Adaptation in StochasticEnvironments, J. Yoshimura and C.W. Clark, eds.(Springer), pp. 132–146.
Benhamou, S. (2011). Dynamic approach to spaceand habitat use based on biased randombridges. PLoS One 6, e14592.
Benhamou, S., and Riotte-Lambert, L. (2012).Beyond the utilization distribution: identifyinghome range areas that are intensively exploitedor repeatedly visited. Ecol. Model. 227, 112–116.
Berger-Tal, O., and Bar-David, S. (2015).Recursive movement patterns: review andsynthesis across species. Ecosphere 6, art149.
Bogart, S.L., Bennett, A.J., Schapiro, S.J., Reamer,L.A., and Hopkins, W.D. (2014). Different earlyrearing experiences have long-term effects oncortical organization in captive chimpanzees (Pantroglodytes). Dev. Sci. 17, 161–174.
Bracis, C., Bildstein, K.L., and Mueller, T. (2018).Revisitation analysis uncovers spatio-temporalpatterns in animalmovement data. Ecography 41,1801–1811.
Bracis, C., andMueller, T. (2017). Memory, not justperception, plays an important role in terrestrialmammalian migration. Proc. R. Soc. B Biol. Sci.284, 20170449.
Byrne, R.W. (2000). How monkeys find their way.Leadership, coordination, and cognitive maps ofAfrican baboons. In On the Move: How and WhyAnimals Travel in Groups, S. Boinski and P.A.Garber, eds. (University of Chicago Press),pp. 491–518.
Byrne, R.W. (1996). Relating brain size tointelligence. In Modelling the Early Human Mind,P.A. Mellars and K.R. Gibson, eds. (McDonaldInstitute for Archaeological Research), pp. 49–56.
Byrne, R.W., Noser, R., Bates, L.A., and Jupp, P.E.(2009). How did they get here from there?Detecting changes of direction in terrestrialranging. Anim. Behav. 77, 619–631.
Cagnacci, F., Boitani, L., Powell, R.A., and Boyce,M.S. (2010). Animal ecology meets GPS-basedradiotelemetry: a perfect storm of opportunitiesand challenges. Philos. Trans. R. Soc. B Biol. Sci.365, 2157–2162.
Calisi, R.M., and Bentley, G.E. (2009). Lab andfield experiments: are they the same animal?Horm. Behav. 56, 1–10.
Chittka, L., and Niven, J. (2009). Are bigger brainsbetter? Curr. Biol. 19, R995–R1008.
Codling, E.A., Plank, M.J., and Benhamou, S.(2008). Random walk models in biology. J. R. Soc.Interface 5, 813–834.
Collet, J., and Weimerskirch, H. (2020).Albatrosses can memorize locations ofpredictable fishing boats but favour naturalforaging. Proc. R. Soc. B Biol. Sci. 287, 20200958.
Colwell, R.K. (1974). Predictability, constancy, andcontingency of periodic phenomena. Ecology 55,1148–1153.
Croston, R., Branch, C.L., Kozlovsky, D.Y., Roth,T.C., LaDage, L.D., Freas, C.A., and Pravosudov,V.V. (2015). Potential mechanisms drivingpopulation variation in spatial memory and thehippocampus in food-caching chickadees. Integr.Comp. Biol. 55, 354–371.
Curry, C., and Presotto, A. (2018). Habitual RouteAnalysis Method (HRAM).
de Guinea, M., Estrada, A., Janmaat, K.R.L.,Nekaris, K.A.-I., and Van Belle, S. (2021).Disentangling the importance of social andecological information in goal-directedmovements in a wild primate (Alouatta pigra).Anim. Behav. 173, 41–51.
de Guinea, M., Estrada, A., Nekaris, K.A.-I., andVan Belle, S. (2019). Arboreal route navigation in aNeotropical mammal: energetic implicationsassociated with tree monitoring and landscapeattributes. Mov. Ecol. 7, 39.
DeCasien, A.R., Williams, S.A., and Higham, J.P.(2017). Primate brain size is predicted by diet butnot sociality. Nat. Ecol. Evol. 1, 1–7.
iScience 24, 102343, April 23, 2021 15

llOPEN ACCESS
iSciencePerspective
Di Fiore, A., and Suarez, S.A. (2007). Route-basedtravel and shared routes in sympatric spider andwoolly monkeys: cognitive and evolutionaryimplications. Anim. Cogn. 10, 317–329.
Estrada, A., Garber, P.A., Rylands, A.B., Roos, C.,Fernandez-Duque, E., Fiore, A.D., Nekaris,K.A.-I., Nijman, V., Heymann, E.W., Lambert, J.E.,et al. (2017). Impending extinction crisis of theworld’s primates: why primates matter. Sci. Adv.3, e1600946.
Fagan, W.F., Lewis, M.A., Auger-Methe, M.,Avgar, T., Benhamou, S., Breed, G., LaDage, L.,Schlagel, U.E., Tang, W., Papastamatiou, Y.P.,et al. (2013). Spatial memory and animalmovement. Ecol. Lett. 16, 1316–1329.
Gallotti, R., Porter, M.A., and Barthelemy, M.(2016). Lost in transportation: informationmeasures and cognitive limits in multilayernavigation. Sci. Adv. 2, e1500445.
Garber, P.A. (2000). Evidence for the use ofspatial, temporal, and social information by someprimate foragers. In On the Move: How and WhyAnimals Travel in Groups, S. Boinski and P.A.Garber, eds. (University of Chicago Press),pp. 261–298.
Garber, P.A. (1989). Role of spatial memory inprimate foraging patterns: Saguinus mystax andSaguinus fuscicollis. Am. J. Primatol. 19, 203–216.
Grassberger, P. (1986). Toward a quantitativetheory of self-generated complexity. Int. J. Theor.Phys. 25, 907–938.
Green, S.J., Boruff, B.J., Bonnell, T.R., andGrueter, C.C. (2020a). Chimpanzees use least-cost routes to out-of-sight goals. Curr. Biol. 30,4528–4533.e5, https://doi.org/10.1016/j.cub.2020.08.076.
Green, S.J., Boruff, B.J., and Grueter, C.C.(2020b). From ridge tops to ravines: landscapedrivers of chimpanzee ranging patterns. Anim.Behav. 163, 51–60.
Guilford, T., and Biro, D. (2014). Route followingand the pigeon’s familiar area map. J. Exp. Biol.217, 169–179.
Harvey, P.H., and Krebs, J.R. (1990). Comparingbrains. Science 249, 140–146.
Haun, D.B.M., Rapold, C.J., Janzen, G., andLevinson, S.C. (2011). Plasticity of human spatialcognition: spatial language and cognition covaryacross cultures. Cognition 119, 70–80.
Healy, S.D., and Rowe, C. (2007). A critique ofcomparative studies of brain size. Proc. R. Soc. BBiol. Sci. 274, 453–464.
Henderson, J., Hurly, T.A., Bateson, M., andHealy, S.D. (2006). Timing in free-living rufoushummingbirds, Selasphorus rufus. Curr. Biol. 16,512–515.
Henrich, J., Heine, S.J., and Norenzayan, A.(2010). The weirdest people in the world? Behav.Brain Sci. 33, 61–83.
Hopkins, M.E. (2016). Mantled howler monkeyspatial foraging decisions reflect spatial andtemporal knowledge of resource distributions.Anim. Cogn. 19, 387–403.
16 iScience 24, 102343, April 23, 2021
Houle, A., Conklin-Brittain, N.L., and Wrangham,R.W. (2014). Vertical stratification of the nutritionalvalue of fruit: macronutrients and condensedtannins. Am. J. Primatol. 76, 1207–1232.
Isbell, L.A., Cheney, D.L., and Seyfarth, R.M.(1993). Are immigrant vervet monkeys,Cercopithecus aethiops, at greater risk ofmortality than residents? Anim. Behav. 45,729–734.
Isbell, L.A., Cheney, D.L., and Seyfarth, R.M.(1990). Costs and benefits of home range shiftsamong vervet monkeys (Cercopithecus aethiops)in Amboseli National Park, Kenya. Behav. Ecol.Sociobiol. 27, 351–358.
Isler, K., and van Schaik, C. (2006). Costs ofencephalization: the energy trade-off hypothesistested on birds. J. Hum. Evol. 51, 228–243.
Jacobs, L.F., and Menzel, R. (2014). Navigationoutside of the box: what the lab can learn fromthe field and what the field can learn from the lab.Mov. Ecol. 2, 3.
Jang, H., Boesch, C., Mundry, R., Ban, S.D., andJanmaat, K.R.L. (2019). Travel linearity and speedof human foragers and chimpanzees during theirdaily search for food in tropical rainforests. Sci.Rep. 9, 11066.
Janmaat, K.R.L. (2019). What animals do not do orfail to find: a novel observational approach forstudying cognition in the wild. Evol. Anthropol.28, 303–320.
Janmaat, K.R.L., Ban, S.D., and Boesch, C. (2013).Chimpanzees use long-term spatial memory tomonitor large fruit trees and remember feedingexperiences across seasons. Anim. Behav. 86,1183–1205.
Janmaat, K.R.L., Boesch, C., Byrne, R.W.,Chapman, C.A., Gone Bi, Z.B., Head, J.S.,Robbins, M.M., Wrangham, R.W., and Polansky,L. (2016). Spatio-temporal complexity ofchimpanzee food: how cognitive adaptations cancounteract the ephemeral nature of ripe fruit. Am.J. Primatol. 78, 626–645.
Janmaat, K.R.L., Byrne, R.W., and Zuberbuhler, K.(2006). Evidence for a spatial memory of fruitingstates of rainforest trees in wild mangabeys.Anim. Behav. 72, 797–807.
Janmaat, K.R.L., Chapman, C.A., Meijer, R., andZuberbuhler, K. (2012). The use of fruitingsynchrony by foraging mangabey monkeys: a‘simple tool’ to find fruit. Anim. Cogn. 15, 83–96.
Janmaat, K.R.L., Olupot, W., Chancellor, R.L.,Arlet, M.E., and Waser, P.M. (2009). Long-termsite fidelity and individual home range shifts inLophocebus albigena. Int. J. Primatol. 30,443–466.
Janmaat, K.R.L., Polansky, L., Ban, S.D., andBoesch, C. (2014). Wild chimpanzees plan theirbreakfast time, type, and location. Proc. Natl.Acad. Sci. 111, 16343–16348.
Janson, C.H., and Byrne, R.W. (2007). What wildprimates know about resources: opening up theblack box. Anim. Cogn. 10, 357–367.
Joo, R., Picardi, S., Boone, M.E., Clay, T.A.,Patrick, S.C., Romero-Romero, V.S., and Basille,
M. (2020). A Decade of Movement Ecology(ArXiv), p. 200600110.
Junker, J., Petrovan, S.O., Arroyo-RodrIguez, V.,Boonratana, R., Byler, D., Chapman, C.A., Chetry,D., Cheyne, S.M., Cornejo, F.M., CortEs-Ortiz, L.,et al. (2020). A severe lack of evidence limitseffective conservation of the world’s primates.BioScience 70, 794–803.
Kays, R., Crofoot, M.C., Jetz, W., and Wikelski, M.(2015). Terrestrial animal tracking as an eye on lifeand planet. Science 348, 6240.
Kie, J.G., Matthiopoulos, J., Fieberg, J., Powell,R.A., Cagnacci, F., Mitchell, M.S., Gaillard, J.-M.,and Moorcroft, P.R. (2010). The home-rangeconcept: are traditional estimators still relevantwith modern telemetry technology? Philos. Trans.R. Soc. B Biol. Sci. 365, 2221–2231.
Latty, T., Ramsch, K., Ito, K., Nakagaki, T.,Sumpter, D.J.T., Middendorf, M., and Beekman,M. (2011). Structure and formation of anttransportation networks. J. R. Soc. Interface 8,1298–1306.
Lihoreau, M., Chittka, L., and Raine, N.E. (2010).Travel optimization by foraging bumblebeesthrough readjustments of traplines afterdiscovery of new feeding locations. Am. Nat. 176,744–757.
Logan, C.J., Avin, S., Boogert, N., Buskell, A.,Cross, F.R., Currie, A., Jelbert, S., Lukas, D.,Mares, R., Navarrete, A.F., et al. (2018). Beyondbrain size: uncovering the neural correlates ofbehavioral and cognitive specialization. Comp.Cogn. Behav. Rev. 13, 55–89.
ManyPrimates, Altschul, D., Beran, M.J., Bohn,M., Caspar, K., Fichtel, C., Forsterling, M., Grebe,N., Hernandez-Aguilar, R.A., Kwok, S.C., et al.(2019a). Collaborative open science as a way toreproducibility and new insights in primatecognition research. Jpn. Psychol. Rev. 62,205–220.
ManyPrimates, Altschul, D.M., Beran, M.J., Bohn,M., Call, J., DeTroy, S., Duguid, S.J., Egelkamp,C.L., Fichtel, C., Fischer, J., et al. (2019b).Establishing an infrastructure for collaboration inprimate cognition research. PLoS One 14,e0223675.
Menzel, C.R. (1991). Cognitive aspects of foragingin Japanese monkeys. Anim. Behav. 41, 397–402.
Menzel, C.R., and Beck, B.B. (2000). Homing anddetour behavior in golden lion tamarin socialgroups. In On the Move; How and Why AnimalsTravel in Groups, S. Boinski and P. Garber, eds.(University of Chicago Press), pp. 299–326.
Milton, K. (1981). Distribution patterns of tropicalplant foods as an evolutionary stimulus to primatemental development. Am. Anthropol. 83,534–548.
Morand-Ferron, J., Cole, E.F., and Quinn, J.L.(2016). Studying the evolutionary ecology ofcognition in the wild: a review of practical andconceptual challenges. Biol. Rev. 91, 367–389.
Morrison, T.A., Merkle, J.A., Hopcraft, J.G.C.,Aikens, E.O., Beck, J.L., Boone, R.B., Alyson, B.,Courtemanch, A.B., Dwinnell, S.P., Fairbanks,W.S., et al. (2021). Drivers of site fidelity in

llOPEN ACCESS
iSciencePerspective
ungulates. J. Anim. Ecol. https://doi.org/10.1111/1365-2656.13425.
Nathan, R., Getz, W.M., Revilla, E., Holyoak, M.,Kadmon, R., Saltz, D., and Smouse, P.E. (2008). Amovement ecology paradigm for unifyingorganismal movement research. Proc. Natl. Acad.Sci. 105, 19052–19059.
Noonan, M.J., Fleming, C.H., Tucker, M.A., Kays,R., Harrison, A.-L., Crofoot, M.C., Abrahms, B.,Alberts, S.C., Ali, A.H., Altmann, J., et al. (2020).Effects of body size on estimation of mammalianarea requirements. Conserv. Biol. 34, 1017–1028.
Noonan, M.J., Tucker, M.A., Fleming, C.H., Akre,T.S., Alberts, S.C., Ali, A.H., Altmann, J., Antunes,P.C., Belant, J.L., Beyer, D., et al. (2019). Acomprehensive analysis of autocorrelation andbias in home range estimation. Ecol. Mon. 89 (2),e01344.
Normand, E., and Boesch, C. (2009).Sophisticated Euclidean maps in forestchimpanzees. Anim. Behav. 77, 1195–1201.
Noser, R., and Byrne, R.W. (2007). Travel routesand planning of visits to out-of-sight resources inwild chacma baboons, Papio ursinus. Anim.Behav. 73, 257–266.
Nunn, C.L. (2011). The Comparative Approach inEvolutionary Anthropology and Biology(University of Chicago Press).
Pacheco-Cobos, L., Winterhalder, B.,Cuatianquiz-Lima, C., Rosetti, M.F., Hudson, R.,and Ross, C.T. (2019). Nahua mushroomgatherers use area-restricted search strategiesthat conform to marginal value theorempredictions. Proc. Natl. Acad. Sci. 116, 10339–10347.
Parrott, L. (2010). Measuring ecologicalcomplexity. Ecol. Indic. 10, 1069–1076.
Pasquaretta, C., Dubois, T., Gomez-Moracho, T.,Delepoulle, V.P., Loc’h, G.L., Heeb, P., andLihoreau, M. (2020). Analysis of temporal patternsin animal movement networks. Methods Ecol.Evol, 101–113.
Pasquaretta, C., Jeanson, R., Andalo, C., Chittka,L., and Lihoreau, M. (2017). Analysing plant-pollinator interactions with spatial movementnetworks: network pollination. Ecol. Entomol. 42,4–17.
Patterson, T.A., Thomas, L., Wilcox, C.,Ovaskainen, O., and Matthiopoulos, J. (2008).State–space models of individual animalmovement. Trends Ecol. Evol. 23, 87–94.
Perna, A., and Latty, T. (2014). Animaltransportation networks. J. R. Soc. Interface 11,20140334.
Polansky, L., Kilian, W., and Wittemyer, G. (2015).Elucidating the significance of spatial memory onmovement decisions by African savannahelephants using state–space models. Proc. R.Soc. B Biol. Sci. 282, 20143042.
Presotto, A., Fayrer-Hosken, R., Curry, C., andMadden, M. (2019). Spatial mapping shows thatsome African elephants use cognitive maps tonavigate the core but not the periphery of theirhome ranges. Anim. Cogn. 22, 251–263.
Presotto, A., and Izar, P. (2010). Spatial referenceof black capuchin monkeys in Brazilian Atlanticforest: egocentric or allocentric? Anim. Behav. 80,125–132.
Presotto, A., Verderane, M.P., Biondi, L.,Mendonca-Furtado, O., Spagnoletti, N.,Madden, M., and Izar, P. (2018). Intersection askey locations for bearded capuchin monkeys(Sapajus libidinosus) traveling within a routenetwork. Anim. Cogn. 21, 393–405.
Quaglietta, L., and Porto, M. (2019). SiMRiv: an Rpackage for mechanistic simulation of individual,spatially-explicit multistate movements in rivers,heterogeneous and homogeneous spacesincorporating landscape bias. Mov. Ecol. 7, 11.
Ricklefs, R.E., and Wikelski, M. (2002). Thephysiology/life-history nexus. Trends Ecol. Evol.17, 462–468.
Riotte-Lambert, L., Benhamou, S., and Chamaille-Jammes, S. (2017). From randomness totraplining: a framework for the study of routinemovement behavior. Behav. Ecol. 28, 280–287.
Riotte-Lambert, L., and Matthiopoulos, J. (2020).Environmental predictability as a cause andconsequence of animal movement. Trends Ecol.Evol. 35, 163–174.
Romanes, G.J. (1884). Mental Evolution inAnimals (Appleton).
Rosati, A.G. (2017). Foraging cognition: revivingthe ecological intelligence hypothesis. TrendsCogn. Sci. 21, 691–702.
Ross, C., Pacheco-Cobos, L., andWinterhalder, B.(2018). A general model of forager search:adaptive encounter-conditional heuristicsoutperform Levy flights in the search for patchilydistributed prey. J. Theor. Biol. 455, 357–369.
Rowe, N., and Myers, M. (2016). All the World’sPrimates (Pogonias Press).
Salmi, R., Presotto, A., Scarry, C.J., Hawman, P.,and Doran-Sheehy, D.M. (2020). Spatial cognitionin western gorillas (Gorilla gorilla): an analysis ofdistance, linearity, and speed of travel routes.Anim. Cogn. 23, 545–557.
Shettleworth, S.J. (2010). Getting Around: SpatialCognition, in Cognition, Evolution, and Behavior(Oxford University Press), pp. 261–312.
Suarez, S.A., Karro, J., Kiper, J., Farler, D.,McElroy, B., Rogers, B.C., Stockwell, B., andYoung, T. (2014). A comparison of computer-generated and naturally occurring foragingpatterns in route-network-constrained spidermonkeys. Am. J. Primatol. 76, 460–471.
Teichroeb, J.A. (2015). Vervet monkeys use pathsconsistent with context-specific spatialmovement heuristics. Ecol. Evol. 5, 4706–4716.
Teitelbaum, C.S., Converse, S.J., Fagan, W.F.,Bohning-Gaese, K., O’Hara, R.B., Lacy, A.E., andMueller, T. (2016). Experience drives innovation ofnew migration patterns of whooping cranes inresponse to global change. Nat. Commun. 7,12793.
Toledo, S., Shohami, D., Schiffner, I., Lourie, E.,Orchan, Y., Bartan, Y., and Nathan, R. (2020).Cognitive map–based navigation in wild batsrevealed by a new high-throughput trackingsystem. Science 369, 188–193.
Tolman, E.C. (1948). Cognitive maps in rats andmen. Psychol. Rev. 55, 189–208.
Tomkiewicz, S.M., Fuller, M.R., Kie, J.G., andBates, K.K. (2010). Global positioning system andassociated technologies in animal behaviour andecological research. Philos. Trans. R. Soc. B Biol.Sci. 365, 2163–2176.
Trapanese, C., Meunier, H., and Masi, S. (2019).What, where andwhen: spatial foraging decisionsin primates. Biol. Rev. 94, 483–502.
Tujague, M.P., and Janson, C.H. (2017). Wildcapuchin monkeys anticipate the amount of ripefruit in natural trees. Anim. Cogn. 20, 841–853.
Van Belle, S., Porter, A., Fernandez-Duque, E.,and Fiore, A.D. (2018). Ranging behavior andpotential for territoriality in equatorial sakis(Pithecia aequatorialis) in Amazonian Ecuador.Am. J. Phys. Anthropol. 167, 701–712.
van Woerden, J.T., van Schaik, C.P., and Isler, K.(2010). Effects of seasonality on brain sizeevolution: evidence from strepsirrhine primates.Am. Nat. 176, 758–767.
van Woerden, J.T., Willems, E.P., Schaik, C.P.van,and Isler, K. (2012). Large brains buffer energeticeffects of seasonal habitats in catarrhineprimates. Evolution 66, 191–199.
Warren, W.H. (2019). Non-Euclidean navigation.J. Exp. Biol. 222, jeb187971.
Watanuki, Y., Takahashi, A., and Sato, K. (2003).Feeding area specialization of chick-rearingAdelie Penguins Pygoscelis adeliae in a fast sea-ice area. Ibis 145, 558–564.
Williams, H.J., Taylor, L.A., Benhamou, S.,Bijleveld, A.I., Clay, T.A., Grissac, S.de, Dem�sar,U., English, H.M., Franconi, N., Gomez-Laich, A.,et al. (2020). Optimizing the use of biologgers formovement ecology research. J. Anim. Ecol. 89,186–206.
Wilson, R.P., Griffiths, I.W., Legg, P.A., Friswell,M.I., Bidder, O.R., Halsey, L.G., Lambertucci, S.A.,and Shepard, E.L.C. (2013). Turn costs change thevalue of animal search paths. Ecol. Lett. 16, 1145–1150.
Zuberbuhler, K., and Janmaat, K.R.L. (2010).Foraging cognition in non-human primates. InPrimate Neuroethology, M.L. Platt and A.A.Ghazanfar, eds. (Oxford University Press),pp. 64–83.
iScience 24, 102343, April 23, 2021 17