Embed Size (px)
Citation preview
1 - 1 -
Using Object Classifier in NIS-Elements
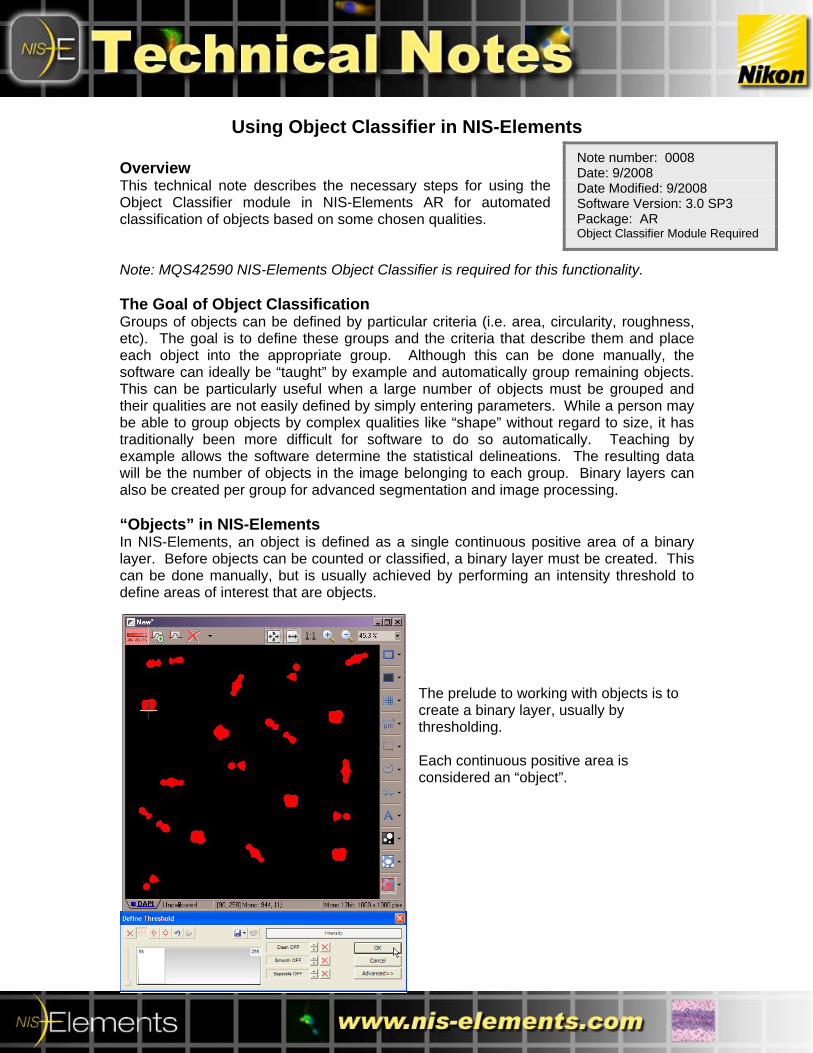
Overview This technical note describes the necessary steps for using the Object Classifier module in NIS-Elements AR for automated classification of objects based on some chosen qualities. Note: MQS42590 NIS-Elements Object Classifier is required for this functionality. The Goal of Object Classification Groups of objects can be defined by particular criteria (i.e. area, circularity, roughness, etc). The goal is to define these groups and the criteria that describe them and place each object into the appropriate group. Although this can be done manually, the software can ideally be “taught” by example and automatically group remaining objects. This can be particularly useful when a large number of objects must be grouped and their qualities are not easily defined by simply entering parameters. While a person may be able to group objects by complex qualities like “shape” without regard to size, it has traditionally been more difficult for software to do so automatically. Teaching by example allows the software determine the statistical delineations. The resulting data will be the number of objects in the image belonging to each group. Binary layers can also be created per group for advanced segmentation and image processing. “Objects” in NIS-Elements In NIS-Elements, an object is defined as a single continuous positive area of a binary layer. Before objects can be counted or classified, a binary layer must be created. This can be done manually, but is usually achieved by performing an intensity threshold to define areas of interest that are objects.
The prelude to working with objects is to create a binary layer, usually by thresholding. Each continuous positive area is considered an “object”.
Note number: 0008 Date: 9/2008 Date Modified: 9/2008 Software Version: 3.0 SP3 Package: AR Object Classifier Module Required
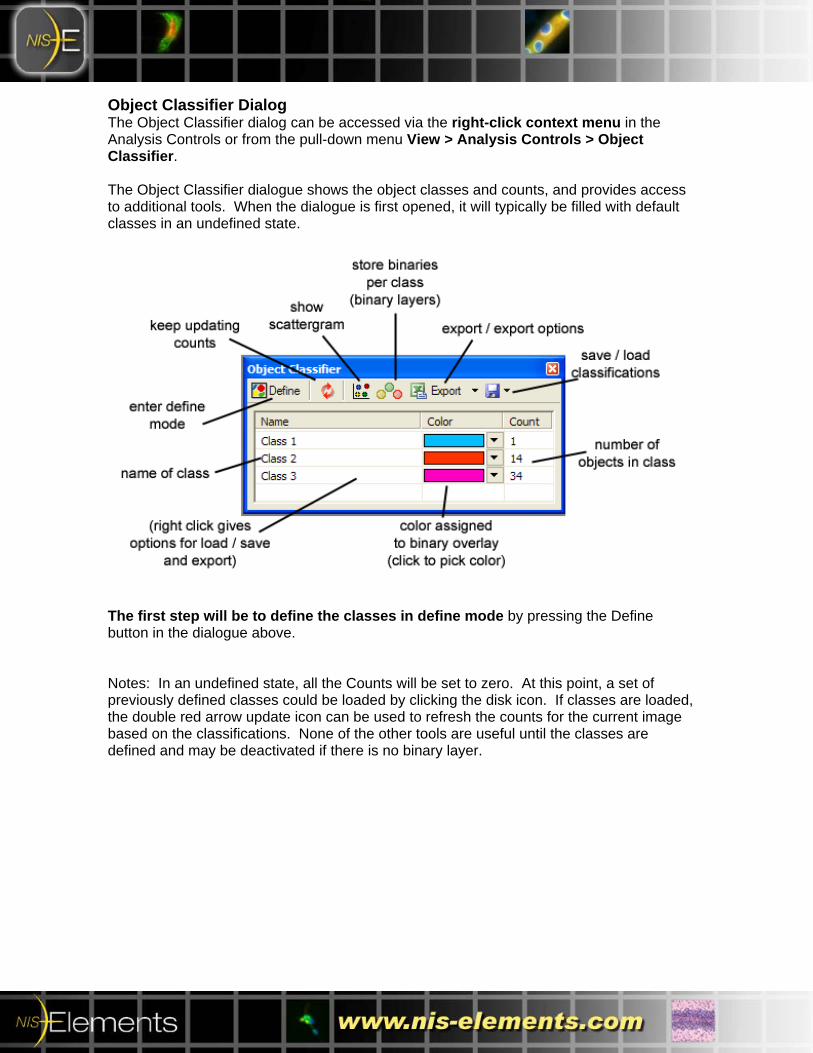
Object Classifier Dialog The Object Classifier dialog can be accessed via the right-click context menu in the Analysis Controls or from the pull-down menu View > Analysis Controls > Object Classifier. The Object Classifier dialogue shows the object classes and counts, and provides access to additional tools. When the dialogue is first opened, it will typically be filled with default classes in an undefined state.
The first step will be to define the classes in define mode by pressing the Define button in the dialogue above.
Notes: In an undefined state, all the Counts will be set to zero. At this point, a set of previously defined classes could be loaded by clicking the disk icon. If classes are loaded, the double red arrow update icon can be used to refresh the counts for the current image based on the classifications. None of the other tools are useful until the classes are defined and may be deactivated if there is no binary layer.
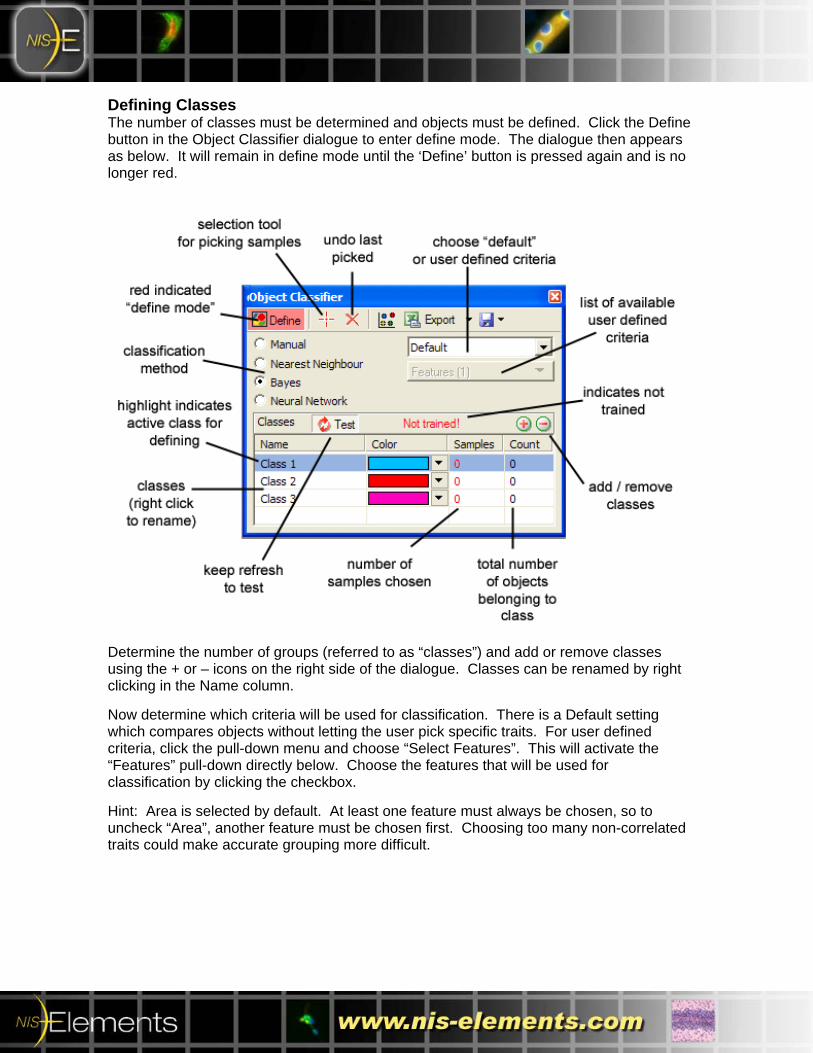
Defining Classes The number of classes must be determined and objects must be defined. Click the Define button in the Object Classifier dialogue to enter define mode. The dialogue then appears as below. It will remain in define mode until the ‘Define’ button is pressed again and is no longer red.
Determine the number of groups (referred to as “classes”) and add or remove classes using the + or – icons on the right side of the dialogue. Classes can be renamed by right clicking in the Name column. Now determine which criteria will be used for classification. There is a Default setting which compares objects without letting the user pick specific traits. For user defined criteria, click the pull-down menu and choose “Select Features”. This will activate the “Features” pull-down directly below. Choose the features that will be used for classification by clicking the checkbox. Hint: Area is selected by default. At least one feature must always be chosen, so to uncheck “Area”, another feature must be chosen first. Choosing too many non-correlated traits could make accurate grouping more difficult.
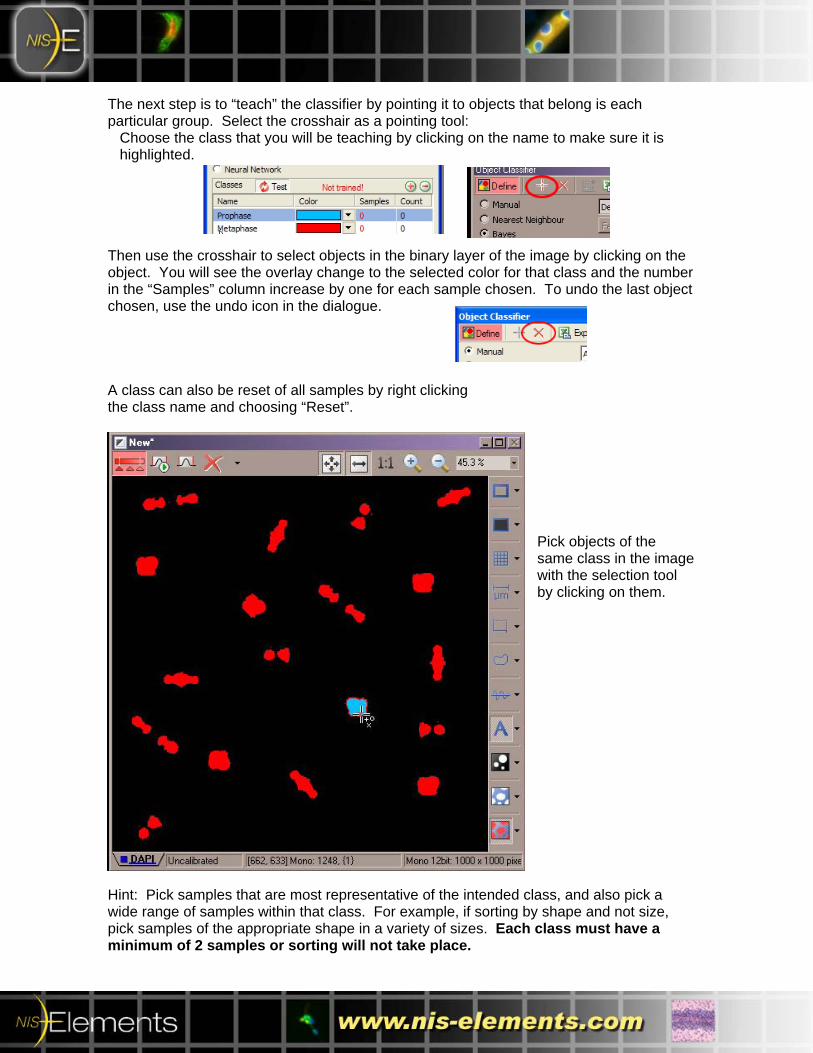
The next step is to “teach” the classifier by pointing it to objects that belong is each particular group. Select the crosshair as a pointing tool:
Choose the class that you will be teaching by clicking on the name to make sure it is highlighted.
Then use the crosshair to select objects in the binary layer of the image by clicking on the object. You will see the overlay change to the selected color for that class and the number in the “Samples” column increase by one for each sample chosen. To undo the last object chosen, use the undo icon in the dialogue. A class can also be reset of all samples by right clicking the class name and choosing “Reset”.
Pick objects of the same class in the image with the selection tool by clicking on them.
Hint: Pick samples that are most representative of the intended class, and also pick a wide range of samples within that class. For example, if sorting by shape and not size, pick samples of the appropriate shape in a variety of sizes. Each class must have a minimum of 2 samples or sorting will not take place.
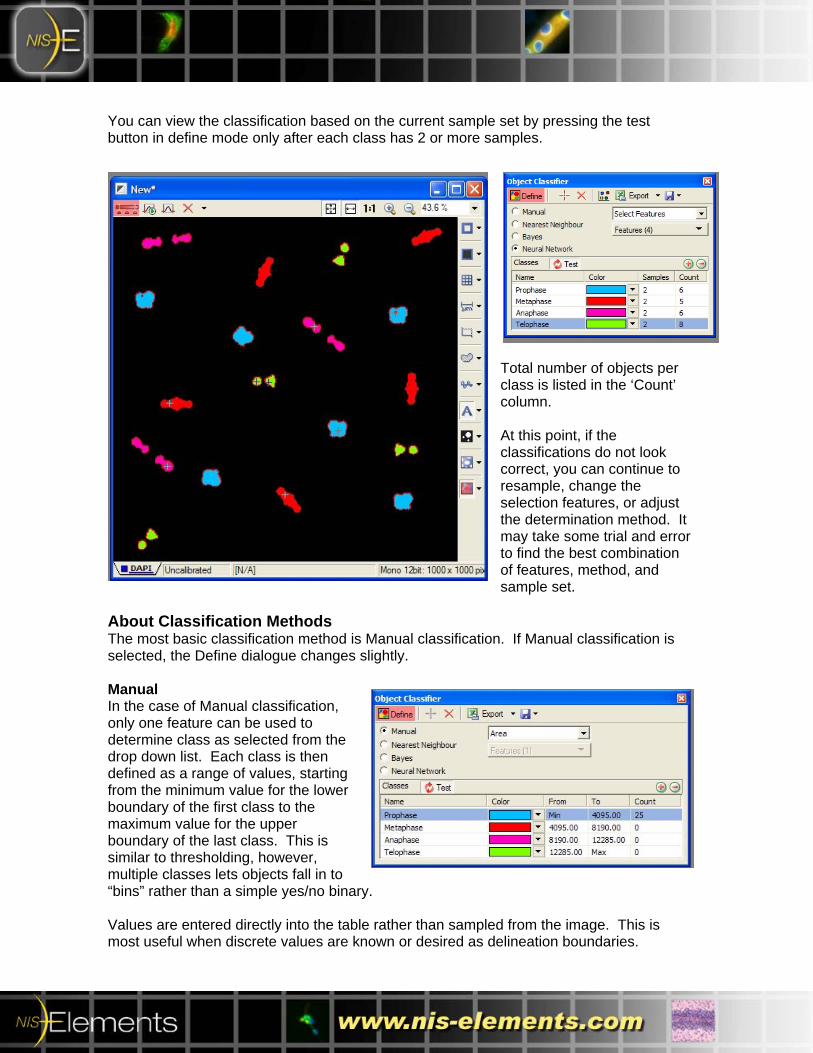
You can view the classification based on the current sample set by pressing the test button in define mode only after each class has 2 or more samples.
Total number of objects per class is listed in the ‘Count’ column. At this point, if the classifications do not look correct, you can continue to resample, change the selection features, or adjust the determination method. It may take some trial and error to find the best combination of features, method, and sample set.
About Classification Methods The most basic classification method is Manual classification. If Manual classification is selected, the Define dialogue changes slightly.
Manual In the case of Manual classification, only one feature can be used to determine class as selected from the drop down list. Each class is then defined as a range of values, starting from the minimum value for the lower boundary of the first class to the maximum value for the upper boundary of the last class. This is similar to thresholding, however, multiple classes lets objects fall in to “bins” rather than a simple yes/no binary. Values are entered directly into the table rather than sampled from the image. This is most useful when discrete values are known or desired as delineation boundaries.
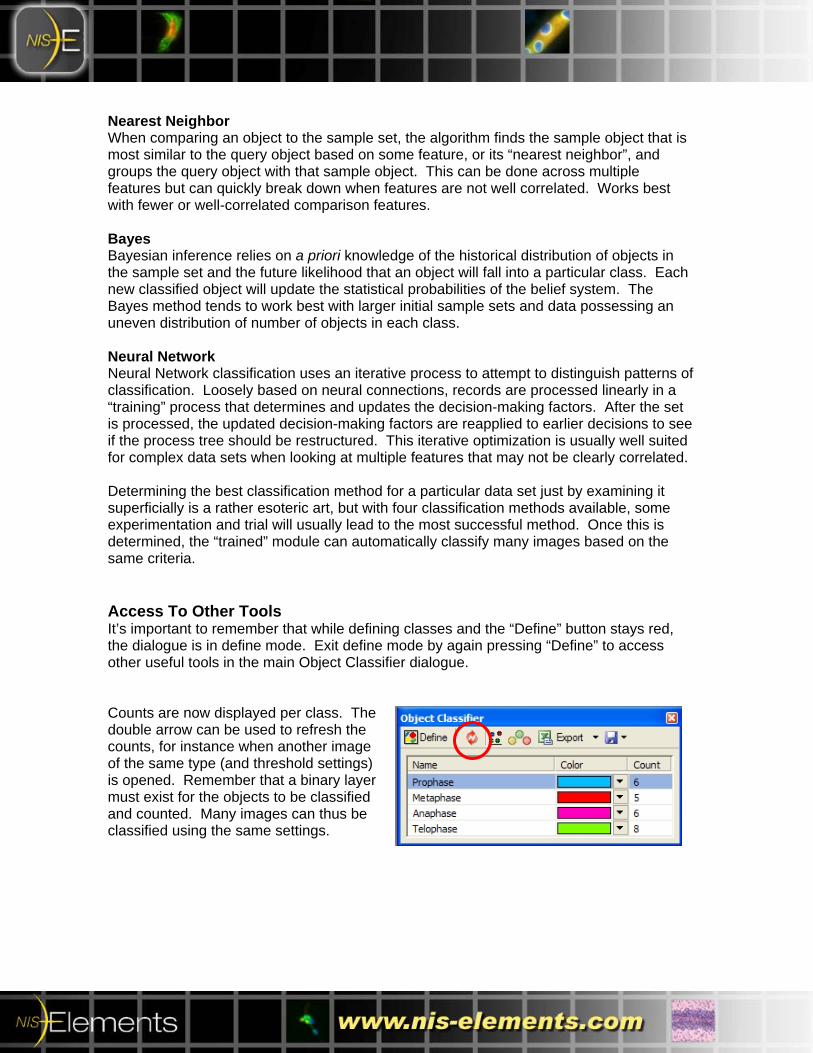
Nearest Neighbor When comparing an object to the sample set, the algorithm finds the sample object that is most similar to the query object based on some feature, or its “nearest neighbor”, and groups the query object with that sample object. This can be done across multiple features but can quickly break down when features are not well correlated. Works best with fewer or well-correlated comparison features. Bayes Bayesian inference relies on a priori knowledge of the historical distribution of objects in the sample set and the future likelihood that an object will fall into a particular class. Each new classified object will update the statistical probabilities of the belief system. The Bayes method tends to work best with larger initial sample sets and data possessing an uneven distribution of number of objects in each class. Neural Network Neural Network classification uses an iterative process to attempt to distinguish patterns of classification. Loosely based on neural connections, records are processed linearly in a “training” process that determines and updates the decision-making factors. After the set is processed, the updated decision-making factors are reapplied to earlier decisions to see if the process tree should be restructured. This iterative optimization is usually well suited for complex data sets when looking at multiple features that may not be clearly correlated. Determining the best classification method for a particular data set just by examining it superficially is a rather esoteric art, but with four classification methods available, some experimentation and trial will usually lead to the most successful method. Once this is determined, the “trained” module can automatically classify many images based on the same criteria. Access To Other Tools It’s important to remember that while defining classes and the “Define” button stays red, the dialogue is in define mode. Exit define mode by again pressing “Define” to access other useful tools in the main Object Classifier dialogue. Counts are now displayed per class. The double arrow can be used to refresh the counts, for instance when another image of the same type (and threshold settings) is opened. Remember that a binary layer must exist for the objects to be classified and counted. Many images can thus be classified using the same settings.
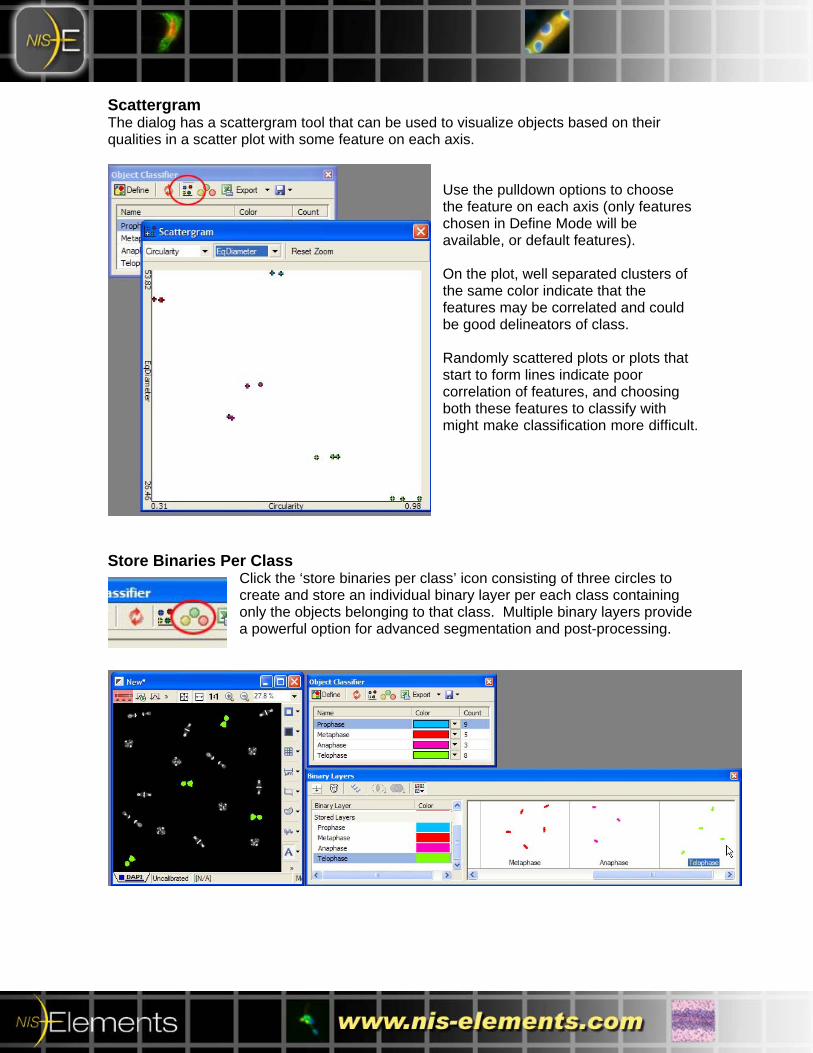
Scattergram The dialog has a scattergram tool that can be used to visualize objects based on their qualities in a scatter plot with some feature on each axis.
Use the pulldown options to choose the feature on each axis (only features chosen in Define Mode will be available, or default features). On the plot, well separated clusters of the same color indicate that the features may be correlated and could be good delineators of class. Randomly scattered plots or plots that start to form lines indicate poor correlation of features, and choosing both these features to classify with might make classification more difficult.
Store Binaries Per Class Click the ‘store binaries per class’ icon consisting of three circles to create and store an individual binary layer per each class containing only the objects belonging to that class. Multiple binary layers provide a powerful option for advanced segmentation and post-processing.
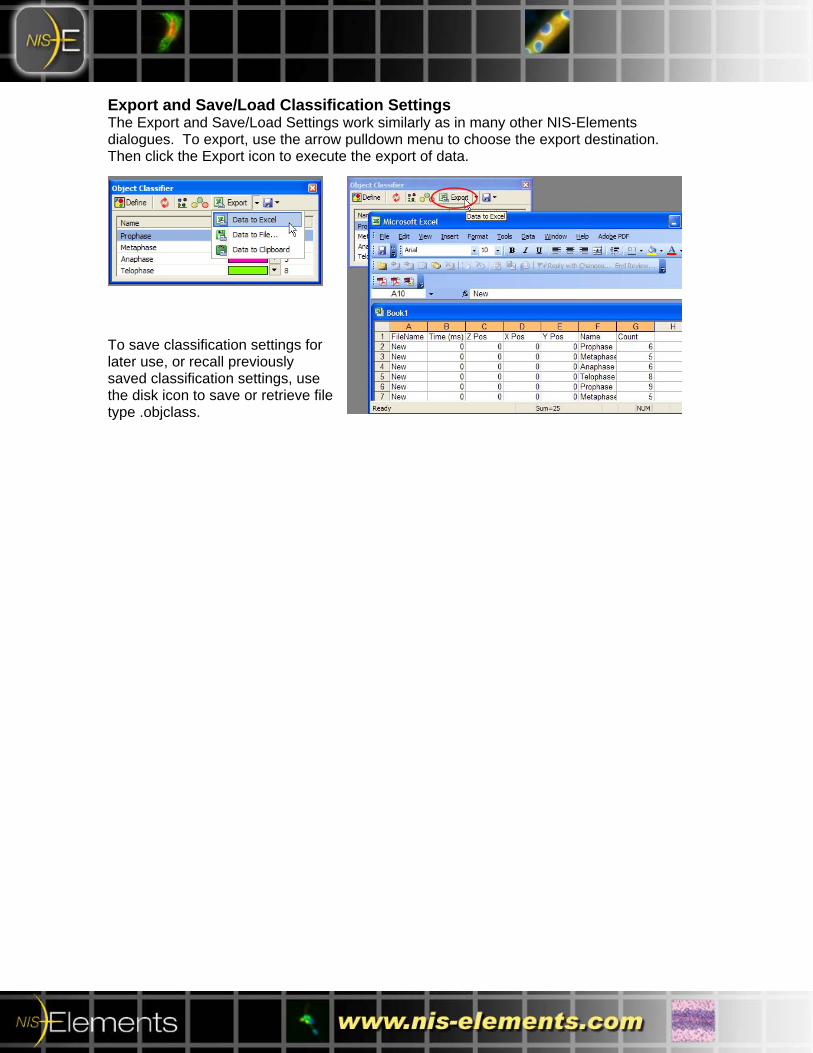
Export and Save/Load Classification Settings The Export and Save/Load Settings work similarly as in many other NIS-Elements dialogues. To export, use the arrow pulldown menu to choose the export destination. Then click the Export icon to execute the export of data.
To save classification settings for later use, or recall previously saved classification settings, use the disk icon to save or retrieve file type .objclass.
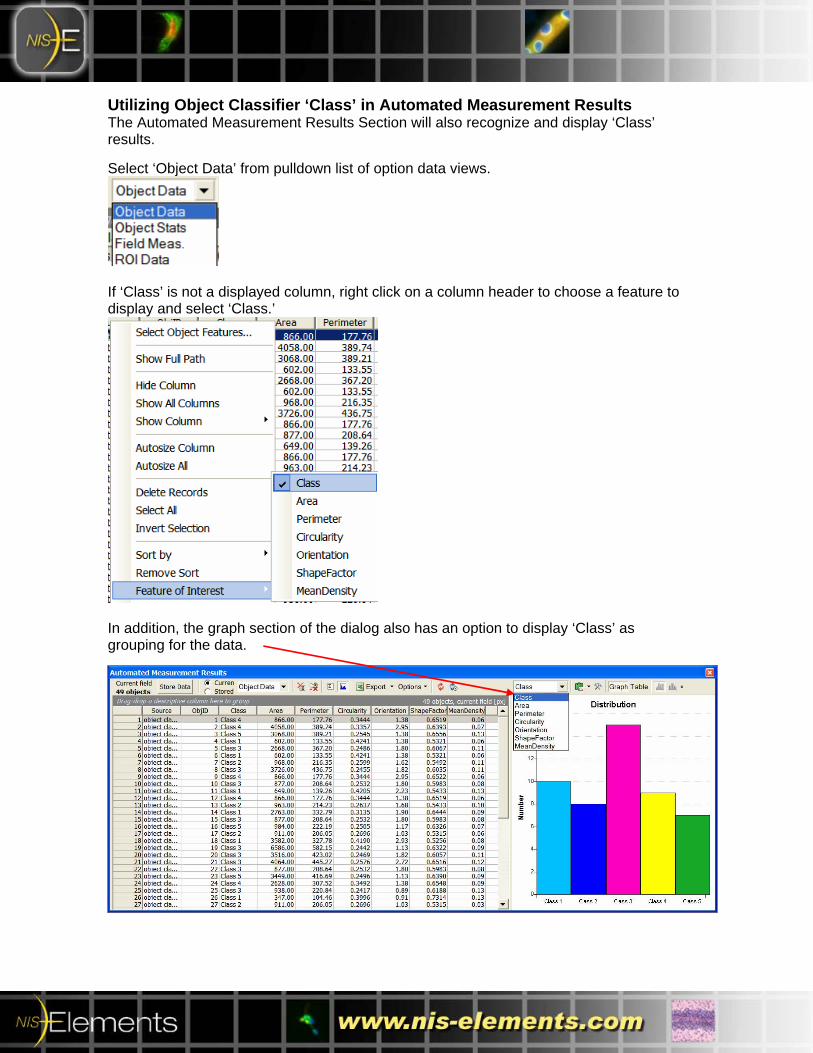
Utilizing Object Classifier ‘Class’ in Automated Measurement Results The Automated Measurement Results Section will also recognize and display ‘Class’ results. Select ‘Object Data’ from pulldown list of option data views.
If ‘Class’ is not a displayed column, right click on a column header to choose a feature to display and select ‘Class.’
In addition, the graph section of the dialog also has an option to display ‘Class’ as grouping for the data.