Embed Size (px)
Citation preview

Using Performance Monitor
(PerfMon) to monitor SCADA
systems
July 2012 / Technical Paper
by Dennis Tanzania / Greg Roberts / Simon Rooke / Vincent Thomas
Make the most of your energy
Page | 2
Make the most of your energy
Table of Contents I. Using Performance Monitor ...................................................................................... 4
A. Starting Performance Monitor ............................................................................ 4
B. Configuring the Performance Monitor window.................................................... 5
C. Creating Data Collector Sets .............................................................................. 6
II. Data Collector sets to monitor SCADA system’s performance ................................. 8
A. Example of Performance Counters .................................................................... 8
B. Example of Performance Counter Alert ............................................................ 13
III. Miscellaneous ......................................................................................................... 19
A. Displaying PID (Process ID) for each process instances ................................. 19
B. List of Performance counters available in SCADA v7.0 ................................... 21

Page | 3
Make the most of your energy
Abstract This document contains information on how to use Windows Performance Monitor to monitor the Health/Performance of SCADA systems. Performance Monitor is very useful for tracking and logging statistical data such as Memory/CPU usage as well as Citect performance counters (e.g. Number of Tag exist Requests) over time both locally and remotely. The graphical interface allows quick inspection of the data and it can also be exported for further analysis with graphing tools such as those available in Microsoft Excel.
Audience The contents of this document are targeted towards SCADA engineers, systems integrators and individuals with intermediate to advanced level knowledge of CitectSCADA/Vijeo Citect and looking to diagnose SCADA system’s performance issue.

Page | 4
Make the most of your energy
I. Using Performance Monitor
A. Starting Performance Monitor
PerfMon is located in Control Panel | Administrative Tools | Performance Monitor
Performance Monitor in Windows 7 32bit
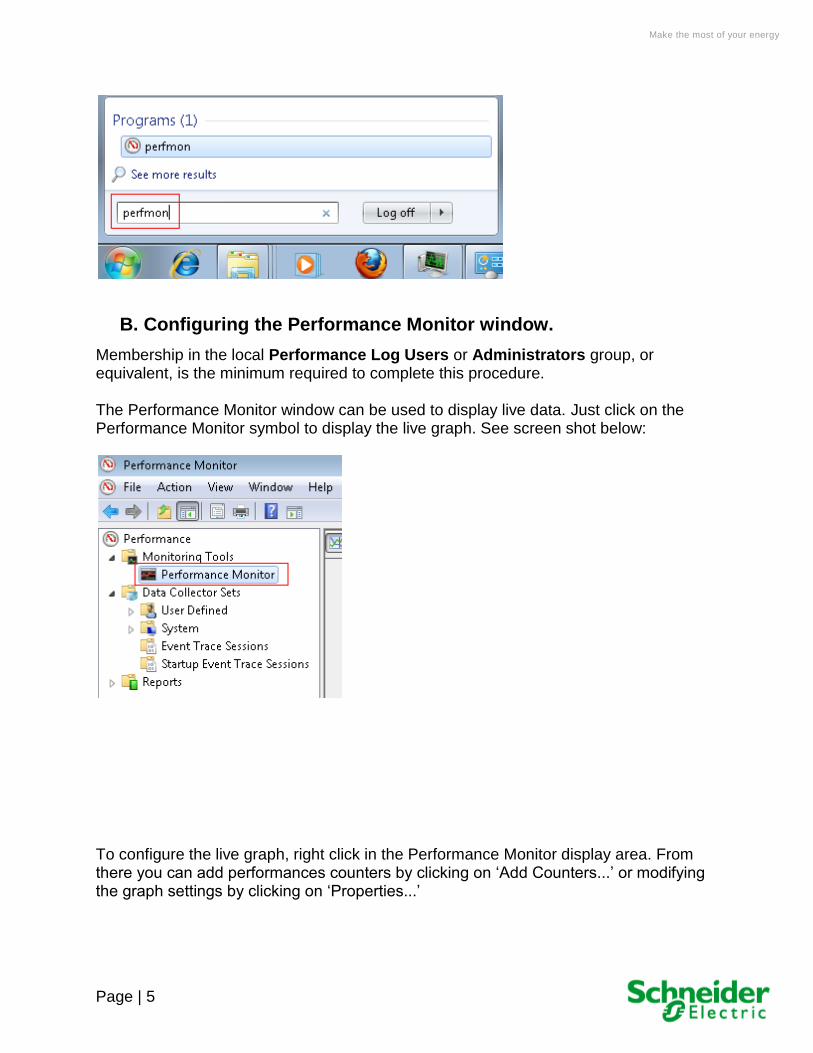
Alternatively it can be found by searching for PerfMon in the Windows ‘Search programs
and files’ field.
Page | 5
Make the most of your energy
B. Configuring the Performance Monitor window.
Membership in the local Performance Log Users or Administrators group, or equivalent, is the minimum required to complete this procedure. The Performance Monitor window can be used to display live data. Just click on the Performance Monitor symbol to display the live graph. See screen shot below:
To configure the live graph, right click in the Performance Monitor display area. From there you can add performances counters by clicking on ‘Add Counters...’ or modifying the graph settings by clicking on ‘Properties...’

Page | 6
Make the most of your energy
Please note that Performance Monitor window will not record on disk the information displayed. Should you need to record the information to disk for further analysis, please setup Data Collector sets in addition to the live monitoring through Performance Monitor window.
C. Creating Data Collector Sets
Membership in the local Performance Log Users or Administrators group, or equivalent, is the minimum required to complete this procedure. Data collector sets can be used to record to disk information (Memory usage, CPU usage, Handle count...) for a specific process. This is particularly useful when monitoring over long period of time and/or when post-capture analysis of the logs is required. To define a new Data Collector Sets click on ‘Data Collector sets’ in the Performance Monitor selection tree displayed on the left part of the window. Select ‘User Defined’ in the Performance Monitor selection tree on the left part of the window and right click on it. Select ‘New’ and then click on ‘Data Collector Set’:

Page | 7
Make the most of your energy
From this point you can give a name to your new data collector set, and define its properties from scratch (‘Create manually’ option) or from an existing template (‘Create from a template’ option)
The next section of this Technical Paper will provide detailed examples of Performance Monitor data collector sets useful to troubleshoot SCADA performance issues.

Page | 8
Make the most of your energy
II. Data Collector sets to monitor SCADA system’s performance
A. Example of Performance Counters
A Memory leak is suspected on the system: In this situation, it is recommended to monitor the following counters using a Data Collector Set – Performance counter:
Overall machine CPU usage
Individual Citect processes CPU usage
ID Process
Private Bytes
Thread count
Handle count 1- Create a new Data Collector Set (See Section I.C) 2- Give it a name (e.g. Citect_Memory) 3- Select ‘Create manually (Advanced)’, and click on the ‘Next’ button

Page | 9
Make the most of your energy
4- Select ‘Create Data Logs’ and ‘Performance counter’ 5- Click ‘Next’
6- Click ‘Add’ button
7- Expend the ‘Process’ menu by clicking on the arrow pointing down

Page | 10
Make the most of your energy
8- Select the following counters:
% Processor Time
ID Process
Private Bytes
Thread count
Handle count 9- Select all instances of the Citect32 process (If you wish to only monitor one Citect
process on this machine, then only select the corresponding Citect instance: See section IV. A. to know how to display Process ID for each Citect instance)

Page | 11
Make the most of your energy
10- Click on the ‘Add’ button to add performance counter
11- Click on the ‘OK’ button 12- Change the Sample interval to 10 seconds 13- Click ‘Next’
14- Select the directory where the data will be saved and click ‘Next’

Page | 12
Make the most of your energy
15- Click ‘Finish’ 16- Select the new Data collector set created 17- Right click on the new Performance counter created and select ‘Properties’
18- Change ‘Log Format’ to ‘comma separated’ and click ‘OK’
19- Click on the left side window of Performance monitor

Page | 13
Make the most of your energy
20- Click on the Green arrow pointing to the right to start capturing data
21- To stop the capture click on the black square
B. Example of Performance Counter Alert
Performance counter alert can be useful to warn users that a specific condition has been met. For example, Handle count, if allowed to continue growing indefinitely, will eventually result in a crash. It is useful for users to be alerted to the condition early so that a crash can be prevented and measures can be taken to diagnose the cause. See example below to set Performance Monitor to alert users to high handle count: 1- Create a new Data Collector Set (See section II.C) 2- Give it a name (e.g. Citect_Handle_Alert) 3- Select ‘Create manually (Advanced)’, and click on the ‘Next’ button

Page | 14
Make the most of your energy
4- Select ‘Performance Counter Alert’ and click ‘Next’
5- Click on the ‘Add’ button

Page | 15
Make the most of your energy
6- Expand the ‘Process’ menu by clicking on the arrow pointing down
7- Select the ‘Handle count’ counter 8- Select all instances of the Citect32 process (If you wish to only monitor one Citect
process on this machine, then only select the corresponding Citect instance. See section III. A. to know how to display Process ID for each Citect instance)
9- Click on the ‘Add’ button

Page | 16
Make the most of your energy
10- Click on the ‘OK’ button 11- Set the alert to trigger when the value is over 5000 for each of the Citect32 instance 12- Click ‘Next’
13- Click on the ‘Finish’ button 14- Select the new Data collector set created 15- Right click on the new Performance counter Alert created and select ‘Properties’

Page | 17
Make the most of your energy
16- Change ‘Sample Interval’ to 5 minutes
17- In the ‘Alert Action’ Tab, select the ‘Log an entry in the application event log’ option 18- If desired, you can also start a data collector set to monitor specific performance
counters when an alert is triggered

Page | 18
Make the most of your energy
19- In the ‘Alert Task’ tab, a task can be automatically started once the alert is triggered. A suggestion as shown below is to set Process Explorer to run to facilitate the capture of stack information which can be used to identify the cause of the increasing handle count.

Page | 19
Make the most of your energy
III. Miscellaneous
A. Displaying PID (Process ID) for each process instances
When running CitectSCADA in Multi-process and analysing the statistics through Perfmon, you will notice that when you want to add a "Citect" counter, each Citect process is on separate instances listed as Citect32, Citect32#1, Citect32#2, ...., etc. The following diagram shows what you will encounter in PerfMon:
It is hard for us to identify which Citect process corresponds to which PerfMon process instance displayed (i.e is Citect32#1 points to IOServer, Alarm, Report, or Trend process).

Page | 20
Make the most of your energy
There is a way to display Process ID (PID) of each process in PerfMon during counter selection. It involves a change in registry settings as follows:
1. Click Start, click Run, type RegEdit, and then click OK. 2. Locate and then click the following registry subkey:
HKEY_LOCAL_MACHINE\SYSTEM\CurrentControlSet\Services\PerfProc\Performance 3. On the Edit menu, click New, and then click DWORD Value. 4. Right-click New Value #1, click Rename, and then type ProcessNameFormat to
name the new value. 5. Right-click ProcessNameFormat, and then click Modify. 6. In the Data value box, type one of the following values, and then click OK:
o 1: Disables PID data. This value is the default value. o 2: Enables PID data.
7. Exit Registry Editor. 8. Close and re-open Performance Monitor
Since in Citect Runtime Manager, we can determine the unique PID for each Citect process, we can match it easily when PerfMon displays the PID in the counter selection.
Please note that when displaying Process ID in the instance name, Perfmon will stop recording data if the Citect process is restarted. This is due to the fact that after a restart the Citect process will get an new Process ID. Source: http://support.microsoft.com/kb/281884

Page | 21
Make the most of your energy
B. List of Performance counters available in SCADA v7.0
This is an advanced topic as in normal CitectSCADA use, you should not need these. However there may be times when some of these may be useful, e.g. KB article Q5137 referencing the 'SubscriptionNotifyRate' counter. All counters have a _totals_ instance which is the total of all other instances of this particular counter. The instances depend on the type of counter and if multiple processes for CitectSCADA are being used. Citect.Platform.PSI.PSIClient
This module lies within the Display Client functionality of CitectSCADA. Counter Name Comment
ExistsRequestsPerSecond Number of Tag exists requests made
ResolveRequestsPerSecond Number of tag resolve requests made
ResolvedTags Current number of resolved tags
UnresolvedTags Current number of unresolved tags
OutstandingAsyncOps Current number of outstanding async operations
SubscriptionDispatchQueue Current number of outstanding notifications
SubscriptionNotifyArrival Number of notify arrivals per second
SubscriptionNotifyDispatch Number of notify dispatches per second
NumberActiveTags Exist but not currently in use
NumberOfTagsSelectedForEviction Exist but not currently in use
NumberEvictedTags Exist but not currently in use
The instance name is similar to the runtime manager names and there is an instance per citect32.exe process.

Page | 22
Make the most of your energy
Citect.Platform.PSI.PSIConnector
This module lies within the IOServer functionality of CitectSCADA. Counter Name Comment
SubscriptionNotifiyRate Number of subscription notifications sent per second
The instance name is similar to the runtime manager names and there is an instance per IOServer
Citect.PlatForm.Net
Counters in this class are related to communications between some managed .NET components, mainly the handling of I/O. These are essentially internal transport items and are not of practical use to end users but are documented for completeness. In multi PC scenarios with one process on each side, the context will we clear. However when multiple processes are being used, then several processes statistics will be combined into the one instance set of statistics. In this context you will not be able to tell the contribution from the various processes on that PC. In this case the counters use is limited. Counter Name Comment
#BytesReceived Number of bytes received
#BytesSent Number of bytes sent
#MessagesReceived Number of messages received
#MessagesSent Number of messages sent
AvgAckDelay Average acknowledgement delay (MilliSeconds)
AvgBlockSizeReceived Average block size received
AvgBlockSizeSent Average block size sent
AvgBytesSent Average of bytes sent
AvgMessagesReceived Average messages received
AvgMessagesSent Average messages sent

Page | 23
Make the most of your energy
Notes:
- A command line version of PerfMon is available called "typeperf". Look on the Microsoft Web site www.microsoft.com for more information on these.
- In SCADA version 7.30/7.40 performance counters are disabled by default. Should you need to monitor them, please add the following parameters in your Citect.ini file: [Debug] EnablePSICounters=1 EnableTaskFrameworkCounters=1 EnableTransportCounters=1

Page | 24
Make the most of your energy
Disclaimer By using the information contained within this document, you agree to the following: Disclaimer of All Warranties SCHNEIDER ELECTRIC (AUSTRALIA) PTY LTD DISCLAIMS ANY AND ALL WARRANTIES WITH RESPECT TO SCHNEIDER ELECTRIC (AUSTRALIA) PTY LTD PRODUCTS AND THE RELATED DOCUMENTATION, WHETHER EXPRESS OR IMPLIED, INCLUDING SPECIFICALLY THE IMPLIED WARRANTIES OF MERCHANTABILITY AND FITNESS FOR A GENERAL OR PARTICULAR PURPOSE. CITECTSCADA/ VIJEO CITECT AND THE RELATED DOCUMENTATION ARE PROVIDED "AS IS," AND YOUR COMPANY UNDERSTANDS THAT IT ASSUMES ALL RISKS OF THEIR USE, QUALITY, AND PERFORMANCE. Disclaimer of Liability YOUR COMPANY AGREES AND ACKNOWLEDGES THAT SCHNEIDER ELECTRIC (AUSTRALIA) PTY LTD SHALL HAVE NO LIABILITY WHATSOEVER TO YOUR COMPANY FOR ANY PROBLEMS IN OR CAUSED BY SCHNEIDER ELECTRIC (AUSTRALIA) PTY LTD PRODUCTS OR THE RELATED DOCUMENTATION, WHETHER DIRECT, INDIRECT, INCIDENTAL, SPECIAL, OR CONSEQUENTIAL (INCLUDING LOSS OF PROFITS).
02

Page | 25
Make the most of your energy
© 2
009
Sch
neid
er
Ele
ctr
ic.
All
rig
hts
re
se
rve
d.
07
04
05
06
Schneider Electric (Australia) Pty Ltd
78 Waterloo Road
Macquarie Park, NSW 2113
Phone: + 61 (2) 9125 8500
Fax: + 61 (2) 9888 2941
http://www.schneider-electric.com
http://www.schneider-electric.com
© 2
012
Sch
neid
er
Ele
ctr
ic.
All
rig
hts
re
se
rve
d.