Embed Size (px)
Citation preview
Using Planning & Research to Segment MarketsA Practical Approach to Market Segmentation Page • 78
Chapter
3Using Planning & Research to Segment MarketsA Practical Approach to Market Segmentation
How do you introduce or improve segmentation procedures and activities at your agency? Effective andcost-efficient segmentation analysis requires the following inputs:
! Superior planning – A managerial framework emphasizing planning and research guidelinesleads to effective segmentation studies.
! Solid research – Choosing the optimal blend of primary, secondary, syndicated, and data basesources.
! Selecting the "right" segmentation dimensions – As detailed in the previous chapter, theseinclude geographics, demographics, usage and other behavioral measures, benefits, andpsychographics.
! Strategy development – Target market selection, positioning, nichemanship, and formulatingthe proper marketing mix based on product, pricing, promotional, and distribution elements.
! Implementation and control – Working, evaluating, and revising the segmentation plan.
Chapter 3 focuses on the first three elements of segmentation analysis. Each major section of this chapter isdivided into two parts:
! An overview of the topic, providing key definitions, procedures, and guidelines for implementinga segmentation analysis. It is not the purpose of this handbook to provide a detailed reference onconducting market research. The focus instead is the application of market research methods in aspecific situation – that is, conducting market segmentation analysis. Other references, includingthe handbook developed for TCRP Project B-2 – Integrating Market Research Into TransitDecision-Making, are available that will provide the reader with specific information on conductingmarket research that is applicable here.
! An illustration of an actual implementation of segmentation analysis using three case studies asexamples.
Using Planning & Research to Segment MarketsA Practical Approach to Market Segmentation Page • 79
Our Case Studies – Some Background
A major part of the effort behind this handbook was the conduct of an actual segmentation analysis of transitriders and nonriders using many of the basis variables described in the previous chapter. It was believed thatconduct of such research would provide considerable insight into the applicability of market segmentationspecifically in the transit industry. Four criteria were used to select agencies to participate in this researcheffort.
! Agencies must be of different size (small, medium-sized, and large urban), offer different modes(bus only and rail), and operate under different marketing and service planning philosophies.
! Agencies must have a sizable number of existing riders who are choice riders. In addition, themakeup of the market should be diverse. At least one market should include a university system,as college students have recently represented an important market opportunity for manysystems.
! All must have conducted some research in the past. That is, a major segmentation study of thetype proposed should not represent their first research effort.
! All must demonstrate a market-orientation in their approach to research, marketing, and serviceplanning. Moreover, all had to be open to the possible use of market segmentation strategies infuture marketing or service planning efforts.
The three transit agencies selected for the research effort were Washington Metropolitan Area TransitAuthority (WMATA), Milwaukee County Transit System (MCTS), and Boise Urban Stages (The BUS).Following are descriptions of each agency's background. They "set the scene" for the results from thissegmentation analysis.
The Milwaukee County Transit System's 535-bus fleet serves Wisconsin's largestcounty (242 square miles) with regular, shuttle, express, flyer, university, school and specialbuses. About 90 percent of the 965,000 residents live within one-quarter mile of service. Two-thirds of the 1,400 employees are bus operators, who collectively drive 20 million miles per yearpicking up close to 50 million passengers. For MCTS (as well as the average transit systemnationwide), 1997 ridership is about 4 percent higher than 1996 levels. The base fare was lastincreased in January, 1996 to $1.35.
Although Milwaukee area commuters have a short work-travel time (20 minutes), up to 11percent of workers use public transportation, ranking Milwaukee County 23rd of all U.S. counties(with New York 1st at 53 percent). With 70 rush-hour, 40 midday and 30 weekend routes, MCTShas a commitment to commuters and other choice and transit dependent riders.
Although Milwaukee County has neither gained nor lost population in the past fifteen years,neighboring counties have experienced double-digit growth. The City of Milwaukee, population620,600, is the nation's 17th largest city and has lost about 1 percent of its population in the lastfive years.
Heavy industry and the skills of an immigrant labor force forged Milwaukee's economy overfive generations. Milwaukee was the "machine shop of the world" and is still home to A.O.Smith Corp., Briggs & Stratton Corp., Allen-Bradley Co. and Harley-Davidson, Inc. Of thenation's 36 largest metro areas, Milwaukee ranks third (after San Jose and Detroit) in thepercentage of its workforce in manufacturing. Milwaukee produces 11 percent of the nation's
Using Planning & Research to Segment MarketsA Practical Approach to Market Segmentation Page • 80
malt beverages, but less than 1 percent work in a brewery such as Miller Brewing Company.Today, however, the service sector employs more people than manufacturing (30% vs. 22% ofthe workforce, respectively). In the past five years, the service sector added 54 percent of allnew jobs created; the manufacturing sector added 18 percent.
If its smokestack industries are declining, Milwaukee is still a factory town with stable unionwages and comfortable blue-collar lifestyles that include casino gambling and a cottage "upnorth." Although the African-American population has grown, Milwaukee County remains apredominately white, middle-class industrial center with a strong German and Polish heritage."Consumers here drink domestic beer, drive American cars, and belong to bowling leagues atsome of the steepest rates in the nation," said Michael Weiss in Latitudes and Attitudes. Yet,"many baby boom adults tend to join health clubs, see a lot of movies, and watch TV sports."
While 60 percent of Milwaukeeans were born there and 90 percent have lived there for ten ormore years, many move within the area: 47 percent live in a different house than they did fiveyears ago. Just over half (52%) of households are owner-occupied; 48 percent arerenteroccupied, with an average rent of $418. The median household income is $28,000. About31 percent of the county's households are single-person households and 37 percent are one-parent families; thus, two-thirds of Milwaukee County's 373,000 households have either an adultliving alone or a single parent with no other adult.
The 1996 unemployment rate was below 4 percent, lower than the national average. Themajority of business leaders (74%) responding to a Metropolitan Milwaukee Association ofCommerce survey said that their top concern was finding qualified workers. The impact onbusiness of the new state welfare-to-work ("W2") program was a concern as well, because theprivate sector will be called on to provide jobs, training, and support. Transit officials mentionedthis as an opportunity to serve.
In 1991, MCTS conducted a rider opinion / market segmentation study about safety, serviceavailability, cost and driver courtesy. Grouped by geographic area, the clusters of frequent andoccasional riders helped in introducing and evaluating new routes. For example, two new routesin "pro-transit" areas ranked 4th and 12th in ridership. But when service began in a "least-likely"area, ridership for that route ranked 34th.
MCTS conducted a rider survey about its operations in 1994, distributing questionnaires at passoutlets. MCTS conducts focus groups as needed; has a quarterly customer satisfaction survey;and participated in a regionwide research and marketing initiative coordinated by the WisconsinDepartment of Transportation.
MCTS is recognized for its quality service, management, and marketing that emphasizesconvenience, reliability and economy. Executives at MCTS are clear in their mission: "We're aservice." "It's the bus on the corner on time." "It's convenient for riders." "It works for peoplewithout a car." Their 1998 – 2002 Service Improvement Plan calls for accessible, convenient,efficient service that supports land use plans and essential economic, educational and socialactivities, while minimizing costs.
The 25-member Milwaukee County Board of Supervisors governs MCTS. "Managingrelationships with officials" can dominate the day's concerns at the transit office. Although thelocal share of MCTS operations is provided by the Milwaukee County property tax (which, for theproperty owner, can be $3,000-$4,000 for a house worth $100,000), transit managers said "lackof funding" was a challenge; achieving dedicated funding (away from the property tax) was theirgoal.
MCTS projects for 1997 included rerouting and marketing to accommodate the repaving of the I-94 expressway, a paratransit initiative, a new automated phone system, a state-of-the-systemreport, a five-year plan; new services and passes including employer-sponsored services, andmarketing projects. MCTS planned to begin using the 1997 market segmentation data with its I-94 marketing campaign, in casting the riders for their TV spots.
Using Planning & Research to Segment MarketsA Practical Approach to Market Segmentation Page • 81
Washington D.C.'s Metro operates 764 rail cars and 1,284 buses in the District ofColumbia and neighboring Northern Virginia and Maryland (in Virginia: Arlington and FairfaxCounties, and the Cities of Alexandria, Falls Church and Fairfax City; in Maryland: parts ofMontgomery and Prince George's Counties.) Metro's 8,400 employees provide transportation forthe service area population of 2.5 million. By 2020, the Metro service area is expected to haveone million more residents.
In 1997, Metrorail recorded over 148 million boardings at their 80 stations. With 106 millionpassengers boarding Metro's buses, these unlinked trips total 254 million boarding passengersfor the year. Average weekday ridership is 510,000 rail and 352,000 bus passengers. Railridership is increasing and Metro's parking lots are full. But along with federal reductions in theworkforce – in one year, the area lost 30,000 jobs – Metrobus ridership is declining. But not toworry. In 1997 there were two million jobs and four million people in Washington's largermetropolitan statistical area, but by 2020 there will be three million jobs (primarily in publicadministration, business and education) and 5.5 million people in the MSA. The need is there. Arecent Federal Highway study ranks the region first in the country in the per person cost ofwasted fuel and time from traffic, and predicts a 70 percent increase in vehicle miles traveled by2020.
The area is characterized by "affluent metropolitan sprawl and racially diverse singles," age 25 to44, who tend to be liberals and consumer advocates, according to Michael Weiss in Latitudesand Attitudes.
Washington residents stand near the top when it comes to brains (two out of three went tocollege); bucks (half of households earn more than $50,000 a year); workaholics (there are moretwo-career couples here than anywhere else); and fitness (they have high rates for exercising,jogging, tennis and skiing.) Although the area has many young singles drawn to the dozen areacolleges and high-glamour-low-pay Capitol Hill jobs, the area takes its character from its affluentsuburbs, where residents splurge on half-million-dollar-plus homes (three times the U.S.average) and drive luxury cars.
The $50,000 median household income is nearly twice that of Boise or Milwaukee, the other twoareas surveyed. As for the affluent suburbs, Arlington County, for example, is 6th highest in thenation for per capita income ($26,000 vs. the U.S. average of $14,400) and is 3rd of all U.S.counties for the highest percentage of adults with a bachelor's degree (52% versus 20% for thenation.) The average Commuter Store customer in Crystal City has a household income of$60,000.
Residents tend to take public transit or carpool to work. "The District" (as many locals say) is 5th
highest and Arlington County is 12th highest in the nation, with 49 percent and 39 percent ofworkers, respectively, commuting by rail, bus or rideshare. In addition to commuters, Metro alsohas the responsibility of communicating with the area's many visitors and new residents from allover the world. For example, one in five (21%) residents living in Arlington County was bornoutside the U.S.
The popular Metro rises to the challenge, according to the area's community leaders who saidthe rail service was "great . . . great" and "nothing works better in Washington than theMetrorail system." Metro won the American Public Transit Association's 1997 Heavy RailAward for creative ridership programs, joint development, security, innovation, construction
Using Planning & Research to Segment MarketsA Practical Approach to Market Segmentation Page • 82
programs, and impact on the regional economy. Speaking of economic impact, if not forMetrorail, an extra 26 highway lanes would be needed. According to the Urban Land Institute,Metrorail generated $15 billion in additional development in the region. As for housing, a dwellingwithin walking distance of the Ballston station costs $100,000 more; and there is new, top qualitystreetscaping nearby. Turning to Metrobus service, it is considered "pretty good" by communityleaders, who added, "but people don't know how good it really is." They wanted improvementssuch as timed connections and fast, frequent, direct service with memory headways.
Metro staff regularly works with its jurisdictions and connecting services such as Virginia RailwayExpress, MARC Commuter Rail Services, Alexandria's DASH, and the Fairfax CountyConnector. They work with employers and major destinations, such as the Pentagon (with30,000 employees) and National Airport, to everyone's benefit. Now, for example, with the 1997opening of the new National Airport Terminal, the Metro platform is adjacent and on the samelevel.
WMATA has the most sophisticated market segmentation research in the transit industrynationwide, with several related projects in the past five years. The most-likely-to-ride groupsfrom the 1993 Gallup study and the 1997 study documented in this report share strong definingcharacteristics. "Metro enthusiasts" from the 1993 study tended to be younger, single males,many of whom were working full-time, and often worked late. They tended to be active and firstto try something new. Nearly half were already riders who viewed Metrorail and Metrobusfavorably. Unfortunately, they really wanted to buy a car, and when they did, tended not to ridethe bus again.
This led staff to wonder about aiming marketing messages to attract this group when they tend toquit riding permanently as soon as they get a car. It's an important question, particularly sincethis 1997 work describes the same potential rider group. Strategies to consider include not lettingthem go (contacting them at home); assuring them it's okay to postpone getting a car (e.g., "acar costs more than you think"); and selling an asset such as the span of service, to this groupwho works late ("Ride anytime up to midnight"). While this group tended to take risks, the idea isnot to portray riding Metrobus as risky but rather to consider media such as MTV or approachesthat attract these young adults, versus images, marketing messages or media that feel safer fora government agency.
Using Planning & Research to Segment MarketsA Practical Approach to Market Segmentation Page • 83
Boise Urban Stages' 36-bus system serves Idaho's capital city with fixed routes andparatransit. The largest metropolitan area for 300 miles, Boise has retained its stately, yetvillage-like character with historic buildings including the domed Capitol built in 1912, and a 25-mile greenbelt along the Boise River. Cradled by rounded, desert-like hills, Boise is a center foragricultural trade, education, technology and government. It is home to Boise State Universityand three other colleges, a zoo, 55 parks, a summer-long Shakespeare Festival, an art museum,opera and ballet companies. In addition to state and local government, major employers includeHewlett-Packard, Micron Technology, and St. Luke's Regional Medical Center.
The population of 148,000 is predominately white (96%) and living in "family" households (65%).If enrollment in the public school system is an indication of public confidence, Boise enjoys highrates of approval with 93 percent of elementary and high school students in public schools. (Incomparison, Milwaukee's rate is 81%.) The median age is 32. The median annual householdincome is $29,000. According to Michael Weiss in Latitudes and Attitudes, moderation, familyvalues, financial investments and less government are "in." Music is country. Joining business,veteran and fraternal order groups at high rates, people in Boise also enjoy more individualpursuits such as fishing, hunting and skiing. The nearest skiing is only 16 miles from Boise.
Although the average work trip is eight miles, growth patterns are suburban and transit servicewill be moving from a radial to a hub system. Although THE BUS now operates only within thecity limits, the Community Vision for Transit and the Regional Public Transportation Plan 2015call for service throughout its home Ada County (which is expected to grow from 201,000 in 1990to 360,000 people by 2015) and to neighboring Canyon County, with a fleet of 158 buses servingsix million riders a year. Managers at THE BUS said their challenge is to "sell, fund and plan theCommunity Vision." They have a good head start: citizen advocacy groups support transit andpromote alternatives to building more roads and bridges, and highway officials realize theycannot meet the demand for increased roadways. They are already working with THE BUS ontravel demand management.
Operated by Transportation Systems Management of Idaho Inc., a subsidiary of McDonaldTransit Associates of Ft. Worth, Texas, THE BUS carried 1.2 million passengers (in unlinkedtrips) more than 900,000 miles in its 46-squre mile service area during 1996. Due to targetedmarketing and custom service for St. Luke's, Boise State and the school district, ridershipdoubled the last few years. It is leveling off in 1997, although demand-response ridershipcontinues to grow. The fleet replacement program has reduced the average age of vehicles(from 14 to 6 years) and operating costs, yet vehicle service miles have increased 15 percent inthe past two years.
THE BUS is committed to hiring nice people and has a customer focus in training for its 68employees, who have authority to make decisions otherwise reserved for supervisors. Forexample, drivers may give tokens to new riders who don't have the correct change, they maymake route deviations for passengers by simply letting the dispatcher know, and they contact thedispatcher when riders will be transferring at the downtown pulse. With mobile radio in hand, thedispatcher may leave the office to take a passenger home in case of a missed connection.These courtesies have led to highly satisfied customers and widespread community support.
Public involvement opportunities and market research have included stakeholder interviews,meetings with neighborhood groups and major employers, regional public meetings, a steeringcommittee for long-range planning, focus groups, telephone and on-board surveys.
Using Planning & Research to Segment MarketsA Practical Approach to Market Segmentation Page • 84
Approaching Segmentation: First Considerations and Steps
The First Necessity: Managerial Involvement
To work most effectively, market segmentation should serve as an essential element in anorganization's strategy. To assume this role, segmentation must have support from the very top of theorganization. This must then follow through most of the organization. For instance:
! The agency's marketing organization must be able to execute alternative marketing and/orservice strategies.
! The agency's financial department must be able to vary pricing.
! Operations must be able to vary and/or change existing route structures.
! Service Planning must be able to execute variations of basic service plans.
! Finance must be able to report costs and margins by market segment.
! Market research and analysis must be able to monitor and measure rider and nonrider responseand provide feedback to the organization by market segment.
Moreover, to succeed, market segmentation requires constancy and consistency to work properly. It isanything but a "one time deal." Rather, it is a continuing process of applying segmentation throughout theorganization.
These considerations make it plain that market segmentation requires top management buy-in and support.While marketers and/or market researchers may present the concept of segmentation to management oractually perform the necessary research, the final decision on most segmentation studies must, in mostcases, come from an organization's top management.
So how do you get management involved at this level? Nobody has yet devised a foolproof, systematicapproach to achieving management buy-in and support. Top management in the organization must havesome degree of willingness to undertake segmentation before the subject ever gets broached with them.Even in those cases where the directive to segment the market comes from "on high," there is no guaranteethat the project will be well received by the time it gets done.
Creating a sense of ownership and involvement by top management is crucial for the acceptance and use ofsegmentation results. In too many cases, marketers and/or researchers finally win approval – sometimesgrudgingly and only after months of personal "selling" to upper management – and then disappear until thefindings come out. By then, top management may not have a good sense of what the project intends to find– and may even find it hard to believe that they agreed to do it in the first place. In the worst case scenario,the management body that agreed to do the study is no longer in place. You can bypass this problem in twoways:
! First, keep management informed about segmentation studies.
! Second, and as much as possible, involve them in any decisions along the way.
While not a typical research effort, it was essential to have top management at each of the agencies involvedin the demonstration project. Following is a description of some strategies used to get and keepmanagement at the three transit sites involved in this effort.
Using Planning & Research to Segment MarketsA Practical Approach to Market Segmentation Page • 85
"MCTS gained momentum with several previous research projects. The informationfrom the research stimulated management's thinking. Overall, consumer research was useful inunderstanding aspects of our mission, such as service quality. In pricing, for example, MCTSdesigned a corporate pass based on what CEOs and CFOs said in focus groups and personalfollow-up interviews.
We knew the TCRP segmentation study would help in creating messages and understandingwhere potential markets are. This study would help bring ideas from our market forward todevelop good products. Because of the usefulness of prior research, our previous successespaved the way for this work, so it really wasn't hard to convince our top management toparticipate. A goal in our marketing plan is to assist our organization to be research- and market-driven." [Milwaukee County Transit System]
"While much of the cost of this research was borne by TCRP funding, allparticipating agencies were required to pay for all direct costs of conducting the interviews intheir markets, exclusive of the actual costs of data collection – that is, interviewing costs. It wasestimated that these costs could range from $10,000 to $15,000 per agency. Thus, it was initiallyimportant to "sell" the idea of participating in this research effort to the top management at thethree participating agencies. To accomplish this "sales" effort the project team employed a triedand true strategy that has proven effective in gaining internal support for research in many othersituations. An "advocate" was identified at each agency who was provided with the support andtools to present the advantages of participation to the management at each agency. Following isthe message one "advocate" took to their management.
"We convinced management of the value of participation. We were able to demonstrate thevalue based upon prior experience with marketing research. Moreover, in the past we had paidup to $50,000 for what we were going to get for $15,000. As information is a powerful tool, thisrepresented a great value. Finally, the inclusion of the "training" component for staff representedadded value." [WMATA]
"Having just received an award as the 'Outstanding Small Transit System' at APTA,it was a natural follow-up to our past research and marketing efforts to understand more aboutthe different markets for transit services here in Boise. Up to now, Boise Urban Stages hasfollowed an approach of 'being all things to all people.' With our rapid growth in populationwithout corresponding growth in resources, a more targeted approach to marketing publictransportation may be needed." [Boise Urban Stages]
Using Planning & Research to Segment MarketsA Practical Approach to Market Segmentation Page • 86
Once the research was completed, a second strategy was employed to encourage management buy-in andto assist the agencies in using the research. Members of the project team gave a one-day workshop at eachsystem. Project team members presented the results of the research as it applied to the individual system.The workshop was interactive in nature and participants were encouraged to bring challenges andopportunities facing their agencies to the table to illustrate how the research results might be applied.Systems were then given "homework" assignments to encourage them to use the results of the research inupcoming projects.
Cost Considerations in Segmentation Studies
Market segmentation studies are typically larger in scope than the market research efforts many transitagencies have traditionally conducted. Moreover, they are often more complex, requiring outside assistance– often from custom research firms that you may not have used before and/or who may be located outside ofyour immediate market area. Moreover, as noted above segmentation studies require greater involvement ofresources and staff throughout the agency. All too often, the amount of staff time required for certain aspectsof a segmentation study is grossly underestimated.
There are five primary components of costs to consider in a segmentation study. The first stage – ProblemDefinition – covers the time and costs involved in determining the purpose and objectives of the research. Inaddition, the basic parameters of the research effort – for example, the bases for market segmentation andthe development of a model or assumptions – are defined. Depending on the complexity of the problem andwho is involved in the process, the costs for Problem Definition can run from as little as $1,000 up to$10,000.
The second stage – Research Design – covers the time and costs associated with the actual design of theresearch effort. Costs included here are the costs and time involved to agree upon the final research design,the costs of selecting and contracting with an outside supplier if required, the costs of pretesting the design,and costs and time associated with redesigning the study based on the pretest. The extent of pretestingrequired, as well as the use of outside suppliers, can greatly impact the costs at this stage. Plan to spend aslittle as $2,000 to as much as $10,000 at this stage.
The third stage – Data Collection – is typically the most costly stage in the process and is affected primarilyby sample size, interview length, method of data collection, and the Effective Study Incidence (or theincidence of qualified respondents in the sampling frame or in the general population). While costs here canrange from as low as $10,000 to over $100,000, average costs are more likely to be between $30,000 and$60,000 (for sample sizes ranging from 1,000 up to approximately 2,500 interviews).
Costs in the fourth stage – Data Analysis – are largely affected by the nature of analysis that is to beconducted. Simple tabulation is relatively inexpensive – costing as little as $1,000 – and is typically seen withmarket segmentation efforts using a priori bases for segmentation or in tracking studies. If this is the firstmarket segmentation study you have conducted, or if a post hoc basis for segmentation is employed, costsfor Data Analysis are generally higher and can run as high as $20,000 to $30,000 if there is extensive use ofoutside services or if a standardized model such as VALS is used. Plan on spending between $5,000 and$15,000 here.
It is nearly impossible to put any range on the cost of Implementation – the last stage. However, indetermining the value of a segmentation study, it is important to consider how the results are likely to beused. The costs and risks associated with the nature of the decisions that will be based on this researchprovide a good mechanism against which to evaluate the expected value of this type of research effort. A$60,000 research project should not be authorized if it is likely that the study will only provide $30,000 worthof answers. However, if one examines the costs and risks associated with major service changes or anexpensive marketing communications and promotions program where hundreds, thousands, or even millionsof dollars may be expended with a great deal of uncertainty, a $60,000 research project that reduces thatuncertainty is likely to have much greater value.
Using Planning & Research to Segment MarketsA Practical Approach to Market Segmentation Page • 87
The following table further illustrates some of the factors that will affect the true costs of a segmentationstudy during each of these stages:
Stage Factors Affecting Costs
Problem Definition ! Senior management's involvement
! Research staff's time and effort
! Outside consulting as required (e.g., about basis variables and modeldevelopment)
Research Design ! Using staff versus outside suppliers to design and perform the study
! Sample design – notably sample sizes and procedures to addressmarketing questions and to insure projectability of the results to thepopulation
! Organizational demands for testing reliability and/or validity
! Steps needed to develop the survey instrument, including the extentof pretesting and analysis of the pretest data that will be required
Data Collection ! Interview method – e.g., phone, personal interview, or some othermethod
! Interview length
! Interview recruiting procedure
! Incidence of target population
! Sample size
! Supervision requirements
! Editing and coding requirements
Data Analysis: ! Segment determination and profiling
! Use of modeling or simulations
! Computer software and/or hardware requirements
! Need for outside assistance with analyzing data and interpretingresults
! Reporting and presentation requirements
Implementation ! Senior management's involvement
! Research staff's time and effort
! Other staff time and effort
! Outside consulting if necessary (e.g., about basis variables and modeldevelopment)
! Direct costs (e.g., media, production, etc.)
Using Planning & Research to Segment MarketsA Practical Approach to Market Segmentation Page • 88
Getting Outside Assistance
A final consideration before beginning is deciding whether or not to use outside assistance in designing,implementing, and evaluating a market segmentation study. As noted above, this type of research is oftenmore complex than the ridership studies, customer satisfaction surveys, or even awareness and attitudestudies your agency may have performed in the past. In most cases, it is advisable to use a skilled marketingresearch firm or marketing consultant in the project. Some organizations have also relied on the advice ofuniversity faculty. It is beyond the scope of this handbook to provide details on where to find and how toselect marketing research firms or consultants. However, following is a checklist of twenty importantquestions to ask your research supplier before contracting for a market segmentation study.
" Does the research firm have experience in public transportation or is their experiencein other markets applicable to public transportation?
" How do they view the purpose of the project?
" From a research perspective, what is involved in this segmentation study – in whatspecific areas will you need the most assistance?
" Will the research company work closely with you in the project?
" What types of primary and/or secondary segmentation bases have they advised?
" Have they considered all appropriate bases and variables?
" Will secondary or syndicated data and/or physical attribute dimensions be used?
" What data collection methods will be employed?
" Will the survey instrument be pretested?
" What size sample will be used?
" Is the research product or service-driven?
" Is the research design based on causal, descriptive, or exploratory factors?
" What analytical methods will be employed?
" How reliable will the findings be?
" How practical will the information be?
" Is assistance available in understanding and implementing the findings?
" What information will be provided – analysis only or analysis plus recommendations?
" Will there be an oral and written report of the findings?
" How much will it cost?
" If this is a baseline study, how will I be able to apply the segmentation results to futureresearch?
Using Planning & Research to Segment MarketsA Practical Approach to Market Segmentation Page • 89
Plan, Plan, Plan
Planning is the essential ingredient of any successful research program. It is particularly important and ofteninvolves a different approach than what you may have used in your past research efforts. Planning involvesthe following five steps:
! Establish research objectives.
! Specify target population measurement units.
! State relevant definitions.
! Recognize segmentation viability / segment formation criteria.
! Select segmentation bases.
Establish Research Objectives
As with any research project, the first step in conducting a segmentation analysis is to establish appropriateobjectives for the research. The goal of this effort is to be able to answer the question, "What are we trying toaccomplish in this research project?" There are three basic steps when establishing research objectives: (1)understanding the background of the project, (2) establishing the research purpose, and (3) setting researchobjectives.
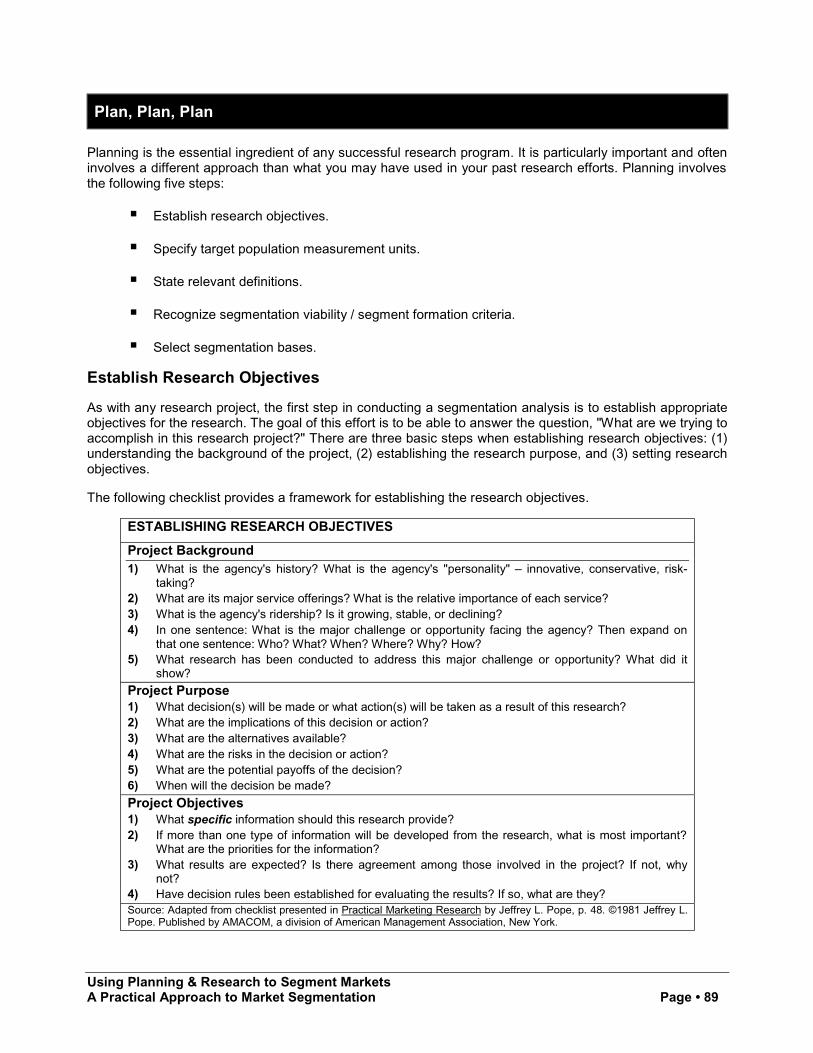
The following checklist provides a framework for establishing the research objectives.
ESTABLISHING RESEARCH OBJECTIVES
Project Background1) What is the agency's history? What is the agency's "personality" – innovative, conservative, risk-
taking?2) What are its major service offerings? What is the relative importance of each service?3) What is the agency's ridership? Is it growing, stable, or declining?4) In one sentence: What is the major challenge or opportunity facing the agency? Then expand on
that one sentence: Who? What? When? Where? Why? How?5) What research has been conducted to address this major challenge or opportunity? What did it
show?
Project Purpose1) What decision(s) will be made or what action(s) will be taken as a result of this research?2) What are the implications of this decision or action?3) What are the alternatives available?4) What are the risks in the decision or action?5) What are the potential payoffs of the decision?6) When will the decision be made?
Project Objectives1) What specific information should this research provide?2) If more than one type of information will be developed from the research, what is most important?
What are the priorities for the information?3) What results are expected? Is there agreement among those involved in the project? If not, why
not?4) Have decision rules been established for evaluating the results? If so, what are they?Source: Adapted from checklist presented in Practical Marketing Research by Jeffrey L. Pope, p. 48. ©1981 Jeffrey L.Pope. Published by AMACOM, a division of American Management Association, New York.
Using Planning & Research to Segment MarketsA Practical Approach to Market Segmentation Page • 90
Unlike other research projects, segmentation analysis offers the agency an opportunity to take a step backand to take a careful look at the background of the agency and its situation. This process of "setting thescene" allows the agency to better understand the environment in which the segmentation analysis will beused and provides a backdrop against which many subsequent decisions will be made. Also, critical to theultimate success of a segmentation analysis is an understanding of the purpose of the research from theperspective of the management – that is the "management's desires."
Once the background of the study is understood, the overall purpose of the research should be agreed to.The focus here is on understanding how the research will be used rather than the specific type of informationthat will be sought or the specific methodologies that will be used.
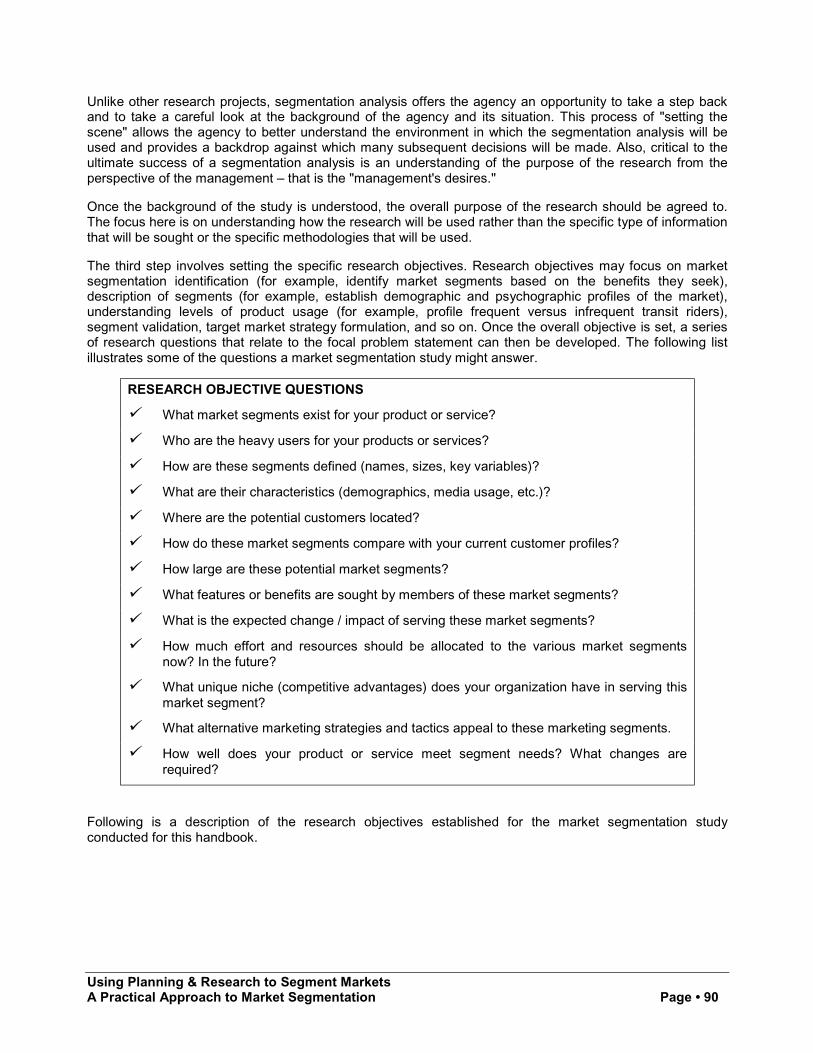
The third step involves setting the specific research objectives. Research objectives may focus on marketsegmentation identification (for example, identify market segments based on the benefits they seek),description of segments (for example, establish demographic and psychographic profiles of the market),understanding levels of product usage (for example, profile frequent versus infrequent transit riders),segment validation, target market strategy formulation, and so on. Once the overall objective is set, a seriesof research questions that relate to the focal problem statement can then be developed. The following listillustrates some of the questions a market segmentation study might answer.
RESEARCH OBJECTIVE QUESTIONS
" What market segments exist for your product or service?
" Who are the heavy users for your products or services?
" How are these segments defined (names, sizes, key variables)?
" What are their characteristics (demographics, media usage, etc.)?
" Where are the potential customers located?
" How do these market segments compare with your current customer profiles?
" How large are these potential market segments?
" What features or benefits are sought by members of these market segments?
" What is the expected change / impact of serving these market segments?
" How much effort and resources should be allocated to the various market segmentsnow? In the future?
" What unique niche (competitive advantages) does your organization have in serving thismarket segment?
" What alternative marketing strategies and tactics appeal to these marketing segments.
" How well does your product or service meet segment needs? What changes arerequired?
Following is a description of the research objectives established for the market segmentation studyconducted for this handbook.
Using Planning & Research to Segment MarketsA Practical Approach to Market Segmentation Page • 91
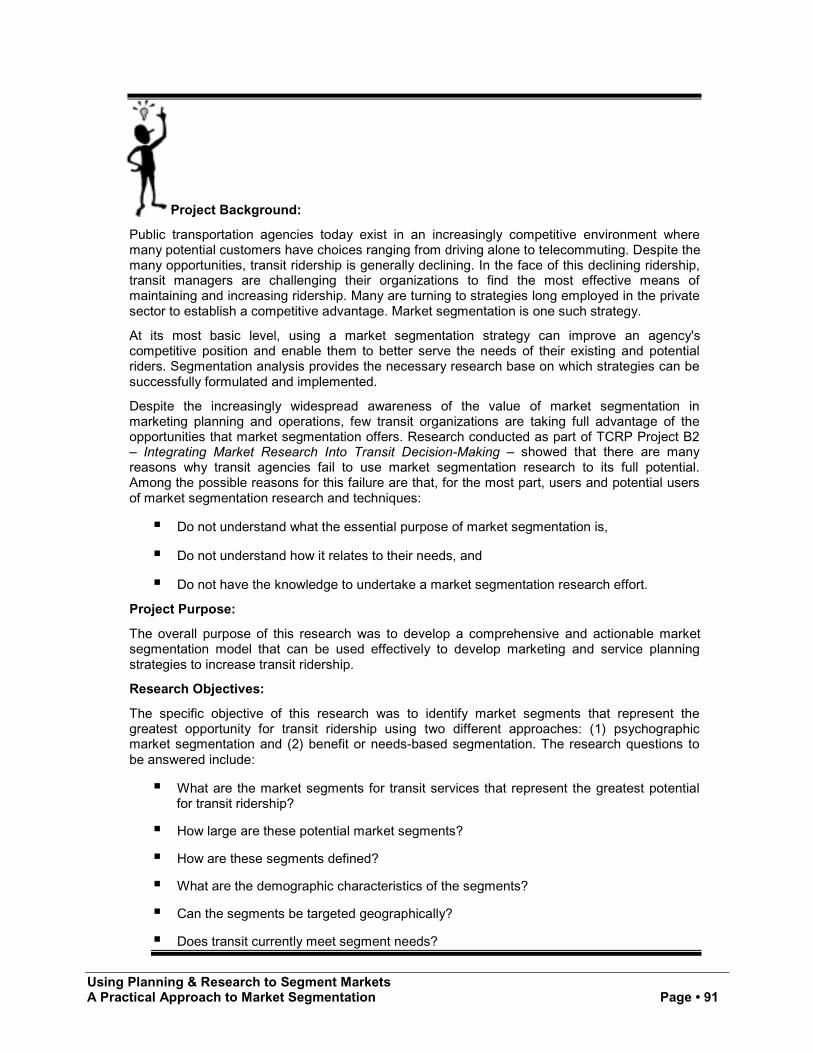
Project Background:
Public transportation agencies today exist in an increasingly competitive environment wheremany potential customers have choices ranging from driving alone to telecommuting. Despite themany opportunities, transit ridership is generally declining. In the face of this declining ridership,transit managers are challenging their organizations to find the most effective means ofmaintaining and increasing ridership. Many are turning to strategies long employed in the privatesector to establish a competitive advantage. Market segmentation is one such strategy.
At its most basic level, using a market segmentation strategy can improve an agency'scompetitive position and enable them to better serve the needs of their existing and potentialriders. Segmentation analysis provides the necessary research base on which strategies can besuccessfully formulated and implemented.
Despite the increasingly widespread awareness of the value of market segmentation inmarketing planning and operations, few transit organizations are taking full advantage of theopportunities that market segmentation offers. Research conducted as part of TCRP Project B2– Integrating Market Research Into Transit Decision-Making – showed that there are manyreasons why transit agencies fail to use market segmentation research to its full potential.Among the possible reasons for this failure are that, for the most part, users and potential usersof market segmentation research and techniques:
! Do not understand what the essential purpose of market segmentation is,
! Do not understand how it relates to their needs, and
! Do not have the knowledge to undertake a market segmentation research effort.
Project Purpose:
The overall purpose of this research was to develop a comprehensive and actionable marketsegmentation model that can be used effectively to develop marketing and service planningstrategies to increase transit ridership.
Research Objectives:
The specific objective of this research was to identify market segments that represent thegreatest opportunity for transit ridership using two different approaches: (1) psychographicmarket segmentation and (2) benefit or needs-based segmentation. The research questions tobe answered include:
! What are the market segments for transit services that represent the greatest potentialfor transit ridership?
! How large are these potential market segments?
! How are these segments defined?
! What are the demographic characteristics of the segments?
! Can the segments be targeted geographically?
! Does transit currently meet segment needs?
Using Planning & Research to Segment MarketsA Practical Approach to Market Segmentation Page • 92
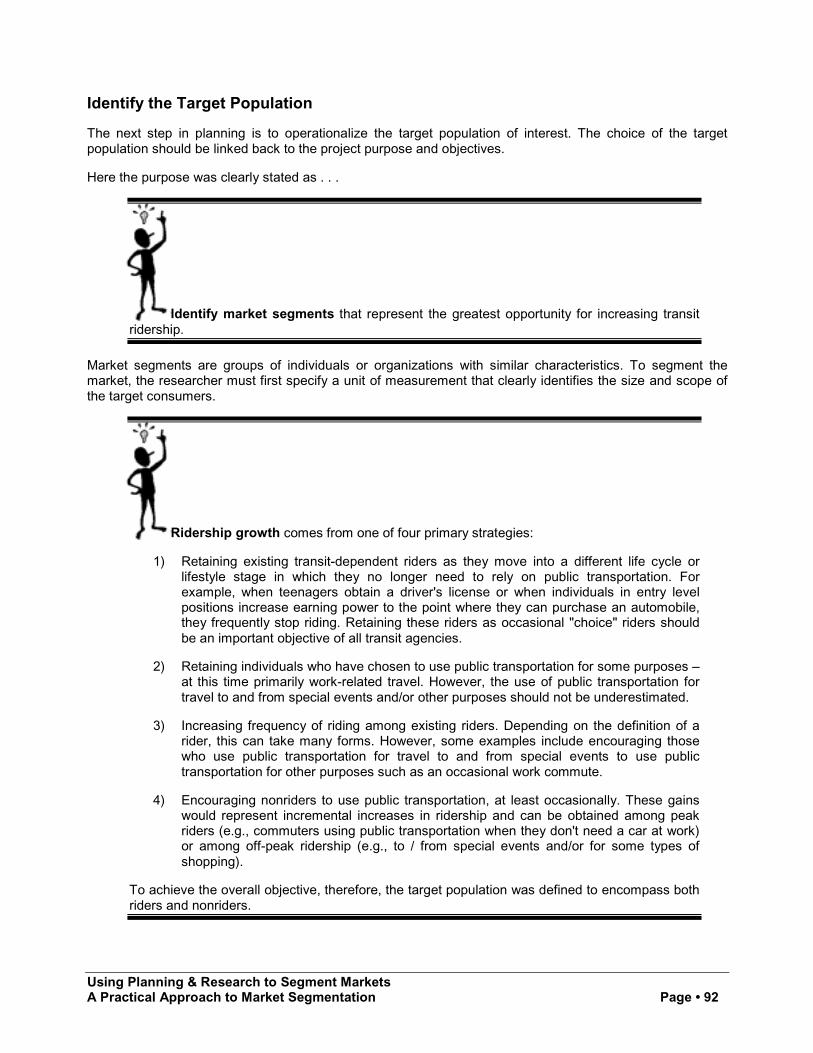
Identify the Target Population
The next step in planning is to operationalize the target population of interest. The choice of the targetpopulation should be linked back to the project purpose and objectives.
Here the purpose was clearly stated as . . .
Identify market segments that represent the greatest opportunity for increasing transitridership.
Market segments are groups of individuals or organizations with similar characteristics. To segment themarket, the researcher must first specify a unit of measurement that clearly identifies the size and scope ofthe target consumers.
Ridership growth comes from one of four primary strategies:
1) Retaining existing transit-dependent riders as they move into a different life cycle orlifestyle stage in which they no longer need to rely on public transportation. Forexample, when teenagers obtain a driver's license or when individuals in entry levelpositions increase earning power to the point where they can purchase an automobile,they frequently stop riding. Retaining these riders as occasional "choice" riders shouldbe an important objective of all transit agencies.
2) Retaining individuals who have chosen to use public transportation for some purposes –at this time primarily work-related travel. However, the use of public transportation fortravel to and from special events and/or other purposes should not be underestimated.
3) Increasing frequency of riding among existing riders. Depending on the definition of arider, this can take many forms. However, some examples include encouraging thosewho use public transportation for travel to and from special events to use publictransportation for other purposes such as an occasional work commute.
4) Encouraging nonriders to use public transportation, at least occasionally. These gainswould represent incremental increases in ridership and can be obtained among peakriders (e.g., commuters using public transportation when they don't need a car at work)or among off-peak ridership (e.g., to / from special events and/or for some types ofshopping).
To achieve the overall objective, therefore, the target population was defined to encompass bothriders and nonriders.
Using Planning & Research to Segment MarketsA Practical Approach to Market Segmentation Page • 93
Once the basic descriptor has been identified, additional modifiers can be used to better understand andexplain the target population.
Among riders, two known segments exist – (1) those riders who are dependent uponpublic transportation because they do not drive and/or do not have access to an automobile and(2) those riders who have chosen to ride public transportation. In most cases, this latter segmentdoes drive and/or does have access to an automobile. However, some members of this segmenthave "voluntarily" become dependent upon public transportation, choosing to give up ownershipof an automobile or ownership of a second car and use transit instead. These people still mustbe considered choice riders as they typically have the ability to purchase a car at any time.
In further defining the target population for this research, the decision was made to focus onchoice riders and nonriders. First, and foremost, ridership retention efforts must be directed atchoice riders and newly choice riders. This latter group represents transit dependent riders whoacquire a driver's license and/or car and thus become choice riders. Much of the decline inridership can be attributed to loss of this group of existing riders. Second, choice riders representa greater opportunity than transit dependent riders for increased frequency of ridership. Transitdependent riders typically ride as often as they need too, representing little opportunity forridership growth. On the other hand, choice riders often ride for one purpose only – e.g., tocommute to work or to travel to special events. There are opportunities for increased frequencyof riding by encouraging choice riders to ride for other types of trips. Finally, nonriders representthe other side of the equation. They represent the largest proportion of the population in nearlyall markets. In smaller markets, such as Boise, nonriders represent as much as 98 percent of thepopulation. Attracting even a small percentage of this market can represent significant ridershipgains.
State Relevant Definitions
In addition to defining the target population, other definitions are important in planning the segmentationanalysis. The market or service area is frequently the most critical definition. Geographical limitations orboundary areas must be set.
WMATA provides service to the District of Columbia and neighboring Northern Virginiaand Maryland (in Virginia: Arlington and Fairfax Counties, and the Cities of Alexandria, FallsChurch and Fairfax City; in Maryland: parts of Montgomery and Prince George's Counties).Because WMATA does not provide service to all areas of these counties, the service area wasfurther defined by zip code. Respondents were carefully screened to determine first whichcounty, district, or city they lived in and then whether they lived in one of the over 150 zip codesused by WMATA to define its service area.
Using Planning & Research to Segment MarketsA Practical Approach to Market Segmentation Page • 94
Milwaukee County Transit System serves nearly all of Milwaukee County. Respondentswere screened to determine first if they were a resident of Milwaukee County and then if theylived in one of the zip codes that defined MCTS's service territory.
Boise Urban Stages provides service within the City of Boise. Potential respondentswere initially screened to determine whether they lived in one of the zip codes that broadly defineBoise's service area. Two zip codes were only partially within The BUS' service territory.Potential respondents living in those zip codes were further screened to determine whether theylived within the service territory as delineated by major geographic boundaries – in this case,major arterials known to nearly everyone in Boise were used.
Other definitions that may need to be specified in a segmentation study might include, but are not limited to,the demographic and socioeconomic classifications to evaluate, criteria for determining benefits or lifestyles,and consumption measures. In this instance, the definitions of a nonrider and a choice rider were critical.These definitions follow.
Nonriders are defined as individuals aged eighteen and older who have not ridden in thepast year, or if they have ridden in the past year, they have done so only infrequently (less thanonce a month) or only because their car was not available, in cases of bad weather, or for aspecial event or occasion.
Choice riders are defined as individuals aged eighteen and older who have ridden once amonth or more often in the past year, have a valid driver's license, have a car available for theirpersonal use, or if they do not have a car available use public transportation because they havechosen not to buy a car or to buy an additional car for the household.
Using Planning & Research to Segment MarketsA Practical Approach to Market Segmentation Page • 95
Recognize Segmentation Viability / Segment Formation Criteria
Not every market can be segmented. Other markets that can be segmented may not be feasible to pursuefrom a marketing or planning perspective. Therefore, before undertaking a segmentation analysis, themarkets should be assessed as to segmentation viability. Art Weinstein identified four questions, called the"4 R's", to indicate whether market segmentation is worth pursuing17.
! Can you objectively and subjectively rate your target markets by their importance to your overallmarketing program?
By rating a market or target population, the marketer or planner evaluates both objectively andsubjectively its potential relative to other market opportunities. The goal should be to quantify thesize of the target population and possible segments before segmentation. Past researchconducted by your agency or industry research can be used to rate your target market. Forsegmentation to be viable, the market must be identifiable and measurable.
! Are your target markets of realistic size, large enough to profitably pursue?
The market or target population must be large enough to support more than one type ofmarketing approach. Moreover, the segments that are ultimately identified must be of sufficientmagnitude so that distinct marketing programs can be developed for the target markets.
The target population of nonriders is typically very large. Previous research at eachsystem indicated that the population of nonriders for WMATA is at least 70 percent of thepopulation, for MCTS the population of nonriders is approximately 85 percent of the population,and for The BUS as much as 98 percent of the population. While potentially a difficult market towin, attracting even a small proportion of nonriders can represent significant ridership gains.
Conversely, the target population of choice riders as a percent of the total population is quitesmall. However, as a proportion of riders it can be significant. For agencies such as WMATA,research suggests that choice riders may represent as much as 40 to 60 percent of the riderbase. On the other hand, for agencies such as MCTS and The BUS, the proportion of choiceriders relative to transit dependent riders is much smaller – from as little as 10 percent to asmuch as 30 percent. However, research also suggests that agencies lose a significant proportionof transit dependent riders when they get a driver's license and/or car and could potentiallybecome choice riders. Therefore, while a smaller target, understanding and targeting choice andnewly choice riders in a rider retention effort is extremely important for maintaining andincreasing ridership.
17 Weinstein, Arthur, "Strategic Segmentation: A Planning Approach for Marketers." Journal of Segmentation in Marketing, (Volume 1, Number 21997), pp. 7 – 16.
Using Planning & Research to Segment MarketsA Practical Approach to Market Segmentation Page • 96
! Can you reach your customers easily through the mass media, mailing lists, or other means?
For segmentation to work effectively, the resulting target markets must be easily reached tominimize marketing investment and maximize performance. It is clear from past marketing effortson the part of transit agencies nationwide that, in most cases, riders and nonriders can beeffectively reached through traditional mass media. Moreover, some transit agencies (e.g., MCTOin Minneapolis) have experimented with nontraditional methods, using a more direct one-to-onemarketing approach.
! Will targeted customers respond to marketing initiatives?
Identifying a large enough segment of customers that can be reached by a reasonable means isof little value if they are nonresponsive to marketing efforts. Again, it is clear from past marketingefforts by transit agencies that while a large number of nonriders will, under no circumstances,ride public transportation, nonriders can be successfully attracted with the introduction ofinnovative products and services, and through effective marketing programs informing them ofexisting services. Moreover, there is evidence to support the importance of marketing to existingriders as their life styles change.
Assuming positive responses to the above questions, the next step should be to identify criteria for whatconstitutes "good" market segments. The following criteria are widely used as the standards for marketsegmentation. However, your agency may also choose to identify specific segment formation standardsbased on the specific decisions you are making and the alternatives you are considering.
! Homogeneity within the segment – This is the test for similarities among group members.Individuals within the segment should fit some sort of "typical profile." Because of their similarcharacteristics, it is to be expected that members should exhibit similar patterns of behavior orpotential for behavior.
! Heterogeneity between segments – This is the test for differences between the identifiedsegments. Segments should be clearly distinct from one another and have their own"personality." It should be clear which group an individual belongs to based on key attributes.Different segments generally exhibit different behaviors, have different needs or motives whichthen can be targeted by the marketer or planner.
! Sizable population – Most segmentation studies identify two or more segments to possiblypursue. Over-segmenting a market – that is dividing the market into a multitude of mini-markets –is costly and is generally of little value for developing strategies – either service planning ormarketing. While the purpose of segmentation is to create targeted marketing programs, it is notmeant to be as extreme as a one-to-one marketing effort. Therefore, one of the criteria forsegmentation should be the ability to create market segments that represent a sizable proportionof the population.
! Meaningful segment data – Finally, for segmentation to be effective, there must be value to themarketing information that is provided. Good market segmentation research must provide themarketer and planner with operational data that is practical, usable, and can be readily translatedinto strategies.
Using Planning & Research to Segment MarketsA Practical Approach to Market Segmentation Page • 97
Select Bases for Segmentation
As Chapter 2 pointed out, markets can be segmented in a variety of ways. The selection of the basisvariables is a critical decision in any segmentation study. There is no one clear, best method. The basis orbases to use depend on a company's marketing situation and the information needed by management. It isoften useful, therefore, in a segmentation study to develop a model that identifies the nature of the consumerdecision process and the variables that affect that process. The development of a model is unique to marketsegmentation research and may be one area for which outside assistance may be needed.
A model was developed for the project that explores the links between the independent variables –demographic characteristics, values, lifestyle, attitudes toward transit, etc. – and the dependent variable –transit ridership. Developing a sound conceptual model was essential to the research design process as itformed the basis for decisions about sample design, questionnaire design, and the development of ananalysis plan. The process by which the model was developed and the resulting model are described indetail below.
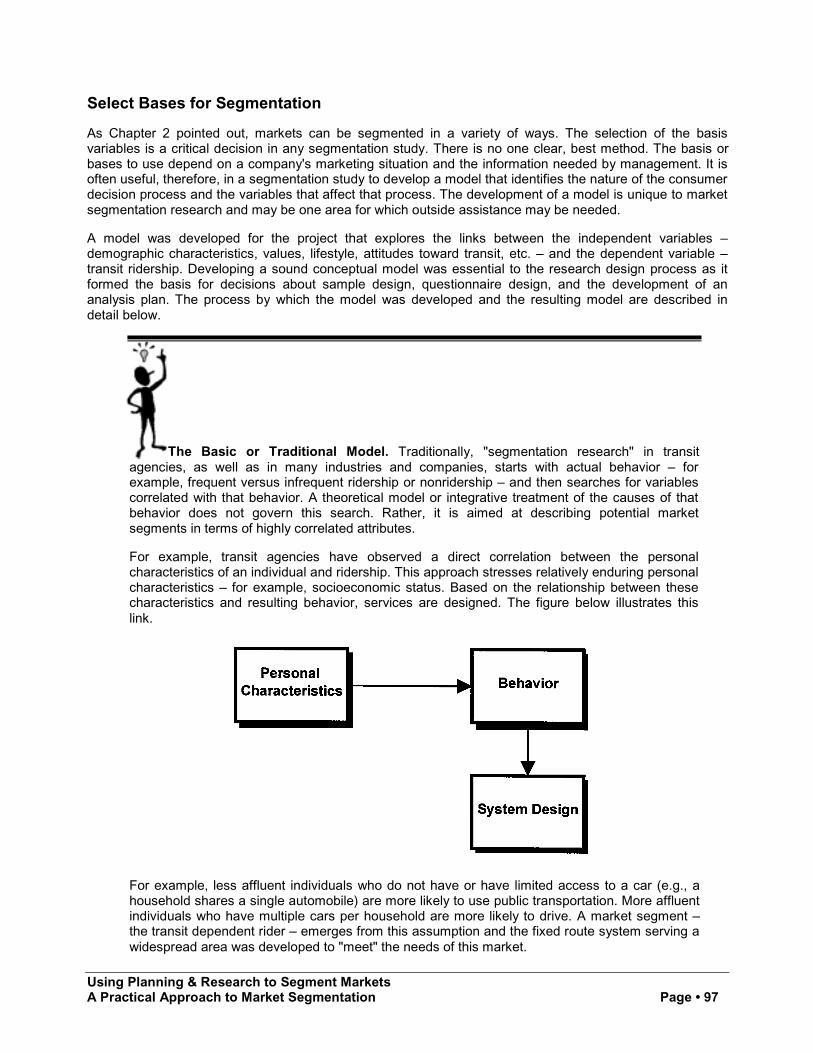
The Basic or Traditional Model. Traditionally, "segmentation research" in transitagencies, as well as in many industries and companies, starts with actual behavior – forexample, frequent versus infrequent ridership or nonridership – and then searches for variablescorrelated with that behavior. A theoretical model or integrative treatment of the causes of thatbehavior does not govern this search. Rather, it is aimed at describing potential marketsegments in terms of highly correlated attributes.
For example, transit agencies have observed a direct correlation between the personalcharacteristics of an individual and ridership. This approach stresses relatively enduring personalcharacteristics – for example, socioeconomic status. Based on the relationship between thesecharacteristics and resulting behavior, services are designed. The figure below illustrates thislink.
For example, less affluent individuals who do not have or have limited access to a car (e.g., ahousehold shares a single automobile) are more likely to use public transportation. More affluentindividuals who have multiple cars per household are more likely to drive. A market segment –the transit dependent rider – emerges from this assumption and the fixed route system serving awidespread area was developed to "meet" the needs of this market.
Using Planning & Research to Segment MarketsA Practical Approach to Market Segmentation Page • 98
Frequently, higher levels of service are targeted in lower income neighborhoods. This systemoften requires multiple transfers to get from an individual's origin to their destination, travel timeis not competitive, and service hours and frequency may vary throughout the day. However, theservice "meets" the needs of the market, as they have no other option.
In more recent years, transit agencies have identified a second target market – commuters.Again, this market is distinguished by their personal characteristics – that is, they typicallycommute from a suburban area to a high-density urban area, usually the downtown CBD.Agencies believe that a large segment of this market represents "choice" riders. That is, theyhave a car available but have chosen to use public transportation. Efforts have been made todevelop services that better "meet" the needs of this market. Park-and-ride lots providing directservice to the downtown CBD, frequent peak-hour service, and express "flyers" are all examplesof service strategies designed to meet the demands of this market. While this market appears tohave a choice, a closer examination of their characteristics indicates that in many cases it is theabsence of parking and/or the cost of parking where they work that influences ridership. In manyways, this market is as "captive" as the transit-dependent riders described above. Moreover, asdensities and work patterns in cities and suburbs have changed, many systems have seendramatic erosion in market share from within this market.
An Expanded View
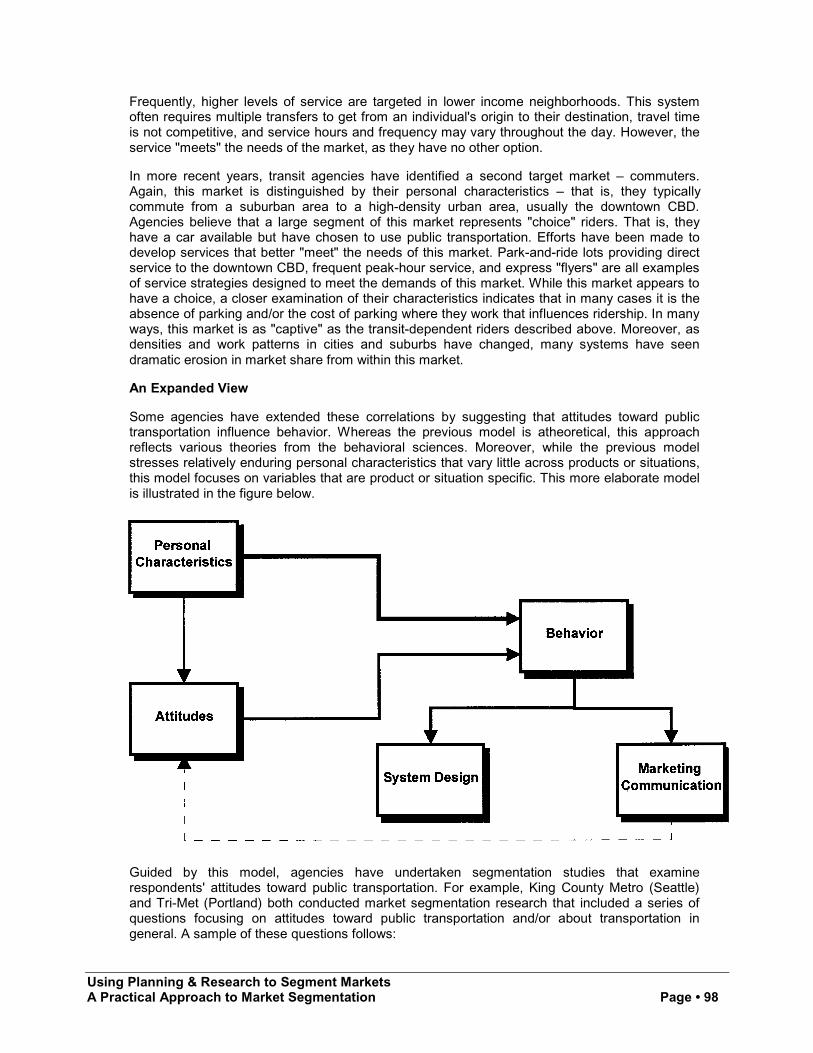
Some agencies have extended these correlations by suggesting that attitudes toward publictransportation influence behavior. Whereas the previous model is atheoretical, this approachreflects various theories from the behavioral sciences. Moreover, while the previous modelstresses relatively enduring personal characteristics that vary little across products or situations,this model focuses on variables that are product or situation specific. This more elaborate modelis illustrated in the figure below.
Guided by this model, agencies have undertaken segmentation studies that examinerespondents' attitudes toward public transportation. For example, King County Metro (Seattle)and Tri-Met (Portland) both conducted market segmentation research that included a series ofquestions focusing on attitudes toward public transportation and/or about transportation ingeneral. A sample of these questions follows:
Using Planning & Research to Segment MarketsA Practical Approach to Market Segmentation Page • 99
If offered a choice between convenient public transportation and taking a car, I would always drive a careven in rush hour traffic.
As long as gas prices stay low, I'll drive my car rather than use public transportation.
I often worry about others on the bus who may create disturbances.
We are going to have to change our attitudes about how we use our cars.
People who ride the bus are not usually like me.
If I have to start my car anyway, I might as well drive all the way rather than park and catch a bus or train.
Other agencies, such as Caltrans, have focused more on a benefit segmentation approach,exploring which attributes are important in service design. The assumption is that the presenceand/or absence of these attributes influence behavior. Questions used in this approach include:
As you know, different people consider different things important when they are deciding how they will travel to andfrom work or school I'd like to know what you personally find desirable in a method for getting to and from work orschool.
I can count on it to get me to where I am going on time.
Offers me the flexibility I need for my schedule.
Gets me to and from work / school without feeling stressed.
I can get other things done while commuting, it's not just dead time.
Gives me an opportunity to be alone to think.
Gets me there and home the quickest way possible.
Is good for the environment.
Minimizes my risk of getting in a traffic accident.
It's someone else's responsibility to get me there on time.
In the attitudinal studies, the attitude statements are analyzed using some form of multivariateanalysis – for example, cluster analysis – to identify groups of respondents having similarattitudes. Additional analyses typically examine the personal characteristics of the customers inthe resulting groups, providing a more detailed profile of these market segments. This approachassumes that both personal characteristics and attitudes influence behavior. Moreover, itrecognizes the link between personal characteristics and attitudes. With this deeperunderstanding of the marketplace, agencies have designed products and services to meet theneeds of these markets. Agencies also have used this richer picture of their target audiences todevelop marketing communications programs containing messages designed to specificallyovercome negative attitudes. For example, advertising campaigns portray transit users asdemographically similar to a target population to dispel stereotypes about undesirable personsusing public transit.
A New Perspective
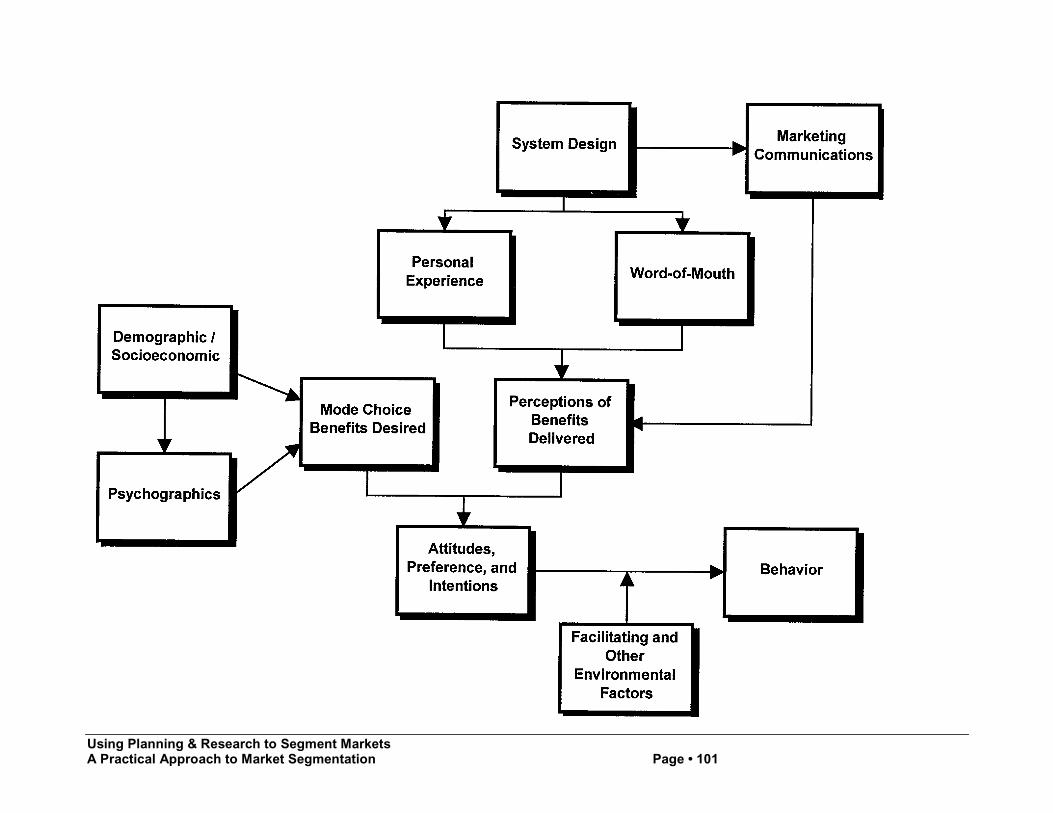
While to some extent these models reflect an accurate portrayal of the marketplace for publictransportation services, they are limited in scope and fail to recognize the complexity of theactual decision process. For example, these models do not provide for the influence ofpersonal values on transit usage. A transit values and lifestyle model is suggested and formsthe basis for the design of the research used in the test markets. It contains the followingcomponents.
This model begins with an individual's personal characteristics. Here, however, personalcharacteristics are differentiated between enduring characteristics (an individual's demographicand socioeconomic characteristics) and their "psychographics." Psychographics include what anindividual does (i.e., their activities, interests, habits, media exposure, travel characteristics, etc.)and how they feel about life (i.e., their attitudes, beliefs, opinions, emotions, needs, wants, andvalues).

Using Planning & Research to Segment MarketsA Practical Approach to Market Segmentation Page • 100
While the previous components of the model view an individual as a consumer in general, thiscomponent looks at the person as a potential consumer of a particular product class – in thiscase, local transportation. This component measures an individual's perceived profile of wants orneeds relevant to the mode choice decision. The model recognizes that an individual'sdemographic / socioeconomic and psychographic profile influences these attitudes. Moreover,the model recognizes that this is simply one component of overall attitudes.
The model begins to look considerably different at this point. We are suggesting that systemdesign has considerable influence on overall attitudes. That is, an individual's perceptions of theextent to which the current system delivers the desired benefits will influence overall attitudes. Inthe case of existing riders, an individual's perceptions of the extent to which the system deliversthe desired benefits may be based on personal experience. For nonriders or infrequent riders,these perceptions also may be based on past experience with the system or experience withother systems. For nonriders, this experience may be recent – for example within the last one tothree years – but often is far back in time and may not be truly reflective of the current types andlevels of service. Moreover, this experience may not truly reflect the "real system" as manyinfrequent riders or nonriders use transit during off-peak hours or in special circumstances – forexample, when the weather is bad or for travel to special events. For both riders and nonriders,an individual's perceptions of a system also are influenced by word-of-mouth. This word-of-mouth can be listening to friends and/or coworkers discussing local transit services. Articles inthe press may also be considered a form of word-of-mouth.
Moreover, marketing communications influences an individual's perceptions of the benefitsdesired. Many agencies run advertising and other communications programs to communicatethe strengths of a system and/or changes in service. These marketing communications reachboth riders and nonriders. In contrast to word-of-mouth, marketing communications arecontrolled communications and typically present a positive view of the system.
We then suggest that an individual's profile of wants or needs for transportation and theirperceptions of the extent to which an existing public transportation system delivers these desiredbenefits combine to create an overall attitude toward, preference for, and intention to use or notuse a particular travel mode. This approach is based heavily in the basic expectancy - value (E-V) approach to motivated behavior and human decision-making explored by Peak18 andFishbein's concepts of association learning and mediation19.
At this point, if earlier models were used, our implicit assumption would be that these overallattitudes toward, preferences for, and intentions to use or not use a particular travel mode wouldprovide a good prediction of behavior. In this model, we are positing that the scrambling effectsof the environment and the presence or absence of facilitating factors moderate behavior. Forexample, a person with negative attitudes toward using public transportation and a preferencefor driving alone may indeed use public transportation if their employer does not providesubsidized parking at their place of work. Conversely, a person with positive attitudes towardservice, a preference for using public transportation, and who fully intends to ride the bus may beunable to do so if they do not have access to service, do not have service available whenneeded, or simply are unaware that service is available.
The final component of the model consists of measures of behavior. A range of measure can beemployed to measure the "nature of behavior" – for example, mode choice – and the "magnitudeof behavior" – for example frequency of riding.
The model is illustrated on the following page.
18 Helen Peak, "Attitude and Motivation," in M.R. Jones (ed.), Nebraska Symposium on Motivation (Lincoln: University of Nebraska Press, 1954),pp. 149-189.19 Martin Fishbein, "Attitude and the Prediction of Behavior: A Behavior Theory Approach to the Relations Between Beliefs About an Object and theAttitude Toward an Object," in Martin Fishbein (ed.), Readings in Attitude Theory and Measurement (New York: Wiley, 1967).
Using Planning & Research to Segment MarketsA Practical Approach to Market Segmentation Page • 101
Using Planning & Research to Segment MarketsA Practical Approach to Market Segmentation Page • 102
Implementation
Once this basic planning process has been completed, the next phase in the process is implementation.There are five major components to implementation:
! Determining the sample design.
! Designing the survey instrument.
! Collecting the data.
! Analyzing and interpreting the data.
! Presenting the results.
Each step will be discussed below.
Determining the Sample Design
All true segmentation studies have one goal in common – projecting the segmentation schema obtained tothe entire pertinent market. Therefore, these studies generally require probability samples from that market.The use of convenience or judgement samples will lead to unreliable results and potentially misleadingresults and are not projectable to the population.
Quota samples seldom work correctly in segmentation studies. Post-data collection sample balancingprocedures, or weighting, can severely affect the results you get, if done before using clustering procedures.These procedures also make it difficult to estimate errors, and they complicate modeling of the segments.
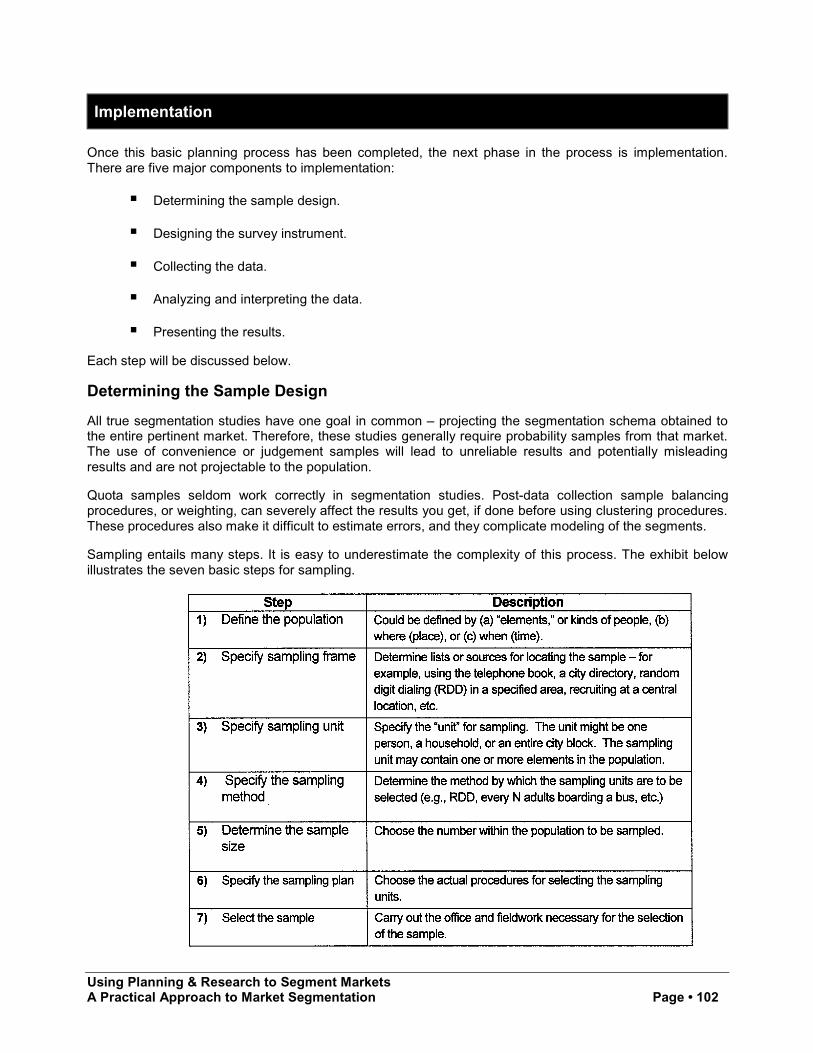
Sampling entails many steps. It is easy to underestimate the complexity of this process. The exhibit belowillustrates the seven basic steps for sampling.
Using Planning & Research to Segment MarketsA Practical Approach to Market Segmentation Page • 103
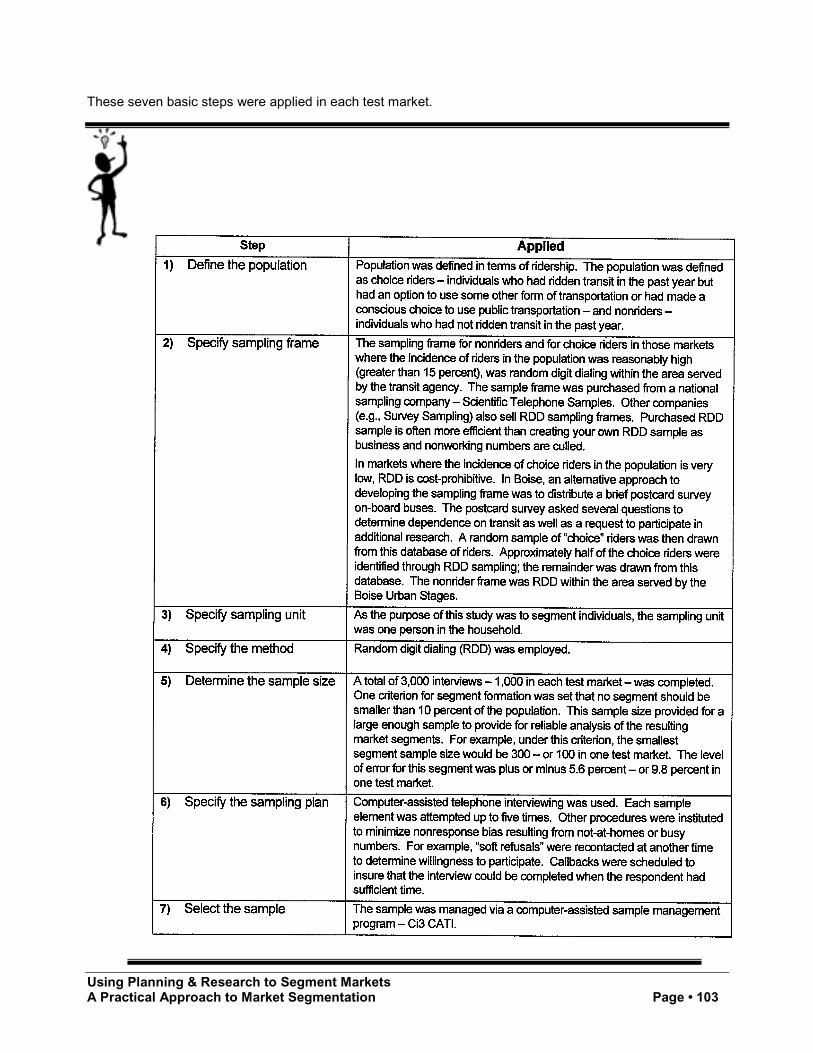
These seven basic steps were applied in each test market.
Using Planning & Research to Segment MarketsA Practical Approach to Market Segmentation Page • 104
Designing the Survey Instrument
As with any research project, questionnaire design is a critical element. It is not the purpose of this handbookto provide general guidelines for questionnaire development. This information is available from many othersources, including the handbook that was developed for TCRP Project B-2 – Integrating Market ResearchInto Transit Decision-Making. Instead, this section focuses on the unique aspects of questionnairedevelopment as applied in segmentation studies.
The design of a questionnaire for a segmentation study is both an "art" and a "science." It also an unusuallycomplex process. The design of the questionnaire is based on the model. It provides a general indication ofbasic descriptor variables that will be required. Scale development may be an area where you seek outsideassistance. The complexity of questionnaire design in segmentation analysis stems from a number offactors:
! The number of descriptor variables is enormous. Most of the variables covered in consumerbehavior literature can be considered as segment descriptors. These include demographic andsocioeconomic characteristics, media usage, behavioral characteristics, attitudes unrelated to thebasis variables, and so on. It is possible for both those who design the study and the respondentswho answer the questions to become lost in all these possible descriptors.
! "Actionability" or being able to do something with the findings, remains a difficultquestion. Inadequate descriptor variables can lead to a study in which you develop some strong-looking insights from the basic variables, but not enough action-oriented information to moveforward with any real confidence. During study design, consider management's ability to use thefindings, in particular information from the descriptors. Will these help form the agency'smarketing strategy and tactics – for instance, can they influence service design, pricing, mediascheduling, promotional messages, and so on? Expanding the list of descriptor variables canoften make the study more usable. Alternatively, using one basis variable that is generally familiarto research users – for example, geodemographics or product usage – and adding a newapproach – for example, benefit segmentation or psychographics – may help make the findingsmore actionable.
! You may only find weak links between basis and descriptor variables. You many not be ableto identify segments with varying responses to marketing actions, based on demographic andother segment descriptors. Conversely, although segments defined by demographic and othergeneral customer characteristics tend to be easily described, they may not have varyingresponses to marketing variables. This lack of strong connections can emerge even in well-designed studies. Sometimes, attitudes and opinions will truly cut uniformly across demographiccharacteristics. Then, positive responses will not be associated with any group that you can reachselectively. Finally, you may have trouble finding "lifestyle" differences between segments, just aswith demographic differences. Lifestyles can have some relation to both product use and todemographic characteristics. Nevertheless, unless responses to your marketing efforts can varyin these groups, you cannot call them true segments.
Keeping in mind these issues, other segmentation research suggests several guidelines for constructing amore "disaster-proof" study:
! Include at least one battery of questions that address the concerns that you believe willform the basis for grouping respondents. This battery of questions should be developedbased on the model you have developed or your research objectives. Then consider includingone or two alternative batteries, each taking a different approach. For example, you might include(1) a battery of questions dealing with the ways respondents view transit and occasions orreasons for its use, (2) a second battery about user and self-perceptions related to transitridership, and (3) another battery addressing broader "life style" and interest-related concerns.While this can add to the length of the questionnaire and the cost of the research, it can providesome insurance. Given the fixed cost of many segmentation studies, the incremental costs ofadding a second battery of questions may not be significant.
Using Planning & Research to Segment MarketsA Practical Approach to Market Segmentation Page • 105
! Try not to include too many questions of different types in the basis variables. Carefulpretesting, to be discussed later, is important in keeping the number of questions required todevelop the basis variables at a minimum while at the same time insuring reliable measures.
As can be seen in the following example, the design of the questionnaire for the test study closely followedthe final model. A copy of the Final Questionnaire used for this research is included in the Appendix.Moreover, a detailed description of the analysis that was conducted to determine what scale items to includeand the components of each scale are contained in the Final Report for this project, which is available uponrequest from the Transportation Research Board, Transit Cooperative Research Program.
Screening Questions.
A series of screening questions were developed to identify qualified respondents as definedunder the sampling plan. These included questions on area of residence as well as ridership.
Demographic / Socioeconomic Characteristics
A set of standard demographic questions was included to obtain measures of an individual'sdemographic and socioeconomic characteristics. These measures included:
Age,
Education,
Marital status,
Employment status (of individual and spouse),
Occupation,
Household size and composition (i.e., number and age of children),
Ethnicity,
Household income, and
Perceived social class.
Moreover, respondents were asked to provide the names of cross streets or intersectionsnearest their home. These responses were geocoded and the census tract in which therespondent lives identified. This data could be used in conjunction with census data andstandardized geodemographic data to examine what geodemographic segments emerge fromthe data as well as to determine the size of the residence area in which the individual lives(another important demographic / socioeconomic variable).
Values
The term "value" has been defined as "an enduring belief that a particular mode of conduct orthat a particular end state of existence is personally and socially preferable to alternative modesof conduct or end states of existence." So defined, a value is "a standard or criterion that tells ushow to act or what to want and what attitudes we should hold," "a standard we employe to justifybehavior, to morally judge and to compare ourselves with others," and "a standard we employ totell us which values, attitudes, and actions of others are worth or not worth trying to influence."20,
21, 22
20 Rokeach, Milton J., "The Role of Values in Public Opinion Research," Public Opinion Quarterly, XXXII (Winter, 1968-1969), pp. 547 – 559.21 Rokeach, Milton J., The Nature of Human Values, (New York: Free Press) 1973.
Using Planning & Research to Segment MarketsA Practical Approach to Market Segmentation Page • 106
Following this concept of value, the List of Values (LOV) typology was developed. The LOV iscomposed of nine values that can be scored in a number of ways. Each value can be scored ona nine or ten point scale (very unimportant to very important), or the values can be rank ordersfrom most to least important. The LOV measures those values that are central to people in livingtheir lives, particularly the values of life's major roles (e.g., work, leisure, and dailyconsumptions).
The LOV was originally developed by Rokeach and contained eighteen terminal values. TheLOV used in this research is a shorter version of the scale as developed by Kahle.23 This shorterversion has been widely tested. The measures are significantly correlated with various measuresof mental health, well being, adaptation to society, and self24 and are predictive of a number ofconsumer behaviors.25
Psychographics
While it would have been possible to create an extensive series of questions designed to assesspsychographics in a product-specific context, it was decided that the use of standardized scalesoffered some significant advantages over an ad hoc questionnaire. First, because standardizedscales are used repeatedly, norms can be developed. Without norms, it is often difficult to tellwhether a particular score on a particular scale is high, medium, or low. Second, whenstandardized scales are made publicly available, they can be subjected to tests of convergentand discriminant validity by independent analysts in a variety of research settings. Scales thatsurvive such trials are substantially more trustworthy than untested ad hoc question sets. Finally,when a scale is used repeatedly in a variety of settings, it begins to accumulate "surplusmeaning." That is, when its users begin to understand the network of other variables to which itrelates, they can say much more about it than they could before.
The first draft of the questionnaire was developed using the scales as presented in the literature.Where possible, the entire scale was used. If the scale was very large, the existing literature wasused to identify strategies to shorten the scale. This version of the questionnaire was pretestedwith over 300 respondents, both nonriders and choice riders. This first interviews averaged over50 minutes in length.
Extensive psychometric testing was completed to reduce and refine these scales. A secondversion of the questionnaire was pretested with over 100 respondents. Again both nonriders andchoice riders were interviewed. This version of the questionnaire was significantly shorter –approximately 40 minutes in length. Again, analysis was conducted to determine whether thescales continued to be reliable measures of the broader dimensions and to determine whetherfurther reduction and/or refinement was possible.
The final questionnaire reflects the results of both these pretests. It was again tested with over100 respondents. The focus of this pretest was largely on providing a final estimate of the surveylength. Moreover, results were analyzed to verify the accuracy of the programming for thequestionnaire logic (e.g., skip and branching patterns).
Following are descriptions of the psychographic dimensions included in the design.
22 Kahle, Lynn R, Social Values and Social Change: Adaptation to Life in America, (New York: Praeger Publishers), 1983.23 Beatty, Sharon E., Lynn R. Kahle, Pamela Homer, and Shekhar Misra, "Alternative Measurement Approaches to Consumer Values: The List ofValues and the Rokeach Value Survey," Psychology & Marketing, 2 (Fall 1985), pp. 181 – 200.24 Kahle (1983).25 Homer, Pamela and Lynn R. Kahle, "A Structural Equation Analysis of the Value-Attitude-Behavior Hierarchy," Joumal of Personality andSocial Psychology, 54 (April 1988), pp. 638 – 646.

Using Planning & Research to Segment MarketsA Practical Approach to Market Segmentation Page • 107
Susceptibility to Interpersonal Influence
Consumer susceptibility to interpersonal influence is assumed to be a general trait that variesacross individuals and is related to other individual traits and characteristics. The construct isdefined as the need to identify with or enhance one's image in the opinion of significant othersthrough the acquisition and use of products and brands, the willingness to conform to theexpectations of others regarding purchase decisions, and/or the tendency to learn aboutproducts and services by observing others or seeking information from others.26 It washypothesized that the degree to which an individual is influenced by others' perceptions of thetypes of people who use public transportation and its reflection of one's self-image is associatedwith transit ridership and/or openness to using public transportation.
The original scale consists of twelve items. Each are operationalized as a bi-polar, seven-placerating scale ranging from "strongly agree" to "strongly disagree." All items are positively worded.The twelve items reflect two correlated dimensions of susceptibility to interpersonal influence:normative and informational influences. The scale used in this questionnaire consisted of fiveitems, such as the one shown below.
I often identify with other people by purchasing the same products and brands they purchase.
Optimum Stimulation Level / Arousal Seeking Tendency
Optimum Stimulation Level (OSL) is a property that characterizes an individual in terms of his /her general response to environmental stimuli. This is based on the assumption that eachindividual has a uniquely determined, homeostatic degree of stimulation or an "optimumstimulation level" (OSL) with which he / she is comfortable.27
Similarly, Arousal Seeking Tendency (AST) is viewed as a characteristic that varies acrossindividuals. An individual's preference for an environment is closely related to his / her preferredarousal. Some people prefer calm settings, whereas others actively seek to increase theirarousal by choosing novel, complex, or unpredictable settings.28
Research suggests that an individual will adjust their behavior to obtain the optimal level ofstimulation or arousal. For example, if an environment provides more stimulation than desired,the individual will engage in behavior to reduce stimulation. In public transportation, therefore,individuals who are uncomfortable with high levels of stimulation may adapt their behavior toreduce this stimulation or may simply avoid any situation that is too stimulating. For example,riders who are uncomfortable with crowded places or around different people may choose to rideonly during off-peak hours. Nonriders may choose to not ride at all or may simply not evenconsider riding.
The AST is a 40-scale item, where each item is evaluated on a nine-point Likert format (i.e., verystrong disagreement [-4] to very strong agreement [+4]).29 The complete AST scale was far toolong to be included in the questionnaire. Moreover, the response format was different from otherLikert scales used in the questionnaire. Therefore this scale was shortened to five items and theresponse format was changed to correspond to the other Likert scale questions on the survey.
I like to go somewhere different every day.
26 Bearden, William O., Richard G. Netemeyer, and Jesse E. Teel, "Measurement of Consumer Susceptibility to Interpersonal Influence," Journalof Consumer Research, 15 (March 1989), pp. 473 – 481.27 Raju, P.S., "Optimum Stimulation Level: Its Relationship to Personality, Demographics, and Exploratory Behavior," Joumal of ConsumerResearch, 7 (December, 1980), pp. 272 – 282.28 Mehrabian, Albert and James A. Russell, An Approach to Enviornmental Psychology. Cambridge: The MIT Press (1974).29 Mehrabian and Russell (1974).
Using Planning & Research to Segment MarketsA Practical Approach to Market Segmentation Page • 108
Innovativeness
Innovativeness is a personality trait that is assumed to underlie the adoption of new products orservices as well as a general openness to information processing. Innovators are described asindividuals who are open to new experiences and novel stimuli, who possess the ability totransform information about new concepts, ideas, products, or services for their own use, andwho easily recognize the potential application for new ideas.30, 31 It was hypothesized that anindividual's openness to trying new products and services would be related to an individual'swillingness to try public transportation, particularly alternative public transportation services thatare being considered.
This scale is still under refinement and somewhat limited information was available forevaluation. However, two versions of the scale have been developed – each containing 24 items.Craig and Ginter factor analyzed the original version of the scale and found seven factors. Thesefactors are: new is wasteful, social desirability, novelty seeking, risk aversion, styleconsciousness, satisfaction with the status quo, and other-directedness.32 The length of thesurvey precluded the use of the entire scale developed by Leavitt and Walton. Variables wereselected from those factors dealing with desirability, risk aversion, and satisfaction with thestatus quo. Those variables that were most highly correlated with a factor were selected. Anexample follows:
When it comes to taking chances, I would rather be safe than sorry.
Socially Responsible Consumption Behavior
Socially responsible consumption behavior (SRCB) is defined as those consumer behaviors andpurchase decisions that are related to environmental and resource-related problems. Thesebehaviors and decisions are motivated not only by a desire to satisfy personal needs, but also bya concern for the welfare of society in general.33, 34 This is thought to be an important componentof the mode choice decision as several transit research studies have shown an associationbetween an individual's attitudes toward the environment or "greenness" and transit ridership.
The SRCB is composed of 40 Likert items (agree-disagree) scored on a five-point basis. Scorescan be summed to form an overall SRCB Index. The length of this scale precluded inclusion ofthe entire scale. Instead, seven items were selected for inclusion that had the highest item-to-total correlation. Moreover, some wording was simplified.
I think that a person should urge his or her friends not to use products that pollute or harm the environment.
In addition to this specific measure of socially responsible consumption behavior, a moregeneralized scale to measure overall attitudes toward the environment was included. Generalenvironmental concern (GEC) is a construct frequently used as a measure of the importance ofthe environment and its protection. It is cited as an indicator of the greening of
30 Leavitt, Clark and John Walton, "Development of a Scale for Innovativeness," in Advances in Consumer Research, Vol. 2, Mary Jane Schlinger(ed),. Ann Arbor: Association for Consumer Research (1975), pp. 545-554.31 Leavit, Clark and John R. Walton, "Openness of Information Processing as a Moderator of Message Effects on Behavior," Faculty WorkingPaper, College of Business Administration, Ohio State University (1988).32 Craig, C. Samuel and James L. Ginter, "An Empirical Test of a Scale for Innovativeness," in Advances in Consumer Research, Vol. 2, MaryJane Schlinger (ed),. Ann Arbor: Association for Consumer Research (1975), pp. 555-562.33 Antill, John A. and Peter D. Bennett, "Construction and Validation of a Scale to Measure Socially Responsible Consumption Behavior, in TheConserver Society, Karl H. Hennion II and Thomas Kinnear (eds). Chicago: The American Marketing Association (1979), pp. 51 – 68.34 Antil, John A., "Socially Responsible Consumers: Profile and Implications for Public Policy," Joumal of Macromarketing (Fall 1984), pp. 18-39.
Using Planning & Research to Segment MarketsA Practical Approach to Market Segmentation Page • 109
consumption. GEC is useful as an attitudinal construct because it is clearer than the term "green"which is imprecise and may mix attitudinal and behavioral constructs.35
The General Environmental Concern is measured by agreement ratings using three items on aLikert scale. The three items were derived from those used by Maloney and Ward36 andMaloney, Ward, and Braucht37. An example:
We have to do something immediately to reduce the amount of gasoline we use.
Automobile Involvement
Transit research has long suggested that American's "love affair with the automobile" isassociated with ridership and the propensity to ride. This involvement is borne out in otherresearch that suggests that product involvement as a long-term interest in a product is based onthe centrality of the product to important values, needs, or the self-concept, and is primarily afunction of individual differences. Consistent with this conceptualization, Bloch views productinvolvement as a construct that affects consumer behavior on an ongoing basis and variesacross individuals (ranging from minimal levels to extremely high levels). Based on this view, ascale to measure involvement with automobiles was developed.38
The original scale developed by Bloch consisted of a 17-item scale that uses a Likert scale(strongly agree – strongly disagree), scored on a six-point format. In another study, Shimp andSharma factor analyzed the Automobile Involvement Scale with a sample of 696 adultnonstudent respondents. They compared the six-factor solution identified by Bloch with anumber of other factor structures. This analysis suggested that Bloch's six-factor structure couldbe simplified. Based on this analysis an eight-item, two-factor version of the scale wasdeveloped as a reasonable alternative to Bloch's 17-item, six-factor scale.39 The final scale usedin the questionnaire retained four of the original scale items, including:
Driving my car is one of the most satisfying and enjoyable things I do.
Overload
It is well recognized that an individual's time has become increasingly burdened. Moreover, it isbelieved that time and role overload and perceptions of transit may be related. Therefore, a scaleto measure the extent to which individual's feel their time is overburdened was identified. Onesuch scale – Role Overload of the Wife – was developed to explore the conflict that occurs whenthe sheer volume of the behavior of the wife exceeds her available time and energy.40 Thisdefinition is consistent with the organizational behavior literature view of role overload.41, 42
This scale is composed of 13 Likert items on a five-point basis from strongly disagree to stronglyagree. For the first pretest wave, the complete 13-item scale was used. The scale
35 Shrum, L.J., J. A. McCarty, and T.M. Lowrey, "Buyer Characteristics of the Green Consumer and Their Implications for Advertising Strategy,"Journal of Advertising, 24 (1995), pp. 71 – 82.36 Maloney, M.P. and M.P. Ward, "Ecology: Let's Hear From the People," American Psychologist, 28 (1973), pp. 583-586.37 Maloney, M.P., M.P. Ward, and N.G. Braucht, "Psychology in Action: A Revised Scale for the Measurement of Ecological Attitudes andKnowledge," American Psychologist, 30 (1975), pp. 787-790.38 Bloch, Peter H., "An Exploration Into the Scaling of Consumers' Involvement With a Product Class," in Advances in Consumer Research, Vol.8, Kent B. Monroe (ed.). Provo: The Association for Consumer Research (1981), pp. 61 – 65.39 Shimp, Terence and Subhas Sharma, "The Dimensionality of Involvement: A Test of the Automobile Involvement Scale," in the AmericanMarketing Association Winter Educator's Conference: Research Methods and Causal Methods in Marketing, William R. Darden, Kent B. Monrol,and William R. Dillon (eds.). Chicago: The American Marketing Association (1983).40 Reilly, Michael D., "Working Wives and Convenience Consumption," Joumal of Consumer Research, 8 (March 1982), pp. 407-417.41 House, Robert L. and John R. Rizzo, "Role Conflict and Ambiguity as Critical Variables in a Model of Organizational Behavior," OrganizationalBehavior and Human Performance, 7 (1972), pp. 467 – 505.42 Rizzo, John R., Robert J.House, and Sidney Lirtzman, "Role Conflict and Ambiguity in Complex Organizations," Administrative ScienceQuarterly, 15, (1970), pp. 150 – 163.
Using Planning & Research to Segment MarketsA Practical Approach to Market Segmentation Page • 110
was changed to be consistent with the other scales in the questionnaire – scored on a seven-point Likert scale – and streamlined to contain only five items, such as:
I need more hours in the day to do all the things that are expected of me.
Time Management
Related to the concept of role overload is the extent to which an individual employs strategies tomanage their time. It was hypothesized that the extent to which an individual organized their timeand/or felt the need to be in control of their time would influence their ridership and/or propensityto ride transit.
Several scales have been developed to explore the extent to which people manage time.Several of these scales have been developed to examine the relationship between timemanagement and shopping behavior. Lumpkin and Darden used a multi-item, six-point Likertsummated ratings scale ranging from strongly disagree to strongly agree. The scale measures aperson's tendency to schedule activities and organize time.43, 44 The final scale used four itemsthat showed the highest item-to-total internal consistency.
I am always looking for ways to be more efficient so that I can get more things done.
Internal Locus of Control
Locus of control refers to the degree to which a person attributes success to his or her ownefforts versus fate or other forces. It was hypothesized that this factor combined with otherpersonality traits related to feelings of personal control would be associated with one's currentridership or propensity to ride.
The items for this scale were taken from Rotter. However, his scales consisted of 23 pairs ofopposing statements in a forced-choice format.45 Therefore, a shortened version of Rotter's scalewas used, in part based on research by Lumpkin and Hunt.46
When I make plans, I am certain I can make them work.
Self Confidence / Leadership
Some research has shown a link between self-confidence and the extent to which individualsrely on public transportation and/or others to get around. In this study, respondents who wereself-reliant in terms of transportation were significantly more self-confident than persons whowere dependent on others for transportation.47 Therefore, a scale to measure the perception ofone's self as a leader and having confidence was included. This scale was drawn from severalsources. It is believed to have been developed originally by Burnett and Bush (1986)48.
I think I have more self-confidence than most people.
43 Lumpkin, James R., "Shopping Orientation Segmentation of the Elderly Consumer," Joumal of the Academy of Marketing Science," 13 (Spring,1985), pp. 271-289.44 Lumpkin, James R., and William R. Darden, "Relating Television Preference Viewing to Shopping Orientations, Lifestyles, and Demographics,"Joumal of Advertising, 11 (1982), pp 56-67.45 Rotter, J.B., "Generalized Expectancies for Internal and External Locus of Control of Reinforcement," Psychological Monographs: General andApplied, 80 (Volume 1, 1966), Whole No. 609.46 Lumpkin, James R. and James B. Hunt, "Mobility as an Influence on Retail Patronage Behavior of the Elderly: Testing Conventional Wisdom,"Journal of the Academy of Marketing Science, 17 (Winter 1989), pp. 1 – 12.47 Lumpkin, James R. and James B. Hunt, "Mobility as an Influence on Retail Patronage Behavior of the Elderly: Testing Conventional Wisdom,"Joumal of the Academy of Marketing Science, 12 (Winter 1989), pp. 1 – 12.48 Burnett, John J. and Alan J. Bus, "Profiling the Yuppies," Joumal of Advertising Research, 16 (April / May 1986), pp. 27 – 35.
Using Planning & Research to Segment MarketsA Practical Approach to Market Segmentation Page • 111
Physical and Occupational Mobility / Financial Optimism
Consistent with the belief that a person's ridership or propensity to ride is associated with theirsocioeconomic status, the extent to which an individual is or perceives themselves to bephysically or occupationally mobile may also be linked to ridership and/or attitudes toward usingpublic transportation. To test this, a scale to measure the extent to which an individual perceivesthemselves as physically and/or occupationally mobile was included. This multiitem scale hasbeen used in many studies but appears to have been originally developed for the classic study ofpsychographics by Wells and Tigert.49
In the last ten years, I have lived in at least three different cities.
I expect to be a top executive in the next ten years.
Five years from now my total household income will probably be a lot higher than it is now.
Frugality
There is a long-established association between ridership and an individual's socioeconomicstatus. It was hypothesized that this association might also be translated into a values andlifestyle characteristic – specifically how frugal a person considers himself / herself to be. A four-item scale was used to measure this association. This scale was taken from work by JohnLastovicka that examines lifestyle segmentation as it relates to drunk driving behavior.50 Theoriginal scale was actually a multi-dimensional scale. One dimension focused specifically ondiscipline, or the extent to which an individual practices frugal behavior.
I believe in being careful how I spend my money.
Personal Control and Responsibility
Transit research has shown that a major barrier to transit ridership is concern about the extent towhich a person must rely on the system to get them where they want to go on time. Many factorsdrive this concern. However, the extent to which a person feels they must be in control appearsto be the primary consideration. Therefore a series of questions used in other transit studies –notably ones conducted by King County Metro (Seattle), Tri-Met (Portland), and Caltrans – werecombined to create a schedule to measure the extent to which an individual values personalcontrol.
I always schedule my time so that I arrive at my destination a few minutes early.
It is very important to me not to have to rely on other people.
Fearfulness
Comments from qualitative research suggest that many people do not ride public transportationbecause they are worried about their personal safety. However, crime and safety statisticsclearly show that there is little evidence to support concerns about personal safety when usingtransit. Instead, it is believed that a person's general level of fearfulness in conjunction with otherattitudes leads to an overall predisposition to use public transportation. A three-item scale tomeasure a person's feelings about their security / safety was included.
I worry a lot about myself or a family member becoming a victim of a crime.
49 Wells, William D. and Douglas Tigert, "Activities, Interests, and Opinions," Journal of Advertising Research (August 1971), pp. 27 – 35.50 Lastovicka, John, unpublished paper.
Using Planning & Research to Segment MarketsA Practical Approach to Market Segmentation Page • 112
Cleanliness
As with fearfulness, comments from qualitative research suggest that many people do not ridepublic transportation because they believe that buses are dirty and/or that people on the bus aredirty. Again, evidence does not support this perception. Instead, it is hypothesized that anindividual's level of comfort with large public environments in general may be the motivatingfactor. To test this assumption, a four-item scale to measure an individual's general attitudestoward cleanliness was included.
I am uncomfortable when I am in places that are not totally clean.
Benefits Sought and Perceptions of Benefits Delivered
The majority of research conducted by transit agencies has focused on riders' and, to a lesserextent, nonriders' perceptions of service quality. The emphasis, therefore, has been onmeasuring satisfaction with specific aspects of transit service – for example, on-timeperformance, helpfulness of drivers, and usefulness of information. In some instances, agencieshave also included measures of the importance of these same aspects of transit service.Comparisons of satisfaction and importance enables one to develop a matrix that measures theextent to which performance meets customer expectations (as measured by importance or someother scale). While useful for day-to-day service planning and determining where to best placeresources for service quality improvement, these measures provide little insight into what isrequired to increase ridership. This is particularly true among nonriders who may have difficultyanswering these types of questions because of lack of direct experience. Moreover, there is noevidence to support that improvements in service quality will cause nonriders to ride.
In other instances, some agencies have explored barriers to ridership. Again, this informationmay provide some useful insight into day-to-day service planning. For example, finding out thatnot being able to get home easily in case of an emergency has led to the development of"guaranteed ride home" programs in many markets. However, again the assumption is madethat simply removing a barrier will lead to an increase in ridership.
Literature on "benefit segmentation" suggests that two components should be measured: (1) thebenefits sought (product-benefit importance), and (2) the extent to which those benefits aredelivered (brand preferences).51, 52 The combination of these two factors – that is the extent towhich a product or service delivers the most primary benefits desired – forms one's attitudestoward a product or service.
Two factors were carefully considered in the design of the questionnaire: (1) what specificbenefits to include, and (2) how to operationalize the constructs.
51 Haley, Russell I., "Benefit Segments: Backwards and Forwards," Journal of Advertising Research, 24 (February / March, 1984) pp. 19 – 25.52 Green, Paul E., Abba M. Krieger, and Catherin M. Schaffer, "Quick and Simple Benefit Segmentation," Journal of Advertising Research, 25(June / July, 1985), pp. 9 – 15.
Using Planning & Research to Segment MarketsA Practical Approach to Market Segmentation Page • 113
To address the first factor – that is, what specific benefits to include – available transit researchwas reviewed to generate a comprehensive list of possible benefits that are sought in decidinghow to travel. A list of twenty-nine individual attributes was ultimately identified. Some examplesfollow:
I can count on it to get me to where I am going on time.I can control my own schedule.It is appropriate for a person in my position.It gets me to and from where I want to go without feeling stressed.I can get other things done while traveling; it's not just dead time.It gets me where I am going the quickest way possible.It is conveniently located to my trip origin and destination.It does not cost much.I don't have to worry about wear and tear on my vehicle.I am assured of my personal safety from crime.It is comfortable.It is clean.I don't have to get out in inclement weather.It is good for the environment.
In many instances, transit research has focused on identifying what is important in deciding toride the bus. For example, a question might read, "Please tell me how important each of thefollowing are in deciding whether to ride the bus?" There are two problems inherent in thisquestion. First, it assumes that riding the bus is part of the decision set for everyone. However,many transit studies suggest that in most cases, people simply do not think of using publictransportation – that is, riding the bus is not in their evoked set. Second, this question looks attransit in isolation. That is, it ignores the competition.
Therefore, to measure the second construct – benefits sought – respondents were asked toevaluate the importance of these twenty-nine items. The introduction to the question reads asfollows:
Different people consider different things important when deciding whether to drive or to use transit for localtravel. As I read the following list, please tell me how important each item is to you in the method oftransportation that you use. Please answer on a 7-point scale where "1" means "not at all important" and "7"means "extremely important."
Operationalization of the second construct – the extent to which those benefits are delivered –was introduced as follows. Respondents rated the same twenty-nine items.
Now based on your personal experience or anything you have seen, read, or heard, please tell me how wellyou think these same statements describe using public transportation. Please answer using a 7-point scalewhere 1 means the statement "does not describe public transportation at all" and 7 means the statement"describes public transportation very well."
Involvement with the Mode Choice Decision
Much transit research suggests that the mode choice decision is a relatively low-involvementdecision. That is, when making a trip, few people make a conscious decision as to whether todrive or use transit for that trip. Instead, most simply use the mode they are most accustomed toor that they always use for that trip. To test this hypothesis, a set of questions measures theextent to which an individual is involved with the mode choice decision.
Scales to measure consumer involvement were originally developed by Laurent andKapferer53 and Jain and Srinivasan.54 Both sets of authors had developed multi-item scales to
53 Laurent, Gilles and Jean-Noel Kapferer, "Measuring Consumer Involvement Profiles," Journal of Marketing Research, 11 (February, 1985), pp.41 – 53.
Using Planning & Research to Segment MarketsA Practical Approach to Market Segmentation Page • 114
measure the perceived importance and risk of the product class, the subjective probability ofmaking a mispurchase, and the level of interest or the extent to which an individual has anenduring relationship with the product class.
However, these scales were very lengthy, having as many as sixteen items to capture thedifferent dimensions. Moreover, some dimensions were believed to be less relevant to the modechoice decision. A shorter version of these scales, as developed by Foote, Cone, and Beldingwas used. The FCB Involvement Subscale (FCBI) views involvement as implying personalimportance (i.e., relevance) and consequent attention to an object or product.55
During this period, Northwest Research Group was testing a shortened (four-item) version of thisscale in another study. Responses to this scale can be combined to reflect the extent to which anindividual is involved with the mode choice decision and the degree of risk associated with thedecision – for example, high involvement / low risk, high involvement / high risk, low involvement/ low risk, and low involvement / high risk).
Would you say the decision to use public transportation is an important decision or an unimportant decision?
Would you say the decision to use public transportation is a decision that requires absolutely no thought at all, verylittle thought, some thought, a great deal of thought?
If you decide to use public transportation, would you say there is nothing to lose if you make the wrong decision,little to lose if you make the wrong decision, something to lose if you make the wrong decision, a lot to lose if you
make the wrong decision?
How sure are you about the ability of public transportation to perform satisfactorily?
Attitudes Toward, Preference For, And Intention To Use Public Transportation
As denoted in the model, several factors combine to create an overall attitude toward, preferencefor, and intention to use public transportation. The following types of questions were included toobtain measures of these constructs.
Transit Use
One such factor is the extent and nature of an individual's personal experience with publictransportation generally, and specifically with public transportation in the area in which they live.Questions were included to measure the extent to which an individual has used or consideredusing transit in the past.
Several questions in the screening section of the questionnaire covered transit use in the pastyear. Persons who had ridden in the past year were asked questions regarding the nature oftheir transit trip.
Persons who had not ridden in the past year were asked questions regarding consideration ofand past use of transit.
Awareness of Transit
Another factor is the extent to which an individual is aware of and familiar with transit services.Awareness is a function of marketing and word-of-mouth communications. News storiespublished or broadcast in the media are considered a form of word-of-mouth communications, asthey are not under the direct control of the marketer. Two questions
54 Jain, Kapil and Narasimhan Srinivasan, "An Empirical Assessment of Multiple Operationalizations of Involvement," in Advances in ConsumerResearch, Vol. 17, Marvin Goldberg, Gerald Gorn, and Richard Pollay (eds.) Provo, UT: The Association for Consumer Research (1990). pp. 594– 602.55 Ratchford, Brian T., "New Insights About the FCB Grid, "Journal of Advertising Research, 27 (August – September (1987), pp. 35 – 38.
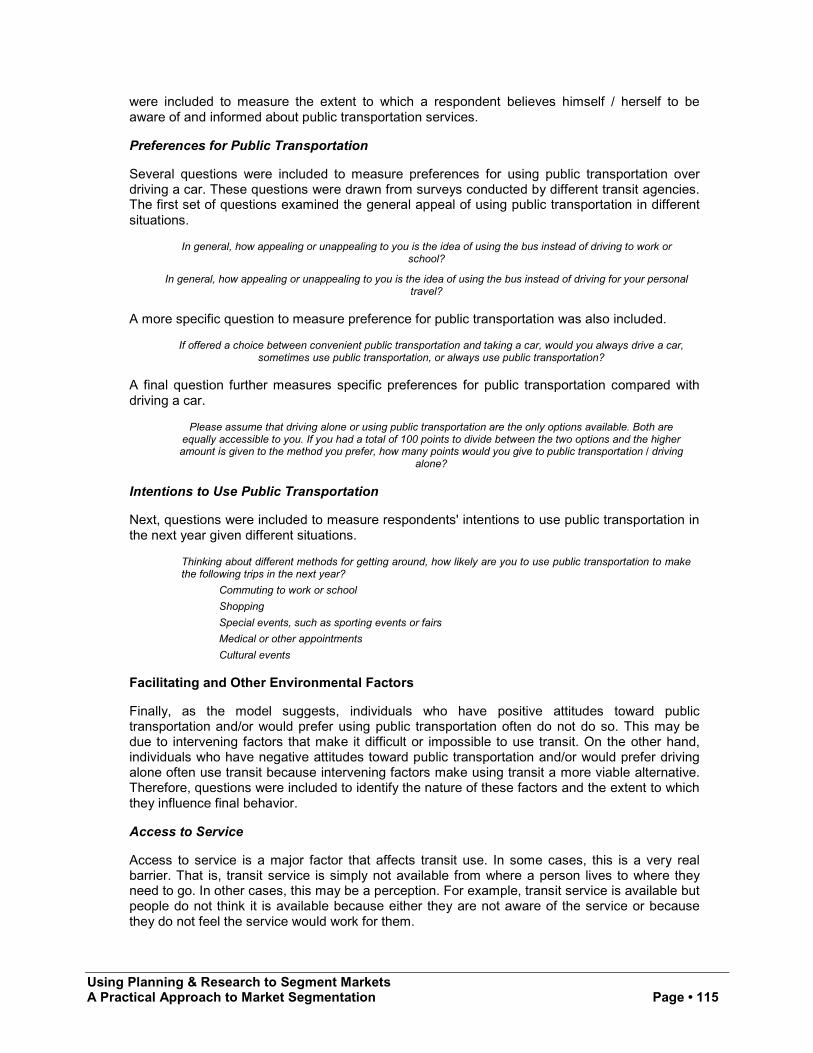
Using Planning & Research to Segment MarketsA Practical Approach to Market Segmentation Page • 115
were included to measure the extent to which a respondent believes himself / herself to beaware of and informed about public transportation services.
Preferences for Public Transportation
Several questions were included to measure preferences for using public transportation overdriving a car. These questions were drawn from surveys conducted by different transit agencies.The first set of questions examined the general appeal of using public transportation in differentsituations.
In general, how appealing or unappealing to you is the idea of using the bus instead of driving to work orschool?
In general, how appealing or unappealing to you is the idea of using the bus instead of driving for your personaltravel?
A more specific question to measure preference for public transportation was also included.
If offered a choice between convenient public transportation and taking a car, would you always drive a car,sometimes use public transportation, or always use public transportation?
A final question further measures specific preferences for public transportation compared withdriving a car.
Please assume that driving alone or using public transportation are the only options available. Both areequally accessible to you. If you had a total of 100 points to divide between the two options and the higheramount is given to the method you prefer, how many points would you give to public transportation / driving
alone?
Intentions to Use Public Transportation
Next, questions were included to measure respondents' intentions to use public transportation inthe next year given different situations.
Thinking about different methods for getting around, how likely are you to use public transportation to makethe following trips in the next year?
Commuting to work or school
Shopping
Special events, such as sporting events or fairs
Medical or other appointments
Cultural events
Facilitating and Other Environmental Factors
Finally, as the model suggests, individuals who have positive attitudes toward publictransportation and/or would prefer using public transportation often do not do so. This may bedue to intervening factors that make it difficult or impossible to use transit. On the other hand,individuals who have negative attitudes toward public transportation and/or would prefer drivingalone often use transit because intervening factors make using transit a more viable alternative.Therefore, questions were included to identify the nature of these factors and the extent to whichthey influence final behavior.
Access to Service
Access to service is a major factor that affects transit use. In some cases, this is a very realbarrier. That is, transit service is simply not available from where a person lives to where theyneed to go. In other cases, this may be a perception. For example, transit service is available butpeople do not think it is available because either they are not aware of the service or becausethey do not feel the service would work for them.
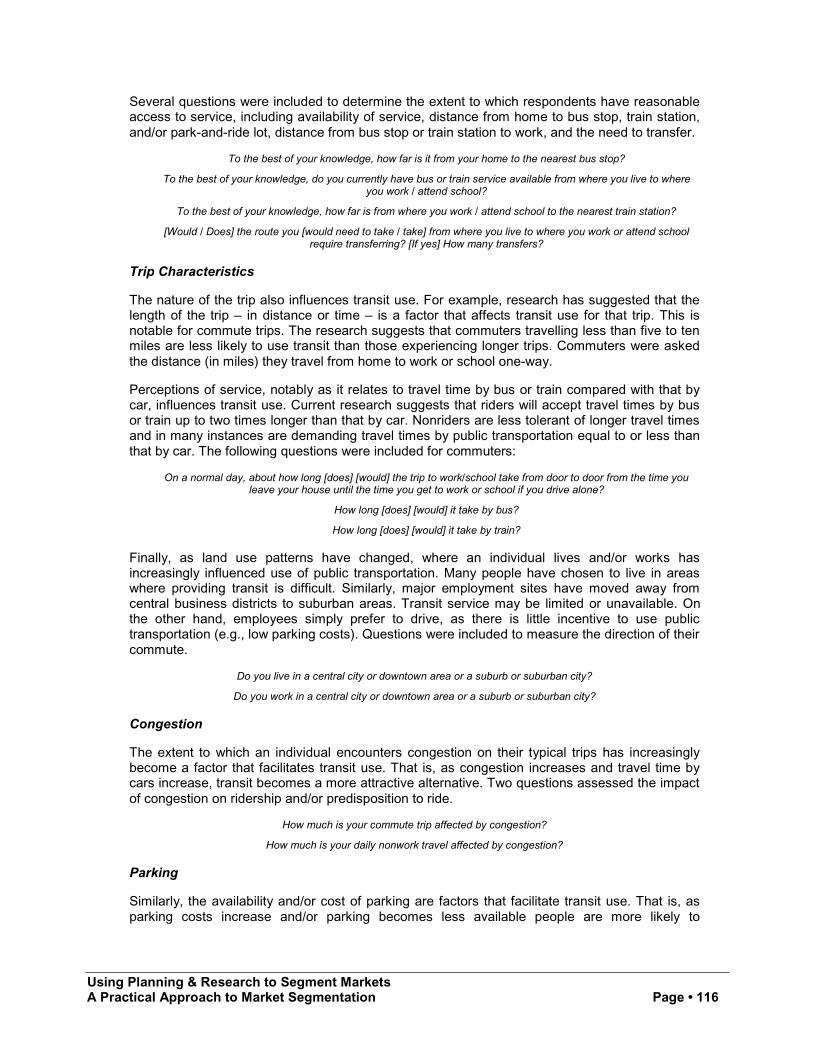
Using Planning & Research to Segment MarketsA Practical Approach to Market Segmentation Page • 116
Several questions were included to determine the extent to which respondents have reasonableaccess to service, including availability of service, distance from home to bus stop, train station,and/or park-and-ride lot, distance from bus stop or train station to work, and the need to transfer.
To the best of your knowledge, how far is it from your home to the nearest bus stop?
To the best of your knowledge, do you currently have bus or train service available from where you live to whereyou work / attend school?
To the best of your knowledge, how far is from where you work / attend school to the nearest train station?
[Would / Does] the route you [would need to take / take] from where you live to where you work or attend schoolrequire transferring? [If yes] How many transfers?
Trip Characteristics
The nature of the trip also influences transit use. For example, research has suggested that thelength of the trip – in distance or time – is a factor that affects transit use for that trip. This isnotable for commute trips. The research suggests that commuters travelling less than five to tenmiles are less likely to use transit than those experiencing longer trips. Commuters were askedthe distance (in miles) they travel from home to work or school one-way.
Perceptions of service, notably as it relates to travel time by bus or train compared with that bycar, influences transit use. Current research suggests that riders will accept travel times by busor train up to two times longer than that by car. Nonriders are less tolerant of longer travel timesand in many instances are demanding travel times by public transportation equal to or less thanthat by car. The following questions were included for commuters:
On a normal day, about how long [does] [would] the trip to work/school take from door to door from the time youleave your house until the time you get to work or school if you drive alone?
How long [does] [would] it take by bus?
How long [does] [would] it take by train?
Finally, as land use patterns have changed, where an individual lives and/or works hasincreasingly influenced use of public transportation. Many people have chosen to live in areaswhere providing transit is difficult. Similarly, major employment sites have moved away fromcentral business districts to suburban areas. Transit service may be limited or unavailable. Onthe other hand, employees simply prefer to drive, as there is little incentive to use publictransportation (e.g., low parking costs). Questions were included to measure the direction of theircommute.
Do you live in a central city or downtown area or a suburb or suburban city?
Do you work in a central city or downtown area or a suburb or suburban city?
Congestion
The extent to which an individual encounters congestion on their typical trips has increasinglybecome a factor that facilitates transit use. That is, as congestion increases and travel time bycars increase, transit becomes a more attractive alternative. Two questions assessed the impactof congestion on ridership and/or predisposition to ride.
How much is your commute trip affected by congestion?
How much is your daily nonwork travel affected by congestion?
Parking
Similarly, the availability and/or cost of parking are factors that facilitate transit use. That is, asparking costs increase and/or parking becomes less available people are more likely to
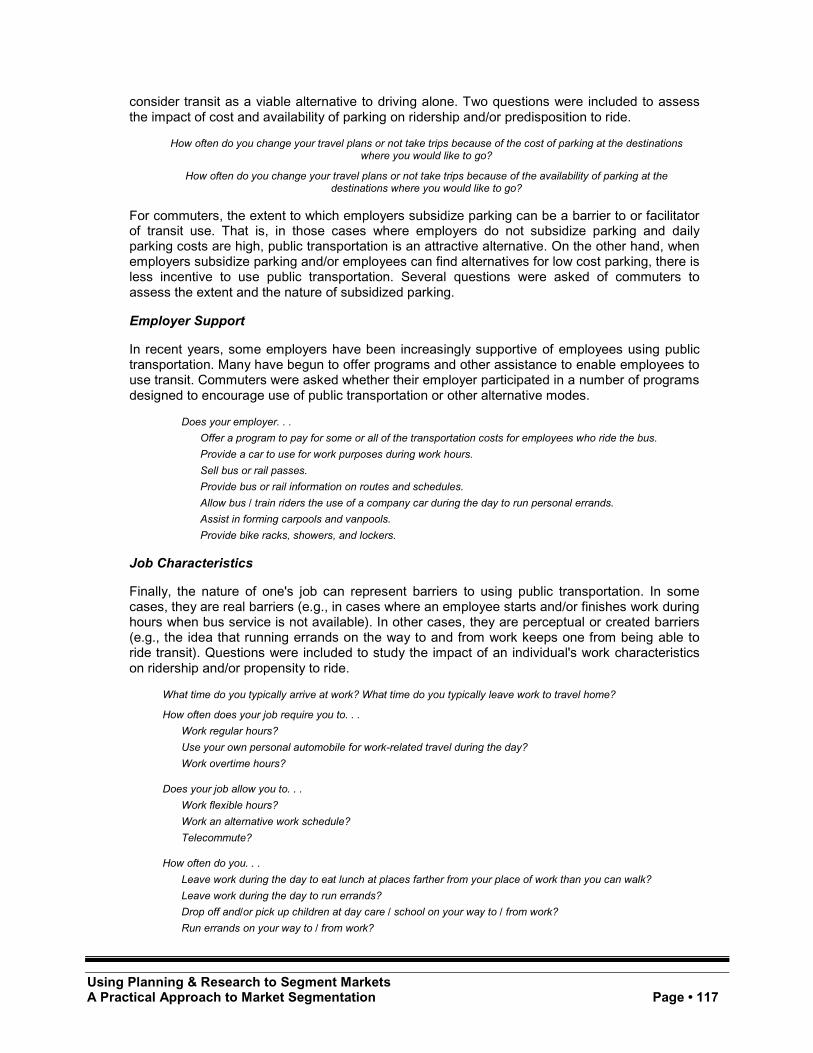
Using Planning & Research to Segment MarketsA Practical Approach to Market Segmentation Page • 117
consider transit as a viable alternative to driving alone. Two questions were included to assessthe impact of cost and availability of parking on ridership and/or predisposition to ride.
How often do you change your travel plans or not take trips because of the cost of parking at the destinationswhere you would like to go?
How often do you change your travel plans or not take trips because of the availability of parking at thedestinations where you would like to go?
For commuters, the extent to which employers subsidize parking can be a barrier to or facilitatorof transit use. That is, in those cases where employers do not subsidize parking and dailyparking costs are high, public transportation is an attractive alternative. On the other hand, whenemployers subsidize parking and/or employees can find alternatives for low cost parking, there isless incentive to use public transportation. Several questions were asked of commuters toassess the extent and the nature of subsidized parking.
Employer Support
In recent years, some employers have been increasingly supportive of employees using publictransportation. Many have begun to offer programs and other assistance to enable employees touse transit. Commuters were asked whether their employer participated in a number of programsdesigned to encourage use of public transportation or other alternative modes.
Does your employer. . .
Offer a program to pay for some or all of the transportation costs for employees who ride the bus.
Provide a car to use for work purposes during work hours.
Sell bus or rail passes.
Provide bus or rail information on routes and schedules.
Allow bus / train riders the use of a company car during the day to run personal errands.
Assist in forming carpools and vanpools.
Provide bike racks, showers, and lockers.
Job Characteristics
Finally, the nature of one's job can represent barriers to using public transportation. In somecases, they are real barriers (e.g., in cases where an employee starts and/or finishes work duringhours when bus service is not available). In other cases, they are perceptual or created barriers(e.g., the idea that running errands on the way to and from work keeps one from being able toride transit). Questions were included to study the impact of an individual's work characteristicson ridership and/or propensity to ride.
What time do you typically arrive at work? What time do you typically leave work to travel home?
How often does your job require you to. . .
Work regular hours?
Use your own personal automobile for work-related travel during the day?
Work overtime hours?
Does your job allow you to. . .
Work flexible hours?
Work an alternative work schedule?
Telecommute?
How often do you. . .
Leave work during the day to eat lunch at places farther from your place of work than you can walk?
Leave work during the day to run errands?
Drop off and/or pick up children at day care / school on your way to / from work?
Run errands on your way to / from work?
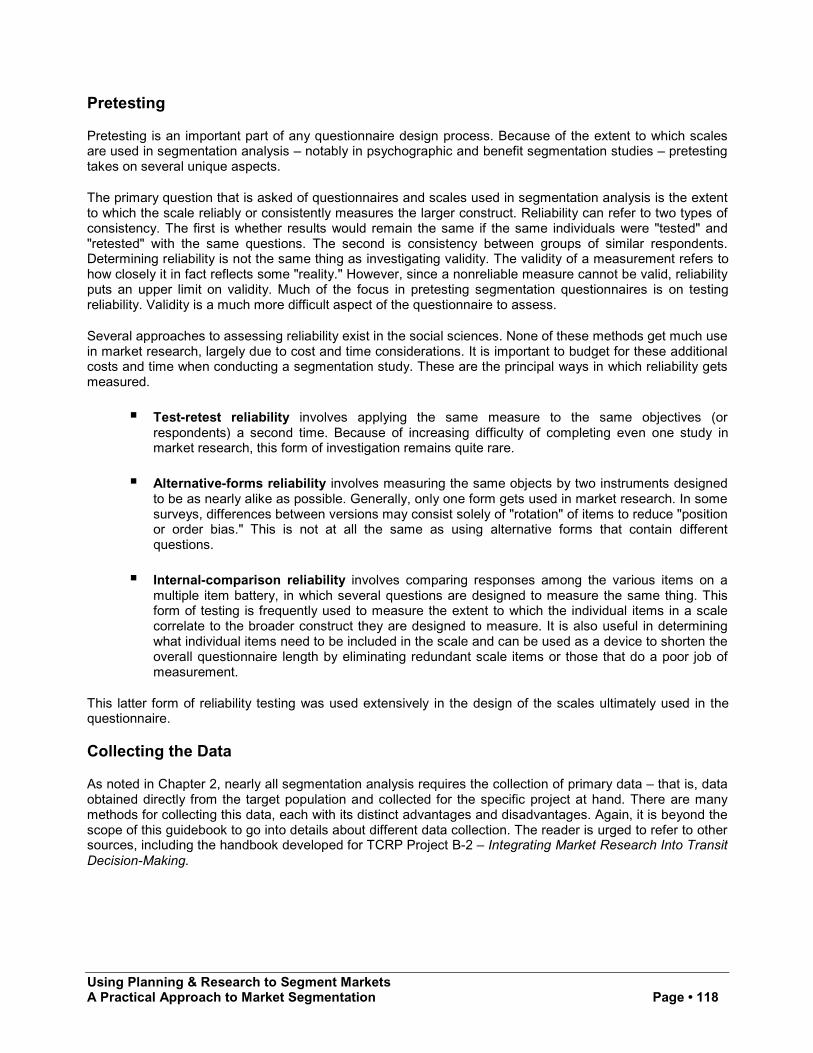
Using Planning & Research to Segment MarketsA Practical Approach to Market Segmentation Page • 118
Pretesting
Pretesting is an important part of any questionnaire design process. Because of the extent to which scalesare used in segmentation analysis – notably in psychographic and benefit segmentation studies – pretestingtakes on several unique aspects.
The primary question that is asked of questionnaires and scales used in segmentation analysis is the extentto which the scale reliably or consistently measures the larger construct. Reliability can refer to two types ofconsistency. The first is whether results would remain the same if the same individuals were "tested" and"retested" with the same questions. The second is consistency between groups of similar respondents.Determining reliability is not the same thing as investigating validity. The validity of a measurement refers tohow closely it in fact reflects some "reality." However, since a nonreliable measure cannot be valid, reliabilityputs an upper limit on validity. Much of the focus in pretesting segmentation questionnaires is on testingreliability. Validity is a much more difficult aspect of the questionnaire to assess.
Several approaches to assessing reliability exist in the social sciences. None of these methods get much usein market research, largely due to cost and time considerations. It is important to budget for these additionalcosts and time when conducting a segmentation study. These are the principal ways in which reliability getsmeasured.
! Test-retest reliability involves applying the same measure to the same objectives (orrespondents) a second time. Because of increasing difficulty of completing even one study inmarket research, this form of investigation remains quite rare.
! Alternative-forms reliability involves measuring the same objects by two instruments designedto be as nearly alike as possible. Generally, only one form gets used in market research. In somesurveys, differences between versions may consist solely of "rotation" of items to reduce "positionor order bias." This is not at all the same as using alternative forms that contain differentquestions.
! Internal-comparison reliability involves comparing responses among the various items on amultiple item battery, in which several questions are designed to measure the same thing. Thisform of testing is frequently used to measure the extent to which the individual items in a scalecorrelate to the broader construct they are designed to measure. It is also useful in determiningwhat individual items need to be included in the scale and can be used as a device to shorten theoverall questionnaire length by eliminating redundant scale items or those that do a poor job ofmeasurement.
This latter form of reliability testing was used extensively in the design of the scales ultimately used in thequestionnaire.
Collecting the Data
As noted in Chapter 2, nearly all segmentation analysis requires the collection of primary data – that is, dataobtained directly from the target population and collected for the specific project at hand. There are manymethods for collecting this data, each with its distinct advantages and disadvantages. Again, it is beyond thescope of this guidebook to go into details about different data collection. The reader is urged to refer to othersources, including the handbook developed for TCRP Project B-2 – Integrating Market Research Into TransitDecision-Making.
Using Planning & Research to Segment MarketsA Practical Approach to Market Segmentation Page • 119
In selecting the data collection method for segmentation analysis, two factors frequently drive this decision:
! The sample design and sampling procedure selected. Notably, the need for random samplingprocedures to insure the ability to project the results of the research to the general populationmay indicate the most appropriate data collection method. Telephone interviewing – notablycomputer-assisted telephone interviewing (CATI) – is the data collection method that representsthe greatest opportunity for administering a truly random sample.
! The questionnaire. Questionnaires for segmentation analysis are generally longer than averageand quite complex. The ability to randomize the order of the scale items – to prevent responseorder bias – and the possibility for complex skip and/or branching patterns often dictates the useof telephone or face-to-face interviews. Again, the use of computers – either computer-assistedtelephone interviewing or computer-assisted self-administered questionnaires – can greatlyenhance the reliability of the data that is gathered.
Some segmentation studies purport to use qualitative data collection methods – for example, focus groups.The results of such methods can never be projected to the general population and should be consideredstrictly exploratory in nature. These methods, however, are often very useful to pretest the questionnaire.
Computer-assisted telephone interviewing was selected for this project for thefollowing reasons:
! The ability to develop and administer a random sample of households in eachmarket to insure projectability of the data to the target population.
! The ability to program the questionnaire administration so that the scales could bedelivered to the respondent in a random order, thereby eliminating any kind of orderbias. The questionnaire also contained complex skip and branching patterns forseveral groups of respondents including riders and nonriders, and commuters andnoncommuters. These skip and branching patterns could be programmed so thatthe questionnaire could be administered smoothly and accurately.
! The ability for trained interviewers to encourage respondents to complete a long –39 minute – and complex survey.
! The ability for the computer-assisted telephone system to handle callbacks – bothrandom and scheduled callbacks. This was particularly important because of thelength of the survey instrument. Many appointments were scheduled with interestedrespondents so the interview could be completed at a mutually convenient time.
! The ability to monitor the administration of the questionnaire by trained supervisorsto insure a consistency of delivery when interviewing a great many respondents –over 3,000 – in different markets.
Using Planning & Research to Segment MarketsA Practical Approach to Market Segmentation Page • 120
Analyzing and Interpreting the Data
Once the data has been gathered, it must be analyzed to provide meaningful information to the end user ofthe research – the marketer, service planner, or general manager. However, data analysis should beginbefore the data is collected. To maximize the value of the findings, the researcher should have a clear ideaof what is being sought. An analysis plan should be developed. Then, the specific data analysis tools can beselected. Because of the complexity of data analysis and the use of multivariate statistical methods that arenot commonly used, outside assistance is frequently needed at this stage of the project.
An analysis plan, as its name implies, is an overview of the steps to be taken to analyze the data once it hasbeen collected. The plan typically specifies what should occur at each of the following stages:
! Coding and Data Preparation. Coding simplifies further analysis by classifying responses intopredetermined categories. Somewhat unique to segmentation analysis is the significant amountof other data preparation that must be completed prior to forming the segments. For example,factor analysis might be performed to determine natural groupings of variables that can becombined to create a new measure. The individual variables contained in psychographic scalesare often combined to create an overall measure of the psychographic dimension. Standardizingvariables before subjecting them to clustering procedures usually makes sense. This is becausedifferences in the scales of variables can influence the results from many clustering procedures.Depending on the sample design used, data may also need to be weighted.
! Segment Formation. Many procedures exist for identifying market segments. A listing in theAppendix provides a non-technical summary of the major multivariate procedures that are oftenused in segmentation analysis. At this stage, practicality is of the essence. A complexsegmentation model is not advisable if a simpler design adequately provides the requiredinformation.
! Tabulation. Once the segments have been formed, additional tabulation is needed to assess thegeneral relationships between the segments and other key marketing variables. One of the mostbasic data analysis techniques available, cross-tabulations extend the value of tabulation bystudying inter-relationship among groups of marketing variables. Banner tabulations – multiplecross-tabulations on a single page – provide an easy reference for those users of the informationthat want to see how each segment responds to each and every question in the surveyinstrument.
Following is an excerpt from the analysis plan developed as part of this research effort.
Overall Approach for Lifestyle Segmentation
The data from the system interviews will be analyzed to develop and validate the general lifestyleapproach to predicting transit usage. The analysis consists of several parts. The first partinvolves identifying from the many proposed variables those that most relate to transit usage.This stage also involves determining if there are any redundancies. Given that most variableswere evaluated in the measure development phase, it is expected that few variables will prove tobe unrelated to the model. The remaining predictor variables will be grouped into one of threebroad groupings, (1) psychographics, (2) beliefs about transit, and (3) facilitating factors. Thecriterion variable will be transit usage, which is a combination of everyday and specialcircumstance uses of public transit.
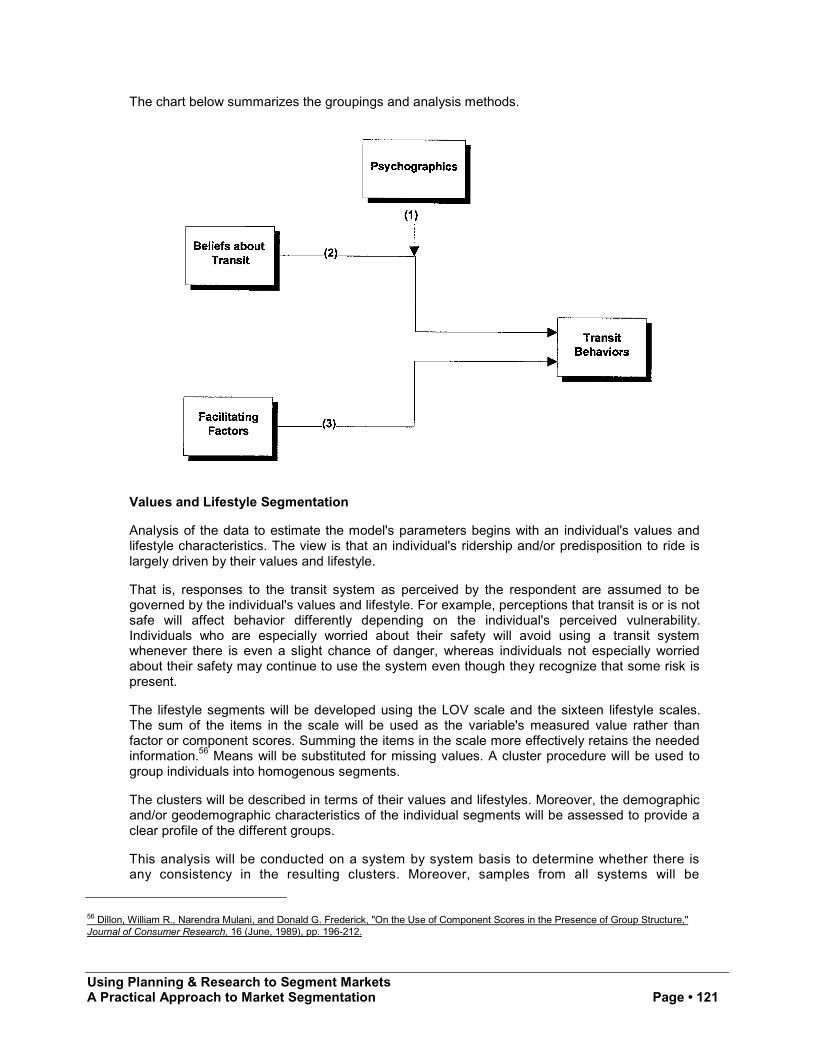
Using Planning & Research to Segment MarketsA Practical Approach to Market Segmentation Page • 121
The chart below summarizes the groupings and analysis methods.
Values and Lifestyle Segmentation
Analysis of the data to estimate the model's parameters begins with an individual's values andlifestyle characteristics. The view is that an individual's ridership and/or predisposition to ride islargely driven by their values and lifestyle.
That is, responses to the transit system as perceived by the respondent are assumed to begoverned by the individual's values and lifestyle. For example, perceptions that transit is or is notsafe will affect behavior differently depending on the individual's perceived vulnerability.Individuals who are especially worried about their safety will avoid using a transit systemwhenever there is even a slight chance of danger, whereas individuals not especially worriedabout their safety may continue to use the system even though they recognize that some risk ispresent.
The lifestyle segments will be developed using the LOV scale and the sixteen lifestyle scales.The sum of the items in the scale will be used as the variable's measured value rather thanfactor or component scores. Summing the items in the scale more effectively retains the neededinformation.56 Means will be substituted for missing values. A cluster procedure will be used togroup individuals into homogenous segments.
The clusters will be described in terms of their values and lifestyles. Moreover, the demographicand/or geodemographic characteristics of the individual segments will be assessed to provide aclear profile of the different groups.
This analysis will be conducted on a system by system basis to determine whether there isany consistency in the resulting clusters. Moreover, samples from all systems will be
56 Dillon, William R., Narendra Mulani, and Donald G. Frederick, "On the Use of Component Scores in the Presence of Group Structure,"Journal of Consumer Research, 16 (June, 1989), pp. 196-212.
Using Planning & Research to Segment MarketsA Practical Approach to Market Segmentation Page • 122
combined to determine if a single cluster solution can be identified that satisfies the criteria foreffective market segmentation. In this latter approach, clustering will be done on a split-half-validation basis to determine if the solutions tend to replicate.
Beliefs about Transit
The second stage of the model focuses on individual's beliefs about transit. The view is thatindividuals base their decisions in part on their perceptions of the transit system. Theseperceptions reflect both the actual operations of the system and indirect information about thesystem. The latter includes word of mouth, mass media news stories, and transit promotions. It isexpected that individuals will consider the pros and cons of using the transit system and make arational decision about whether to use it or not. The responses to the questions on benefitssought and perceptions of transit will be combined to develop a transit belief variable. Thesevariables will be factor analyzed to determine what, if any, underlying constructs exist.
The resulting variables from the factor analysis, along with the variables measuring generalbeliefs about transit and current or past use / consideration of transit will be compared across theclusters identified above. This analysis will identify which, if any, of the clusters evidence thehighest existing ridership and/or propensity to ride.
Facilitating Factors
Finally, it has been observed that individuals may share similar beliefs about transit and yetengage in different behaviors. The model attributes some of this to factors not under the controlof the individual that may override individual preferences. The availability of employer providedparking and service availability in the individual's area represent two such factors. These factorsare assumed to have a direct effect on transit usage.
Existence of facilitating factors will be explored across the different clusters to further identifywhich clusters represent the greatest potential for ridership.
Conducting the Analysis – Psychographic Segmentation
As the analysis plan suggests, one phase of the analysis identified segments based on psychographics –that is, life style and psychological variables. This analysis identified five market segments that satisfied thefollowing criteria for market segmentation:
! The segments must be large enough to be profitable.
! The segments must be identifiable.
! The segments must be reachable by media.
! The segments should respond differently to the marketing mix.
! The segments should be stable in terms of size.
! The segments should be reasonably cohesive. That is, the members should behave in as muchthe same way as possible.
! The segments should be growing.
Using Planning & Research to Segment MarketsA Practical Approach to Market Segmentation Page • 123
! The segments should not be so dominated by competitors to make it unlikely that your productcan be successful.
The analysis consisted of the following steps:
! Combined variables were computed to reflect each of the nineteen psychographic characteristics– susceptibility to interpersonal influence, arousal seeking tendency, innovativeness, timemanagement, general environmental concern, socially responsible consumption behavior,automobile involvement, locus of control, self-confidence, fearfulness, cleanliness, sociability,frugality, personal control, responsibility, physical mobility, occupational mobility, financialoptimism, and role overload. The List of Values was treated as individual psychographicvariables.
! These twenty-eight variables were then centered and standardized. The purpose of this processis to remove the effects of different scale responses.
! Following this process, all variables were analyzed using a clustering procedure called ConvergentCluster Analysis. Convergent Cluster Analysis is a software program used for developing cluster-based solutions for market segmentation. Survey information on product preferences, desiredbenefits, usage habits, product requirements, attitudes, values and lifestyles, or other variables areused to explore the underlying structure of your market. The replication offering the greatestreproducibility was selected for further analysis.
! Further analysis consisted of basic cross-tabulations and CHAID (Chi-squared AutomaticInteraction Detector) to better understand the characteristics of the individual segments.
Using the clustering procedure described above, five market segments wereidentified – each having a unique psychographic profile. Further analysis also indicated thateach of these five segments have different demographic characteristics, attitudes towardtransit, needs for transportation that must be satisfied, and potential for using publictransportation. Each segment was given a "name" to represent these unique sets ofcharacteristics.
Two segments – Easygoing Alternatives and Upwardly Modals – represent markets thatshould be considered Intenders – that is, they are the most likely markets to use or considerusing public transportation. Intenders represent 37 percent of the total market for choiceriders.
The remaining three segments – Cautious Drivers, Silver Treads, and Kings of the Road –represent markets that are Avoiders – that is, they are least likely to use or consider using publictransportation. Only Cautious Drivers represents any potential for use of some alternative mode.Avoiders represent 63 percent of the total market.
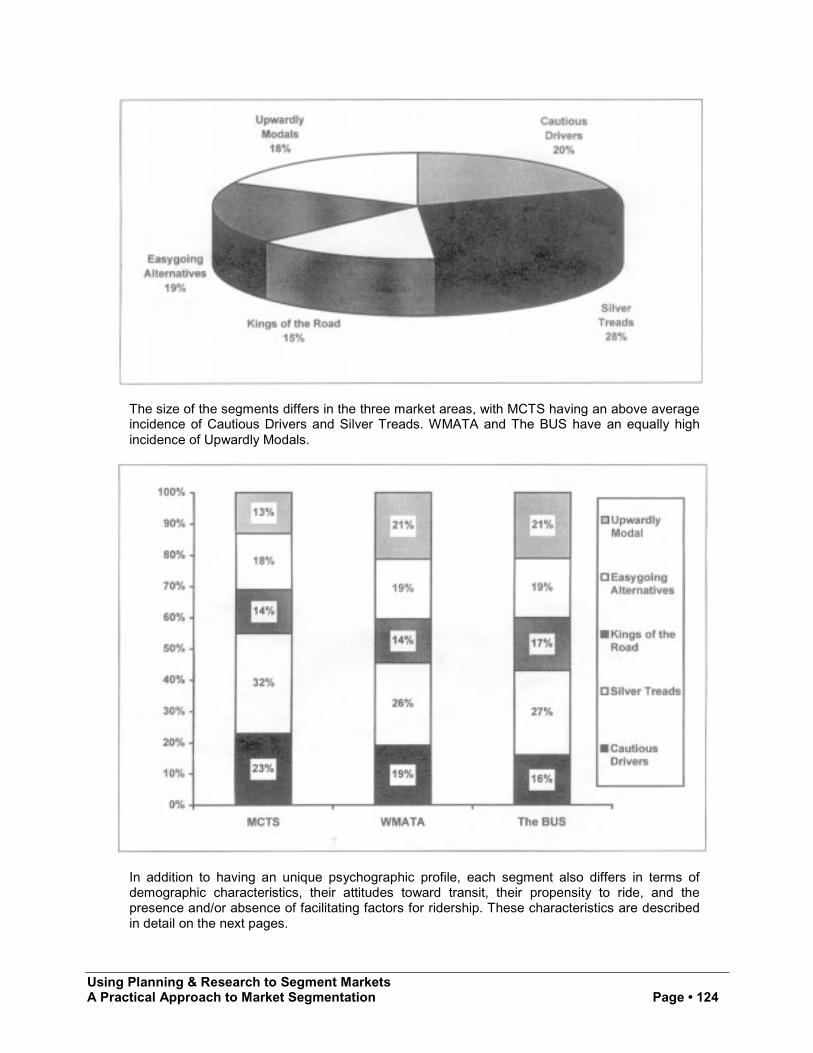
Using Planning & Research to Segment MarketsA Practical Approach to Market Segmentation Page • 124
The size of the segments differs in the three market areas, with MCTS having an above averageincidence of Cautious Drivers and Silver Treads. WMATA and The BUS have an equally highincidence of Upwardly Modals.
In addition to having an unique psychographic profile, each segment also differs in terms ofdemographic characteristics, their attitudes toward transit, their propensity to ride, and thepresence and/or absence of facilitating factors for ridership. These characteristics are describedin detail on the next pages.
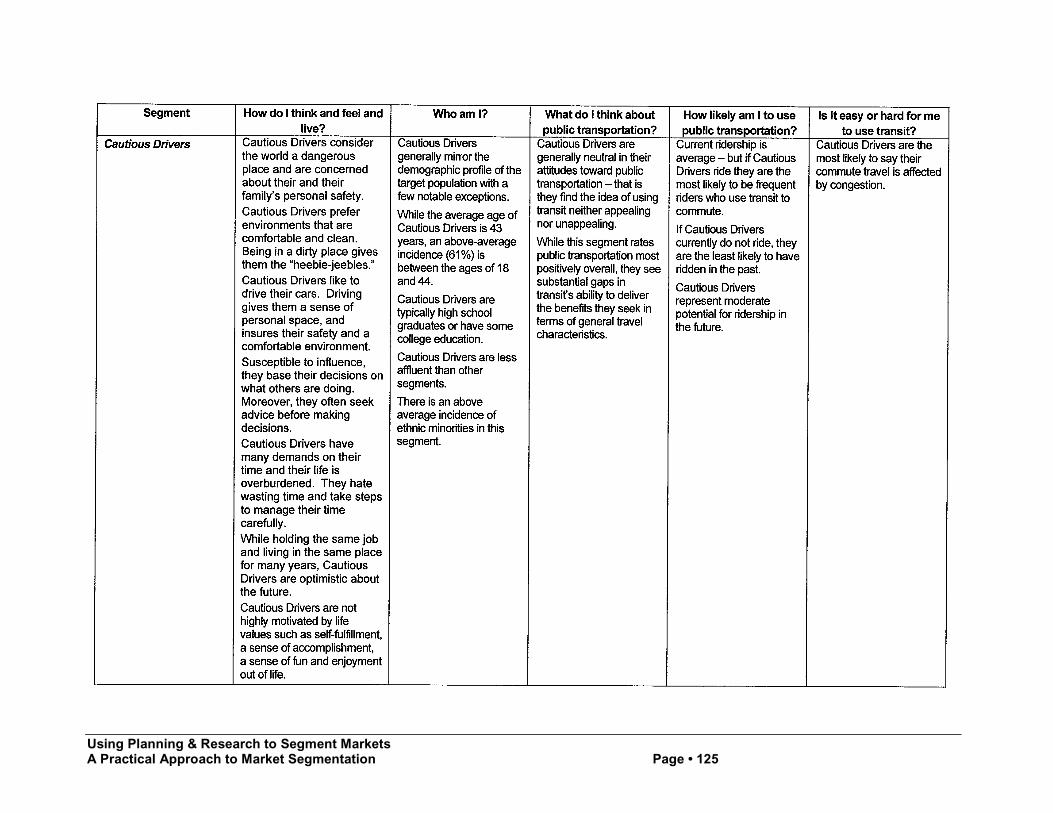
Using Planning & Research to Segment MarketsA Practical Approach to Market Segmentation Page • 125
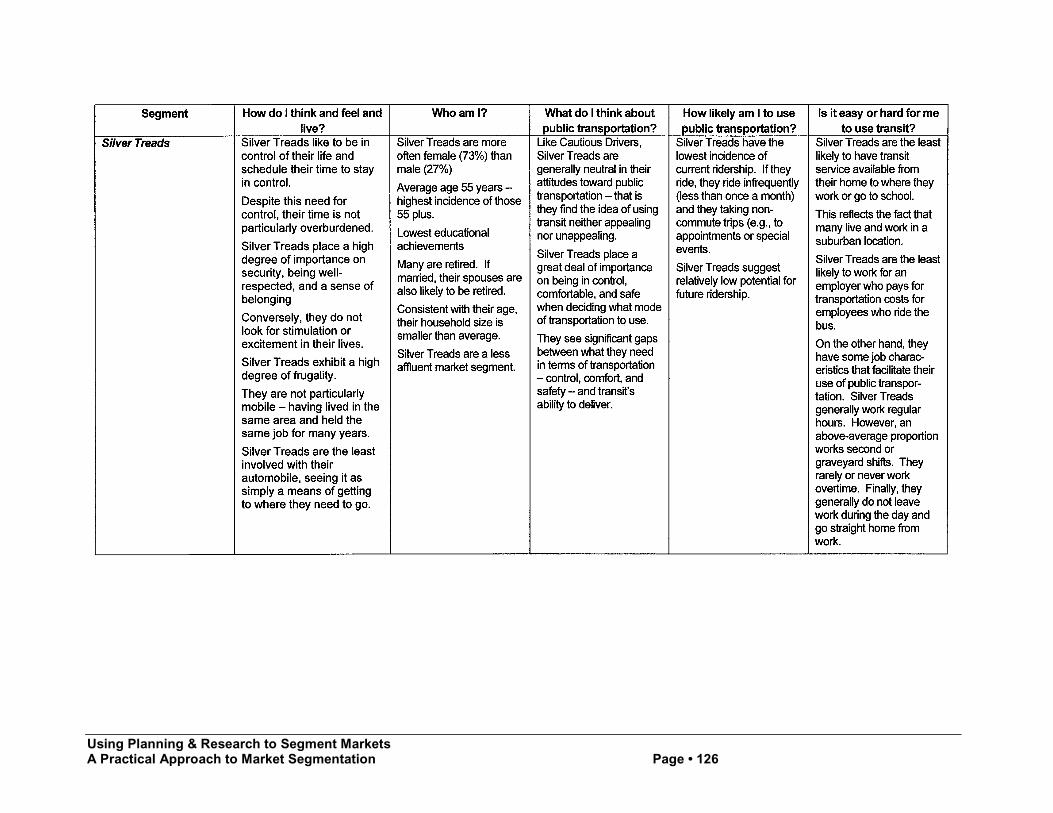
Using Planning & Research to Segment MarketsA Practical Approach to Market Segmentation Page • 126
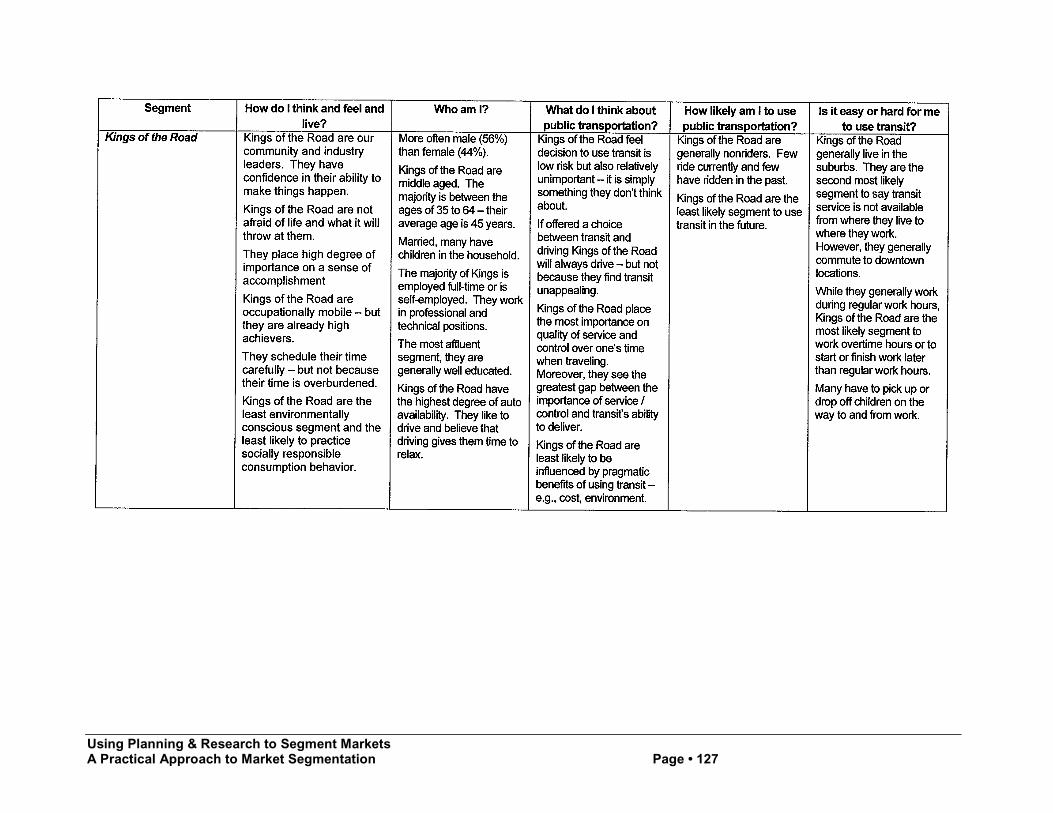
Using Planning & Research to Segment MarketsA Practical Approach to Market Segmentation Page • 127
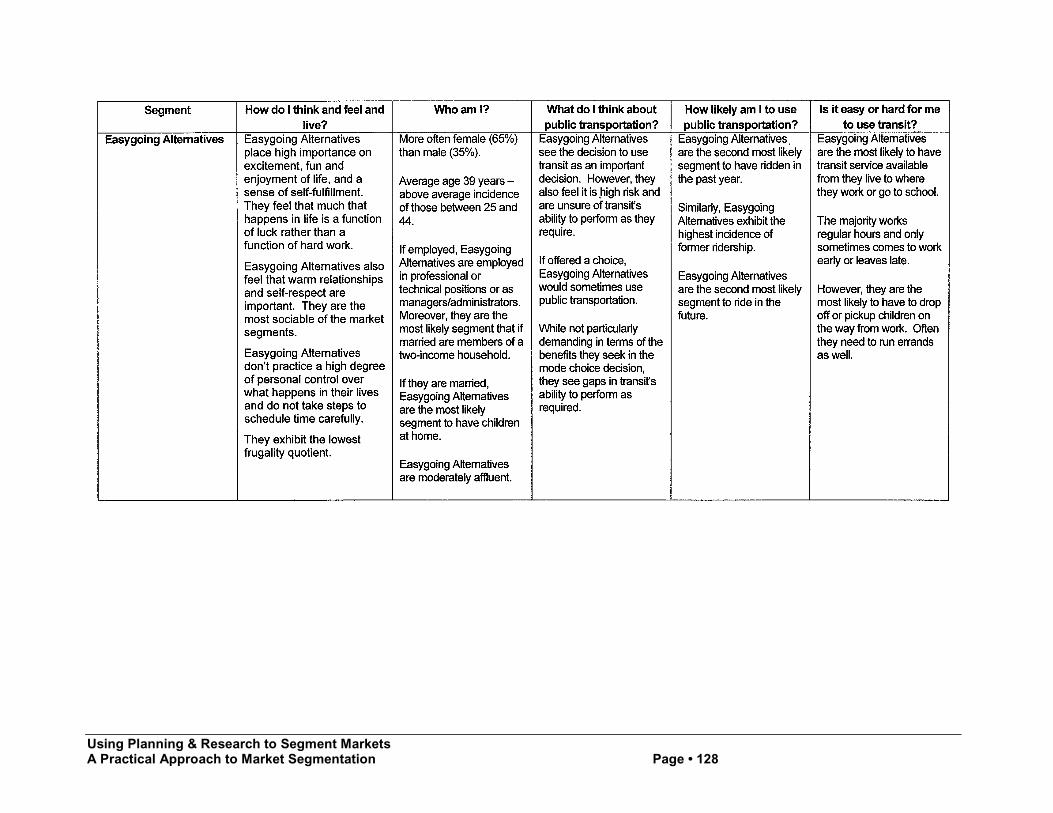
Using Planning & Research to Segment MarketsA Practical Approach to Market Segmentation Page • 128
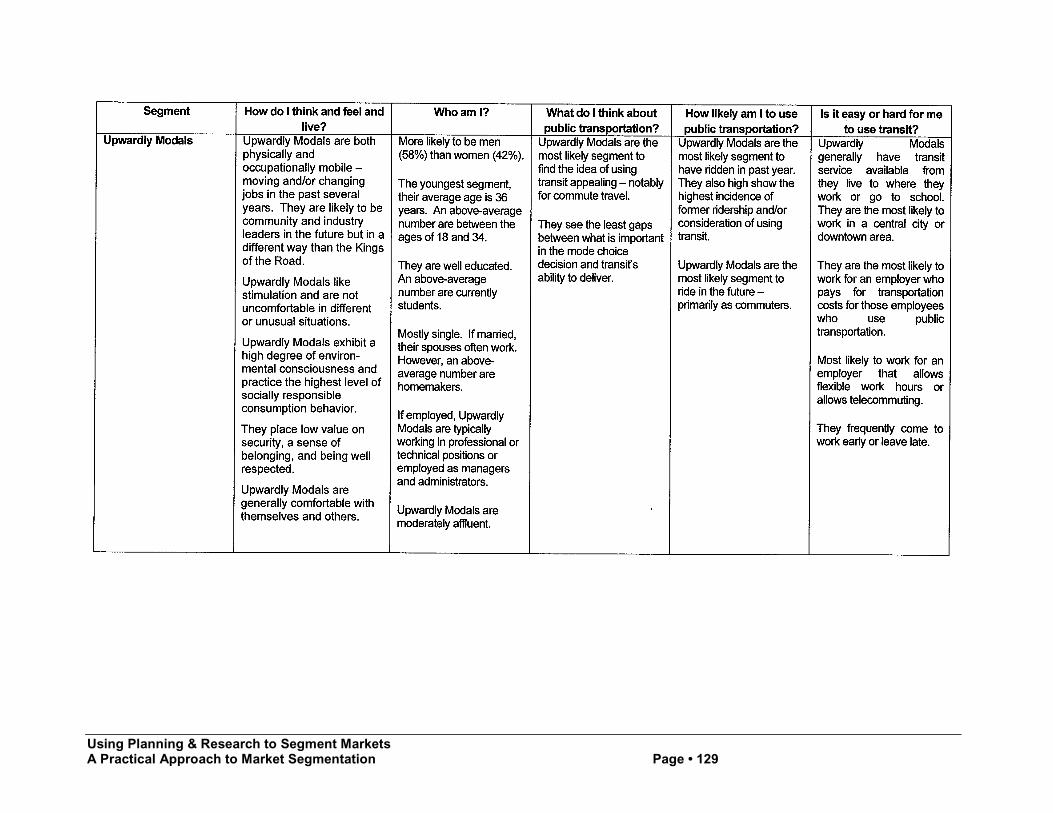
Using Planning & Research to Segment MarketsA Practical Approach to Market Segmentation Page • 129
Using Planning & Research to Segment MarketsA Practical Approach to Market Segmentation Page • 130
Conducting the Analysis – Benefit Segmentation
An alternative basis for segmentation – benefit segmentation – was also employed. The same criteria set forthe psychographic segmentation was used. This analysis consisted of the following steps:
! The questions on the importance of twenty-nine characteristics of mode choice were factoranalyzed. Four dimensions were identified. The characteristics that correlated with eachdimension and the corresponding descriptors (titles) are shown below.
! Service / Control: I can count on it to get me where I am going on time. I can control my ownschedule. It is easy to arrange. I am able to get home in an emergency. I am able to comeand go when I want. It offers me the flexibility I need for my schedule. It gets me where I amgoing the quickest way possible. I do not have to change from one mode to another to get towhere I am going.
! Comfort / Safety: It is comfortable. I have a place to sit. It is clean. I do not have to worryabout who is going to sit next to me. I do not have to worry about bad weather. I do not haveto worry about carrying packages or parcels. I am assured of my personal safety from crime. Iam assured that other people will not bother me. It enables me to arrive at my destinationfeeling clean and fresh, not dirty or grimy.
! Pragmatic Benefits: It is good for the environment. It does not contribute to trafficcongestion. It gets me to and from where I want to go without feeling stressed. It does notcost much. It minimizes my risk of getting in a traffic accident. I don't have to worry aboutwear and tear on my vehicle. I don't have to worry about bad weather.
! Image: It is appropriate for a person in my position. It is consistent with the kind of person Iam. It gives me the opportunity to be alone to think. It gets me in the right frame of mind forthe rest of the day.
! Variables were computed to reflect these overall dimensions. These were then analyzed usingConvergent Cluster Analysis.
! Further analysis consisted of basic cross-tabulations and CHAID to better understand thecharacteristics of the individual segments.
Four benefit segments were identified and are introduced below. The Practically On-Boardsrepresents the largest segment and the greatest potential for transit ridership. Service Skeptics, while a smallsegment, are supportive of transit and the concept of alternative modes. As their names suggest, the BeMores and the Auto-Bonds avoid the very idea of using public transportation.
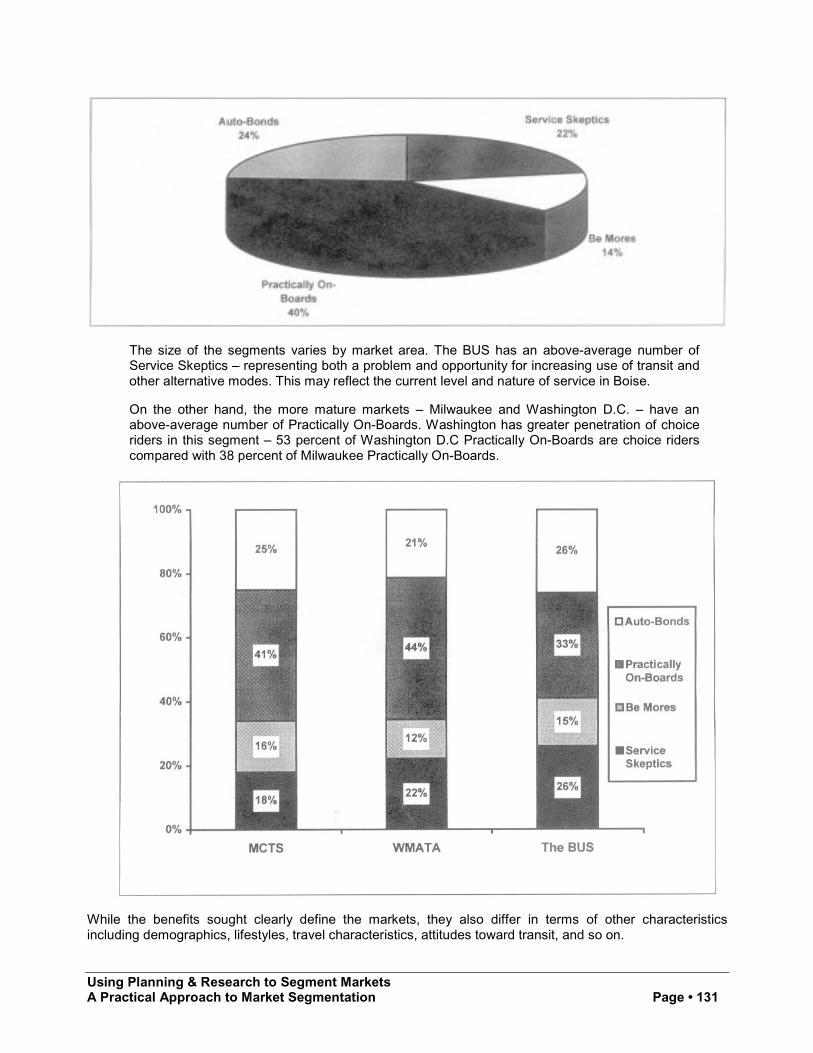
Using Planning & Research to Segment MarketsA Practical Approach to Market Segmentation Page • 131
The size of the segments varies by market area. The BUS has an above-average number ofService Skeptics – representing both a problem and opportunity for increasing use of transit andother alternative modes. This may reflect the current level and nature of service in Boise.
On the other hand, the more mature markets – Milwaukee and Washington D.C. – have anabove-average number of Practically On-Boards. Washington has greater penetration of choiceriders in this segment – 53 percent of Washington D.C Practically On-Boards are choice riderscompared with 38 percent of Milwaukee Practically On-Boards.
While the benefits sought clearly define the markets, they also differ in terms of other characteristicsincluding demographics, lifestyles, travel characteristics, attitudes toward transit, and so on.
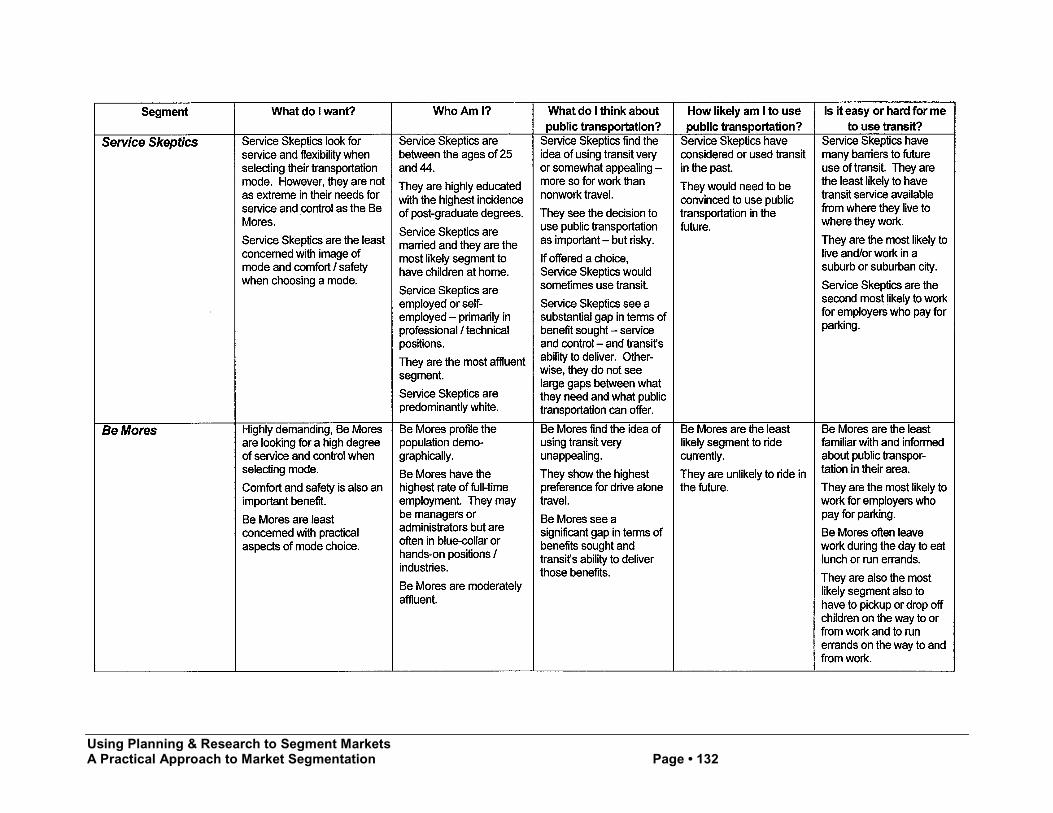
Using Planning & Research to Segment MarketsA Practical Approach to Market Segmentation Page • 132
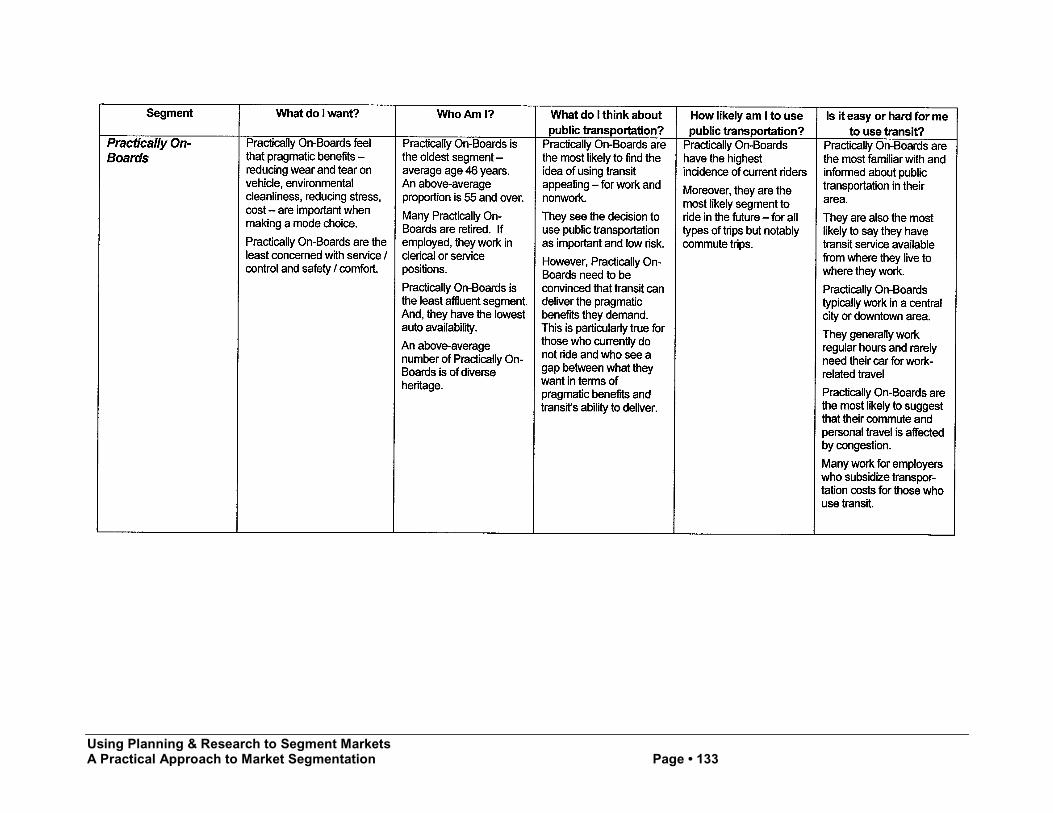
Using Planning & Research to Segment MarketsA Practical Approach to Market Segmentation Page • 133
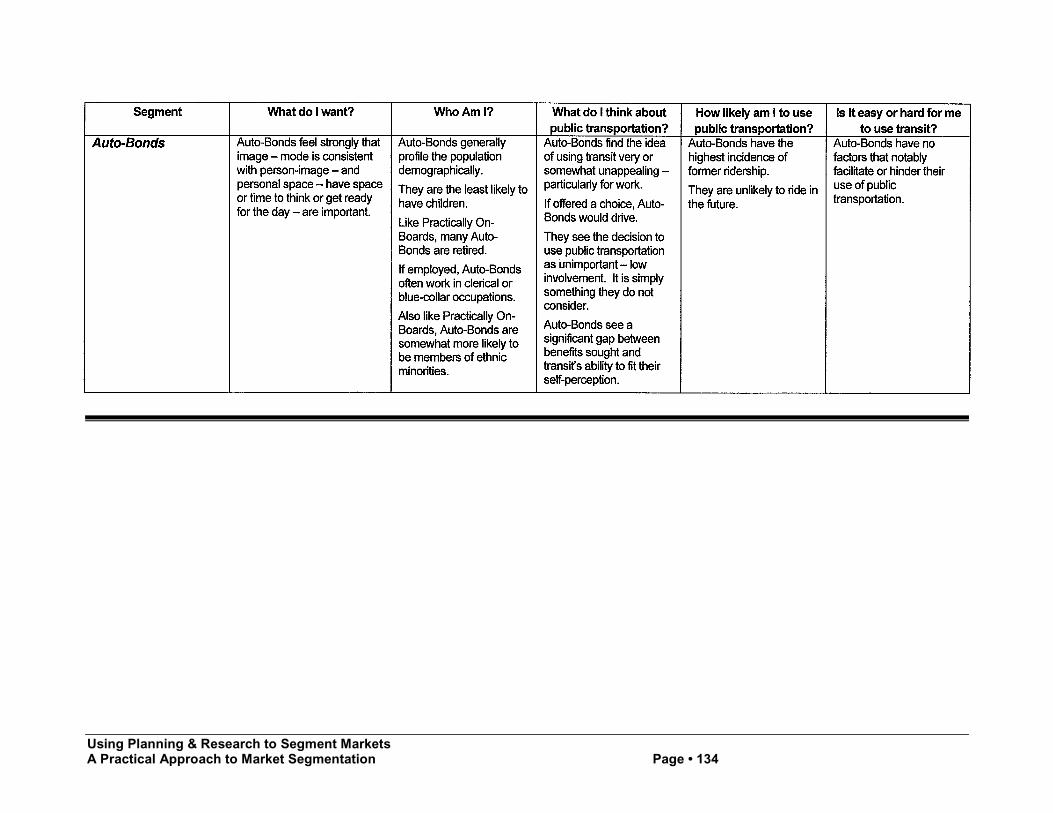
Using Planning & Research to Segment MarketsA Practical Approach to Market Segmentation Page • 134
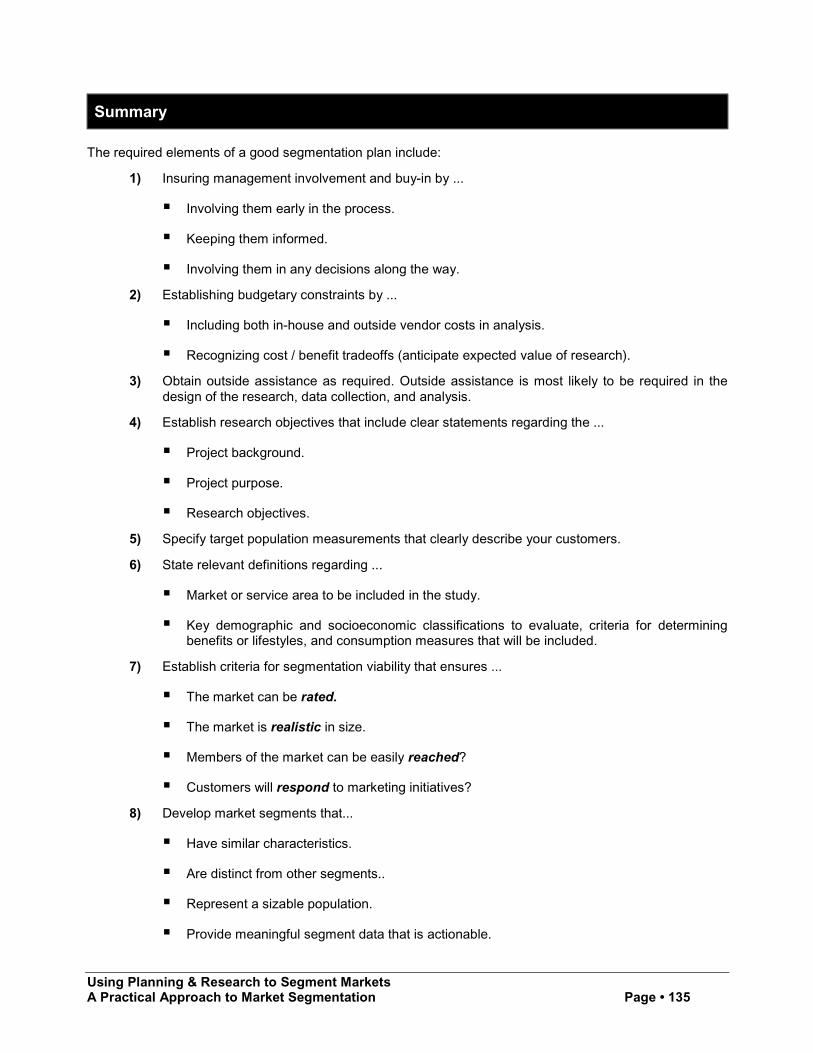
Using Planning & Research to Segment MarketsA Practical Approach to Market Segmentation Page • 135
Summary
The required elements of a good segmentation plan include:
1) Insuring management involvement and buy-in by ...
! Involving them early in the process.
! Keeping them informed.
! Involving them in any decisions along the way.
2) Establishing budgetary constraints by ...
! Including both in-house and outside vendor costs in analysis.
! Recognizing cost / benefit tradeoffs (anticipate expected value of research).
3) Obtain outside assistance as required. Outside assistance is most likely to be required in thedesign of the research, data collection, and analysis.
4) Establish research objectives that include clear statements regarding the ...
! Project background.
! Project purpose.
! Research objectives.
5) Specify target population measurements that clearly describe your customers.
6) State relevant definitions regarding ...
! Market or service area to be included in the study.
! Key demographic and socioeconomic classifications to evaluate, criteria for determiningbenefits or lifestyles, and consumption measures that will be included.
7) Establish criteria for segmentation viability that ensures ...
! The market can be rated.
! The market is realistic in size.
! Members of the market can be easily reached?
! Customers will respond to marketing initiatives?
8) Develop market segments that...
! Have similar characteristics.
! Are distinct from other segments..
! Represent a sizable population.
! Provide meaningful segment data that is actionable.
Using Planning & Research to Segment MarketsA Practical Approach to Market Segmentation Page • 136
9) Select the appropriate bases for segmentation by ...
! Developing the segmentation model.
! Identifying physical bases – geographic, demographic, geodemographic.
! Identifying behavioral bases – psychographics, benefits, product use.
10) Collect the data by ...
! Considering the applicability of secondary, primary and syndicated data.
! Selecting the best method of data collection – telephone or personal interviews.
11) Employ appropriate sampling procedures. This generally means using probabilistic or randomsamples.
12) Analyze and interpret the data by following an analysis plan that...
! Specifies coding and tabulation requirements.
! Defines the statistical analysis – including multivariate procedures – that will be employed.
! Uses complex models and advanced techniques only as needed.
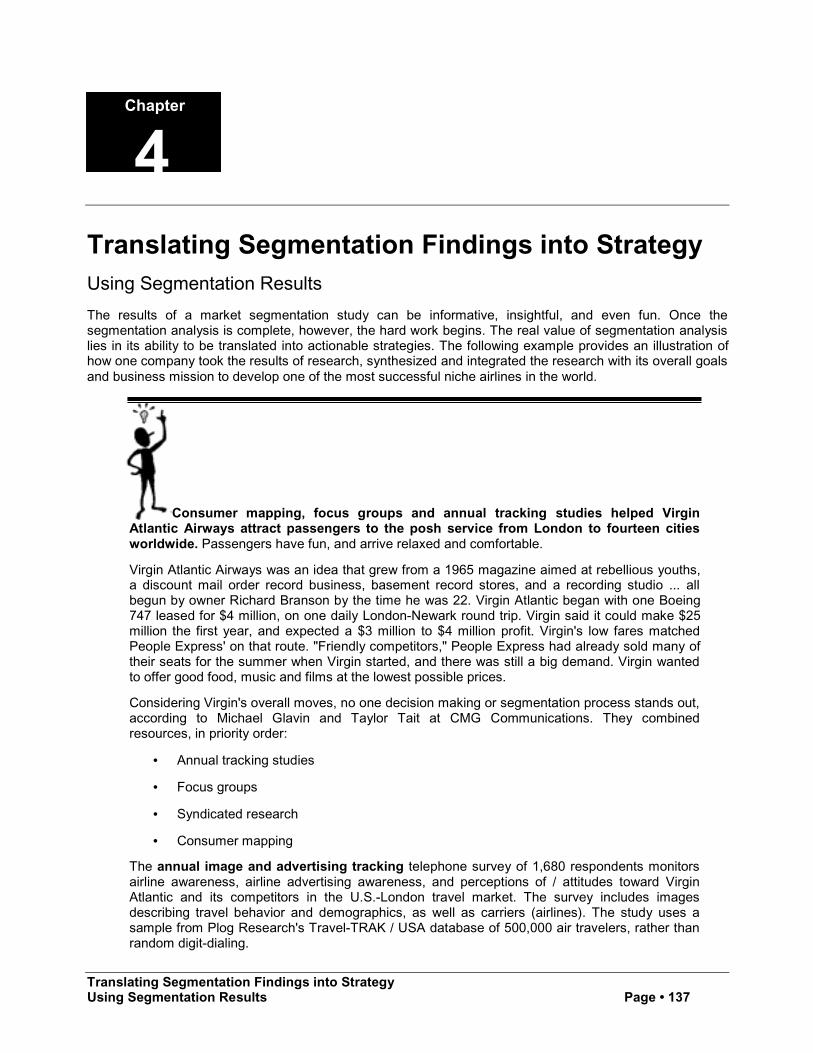
Translating Segmentation Findings into StrategyUsing Segmentation Results Page • 137
Chapter
4Translating Segmentation Findings into StrategyUsing Segmentation Results
The results of a market segmentation study can be informative, insightful, and even fun. Once thesegmentation analysis is complete, however, the hard work begins. The real value of segmentation analysislies in its ability to be translated into actionable strategies. The following example provides an illustration ofhow one company took the results of research, synthesized and integrated the research with its overall goalsand business mission to develop one of the most successful niche airlines in the world.
Consumer mapping, focus groups and annual tracking studies helped VirginAtlantic Airways attract passengers to the posh service from London to fourteen citiesworldwide. Passengers have fun, and arrive relaxed and comfortable.
Virgin Atlantic Airways was an idea that grew from a 1965 magazine aimed at rebellious youths,a discount mail order record business, basement record stores, and a recording studio ... allbegun by owner Richard Branson by the time he was 22. Virgin Atlantic began with one Boeing747 leased for $4 million, on one daily London-Newark round trip. Virgin said it could make $25million the first year, and expected a $3 million to $4 million profit. Virgin's low fares matchedPeople Express' on that route. "Friendly competitors," People Express had already sold many oftheir seats for the summer when Virgin started, and there was still a big demand. Virgin wantedto offer good food, music and films at the lowest possible prices.
Considering Virgin's overall moves, no one decision making or segmentation process stands out,according to Michael Glavin and Taylor Tait at CMG Communications. They combinedresources, in priority order:
• Annual tracking studies
• Focus groups
• Syndicated research
• Consumer mapping
The annual image and advertising tracking telephone survey of 1,680 respondents monitorsairline awareness, airline advertising awareness, and perceptions of / attitudes toward VirginAtlantic and its competitors in the U.S.-London travel market. The survey includes imagesdescribing travel behavior and demographics, as well as carriers (airlines). The study uses asample from Plog Research's Travel-TRAK / USA database of 500,000 air travelers, rather thanrandom digit-dialing.
Translating Segmentation Findings into StrategyUsing Segmentation Results Page • 138
Last year, Virgin was pleased that 82% of flyers knew that Virgin flies to London. But unaidedawareness of Virgin was low (28%) and declining. Facing significant product improvements andmassive ad campaigns ($160 million in the category) by British Airways, American Airlines andUnited Airlines, Virgin found that its initial low-fare positioning affected the present attitudes offrequent business-class travelers. In focus groups, they said that "people like them did not fly onVirgin." With profitability linked to Upper Class® service, the challenge was whether Virgin couldbreak from its backpacker / low-fare heritage and be fully embraced by business travelers. Hereis the Virgin Atlantic / CMG experience:
"TURNING BACKPACKS INTO BRIEFCASES"
GOALS: To elevate the stature of Virgin, CMG Communications set out to increasebrand and advertising awareness, increase familiarity with the Upper Class®product, increase business travelers' approval or "Airline-for-Me" ratings, and turnthese into trial and subsequent profit.
TARGET AUDIENCE: Three-quarters of Trans-Atlantic business travelers were menages 35 to 54 with household incomes of $75,000+ who flew business or first classand were "married" to frequent flyer programs. Interestingly, they had low serviceexpectations.
CREATIVE STRATEGY: "Show them the product. Make them smile." Enhance Virgin'simage as an innovative leader among jaded international business travelers. Tocreatively link messages in all media, Virgin used the theme, "Instead of traveling toa culture, travel in a culture." Specific services such as drive-through check-in andin-flight massage were shown in high quality images to portray the "Virgin Culture."Focus groups showed that this changed the perceptions of travelers who knewabout Virgin, but had rejected trial of the airline. Seeing is believing.
MEDIA STRATEGY: "Go big. Or don't bother wasting the money." With only a 5%"share of voice" (advertising in its competitive set), Virgin revised its $8 millionbudget. It sacrificed radio -- a previous media cornerstone -- in favor of cable andspot TV in 45-, 30- and 15-second increments, and ran cover gatefolds in themagazines used by "the big guys" (mega-carriers.) They also used newspaper,direct mail, point-of-purchase and travel industry events.
EVIDENCE OF RESULTS: The most important increases related to familiarity and ashift in the perception that Virgin is "appropriate for me" among those in targetmarket segment. Those who were familiar with Virgin increased 70% (19 points)and those who rated Virgin highly increased 42% (16 points.) In 1997, Virgin hadthe highest load factor on the Atlantic and the most profitable year in its history.
Focus groups were used to explore attitudes found in the annual tracking survey and evaluatethe impact of advertising. Heavily used in brand management, focus groups are helpful inconcept development, testing and evaluation.
Syndicated research such as Simmons Market Research Bureau helps analyze product andmedia usage through magazine data. Other examples are FIND / SVP which monitors mostpublications and provides articles according to subject; and Tab-It, demographic profiles forproduct categories. To study competitors' activities and buy media, ad agencies typically refer to:Arbitron, local television and radio ratings; Nielsen, national and local ratings by demographicdefinitions; Mediamark Research, Inc., product and media usage; Scarborough, demographicand product usage habits of media audiences; Leading National Advertisers' Adspender, allexpenditures in ten major markets; Broadcast Advertiser Reports, competitive television activity;and Publishers Information Bureau, competitive print activity with geographic scope.
Consumer mapping is a geodemographic system that uses census data and consumer purchaserecords to classify cities into distinct clusters. By geographically charting the preferences for productsand ideas, and seeing the courses of trends and even fads over time, one gets an idea of whatconsumers will buy tomorrow and can give consumers what they want even before they know theywant it, according to Michael Weiss, author of Latitudes & Attitudes and The Clustering of
Translating Segmentation Findings into StrategyUsing Segmentation Results Page • 139
America. PRIZMTM (potential rating index by zip markets) from Claritas and ClusterPlus fromDonnelley are examples of syndicated research relating to consumer mapping, combininglifestyle and demographic information using geographic (census tract or zip code) divisions.Virgin develops "Heat Sensitive Maps" with demographic, psychographic and purchase behaviorinformation showing the propensity to travel to the U.K., and ranking zip codes in its U.S.gateway markets.
Created around a core philosophy of innovation, value for the money and the idea thatflying should be fun, Virgin is way ahead of the concept of consumer orientation ... focusing notsimply "on the passenger" but rather on how passengers feel when they step off the plane --relaxed and comfortable. Identifying with gracious British hospitality, Virgin Atlantic aims to offerthe highest quality service in the world at competitive prices. Economy class is a superb value,but almost all the profits come from Virgin's posh Upper Class® service.
Today, Virgin's 20 long-haul aircraft fly nonstop, London to seven "gateway" U.S. cities -- NewYork / Newark, Boston, Washington D.C., Orlando, Miami, Los Angeles and San Francisco --and South Africa, Greece, Japan and Hong Kong. In 1995 there were 8,000 departures with anoverall load factor of 77% (percentage of available seats sold.) Weathering the industry's mosttroublesome years (and the demise of Pan Am, Braniff, British Caledonian and People Express)Virgin Atlantic has emerged as Britain's second largest long-haul passenger and freight carrier,with 5,000 employees helping more than two million passengers each year in business andleisure markets. Virgin Atlantic has received top awards from Travel Weekly, Executive TravelMagazine, Business Travel World, World Airline Entertainment Assn. and Business TravellerMagazine. It has been "Best Airline of the Year" six years in a row and received awards for BestTransatlantic Airline, Best Business Class, Best Advertising Campaign, Best In-flightEntertainment, Best In-flight Magazine (Hot Air), Best In-flight Video and Best Check-in GroundStaff.
The remainder of this chapter explores strategies for incorporating the results from market segmentationresearch into your decision-making. Hypothetical and real-life examples illustrate the process. Worksheetsare provided to aid your agency in your own strategic planning.
Translating Segmentation Findings into StrategyUsing Segmentation Results Page • 140
An Overall Approach
A Three-Step Process
A simple three-step process can be used for strategy formulation.
1) Identify the project or decision. Consider projects or decisions your agency is presently consideringand determine whether segmentation analysis is appropriate for that project or decision. Someexamples of projects for which segmentation analysis might be considered include: new services,special promotions, pass or other fare media programs, advertising, special events, passengerinformation services, direct mail campaigns, guaranteed ride home programs, etc. Once the project ordecision is identified, the following sub-tasks should be completed.
a) Determine the applicability of segmentation analysis to this project. Look first to see ifsegmentation data is available at your agency to see if segmentation analysis can be readilyapplied to this project or decision. If not, look to see if secondary data is available. If data is notavailable, determine the value of collecting this information compared with the overall cost of theproject or the inherent risk in the decision. While segmentation analysis is appropriate to nearly anyproject or decision, consider also whether there is any value – given the potential costs and or timerequired to use segmentation analysis – to applying segmentation analysis to this effort.
b) Create a project team. If segmentation analysis proves applicable to this situation, establish ateam of researchers, analysts, marketers, service planners, and other management personnel asappropriate to collect, analyze, interpret, and use the data.
2) Conduct a situation analysis. If it is determined that segmentation analysis is applicable to thisproject, the project team should first conduct a situation analysis. This step involves taking a step backand examining why your agency is considering this project or undertaking this decision. It is both a fact-finding and decision-making process. This is not an easy task. As Hal W. Goetsch, former director ofmarketing for the American Marketing Association, points out, "Even when a conscientious effort ismade to see the situation objectively, the focus can be blurred by tradition, unquestioned procedures,personalities, manipulated programs, corporate politics, indifference, or laziness. Too often the picture isfaulty because facts are missing, guesses are not reliable, or important elements of the marketingenvironment have been ignored or overlooked." The situation analysis represents an opportunity foryour agency to break out of the box and to look at the project or decision in different ways. Dare to bedifferent! The following elements are part of a good situation analysis.
a) Identify opportunities. Ask yourself and members of the project team about the potential benefitsor gains to the agency if this project is undertaken.
b) Examine problems / threats. Conversely, outline the potential problems or threats that may beencountered. Ask if the opportunities outweigh the problems. Or, can the problems / threats beovercome?
c) Establish goals. Specify what the agency wants to achieve with this project. These goals shouldbe the marketing results sought by management. This process is useful in providing direction – thatis determining what you want to accomplish – motivating staff – identifying what you should beaccomplishing – providing a timetable for implementation – noting if you are on schedule – andmeasuring performance – evaluating whether or not you are meeting your goals. Examples ofgoals are increased ridership, inquiries, awareness / recognition; attract new riders; reduce churn /turnover of existing riders, etc. These goals should be specific, measurable, and time-oriented.Furthermore, the goals should be realistic, objective, clear, and concise.
d) Evaluate current strategies. If this is an existing project, time should be taken to examine currentstrategies in light of the opportunities, problems / threats, and goals explored above. Carefullyoutline and evaluate your current target market selections, the positioning strategy – key message– employed, and the marketing mix – product, promotion, price – that is being explored. If yourexisting strategy has had an evaluation or control function, carefully evaluate the data that isavailable from this process. If this function was not in place, other sources of data may need to beused.

Translating Segmentation Findings into StrategyUsing Segmentation Results Page • 141
3) Formulate strategies. If the situation analysis indicates that this project is worth pursuing, the next stepis to formulate the strategies to employ. If this is an existing project, this may involve a revision orcomplete overhaul of existing strategies. For new projects, you are operating from a clean slate. Asnoted in the situation analysis, be creative. Try looking at the results of your segmentation analysis indifferent ways. Brainstorm – don't reject ideas simply because your agency has never done it that waybefore. The bold new approach may be critical to attract those customer segments that have beenresistant but through segmentation analysis have indicated they can be reached – with just a little moreeffort. The strategy formulation process entails the following three steps:
a) Identify target market segments. The first major strategic decision is to select from the alternativemarket segments one or more groups you want to target for marketing activities. Each of theindividual segments needs to be evaluated on its own merits and in conjunction with thecapabilities and environmental situation surrounding the agency. Such an evaluation will pinpointthe different options that exist and the degrees of attractiveness these options have for the agency.Although several segments may be worth pursuing, the agency must balance multiple factors inmaking the final decision as to which segment(s) to ultimately pursue. This list might include theinternal environment of the agency (financial and other resources), the external environment, anassessment of opportunities versus problems, and agency objectives. A measure of segmentpotential can then be determined. The question that should be asked now is, "How will this targetaudience contribute to the achievement of the marketing objective?" At this point, the agencyshould have a good idea which market segments should be targeted.
b) Position the segments. The second step in strategy formulation is to formulate a uniquemarketing strategy to appeal to the target segment(s) you are trying to reach. The basic premisebehind positioning is that the agency must have a specific advantage when serving this targetsegment. These advantages can be real or perceived. Positioning is the combination of soundmarketing decision-making – based on research – and creativity. Careful consideration of thecharacteristics of each market segment will enable you to identify the position that is most likely tohave the greatest relevance, as well as originality and impact.
c) Specify the marketing mix. The overall marketing strategy employed – which includes themanipulation of the marketing mix (or 4-Ps) – is based on the target market(s) selected and thepositioning strategy that will be employed. Product, promotion, price, and place (distribution) arethe "architectural drawing" of strategy. For maximum effectiveness, they should be based on thesegmentation analysis, as well as other strategic variables – company resources, management'svalues and policies, potential risk and return, etc. Strategies are the way in which marketoperations will be conducted before actual implementation. Strategies should be developed withfull consideration of all other strategies. There must be consistency and compatibility among allstrategic elements. Tactics – short-term strategies – are the "nuts and bolts" of the plan. Tacticsconsist of marketing initiatives such as advertising budgets, media schedules, route plans, etc. Atthis point in the process, the plan for your project is laid out. Will it work? To gauge the success ofthe project, the plan must be executed and then evaluated. Control and evaluation measures – tocheck whether specific objectives are being met, variances in performances have occurred, effortsare on schedule, and changes are prescribed – should be an integral part of this strategyformulation process.
The following figure illustrates this three-step process.
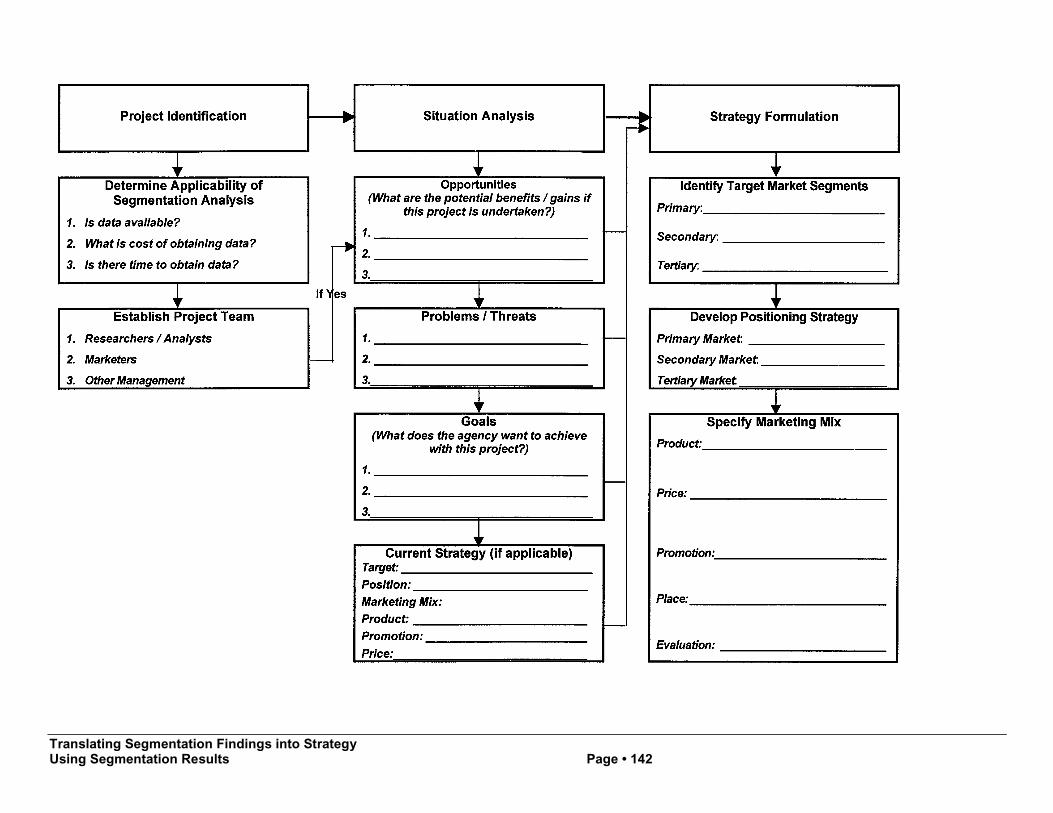
Translating Segmentation Findings into StrategyUsing Segmentation Results Page • 142
Translating Segmentation Findings into StrategyUsing Segmentation Results Page • 143
More on Selecting Target Markets
Selecting the target markets can be an exciting and insightful process. As you undertake this process askyourself the following questions:
1) To whom will this project be targeted? The primary target selected should include all thosewho might be responsive to the project and what is being offered. Typically, one market is likelyto be most responsive.
2) Are there important niche segments that might account for significant responses? Whenyou selected your primary target, you should have focused on one segment over other possibletargets. However, if you have sufficient resources, you may wish to examine the idea of alsoaddressing one or more other market segments. This may be one of the other broad segmentsyou have defined or a specific niche within one of these larger segments. Each may or may notrequire separate strategies which will then require additional resources. When looking at thesesecondary targets consider the following:
a) Can the secondary target represent an important source of ridership or other gain?
b) Is this target segment reachable through targeted means?
c) Would the positioning strategy employed for this audience be compatible with the mainpositioning strategy employed for the primary target?
d) Would the funds needed to reach this target not be better spent elsewhere – against themain target?
If you answered "yes" to all the first three questions and no to the last question, you shouldprobably develop a strategy or strategies to address secondary consumer targets.
3) What is this target like as a person? Most important, what feelings, attitudes, and beliefs doesthis target hold about your proposed project? It is easier to develop strategies if one canvisualize the audience. An insightful answer to this question will contribute decisively to therelevancy, originality, and impact of the final strategies. The description should include all knownlikes and dislikes, ambitions, concerns, attitudes, etc. And, most important from a strategic pointof view, it should include the known ideas, attitudes, and beliefs that relate the individual to theproposed idea. If there are beliefs or attitudes that must be altered, these should be identifiedexplicitly.
4) What action do you want your target to take? By specifying the action you want to cause, youcan create a more focused strategy. This focus will lead to strategies with more relevance andmore impact than vague references to desirable or remote goals such as "improve the image,""change attitudes," or "increase ridership."
5) What action will that action replace? In trying to persuade the target to take a particularaction, what you are really asking them to do is to perform this act instead of doing somethingelse. A complete statement of what the target is to do will always include explicit recognition ofthe source of that action – of what the prospect might have done instead.
Worksheet #1 should prove helpful in identifying your target market segment(s) – Steps 1 and 2. Completeone worksheet. The second worksheet will help you better understand your selected target markets – Steps3 through 5. Complete one worksheet for each target market.
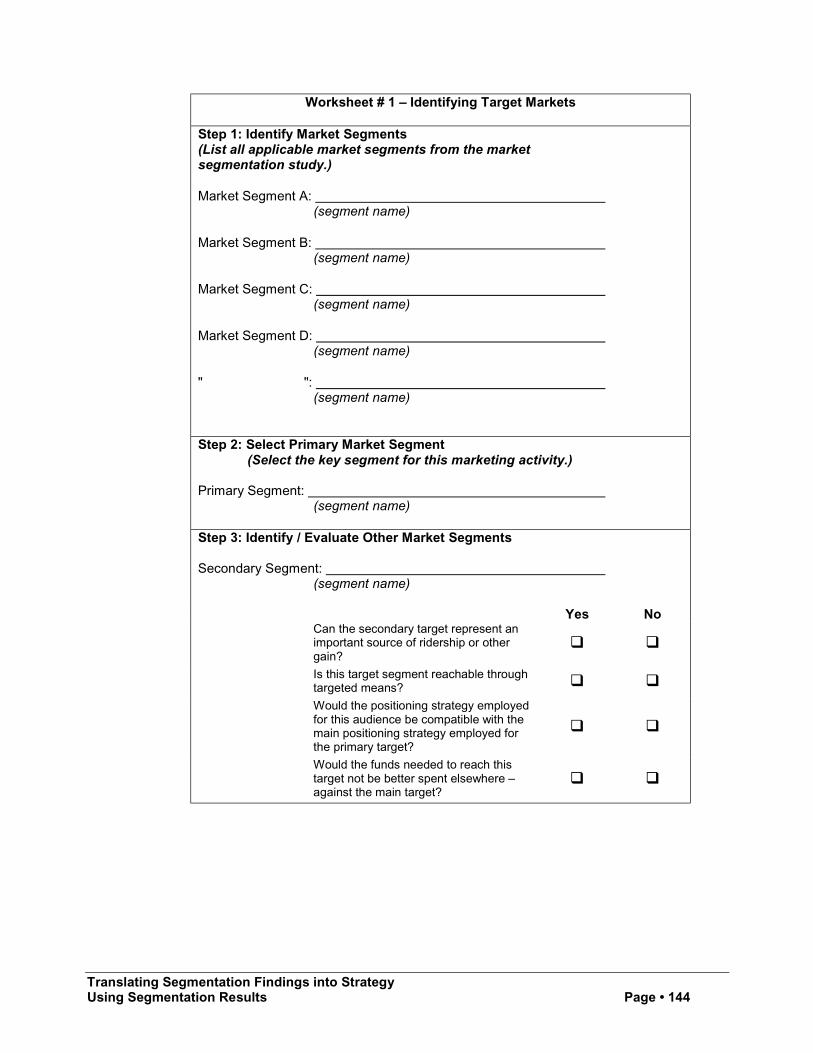
Translating Segmentation Findings into StrategyUsing Segmentation Results Page • 144
Worksheet # 1 – Identifying Target Markets
Step 1: Identify Market Segments(List all applicable market segments from the marketsegmentation study.)
Market Segment A: (segment name)
Market Segment B: (segment name)
Market Segment C: (segment name)
Market Segment D: (segment name)
" ": (segment name)
Step 2: Select Primary Market Segment(Select the key segment for this marketing activity.)
Primary Segment: (segment name)
Step 3: Identify / Evaluate Other Market Segments
Secondary Segment: (segment name)
Yes NoCan the secondary target represent animportant source of ridership or othergain?
# #
Is this target segment reachable throughtargeted means? # #
Would the positioning strategy employedfor this audience be compatible with themain positioning strategy employed forthe primary target?
# #
Would the funds needed to reach thistarget not be better spent elsewhere –against the main target?
# #
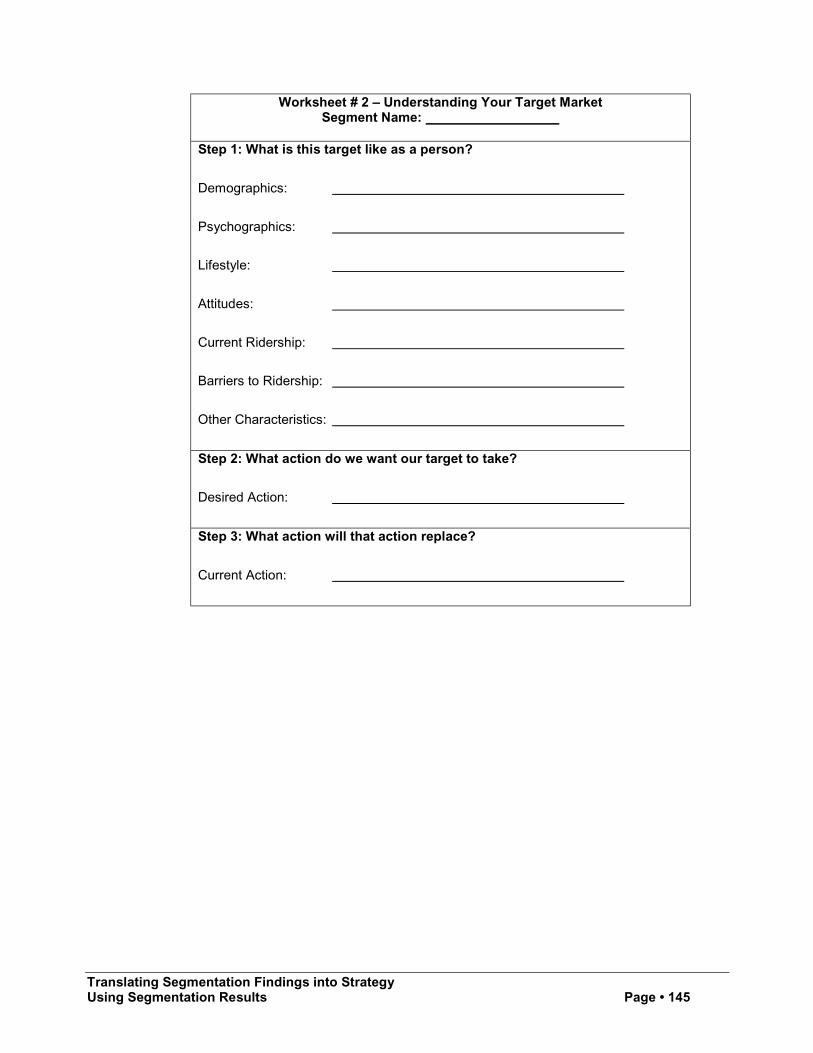
Translating Segmentation Findings into StrategyUsing Segmentation Results Page • 145
Worksheet # 2 – Understanding Your Target MarketSegment Name:
Step 1: What is this target like as a person?
Demographics:
Psychographics:
Lifestyle:
Attitudes:
Current Ridership:
Barriers to Ridership:
Other Characteristics:
Step 2: What action do we want our target to take?
Desired Action:
Step 3: What action will that action replace?
Current Action:
Translating Segmentation Findings into StrategyUsing Segmentation Results Page • 146
More on Positioning
Positioning is a key strategic concept in modern marketing theory and practice. It refers to the problem ofdifferentiating one's own product or service from other competing entries in the marketplace.
At its most basic level, positioning is the development of the value proposition, the statement of how theagency proposes to deliver superior value to customers. Positioning is the communication about the productor service, not the product or service itself. This is evident in the classic definition of position by the authorswho popularized the term, Al Ries and Jack Trout:
Positioning starts with a product. A piece of merchandise, a service, a company, an institution, or even a person. Perhapsyourself.
But positioning is not what you do to a product. Positioning is what you do to the mind of the prospect. That is, youposition the product in the mind of the prospect.
So it is incorrect to call the concept "product positioning." You're not really doing something to the product itself.57
Positioning is the strategic decision-making, the analytical, conceptual, and creative processes that lead tothe positioning statement. The positioning statement – or value proposition – puts the concepts into wordsand performs two critically important functions:
! It becomes the selling proposition to your potential customers, the reason why they should usethe service or act in a certain way rather than another.
! It communicates to the whole organization a sense of specific purpose or direction, coordinatingtheir efforts toward the overarching common purpose of creating a satisfied customer.
The search for a positioning theme around which your strategy can coalesce requires four steps:
1) Identify alternative positioning themes.
2) Screen each meaningful alternative according to whether it is meaningful to customers, isfeasible given your agency's competencies and customer perceptions of what the agency iscapable of achieving, and is helpful in meeting long-term performance objectives.
3) Choose the position that best satisfies the criteria, and generates the most enthusiasm andcommitment within the organization.
4) Write and communicate the positioning statement throughout the organization.
A well-written value proposition or positioning statement has three parts.
1) Who is the target customer?
2) Why should the customer act in the proposed way? The "Why?" part of the positioning statementis the familiar problem of defining the benefits for the customers and the reasons why acting inthe proposed way will deliver those benefits.
3) What are we selling? The "What?" part of the value proposition is the most basic, mostchallenging, and most interesting part of the problem – specifying the service concept, exactlywhat is being offered. It must be defined from the point of view of the customer.
The following worksheet will help your agency work through this process.
57 Al Ries and Jack Trout, Positioning: The Battle For the Mind. (New York: Warner Books, 1986) pg. 2.
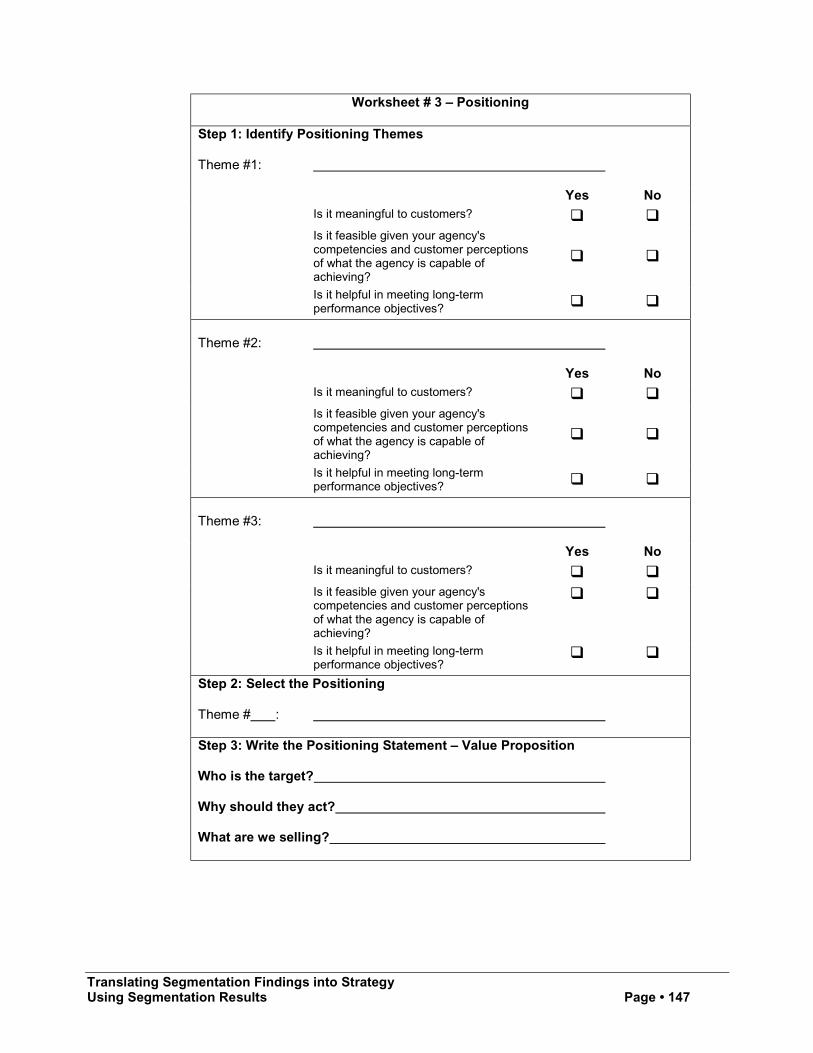
Translating Segmentation Findings into StrategyUsing Segmentation Results Page • 147
Worksheet # 3 – Positioning
Step 1: Identify Positioning Themes
Theme #1:
Yes NoIs it meaningful to customers? # #
Is it feasible given your agency'scompetencies and customer perceptionsof what the agency is capable ofachieving?
# #
Is it helpful in meeting long-termperformance objectives? # #
Theme #2:
Yes NoIs it meaningful to customers? # #
Is it feasible given your agency'scompetencies and customer perceptionsof what the agency is capable ofachieving?
# #
Is it helpful in meeting long-termperformance objectives? # #
Theme #3:
Yes NoIs it meaningful to customers? # #
Is it feasible given your agency'scompetencies and customer perceptionsof what the agency is capable ofachieving?
# #
Is it helpful in meeting long-termperformance objectives?
# #
Step 2: Select the Positioning
Theme # :
Step 3: Write the Positioning Statement – Value Proposition
Who is the target?
Why should they act?
What are we selling?
Translating Segmentation Findings into StrategyUsing Segmentation Results Page • 148
More on Strategy Formulation
Ideally, market segmentation findings can be readily translated into workable strategies. But, this is notalways the case and the strategy formulation process is not easy. Although strategy formulation begins withdata, strategy development also requires a good deal of experience, creativity and common sense.
Specific strategies and tactics must be adapted to particular market segments. Worksheet #3 provides amodel for identifying important strategic issues and capitalizing on them. If you have gone through the three-step process described, this worksheet should be easy to complete using your existing information. Thefocus then becomes strategy development.
Formulating a marketing plan is the recommended next step. A formal, written marketing plan helps toremedy any potential lack of focus. The advantages for the agency in having a marketing plan include:
! It helps to produce desired results by giving your agency direction and organization.
! It is an excellent planning and control tool. Results can be easily compared to the forecast.
! It is a useful management tool. A wealth of information is available at your fingertips.
A marketing plan does not have to be a lengthy or complex document. The goal is to produce a consistent,information-based document with synergism created among all of its components. Such a project can beimplemented, and then monitored for performance. The five required components of a good marketing planinclude:
! Step 1: Market / Situation Analysis. Includes an overview of the results of any market researchthat is applicable, a competitive analysis, and an assessment of uncontrollable factors.
! Step 2: Marketing Objectives. These must be consistent with your agency mission and overallgoals. Moreover, they must be specific.
! Step 3: Strategy Formulation. This involves identifying the target markets, selecting apositioning strategy, and specifying the marketing mix.
! Step 4: Implementation. Here, plans become actions. This should include assignments forcoordination of all efforts.
! Step 5: Evaluation. During this ongoing process, one assesses performance relative toobjectives and goals. Strategies and tactics are revised as necessary.
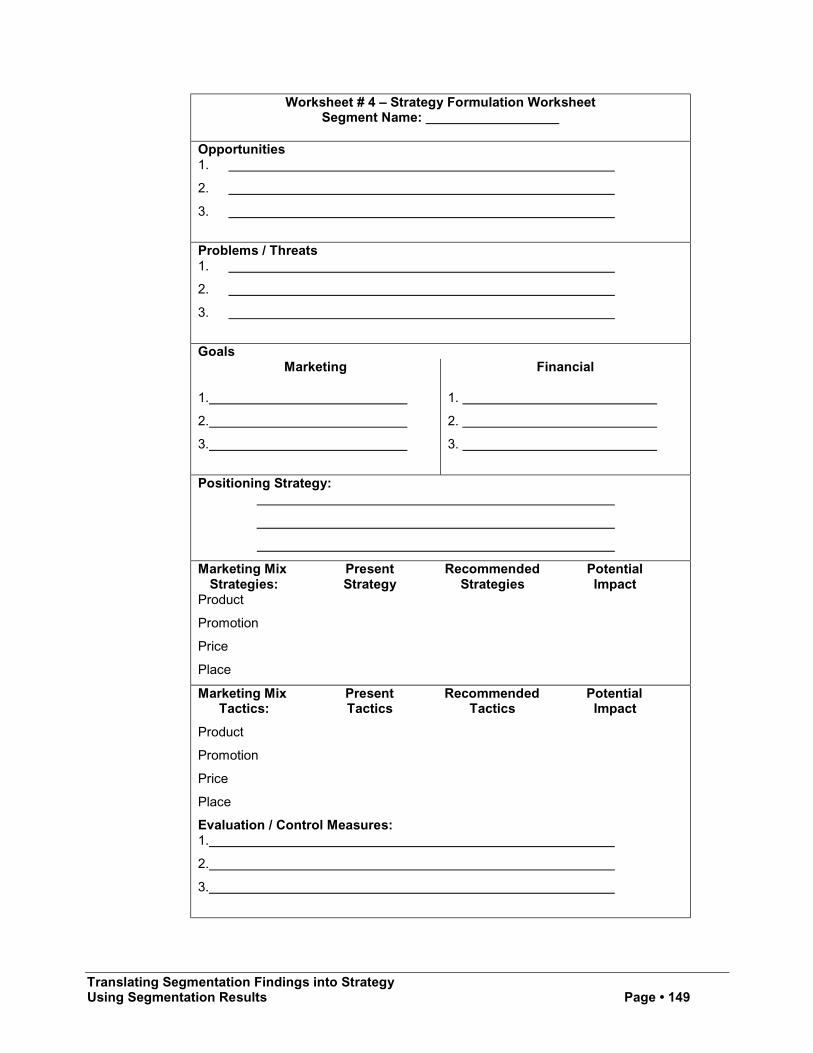
Translating Segmentation Findings into StrategyUsing Segmentation Results Page • 149
Worksheet # 4 – Strategy Formulation WorksheetSegment Name:
Opportunities1.
2.
3.
Problems / Threats1.
2.
3.
GoalsMarketing
1.
2.
3.
Financial
1.
2.
3.
Positioning Strategy:
Marketing Mix Present Recommended PotentialStrategies: Strategy Strategies Impact
Product
Promotion
Price
Place
Marketing Mix Present Recommended PotentialTactics: Tactics Tactics Impact
Product
Promotion
Price
Place
Evaluation / Control Measures:1.
2.
3.
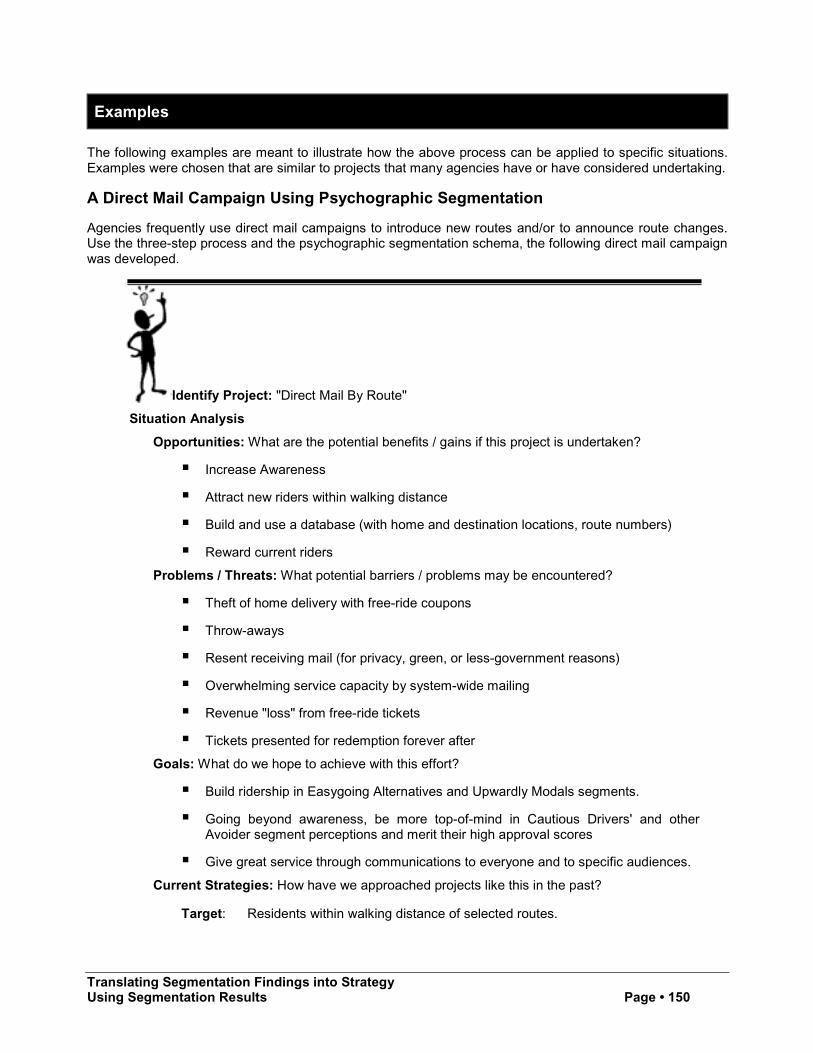
Translating Segmentation Findings into StrategyUsing Segmentation Results Page • 150
Examples
The following examples are meant to illustrate how the above process can be applied to specific situations.Examples were chosen that are similar to projects that many agencies have or have considered undertaking.
A Direct Mail Campaign Using Psychographic Segmentation
Agencies frequently use direct mail campaigns to introduce new routes and/or to announce route changes.Use the three-step process and the psychographic segmentation schema, the following direct mail campaignwas developed.
Identify Project: "Direct Mail By Route"
Situation Analysis
Opportunities: What are the potential benefits / gains if this project is undertaken?
! Increase Awareness
! Attract new riders within walking distance
! Build and use a database (with home and destination locations, route numbers)
! Reward current riders
Problems / Threats: What potential barriers / problems may be encountered?
! Theft of home delivery with free-ride coupons
! Throw-aways
! Resent receiving mail (for privacy, green, or less-government reasons)
! Overwhelming service capacity by system-wide mailing
! Revenue "loss" from free-ride tickets
! Tickets presented for redemption forever after
Goals: What do we hope to achieve with this effort?
! Build ridership in Easygoing Alternatives and Upwardly Modals segments.
! Going beyond awareness, be more top-of-mind in Cautious Drivers' and otherAvoider segment perceptions and merit their high approval scores
! Give great service through communications to everyone and to specific audiences.
Current Strategies: How have we approached projects like this in the past?
Target: Residents within walking distance of selected routes.
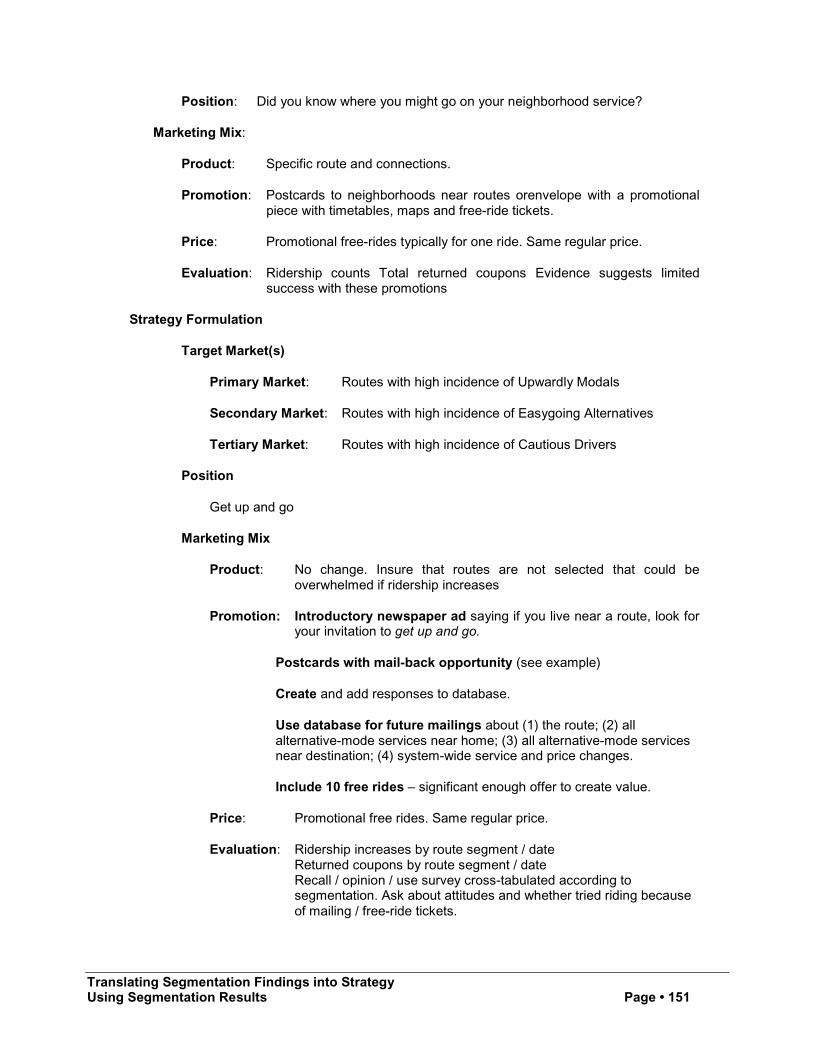
Translating Segmentation Findings into StrategyUsing Segmentation Results Page • 151
Position: Did you know where you might go on your neighborhood service?
Marketing Mix:
Product: Specific route and connections.
Promotion: Postcards to neighborhoods near routes orenvelope with a promotionalpiece with timetables, maps and free-ride tickets.
Price: Promotional free-rides typically for one ride. Same regular price.
Evaluation: Ridership counts Total returned coupons Evidence suggests limitedsuccess with these promotions
Strategy Formulation
Target Market(s)
Primary Market: Routes with high incidence of Upwardly Modals
Secondary Market: Routes with high incidence of Easygoing Alternatives
Tertiary Market: Routes with high incidence of Cautious Drivers
Position
Get up and go
Marketing Mix
Product: No change. Insure that routes are not selected that could beoverwhelmed if ridership increases
Promotion: Introductory newspaper ad saying if you live near a route, look foryour invitation to get up and go.
Postcards with mail-back opportunity (see example)
Create and add responses to database.
Use database for future mailings about (1) the route; (2) allalternative-mode services near home; (3) all alternative-mode servicesnear destination; (4) system-wide service and price changes.
Include 10 free rides – significant enough offer to create value.
Price: Promotional free rides. Same regular price.
Evaluation: Ridership increases by route segment / dateReturned coupons by route segment / dateRecall / opinion / use survey cross-tabulated according tosegmentation. Ask about attitudes and whether tried riding becauseof mailing / free-ride tickets.
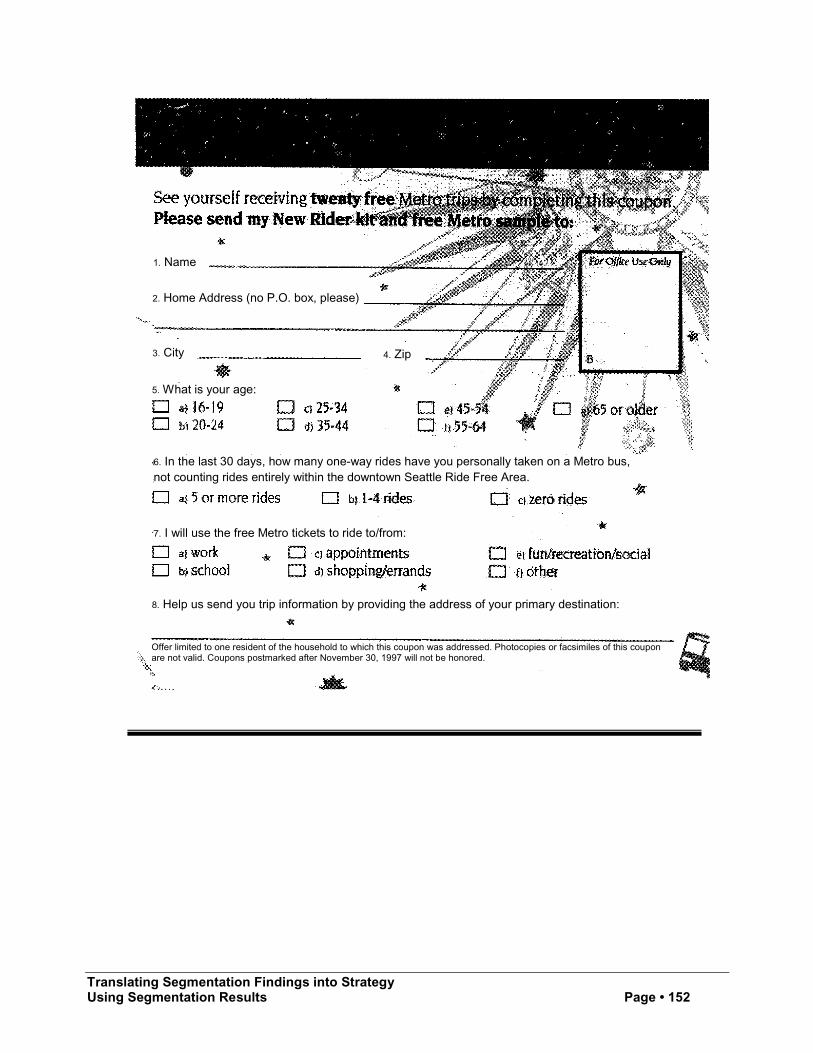
Translating Segmentation Findings into StrategyUsing Segmentation Results Page • 152
Offer limited to one resident of the household to which this coupon was addressed. Photocopies or facsimiles of this couponare not valid. Coupons postmarked after November 30, 1997 will not be honored.
1. Name
2. Home Address (no P.O. box, please)
3. City 4. Zip
5. What is your age:
6. In the last 30 days, how many one-way rides have you personally taken on a Metro bus,not counting rides entirely within the downtown Seattle Ride Free Area.
7. I will use the free Metro tickets to ride to/from:
8. Help us send you trip information by providing the address of your primary destination:
Translating Segmentation Findings into StrategyUsing Segmentation Results Page • 153
Service to a Special Event Using Benefit Segmentation
Agencies frequently run special services during special events. All too often, little is done to take advantageof the ridership on these special services and institute methods to convert this special ridership to occasionalor even regular ridership. Using the three-step process and the benefit segmentation schema, the followingprogram was developed.
Identify Project: "Service to Local Special Event"
Situation Analysis
Opportunities: What are the potential benefits / gains from this project?
! Increase awareness
! Attract and retain new occasional or frequent riders
! Build relationships / familiarity with many who ride only for occasions
! Build and use a database (with home and destination locations)
Problems / Threats: What potential barriers / problems may be encountered?
! Cost of providing service
! Costs of training
! Costs of public information in a much larger area than the service district
! Revenue "loss" from future free-ride tickets
Goals: What do we hope to achieve with this effort?
! Increase awareness of service and quality / availability of service
! Increase ridership counts
! Attract new, permanent riders
! Build relationships with occasional riders as "supportive constituents"
Current Strategies: How have we approached projects like this in the past?
Target: Anyone attending festival
Position: Get from parking to festival easily
Marketing Mix:
Product: Special routes created for festivalRelatively frequentCirculating between fixed park-and-ride lots and central location atfestival
Translating Segmentation Findings into StrategyUsing Segmentation Results Page • 154
Promotion: Sometimes noneLimited newspaper or radio in conjunction with festival advertising
Price: Free or nominal ($0.25 to $0.50) charge
Evaluation: Ridership counts
Strategy Formulation
Target Market(s)
Primary Market: Service Skeptics
Secondary Market: Practically On-Boards
Position "It's a sure, quick ride."
Marketing Mix
Product: Two service offerings:Regular service circulating between fixed park-and-ride lot andfestival event. Service would circulate every 30 minutes to 1 hour.
Premium service circulating between fixed park-and-ride lots andfestival event. Would serve people who have elected to park in setaside / reserved parking rows. Very frequent service – guaranteedwait of no more than 10 minutes between buses.
Price: Regular service – free or regular cash fare Premium service – $1.00per person or double cash fare.
Promotion: Newspaper and radio advertising announcing service.
Ambassadors at park-and-ride lots or festival event to assist riderswith service, answer other questions about service, distributepromotional postcards for future riding.
Postcards with mail-back opportunity (see previous example).Also, includes one free ride coupon for future ride or one free gateticket to the event.
Create and add responses to database.
Use database for follow-up mailings about (1) regional services;(2) all alternative-mode services near home; (3) all alternative-modeservices near destination; (4) system-wide service and pricechanges.
Include in follow-up mailing 10 free rides – significant enoughoffer to create value.
Evaluation: Ridership at festival Returned coupons by route segment / dateRecall / opinion / use survey cross-tabulated according tosegmentation. Ask about attitudes and whether tried riding becauseof mailing / free-ride tickets.
Translating Segmentation Findings into StrategyUsing Segmentation Results Page • 155
Two Real Life Applications
Between the time the segmentation research was completed and the development of this handbook, two ofthe participating agencies have had the opportunity to make use of this data and to use the data inimplementing a specific project. In both situations, the data was applied to the development of a marketingcommunications campaign. This is not to say that this type of research is only useful for these types ofapplications. Rather, this is simply a function of the amount of time – approximately four months – that wasavailable between the time the segmentation research was completed and this handbook was developed.Application of this research is equally applicable to the development of new products or services, planningnew routes, or developing new fare media. These latter types of projects, however, usually take longer toimplement because of the amount of capital investment and other factors that are involved.
Development of a Ridership Campaign – Southeast Wisconsin
The Wisconsin Department of Transportation (WisDOT) joined with four transit systems – the MilwaukeeCounty Transit System, the Racine Belle Urban Transit System, the City of Kenosha Transit System and theCity of Waukesha Metro Transit System – to create a regional marketing program in SoutheasternWisconsin. As part of this initiative, considerable research was conducted. Moreover, Milwaukee CountyTransit System participated as one of the sites in this TCRP research effort. The following represents the useof this combined research in the development of a ridership campaign.
Target Market(s)
Primary Market: Upwardly Modals
Secondary Market: Easygoing Alternatives
Position
You Can Catch All Day Passes
Strategy
Product: No change.
Promotion: Radio and newspaper advertising.
Translating Segmentation Findings into StrategyUsing Segmentation Results Page • 156
!!RADIO COPY!
!
SE Wisconsin Transit PartnersPARTNERSHIP – 701 :60
"Catching Passes TW"
April 21, 1997REVISED 5/01/97
MUSIC: (TV Music)
ANNCE: I'm here on the bus with a couple of pretty darn good pass catchers – Antonio
Freeman and Mark Chmura – talking about, what else, catching passes.
MARK: When you run good routes, you're wide open.FREE: Then you catch passes all day.MARK: Just like your bus company.FREE: And this Wednesday and Thursday you can catch an all day pass.MARK: Just a dollar fiftyFREE: There's the Z-option to work.MARK: 2-Jet Scat Hang to school.FREE: A Rover Blast to the Mall.MARK: Then X Hitch Post home.FREE: All day, all over – a dollar fifty.
ANNCE: So if you're in Milwaukee, Waukesha, Racine, or Kenosha, you can ride the bus
all day
FREE: ... this Wednesday and Thursday ...
ANNCE: Wednesday, May 14 OR Thursday May 15 for how much?
MARK: Just a dollar fifty.
ANNCE: A buck fifty, unlimited rides?
MARK: All day long. All over.
ANNCE: For routes and schedules call ...
MARK: Your bus company.
ANNCE: Get your All Day Pass when you hop on board. That's a super deal.
FREE: Your bus.
MARK: All day, all over – a dollar fifty.
FREE: Catch one.
Translating Segmentation Findings into StrategyUsing Segmentation Results Page • 157
!!RADIO COPY!!
SE Wisconsin Transit PartnersPARTNERSHIP – 702 :60
"Catch Today THUR"
April 21, 1997REVISED 5/01/97
MUSIC: (TV Music)
ANNCE: I'm here on the bus with a couple of pretty darn good pass catchers – Antonio
Freeman and Mark Chmura – talking about, what else, catching passes.
MARK: When you run good routes, you're wide open.FREE: Then you catch passes all day.MARK: Just like your bus company.FREE: They run lots of routes ...MARK: all over town ....FREE: in all kinds of traffic ....MARK: right on time.FREE: And this Thursday you can catch an all day pass.MARK: Just a dollar fifty.FREE: There's the Z-option to work.MARK: 2-Jet Scat Hang to school.FREE: A Rover Blast to the Mall.MARK: Then X Hitch Post home.FREE: All day, all over – a dollar fifty.
ANNCE: So if you're in Milwaukee, Waukesha, Racine, or Kenosha, you can ride the bus
all day today for how much?
MARK: Just a dollar fifty.
ANNCE: A buck fifty, unlimited rides?
MARK: All day long. All over.
ANNCE: For routes and schedules call your bus company and get your "All Day Pass"
when you hop on board. That's a super deal.
FREE: Your bus.
MARK: All day, all over – a dollar fifty.
ANNCE: Catch one today.
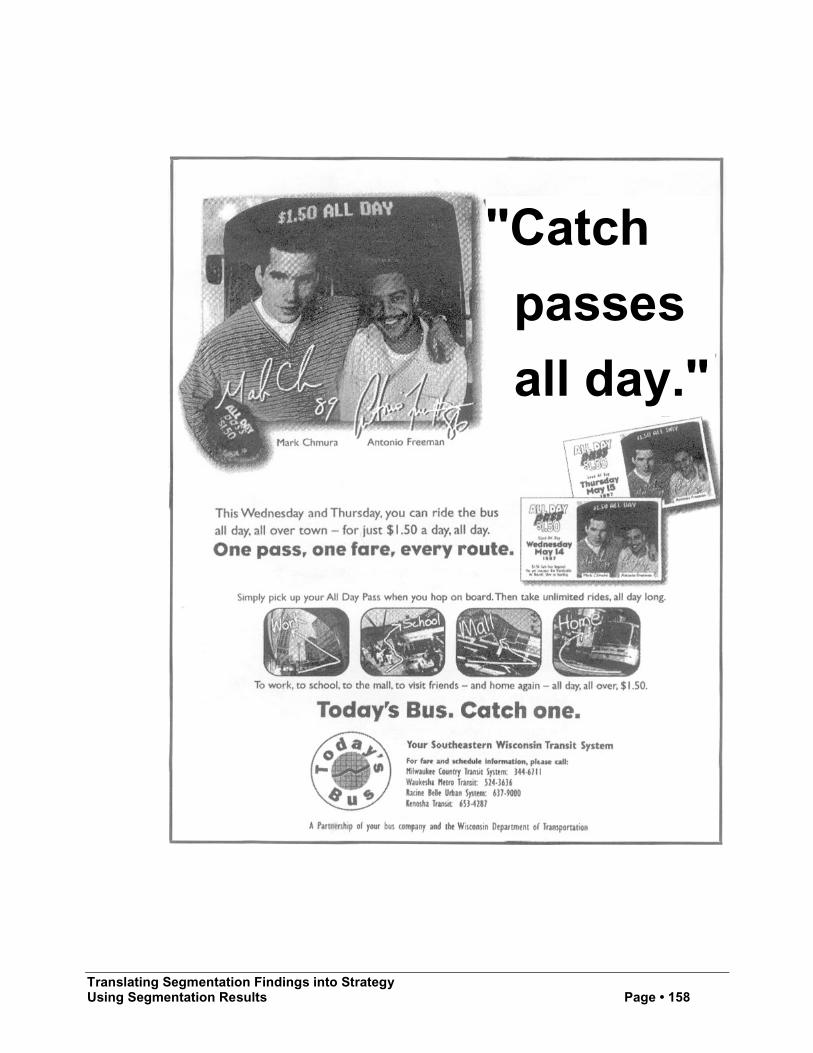
Translating Segmentation Findings into StrategyUsing Segmentation Results Page • 158
"Catch
passes
all day."
Translating Segmentation Findings into StrategyUsing Segmentation Results Page • 159
"Catch passes all day."
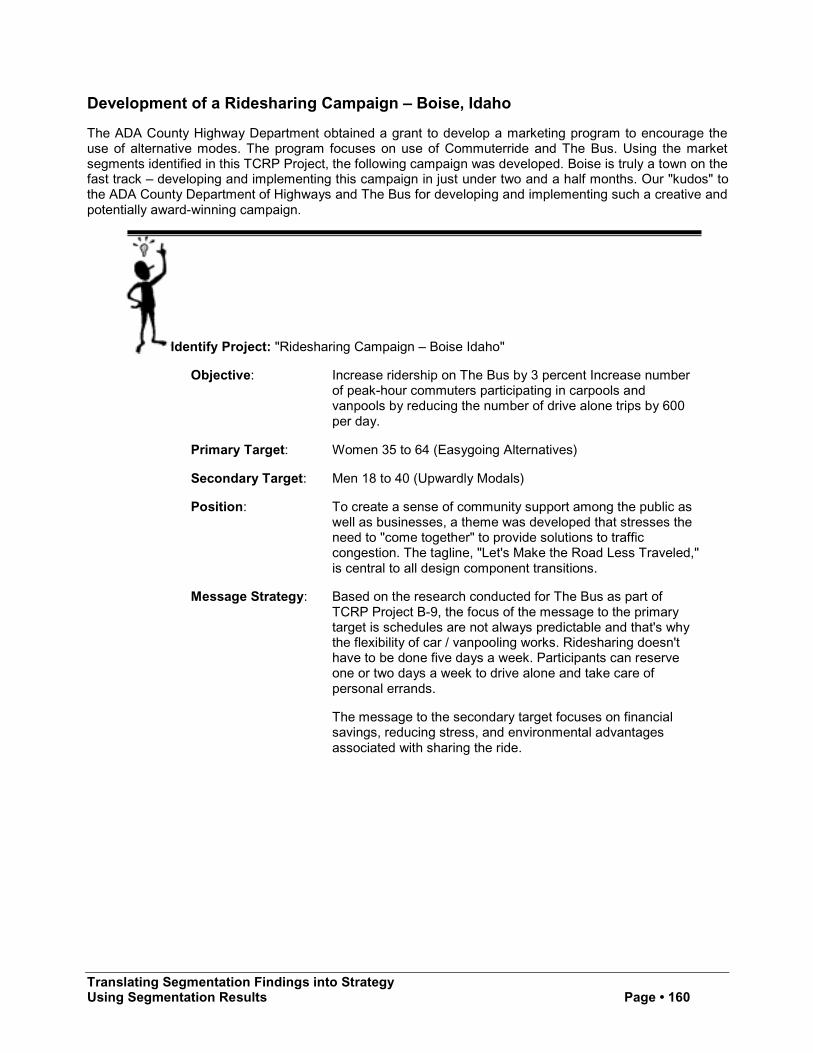
Translating Segmentation Findings into StrategyUsing Segmentation Results Page • 160
Development of a Ridesharing Campaign – Boise, Idaho
The ADA County Highway Department obtained a grant to develop a marketing program to encourage theuse of alternative modes. The program focuses on use of Commuterride and The Bus. Using the marketsegments identified in this TCRP Project, the following campaign was developed. Boise is truly a town on thefast track – developing and implementing this campaign in just under two and a half months. Our "kudos" tothe ADA County Department of Highways and The Bus for developing and implementing such a creative andpotentially award-winning campaign.
Identify Project: "Ridesharing Campaign – Boise Idaho"
Objective: Increase ridership on The Bus by 3 percent Increase numberof peak-hour commuters participating in carpools andvanpools by reducing the number of drive alone trips by 600per day.
Primary Target: Women 35 to 64 (Easygoing Alternatives)
Secondary Target: Men 18 to 40 (Upwardly Modals)
Position: To create a sense of community support among the public aswell as businesses, a theme was developed that stresses theneed to "come together" to provide solutions to trafficcongestion. The tagline, "Let's Make the Road Less Traveled,"is central to all design component transitions.
Message Strategy: Based on the research conducted for The Bus as part ofTCRP Project B-9, the focus of the message to the primarytarget is schedules are not always predictable and that's whythe flexibility of car / vanpooling works. Ridesharing doesn'thave to be done five days a week. Participants can reserveone or two days a week to drive alone and take care ofpersonal errands.
The message to the secondary target focuses on financialsavings, reducing stress, and environmental advantagesassociated with sharing the ride.
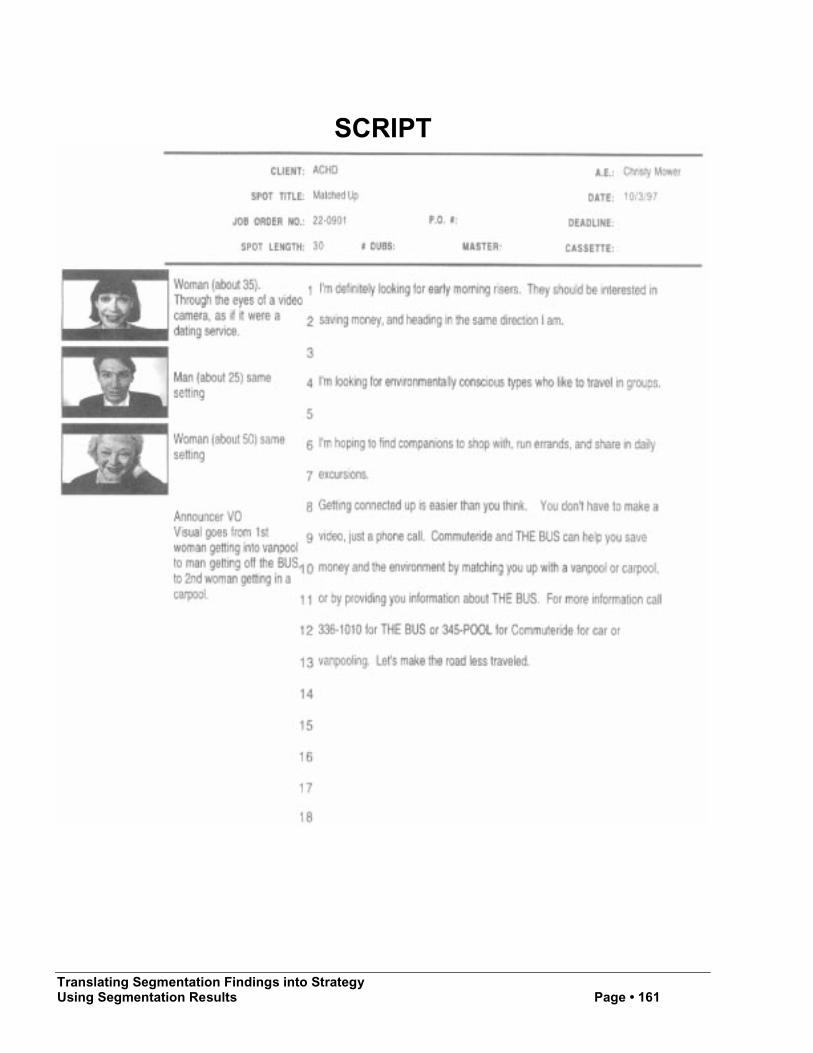
Translating Segmentation Findings into StrategyUsing Segmentation Results Page • 161
SCRIPT
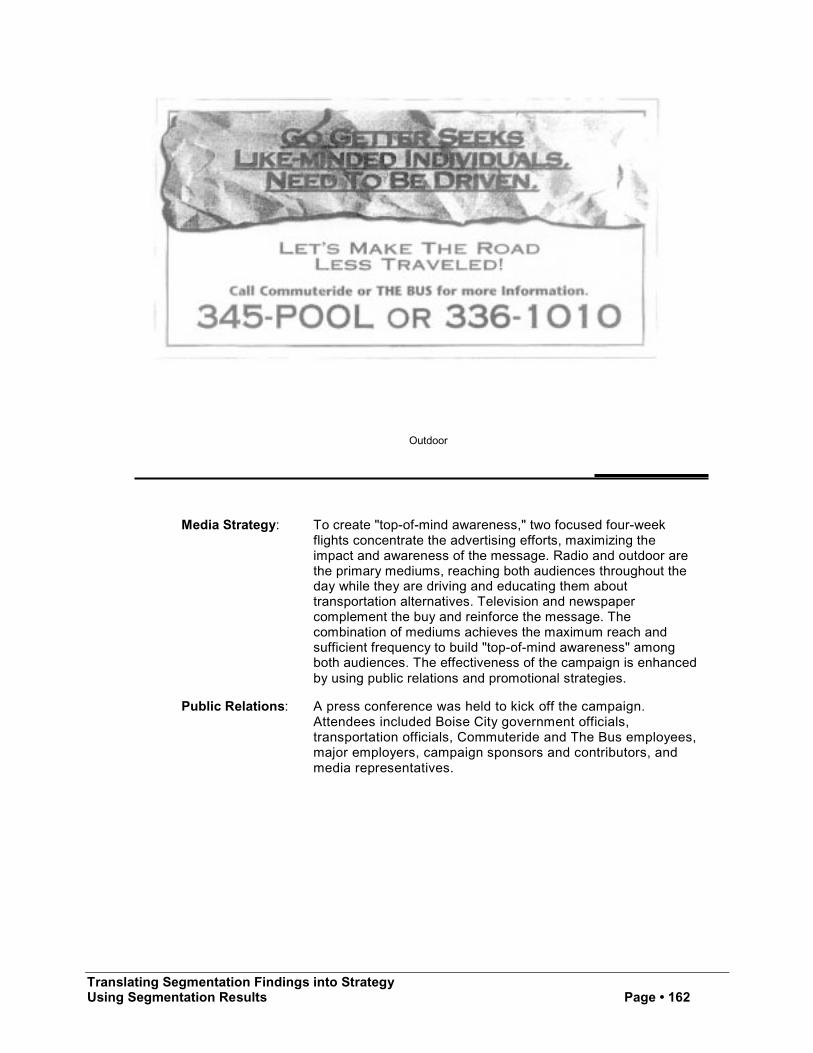
Translating Segmentation Findings into StrategyUsing Segmentation Results Page • 162
Outdoor
Media Strategy: To create "top-of-mind awareness," two focused four-weekflights concentrate the advertising efforts, maximizing theimpact and awareness of the message. Radio and outdoor arethe primary mediums, reaching both audiences throughout theday while they are driving and educating them abouttransportation alternatives. Television and newspapercomplement the buy and reinforce the message. Thecombination of mediums achieves the maximum reach andsufficient frequency to build "top-of-mind awareness" amongboth audiences. The effectiveness of the campaign is enhancedby using public relations and promotional strategies.
Public Relations: A press conference was held to kick off the campaign.Attendees included Boise City government officials,transportation officials, Commuteride and The Bus employees,major employers, campaign sponsors and contributors, andmedia representatives.
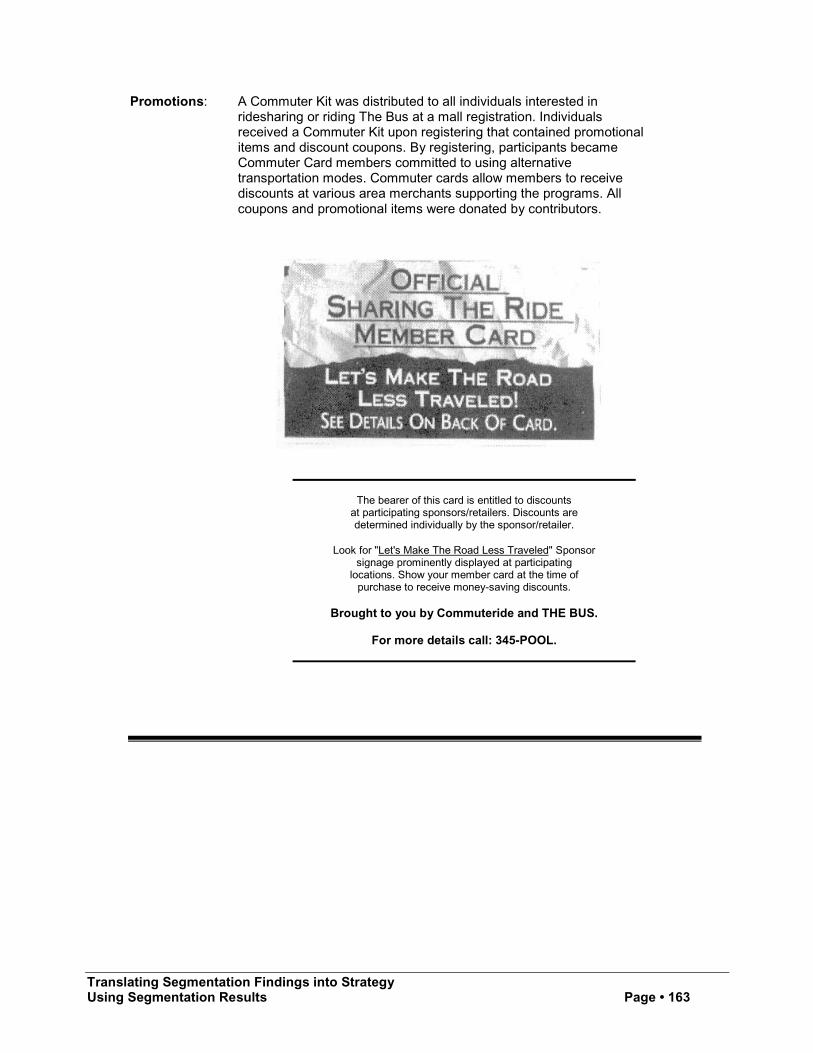
Translating Segmentation Findings into StrategyUsing Segmentation Results Page • 163
Promotions: A Commuter Kit was distributed to all individuals interested inridesharing or riding The Bus at a mall registration. Individualsreceived a Commuter Kit upon registering that contained promotionalitems and discount coupons. By registering, participants becameCommuter Card members committed to using alternativetransportation modes. Commuter cards allow members to receivediscounts at various area merchants supporting the programs. Allcoupons and promotional items were donated by contributors.
The bearer of this card is entitled to discountsat participating sponsors/retailers. Discounts aredetermined individually by the sponsor/retailer.
Look for "Let's Make The Road Less Traveled" Sponsorsignage prominently displayed at participating
locations. Show your member card at the time ofpurchase to receive money-saving discounts.
Brought to you by Commuteride and THE BUS.
For more details call: 345-POOL.
Translating Segmentation Findings into StrategyUsing Segmentation Results Page • 164
Summary
The results of a market segmentation study can be informative, insightful, and even fun. The real value ofsegmentation analysis lies in its ability to be translated into actionable strategies. A three-stage process issuggested.
1) Identify the project or decision. Consider projects or decisions your agency is presentlyconsidering and determine whether segmentation analysis is appropriate for that project ordecision. Some examples of projects for which segmentation analysis might be consideredinclude: new services, special promotions, pass or other fare media programs, advertising,special events, passenger information services, direct mail campaigns, guaranteed ride homeprograms, etc. Once the project or decision is identified, then ...
a) Determine the applicability of segmentation analysis to this project.
b) Create a project team.
2) Conduct a situation analysis. If it is determined that segmentation analysis is applicable to thisproject, the project team should first conduct a situation analysis. This step involves taking a stepback and examining why your agency is considering this project or undertaking this decision.The situation analysis represents an opportunity for your agency to break out of the box and tolook at the project or decision in different ways. Dare to be different! As part of your situationanalysis, you should ...
a) Identify opportunities.
b) Examine problems / threats.
c) Establish goals.
d) Evaluate current strategies.
3) Formulate strategies. If the situation analysis indicates that this project is worth pursuing, thenext step is to formulate the strategies to employ. If this is an existing project, this may involve arevision or complete overhaul of existing strategies. For new projects, you are operating from aclean slate. As noted in the situation analysis, be creative. Try looking at the results of yoursegmentation analysis in different ways. Brainstorm – don't reject ideas simply because youragency has never done it that way before. The bold new approach may be critical to attract thosecustomer segments that have been resistant but through segmentation analysis have indicatedthey can be reached – with just a little more effort. During this process you will ...
a) Identify target market segments.
b) Position the segments.
c) Specify the marketing mix.
Enhancing the Value of Market SegmentationSome Guidelines Page • 165
Chapter
5
Enhancing the Value of Market SegmentationSome Guidelines
Market segmentation can reward your agency with some or all of these riches.
! Increased ridership.
! Improved share of mode choice.
! New customers.
! Better customers.
! More satisfied customers.
! Potentially more 'profitable' marketing and service opportunities.
This process, however, takes considerable time and effort. To be successful, market segmentation requireswell-conceived and executed research. Strategies must be formulated on the research and then monitored todetermine their success.
Following are some final guidelines to assist and improve the value of your agency's market segmentationefforts. As with any good segmentation effort, we have targeted these guidelines to two audiences. However,we recommend that both audiences read and understand both sets of guidelines to better understand theoften-distinct roles played by each. The first set of guidelines is for those who will be involved in actuallyperforming segmentation analysis. These are helpful "how-to" pointers geared toward conductingsegmentation studies. The second set is targeted toward those who are likely to use the segmentationresults. They are more management-oriented and provide direction for segmentation's role in your agency'smarketing and service planning processes.
Guidelines for Researchers
Following are five valuable tips that should form the basis of your market segmentation study. Follow thesesteps and you will be on your way to a well-conceived segmentation study.
1) Plan, plan, plan. Then plan some more. Successful segmentation projects are based on planning.The planning process is and should be more complex than that involved in many research studies. Usethe many guidelines presented throughout this handbook to aid in your planning process.
2) Consult important references. Thorough research is the backbone of the segmentation project. Startwith free and low-cost secondary sources of information before launching into your primary research.Familiarize yourself with all of the other research that your agency has done. Consult with other agenciesto see what they have done in terms of market segmentation analysis. A good segmentation researcherroutinely follows changes in the marketplace, trends in consumer behavior, changes in the industry, the
Enhancing the Value of Market SegmentationSome Guidelines Page • 166
performance of the agency, and other related factors. The quest for market insight should be acontinuous process – not just a process used when the need for specific information arises.
3) Recognize the dynamics of the market. No two people are identical. People do not stay the same.Neither is your agency at a standstill. If you have completed a segmentation study in the past, do notrest on your laurels. Once you have completed your first segmentation analysis, don't consider yourwork done. Market segmentation analysis should be considered as part of each marketing study wherefeasible. Keeping abreast with changes in the marketplace and the impact of these changes on your keymarket segments will allow the marketer and service planner to recognize and respond quickly tochanging market conditions, to take advantage of unique opportunities, and to become a truly marketand customer-driven organization.
4) Use more than one basis for segmentation. To provide the most realistic profile of the market,several bases for segmentation should be considered and used. For example, one might use acombination of psychographic and product usage bases for segmentation. In addition, more than one ortwo variables within a chosen basis for segmentation must be used. An analysis of all potentially usefulvariables should be planned prior to beginning the analysis. Developing a model of consumer behaviorcan be particularly helpful in identifying the potential bases for segmentation.
5) Get down to basics. The segmentation study should be designed to provide information needed formarketing and planning decision-making. It may not be necessary to employ a complex approach tomarket segmentation emphasizing theoretical methods and multivariate analysis. Practicalsegmentation should be the goal. This stresses a systematic planning framework that uses quantitativeanalysis effectively and efficiently, involves management in the study, and provides findings that arereadily translatable into marketing strategy.
Guidelines for Managers
Segmentation represents one of the most valuable tools available for managers. Successful service plansand marketing strategies can be developed on this foundation. The following eight guidelines will assist youin managing and using market segmentation in your agency.
1) Integrate market segmentation with other management activities. Market segmentation is not anactivity that should be undertaken in isolation or a project completed by a researcher and "presented" tomanagement. Segmentation findings should be an integral part of your agency's service and marketingplans. For any decision your agency needs to make, consider whether market segmentation can beused effectively to make a better decision.
2) Get involved in the project. If you or your agency is conducting a segmentation study – no matter howlarge or small – get involved. Work closely with the researchers and other planners, analysts and/orconsultants on the study. This involvement will insure information that is practical. Moreover, itprecludes possible misunderstandings later. Frequent meetings and regular, two-way communicationbetween management and those implementing the project can lead to higher quality studies.
3) Be realistic in your expectations. Set reasonable goals. Like any research, segmentation analysis is not asubstitute for marketing or managerial deficiencies. Used properly, however, it can be a basis upon whichyour agency can become market- and customer-oriented. Don't expect immediate results. Some patiencemust be exercised in assessing the segmentation's value. As this handbook shows, segmentation researchcan often be used quickly to design more effective advertising. Changing products or services usingsegmentation analysis may take considerably more time. Moreover, it takes time for the results to be seen.The segmentation project may bridge several weeks or months – from the research and analysis to thestrategy implementation phase. Finally, other marketing elements greatly influence behavior, making
Enhancing the Value of Market SegmentationSome Guidelines Page • 167
the reconcilement of the study's findings and actual behavior more difficult. Hence, the need forcoordination of all service planning and marketing efforts is critical.
4) Listen to the results. Research is a critical tool for the "learning" organization. It represents theopportunity to understand the market in which your transit agency is operating. Some of the informationyou get from research will be new. Other findings will build on existing knowledge providing greaterinsight into your customers and their needs. The use of market segmentation analysis will give youragency the edge necessary to survive and prosper in these increasingly difficult times.
5) Dare to be different. Segmentation studies generally provide fresh perspectives and new information.However, the translation of these findings into strategy is not always clear. Try looking at the findings indifferent ways. If one doesn't work, ask your researcher to slice the market in another way. Brainstorm –don't reject ideas simply because your agency has never done it that way before. Sometimes, thismeans risk – be willing to take it. If necessary, take a trial run or a small step first – try it with somethingthat is low risk. The bold new approach may be critical to attract those customer segments that havebeen resistant but through segmentation analysis have indicated they can be reached – with just a littlemore effort.
6) Request frequent updates. The marketing environment is dynamic and constantly evolving. Do notthink of a market segmentation study as a one-time project. Stay current with market conditions; keepabreast of changing trends. Incorporate market segmentation analysis into as many decisions andprocesses as possible.
7) Get professional assistance when and where necessary. Segmentation analysis is often complexand requires specialized expertise and training. Consult with experts when necessary – to assist in theresearch design, obtain data, analyze the results, interpret the findings, or develop strategy. Consultantscan analyze situations objectively and are often more efficient for short-term projects than hiringadditional staff.
8) Treat segmentation as an investment. Recognize that market segmentation is a beginning – not anending point. The completed research study sets in motion a series of recommended activitiescontributing to a customer-centered plan. Better knowledge of your customers leads to better productsand services that meet customer needs, wants, and expectations. This will ultimately lead to increasedridership and greater public support for public transportation and the use of alternative modes.
Market segmentation will continue to gain prominence in the next few years as more and more agencies –large and small – discover the power of this strategic marketing tool for attracting and keeping riders, andacknowledge its importance to the service planning and marketing functions. Donna Murray, MarketResearch Analyst, Dept. of Public Service, WMATA, states...
Segmentation analysis is used for guidance for the advertising plan and concept development. The results are also usedin service initiatives such as premium parking at Metrorail stations, new suburban bus services, and fare simplification, aswell as our annual promotion for MetroPool / Metrochek employer-subsidized transit. We constantly strive to develop andrefine materials to meet the needs of our audiences.
How about you?
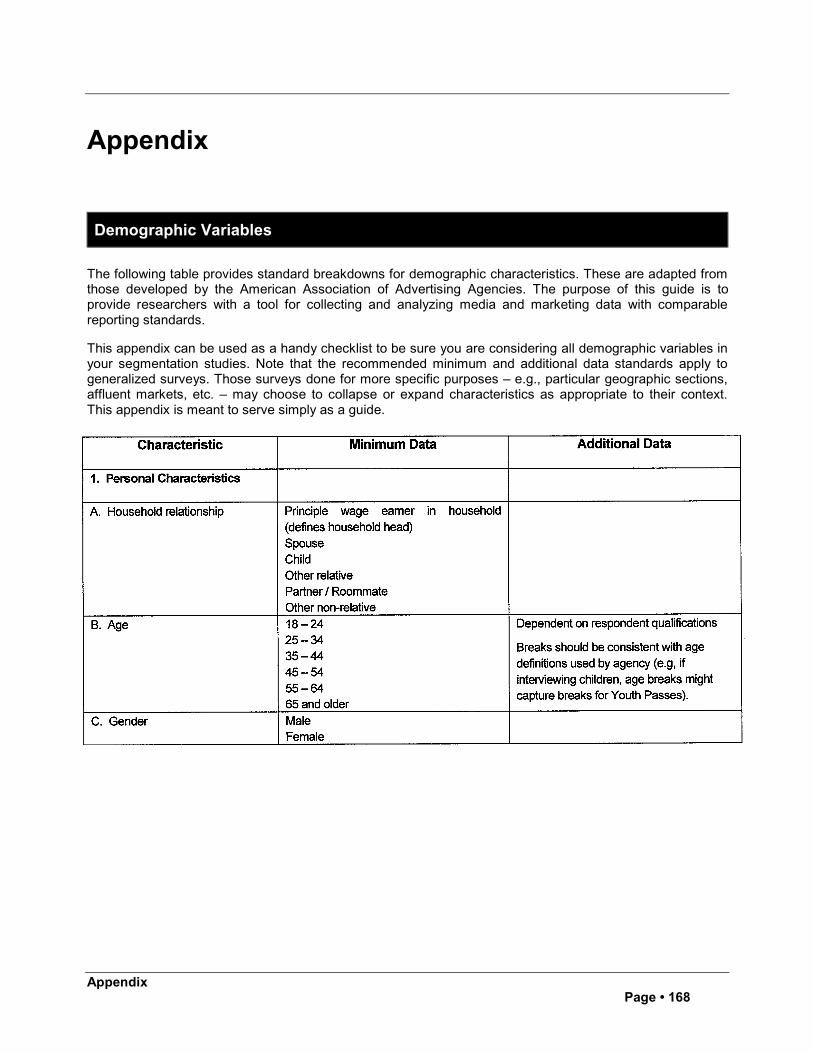
AppendixPage • 168
Appendix
Demographic Variables
The following table provides standard breakdowns for demographic characteristics. These are adapted fromthose developed by the American Association of Advertising Agencies. The purpose of this guide is toprovide researchers with a tool for collecting and analyzing media and marketing data with comparablereporting standards.
This appendix can be used as a handy checklist to be sure you are considering all demographic variables inyour segmentation studies. Note that the recommended minimum and additional data standards apply togeneralized surveys. Those surveys done for more specific purposes – e.g., particular geographic sections,affluent markets, etc. – may choose to collapse or expand characteristics as appropriate to their context.This appendix is meant to serve simply as a guide.
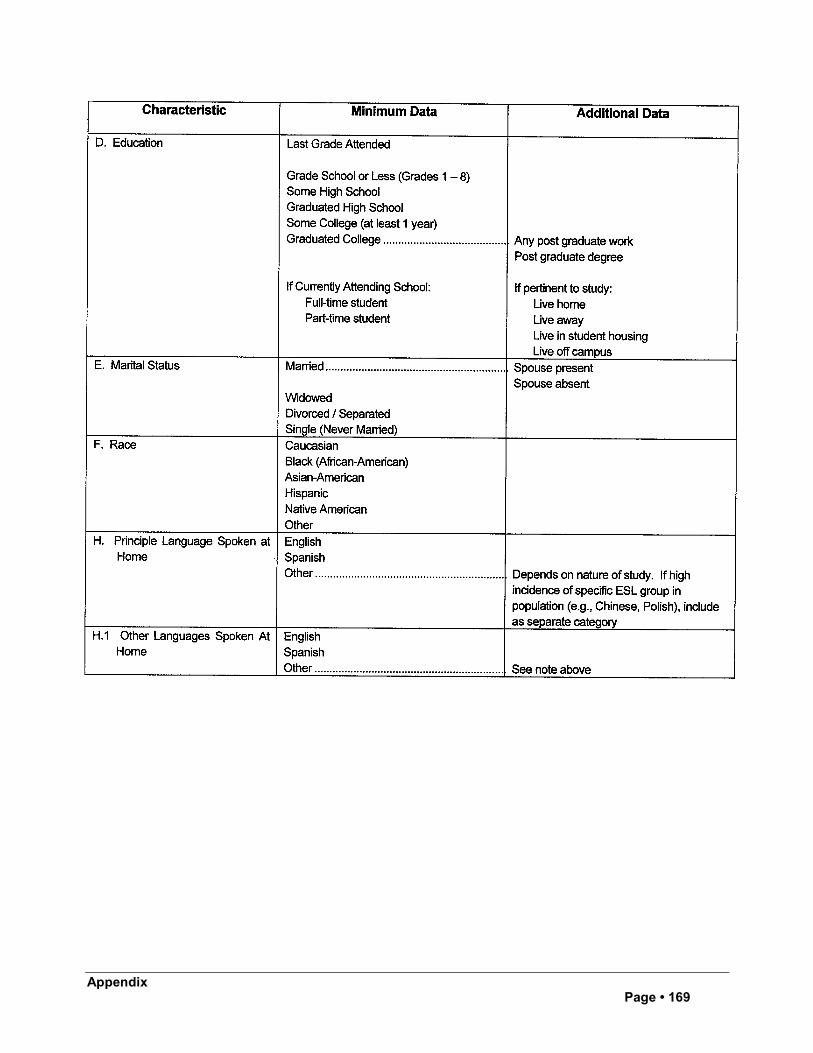
AppendixPage • 169
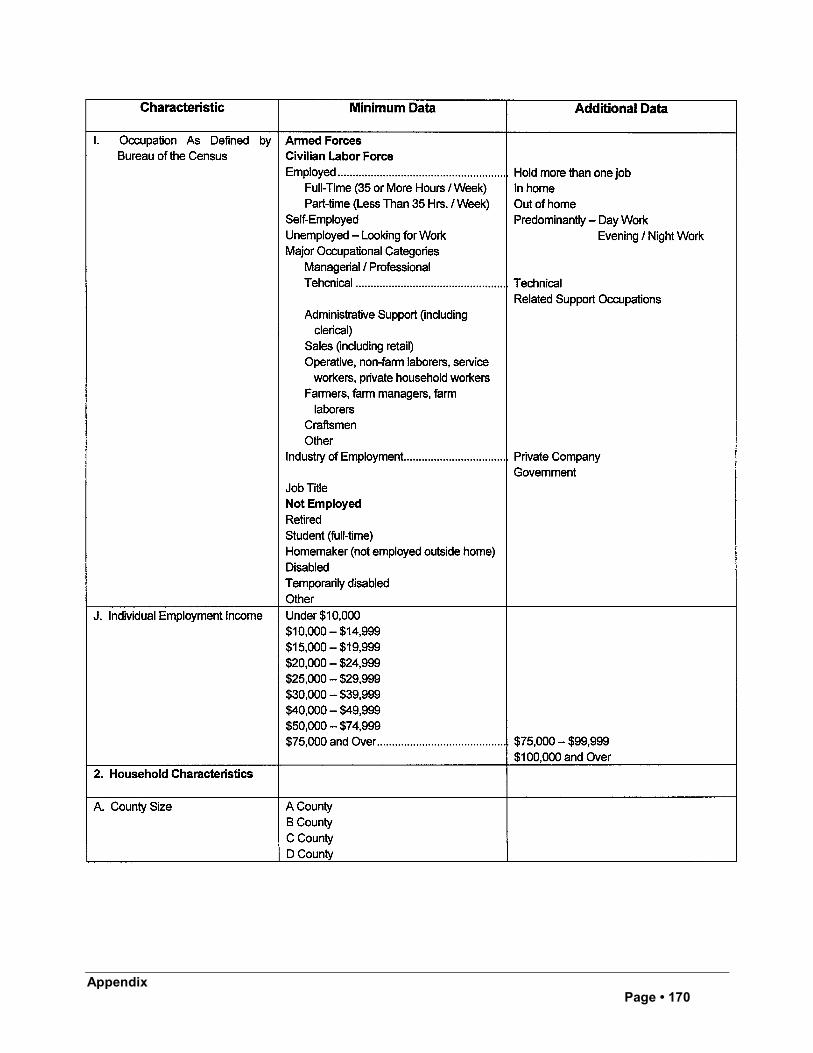
AppendixPage • 170
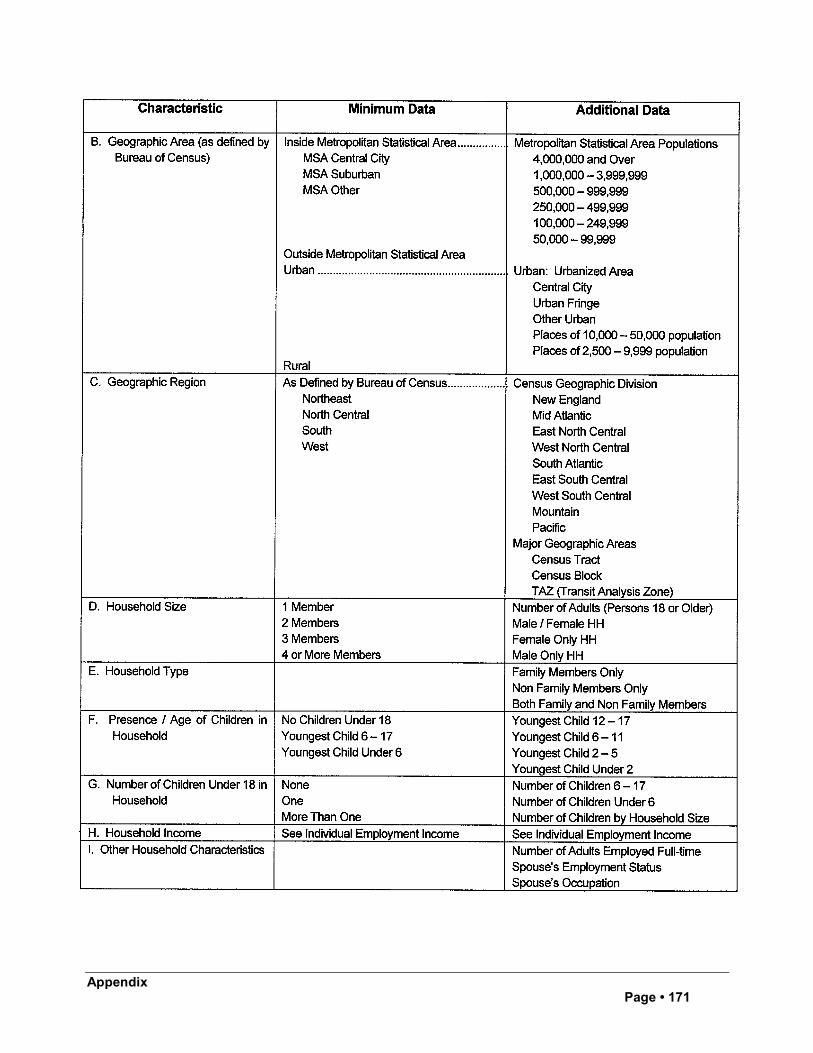
AppendixPage • 171
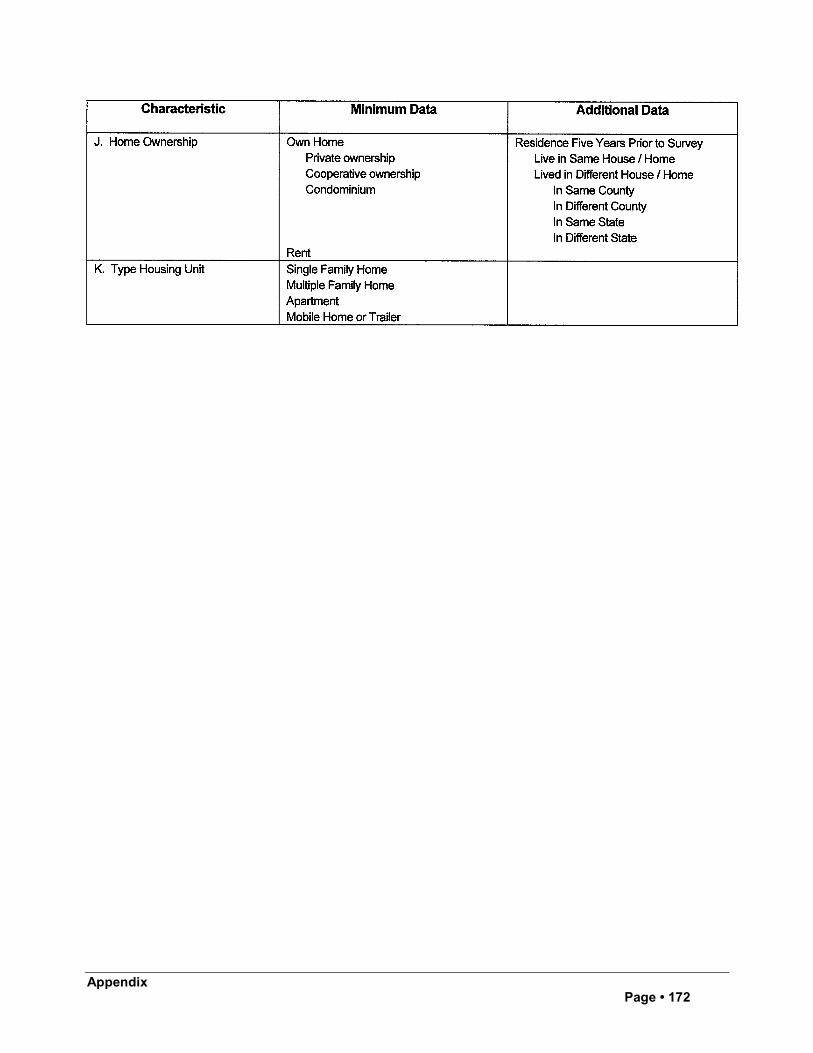
AppendixPage • 172
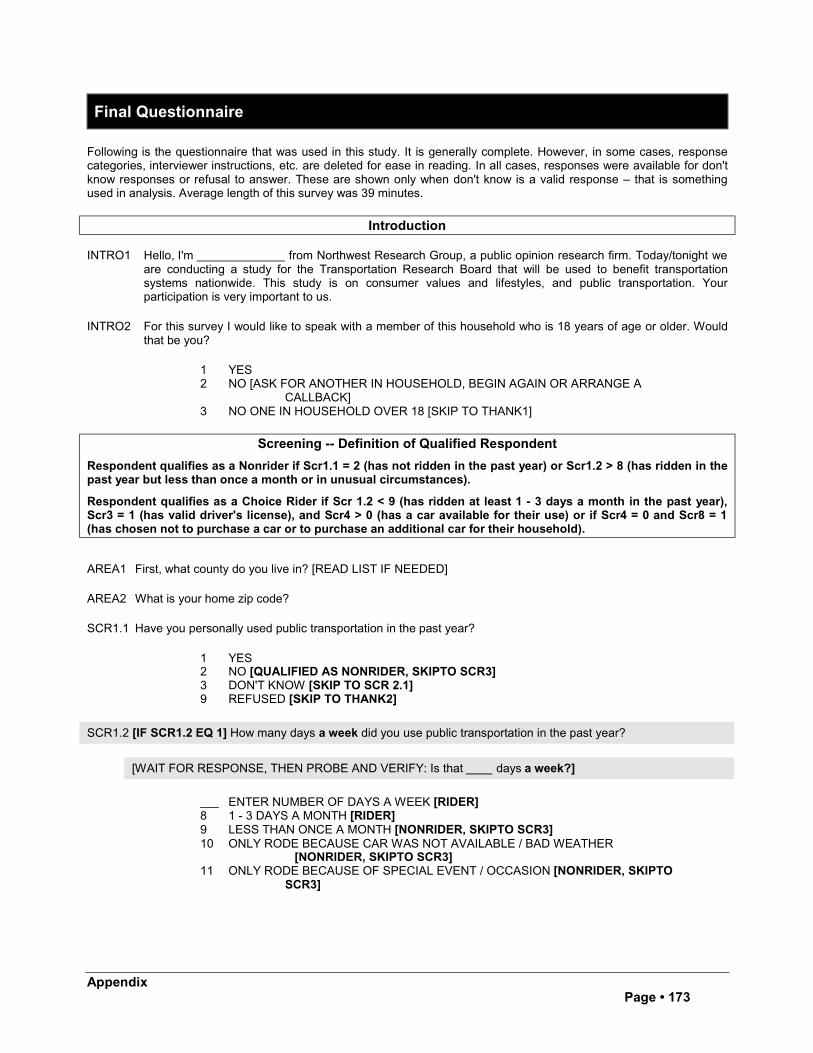
AppendixPage • 173
Final Questionnaire
Following is the questionnaire that was used in this study. It is generally complete. However, in some cases, responsecategories, interviewer instructions, etc. are deleted for ease in reading. In all cases, responses were available for don'tknow responses or refusal to answer. These are shown only when don't know is a valid response – that is somethingused in analysis. Average length of this survey was 39 minutes.
Introduction
INTRO1 Hello, I'm from Northwest Research Group, a public opinion research firm. Today/tonight weare conducting a study for the Transportation Research Board that will be used to benefit transportationsystems nationwide. This study is on consumer values and lifestyles, and public transportation. Yourparticipation is very important to us.
INTRO2 For this survey I would like to speak with a member of this household who is 18 years of age or older. Wouldthat be you?
1 YES2 NO [ASK FOR ANOTHER IN HOUSEHOLD, BEGIN AGAIN OR ARRANGE A
CALLBACK]3 NO ONE IN HOUSEHOLD OVER 18 [SKIP TO THANK1]
Screening -- Definition of Qualified Respondent
Respondent qualifies as a Nonrider if Scr1.1 = 2 (has not ridden in the past year) or Scr1.2 > 8 (has ridden in thepast year but less than once a month or in unusual circumstances).
Respondent qualifies as a Choice Rider if Scr 1.2 < 9 (has ridden at least 1 - 3 days a month in the past year),Scr3 = 1 (has valid driver's license), and Scr4 > 0 (has a car available for their use) or if Scr4 = 0 and Scr8 = 1(has chosen not to purchase a car or to purchase an additional car for their household).
AREA1 First, what county do you live in? [READ LIST IF NEEDED]
AREA2 What is your home zip code?
SCR1.1 Have you personally used public transportation in the past year?
1 YES2 NO [QUALIFIED AS NONRIDER, SKIPTO SCR3]3 DON'T KNOW [SKIP TO SCR 2.1]9 REFUSED [SKIP TO THANK2]
SCR1.2 [IF SCR1.2 EQ 1] How many days a week did you use public transportation in the past year?
[WAIT FOR RESPONSE, THEN PROBE AND VERIFY: Is that days a week?]
ENTER NUMBER OF DAYS A WEEK [RIDER]8 1 - 3 DAYS A MONTH [RIDER]9 LESS THAN ONCE A MONTH [NONRIDER, SKIPTO SCR3]10 ONLY RODE BECAUSE CAR WAS NOT AVAILABLE / BAD WEATHER
[NONRIDER, SKIPTO SCR3]11 ONLY RODE BECAUSE OF SPECIAL EVENT / OCCASION [NONRIDER, SKIPTO
SCR3]
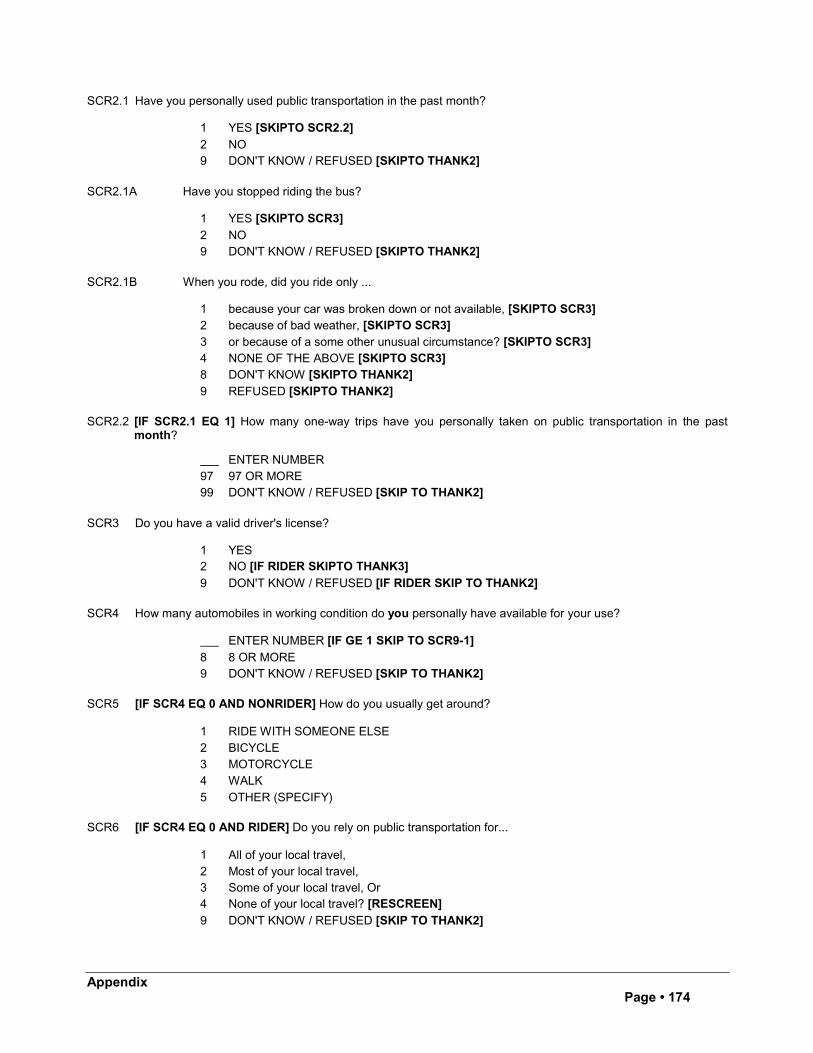
AppendixPage • 174
SCR2.1 Have you personally used public transportation in the past month?
1 YES [SKIPTO SCR2.2]
2 NO9 DON'T KNOW / REFUSED [SKIPTO THANK2]
SCR2.1A Have you stopped riding the bus?
1 YES [SKIPTO SCR3]
2 NO9 DON'T KNOW / REFUSED [SKIPTO THANK2]
SCR2.1B When you rode, did you ride only ...
1 because your car was broken down or not available, [SKIPTO SCR3]2 because of bad weather, [SKIPTO SCR3]3 or because of a some other unusual circumstance? [SKIPTO SCR3]4 NONE OF THE ABOVE [SKIPTO SCR3]8 DON'T KNOW [SKIPTO THANK2]9 REFUSED [SKIPTO THANK2]
SCR2.2 [IF SCR2.1 EQ 1] How many one-way trips have you personally taken on public transportation in the pastmonth?
ENTER NUMBER97 97 OR MORE99 DON'T KNOW / REFUSED [SKIP TO THANK2]
SCR3 Do you have a valid driver's license?
1 YES2 NO [IF RIDER SKIPTO THANK3]
9 DON'T KNOW / REFUSED [IF RIDER SKIP TO THANK2]
SCR4 How many automobiles in working condition do you personally have available for your use?
ENTER NUMBER [IF GE 1 SKIP TO SCR9-1]
8 8 OR MORE9 DON'T KNOW / REFUSED [SKIP TO THANK2]
SCR5 [IF SCR4 EQ 0 AND NONRIDER] How do you usually get around?
1 RIDE WITH SOMEONE ELSE2 BICYCLE3 MOTORCYCLE4 WALK
5 OTHER (SPECIFY)
SCR6 [IF SCR4 EQ 0 AND RIDER] Do you rely on public transportation for...
1 All of your local travel,2 Most of your local travel,3 Some of your local travel, Or4 None of your local travel? [RESCREEN]
9 DON'T KNOW / REFUSED [SKIP TO THANK2]
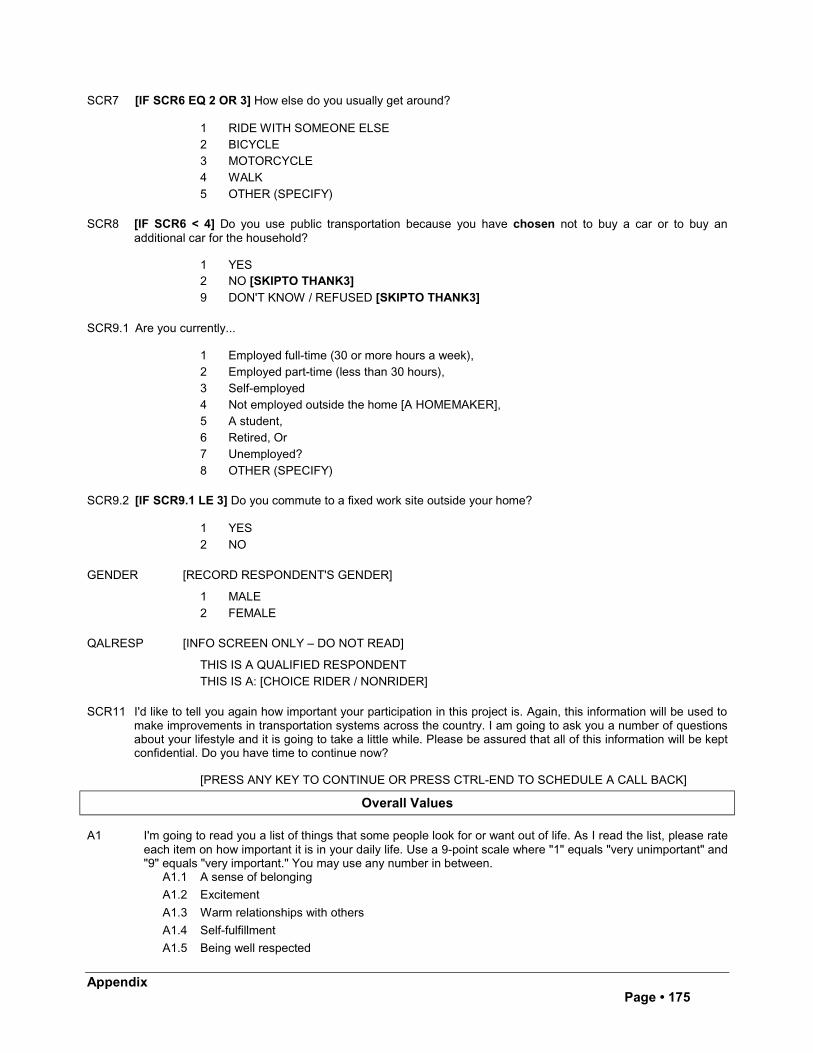
AppendixPage • 175
SCR7 [IF SCR6 EQ 2 OR 3] How else do you usually get around?
1 RIDE WITH SOMEONE ELSE2 BICYCLE3 MOTORCYCLE4 WALK
5 OTHER (SPECIFY)
SCR8 [IF SCR6 < 4] Do you use public transportation because you have chosen not to buy a car or to buy anadditional car for the household?
1 YES2 NO [SKIPTO THANK3]9 DON'T KNOW / REFUSED [SKIPTO THANK3]
SCR9.1 Are you currently...
1 Employed full-time (30 or more hours a week),2 Employed part-time (less than 30 hours),3 Self-employed4 Not employed outside the home [A HOMEMAKER],5 A student,6 Retired, Or7 Unemployed?
8 OTHER (SPECIFY)
SCR9.2 [IF SCR9.1 LE 3] Do you commute to a fixed work site outside your home?
1 YES
2 NO
GENDER [RECORD RESPONDENT'S GENDER]
1 MALE
2 FEMALE
QALRESP [INFO SCREEN ONLY – DO NOT READ]
THIS IS A QUALIFIED RESPONDENT
THIS IS A: [CHOICE RIDER / NONRIDER]
SCR11 I'd like to tell you again how important your participation in this project is. Again, this information will be used tomake improvements in transportation systems across the country. I am going to ask you a number of questionsabout your lifestyle and it is going to take a little while. Please be assured that all of this information will be keptconfidential. Do you have time to continue now?
[PRESS ANY KEY TO CONTINUE OR PRESS CTRL-END TO SCHEDULE A CALL BACK]
Overall Values
A1 I'm going to read you a list of things that some people look for or want out of life. As I read the list, please rateeach item on how important it is in your daily life. Use a 9-point scale where "1" equals "very unimportant" and"9" equals "very important." You may use any number in between.
A1.1 A sense of belonging
A1.2 Excitement
A1.3 Warm relationships with others
A1.4 Self-fulfillment
A1.5 Being well respected
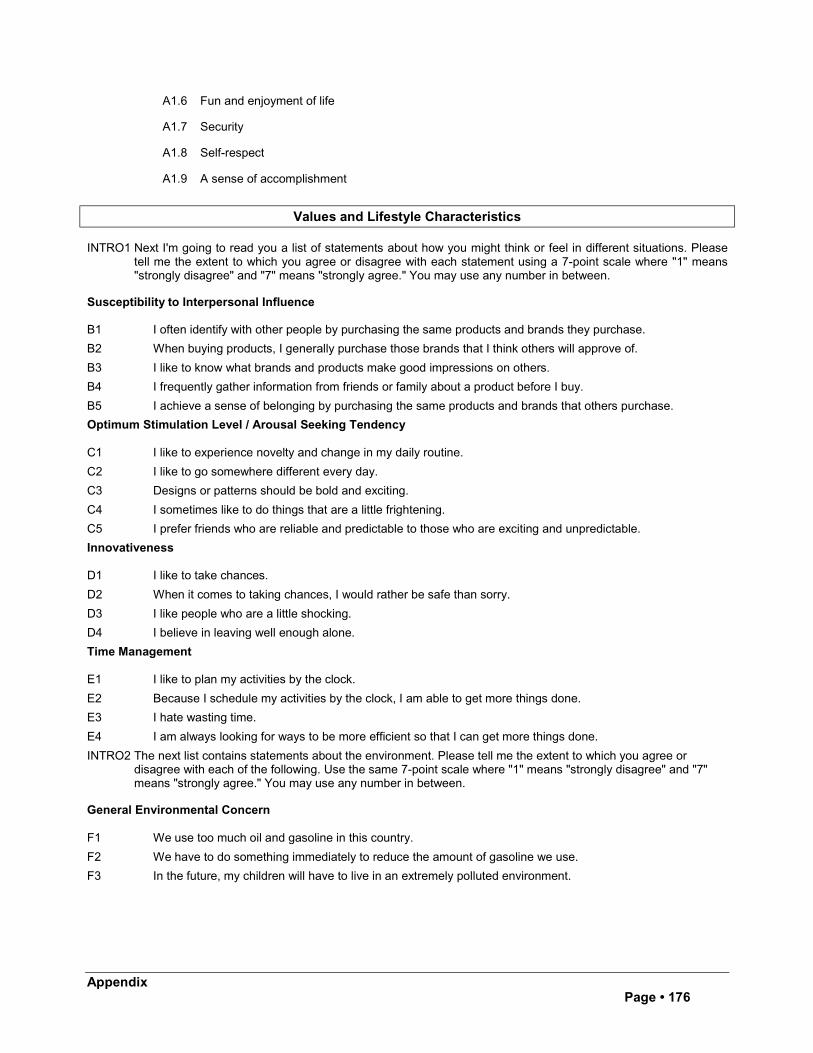
AppendixPage • 176
A1.6 Fun and enjoyment of life
A1.7 Security
A1.8 Self-respect
A1.9 A sense of accomplishment
Values and Lifestyle Characteristics
INTRO1 Next I'm going to read you a list of statements about how you might think or feel in different situations. Pleasetell me the extent to which you agree or disagree with each statement using a 7-point scale where "1" means"strongly disagree" and "7" means "strongly agree." You may use any number in between.
Susceptibility to Interpersonal Influence
B1 I often identify with other people by purchasing the same products and brands they purchase.
B2 When buying products, I generally purchase those brands that I think others will approve of.
B3 I like to know what brands and products make good impressions on others.
B4 I frequently gather information from friends or family about a product before I buy.
B5 I achieve a sense of belonging by purchasing the same products and brands that others purchase.
Optimum Stimulation Level / Arousal Seeking Tendency
C1 I like to experience novelty and change in my daily routine.
C2 I like to go somewhere different every day.
C3 Designs or patterns should be bold and exciting.
C4 I sometimes like to do things that are a little frightening.
C5 I prefer friends who are reliable and predictable to those who are exciting and unpredictable.
Innovativeness
D1 I like to take chances.
D2 When it comes to taking chances, I would rather be safe than sorry.
D3 I like people who are a little shocking.
D4 I believe in leaving well enough alone.
Time Management
E1 I like to plan my activities by the clock.
E2 Because I schedule my activities by the clock, I am able to get more things done.
E3 I hate wasting time.
E4 I am always looking for ways to be more efficient so that I can get more things done.
INTRO2 The next list contains statements about the environment. Please tell me the extent to which you agree ordisagree with each of the following. Use the same 7-point scale where "1" means "strongly disagree" and "7"means "strongly agree." You may use any number in between.
General Environmental Concern
F1 We use too much oil and gasoline in this country.
F2 We have to do something immediately to reduce the amount of gasoline we use.
F3 In the future, my children will have to live in an extremely polluted environment.
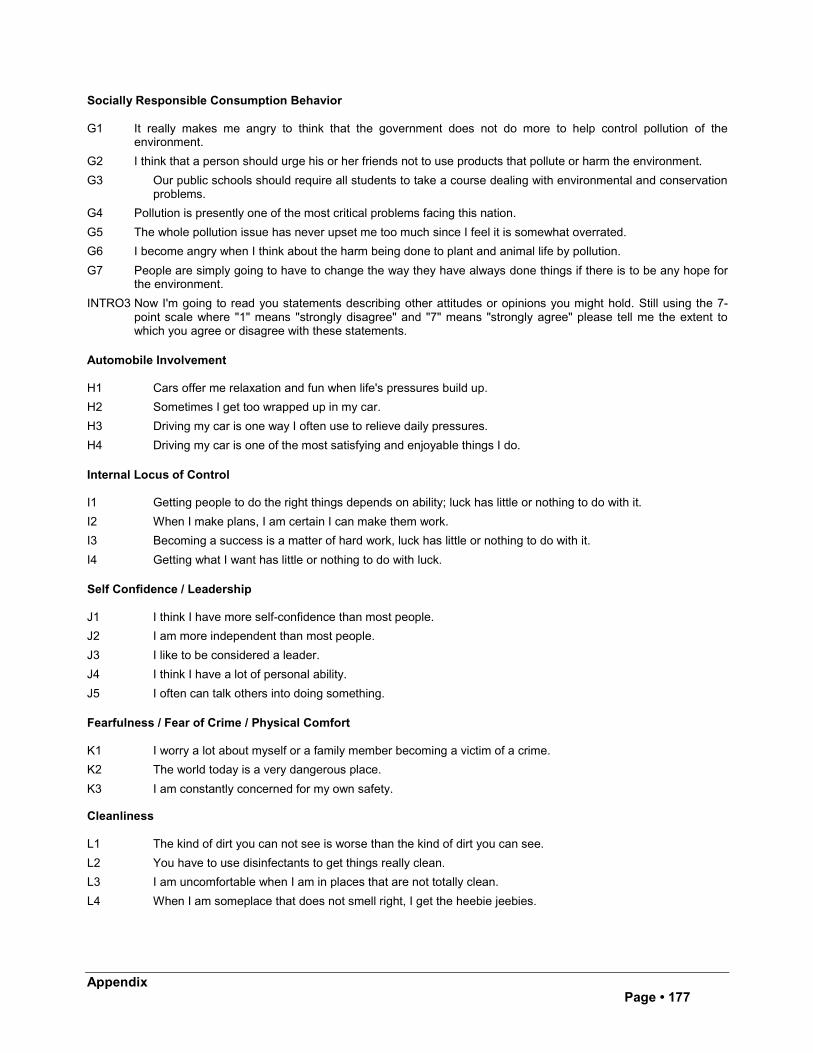
AppendixPage • 177
Socially Responsible Consumption Behavior
G1 It really makes me angry to think that the government does not do more to help control pollution of theenvironment.
G2 I think that a person should urge his or her friends not to use products that pollute or harm the environment.
G3 Our public schools should require all students to take a course dealing with environmental and conservationproblems.
G4 Pollution is presently one of the most critical problems facing this nation.
G5 The whole pollution issue has never upset me too much since I feel it is somewhat overrated.
G6 I become angry when I think about the harm being done to plant and animal life by pollution.
G7 People are simply going to have to change the way they have always done things if there is to be any hope forthe environment.
INTRO3 Now I'm going to read you statements describing other attitudes or opinions you might hold. Still using the 7-point scale where "1" means "strongly disagree" and "7" means "strongly agree" please tell me the extent towhich you agree or disagree with these statements.
Automobile Involvement
H1 Cars offer me relaxation and fun when life's pressures build up.
H2 Sometimes I get too wrapped up in my car.
H3 Driving my car is one way I often use to relieve daily pressures.
H4 Driving my car is one of the most satisfying and enjoyable things I do.
Internal Locus of Control
I1 Getting people to do the right things depends on ability; luck has little or nothing to do with it.
I2 When I make plans, I am certain I can make them work.
I3 Becoming a success is a matter of hard work, luck has little or nothing to do with it.
I4 Getting what I want has little or nothing to do with luck.
Self Confidence / Leadership
J1 I think I have more self-confidence than most people.
J2 I am more independent than most people.
J3 I like to be considered a leader.
J4 I think I have a lot of personal ability.
J5 I often can talk others into doing something.
Fearfulness / Fear of Crime / Physical Comfort
K1 I worry a lot about myself or a family member becoming a victim of a crime.
K2 The world today is a very dangerous place.
K3 I am constantly concerned for my own safety.
Cleanliness
L1 The kind of dirt you can not see is worse than the kind of dirt you can see.
L2 You have to use disinfectants to get things really clean.
L3 I am uncomfortable when I am in places that are not totally clean.
L4 When I am someplace that does not smell right, I get the heebie jeebies.
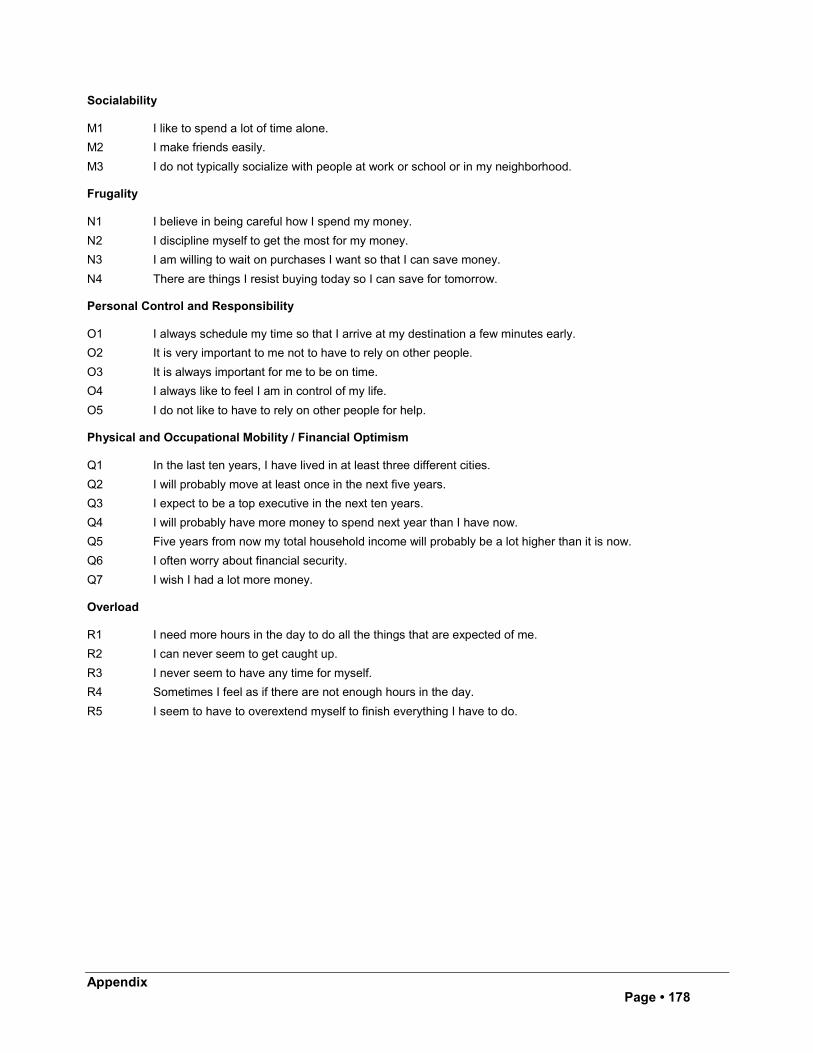
AppendixPage • 178
Socialability
M1 I like to spend a lot of time alone.
M2 I make friends easily.
M3 I do not typically socialize with people at work or school or in my neighborhood.
Frugality
N1 I believe in being careful how I spend my money.
N2 I discipline myself to get the most for my money.
N3 I am willing to wait on purchases I want so that I can save money.
N4 There are things I resist buying today so I can save for tomorrow.
Personal Control and Responsibility
O1 I always schedule my time so that I arrive at my destination a few minutes early.
O2 It is very important to me not to have to rely on other people.
O3 It is always important for me to be on time.
O4 I always like to feel I am in control of my life.
O5 I do not like to have to rely on other people for help.
Physical and Occupational Mobility / Financial Optimism
Q1 In the last ten years, I have lived in at least three different cities.
Q2 I will probably move at least once in the next five years.
Q3 I expect to be a top executive in the next ten years.
Q4 I will probably have more money to spend next year than I have now.
Q5 Five years from now my total household income will probably be a lot higher than it is now.
Q6 I often worry about financial security.
Q7 I wish I had a lot more money.
Overload
R1 I need more hours in the day to do all the things that are expected of me.
R2 I can never seem to get caught up.
R3 I never seem to have any time for myself.
R4 Sometimes I feel as if there are not enough hours in the day.
R5 I seem to have to overextend myself to finish everything I have to do.
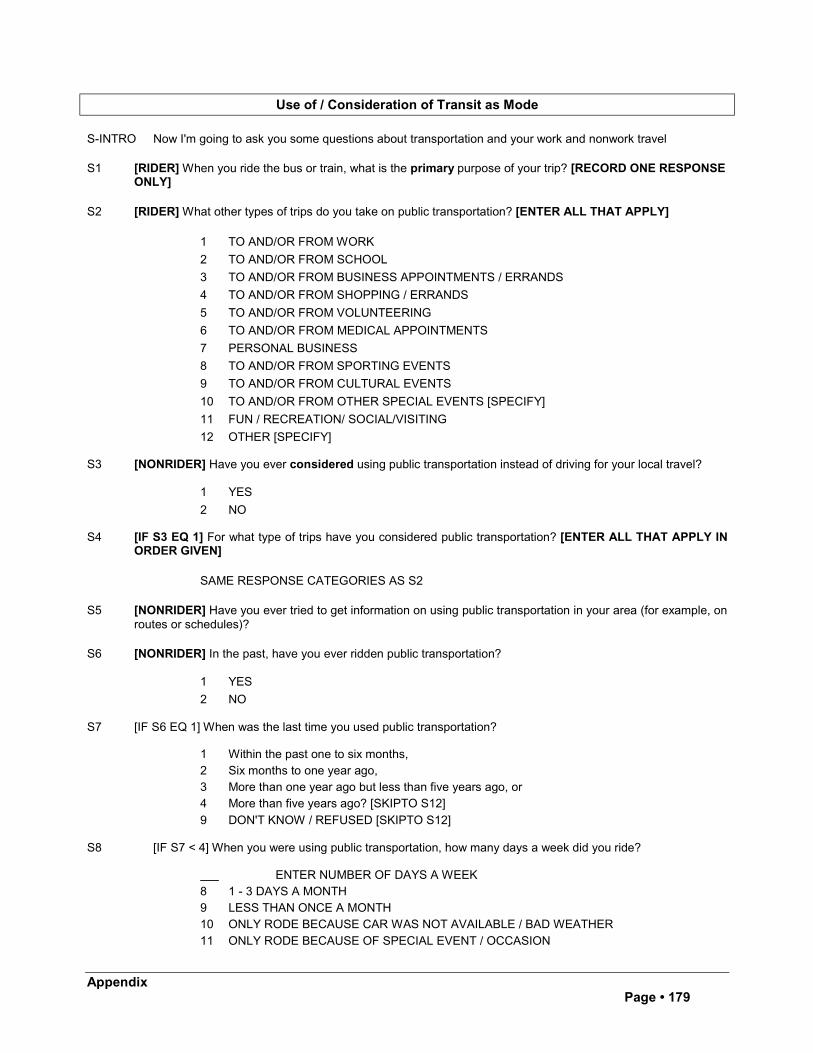
AppendixPage • 179
Use of / Consideration of Transit as Mode
S-INTRO Now I'm going to ask you some questions about transportation and your work and nonwork travel
S1 [RIDER] When you ride the bus or train, what is the primary purpose of your trip? [RECORD ONE RESPONSEONLY]
S2 [RIDER] What other types of trips do you take on public transportation? [ENTER ALL THAT APPLY]
1 TO AND/OR FROM WORK
2 TO AND/OR FROM SCHOOL
3 TO AND/OR FROM BUSINESS APPOINTMENTS / ERRANDS
4 TO AND/OR FROM SHOPPING / ERRANDS
5 TO AND/OR FROM VOLUNTEERING
6 TO AND/OR FROM MEDICAL APPOINTMENTS
7 PERSONAL BUSINESS
8 TO AND/OR FROM SPORTING EVENTS
9 TO AND/OR FROM CULTURAL EVENTS
10 TO AND/OR FROM OTHER SPECIAL EVENTS [SPECIFY]
11 FUN / RECREATION/ SOCIAL/VISITING
12 OTHER [SPECIFY]
S3 [NONRIDER] Have you ever considered using public transportation instead of driving for your local travel?
1 YES
2 NO
S4 [IF S3 EQ 1] For what type of trips have you considered public transportation? [ENTER ALL THAT APPLY INORDER GIVEN]
SAME RESPONSE CATEGORIES AS S2
S5 [NONRIDER] Have you ever tried to get information on using public transportation in your area (for example, onroutes or schedules)?
S6 [NONRIDER] In the past, have you ever ridden public transportation?
1 YES
2 NO
S7 [IF S6 EQ 1] When was the last time you used public transportation?
1 Within the past one to six months,2 Six months to one year ago,3 More than one year ago but less than five years ago, or4 More than five years ago? [SKIPTO S12]
9 DON'T KNOW / REFUSED [SKIPTO S12]
S8 [IF S7 < 4] When you were using public transportation, how many days a week did you ride?
ENTER NUMBER OF DAYS A WEEK8 1 - 3 DAYS A MONTH9 LESS THAN ONCE A MONTH10 ONLY RODE BECAUSE CAR WAS NOT AVAILABLE / BAD WEATHER
11 ONLY RODE BECAUSE OF SPECIAL EVENT / OCCASION
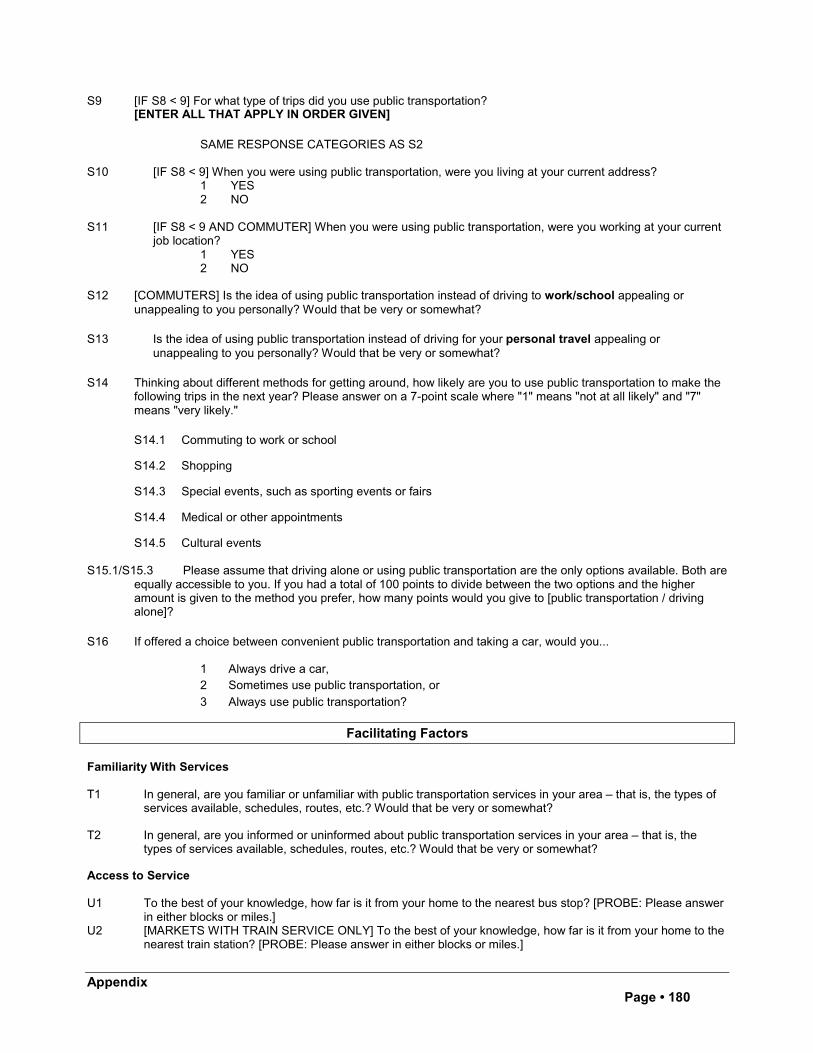
AppendixPage • 180
S9 [IF S8 < 9] For what type of trips did you use public transportation?[ENTER ALL THAT APPLY IN ORDER GIVEN]
SAME RESPONSE CATEGORIES AS S2
S10 [IF S8 < 9] When you were using public transportation, were you living at your current address?1 YES2 NO
S11 [IF S8 < 9 AND COMMUTER] When you were using public transportation, were you working at your currentjob location?
1 YES2 NO
S12 [COMMUTERS] Is the idea of using public transportation instead of driving to work/school appealing orunappealing to you personally? Would that be very or somewhat?
S13 Is the idea of using public transportation instead of driving for your personal travel appealing orunappealing to you personally? Would that be very or somewhat?
S14 Thinking about different methods for getting around, how likely are you to use public transportation to make thefollowing trips in the next year? Please answer on a 7-point scale where "1" means "not at all likely" and "7"means "very likely."
S14.1 Commuting to work or school
S14.2 Shopping
S14.3 Special events, such as sporting events or fairs
S14.4 Medical or other appointments
S14.5 Cultural events
S15.1/S15.3 Please assume that driving alone or using public transportation are the only options available. Both areequally accessible to you. If you had a total of 100 points to divide between the two options and the higheramount is given to the method you prefer, how many points would you give to [public transportation / drivingalone]?
S16 If offered a choice between convenient public transportation and taking a car, would you...
1 Always drive a car,2 Sometimes use public transportation, or
3 Always use public transportation?
Facilitating Factors
Familiarity With Services
T1 In general, are you familiar or unfamiliar with public transportation services in your area – that is, the types ofservices available, schedules, routes, etc.? Would that be very or somewhat?
T2 In general, are you informed or uninformed about public transportation services in your area – that is, thetypes of services available, schedules, routes, etc.? Would that be very or somewhat?
Access to Service
U1 To the best of your knowledge, how far is it from your home to the nearest bus stop? [PROBE: Please answerin either blocks or miles.]
U2 [MARKETS WITH TRAIN SERVICE ONLY] To the best of your knowledge, how far is it from your home to thenearest train station? [PROBE: Please answer in either blocks or miles.]
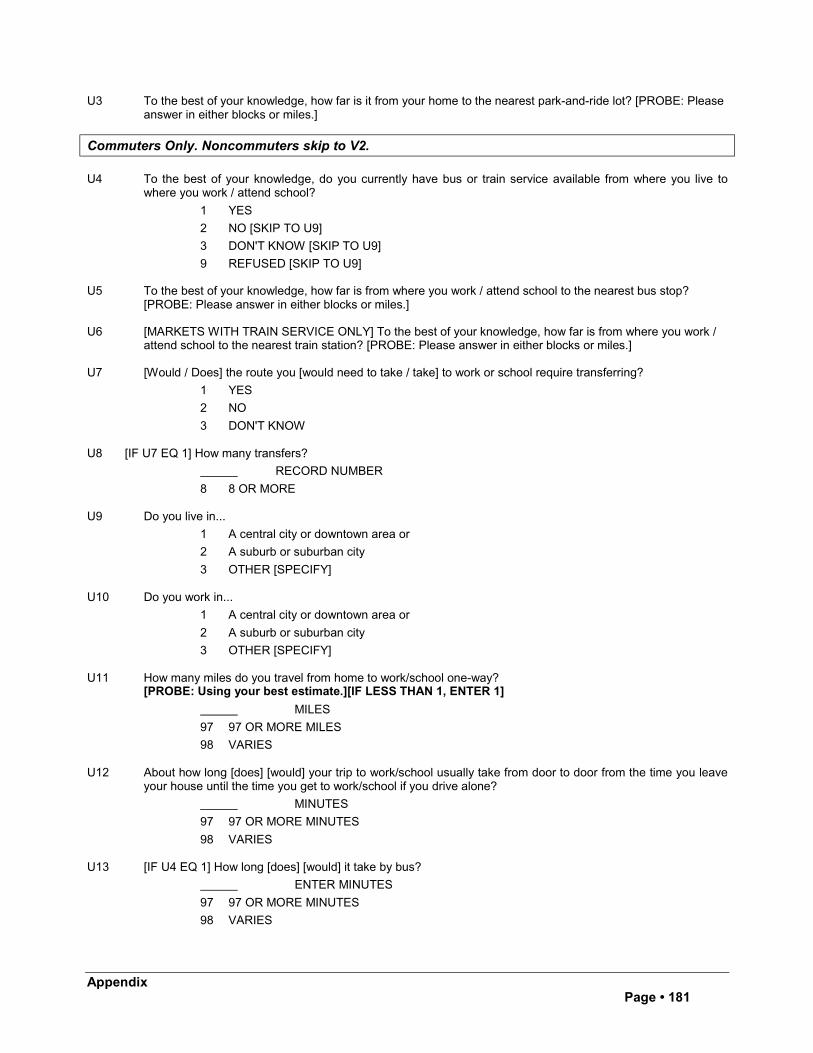
AppendixPage • 181
U3 To the best of your knowledge, how far is it from your home to the nearest park-and-ride lot? [PROBE: Pleaseanswer in either blocks or miles.]
Commuters Only. Noncommuters skip to V2.
U4 To the best of your knowledge, do you currently have bus or train service available from where you live towhere you work / attend school?
1 YES
2 NO [SKIP TO U9]
3 DON'T KNOW [SKIP TO U9]
9 REFUSED [SKIP TO U9]
U5 To the best of your knowledge, how far is from where you work / attend school to the nearest bus stop?[PROBE: Please answer in either blocks or miles.]
U6 [MARKETS WITH TRAIN SERVICE ONLY] To the best of your knowledge, how far is from where you work /attend school to the nearest train station? [PROBE: Please answer in either blocks or miles.]
U7 [Would / Does] the route you [would need to take / take] to work or school require transferring?
1 YES
2 NO
3 DON'T KNOW
U8 [IF U7 EQ 1] How many transfers?
RECORD NUMBER
8 8 OR MORE
U9 Do you live in...
1 A central city or downtown area or
2 A suburb or suburban city
3 OTHER [SPECIFY]
U10 Do you work in...
1 A central city or downtown area or
2 A suburb or suburban city
3 OTHER [SPECIFY]
U11 How many miles do you travel from home to work/school one-way?[PROBE: Using your best estimate.][IF LESS THAN 1, ENTER 1]
MILES
97 97 OR MORE MILES
98 VARIES
U12 About how long [does] [would] your trip to work/school usually take from door to door from the time you leaveyour house until the time you get to work/school if you drive alone?
MINUTES
97 97 OR MORE MINUTES
98 VARIES
U13 [IF U4 EQ 1] How long [does] [would] it take by bus?
ENTER MINUTES
97 97 OR MORE MINUTES
98 VARIES
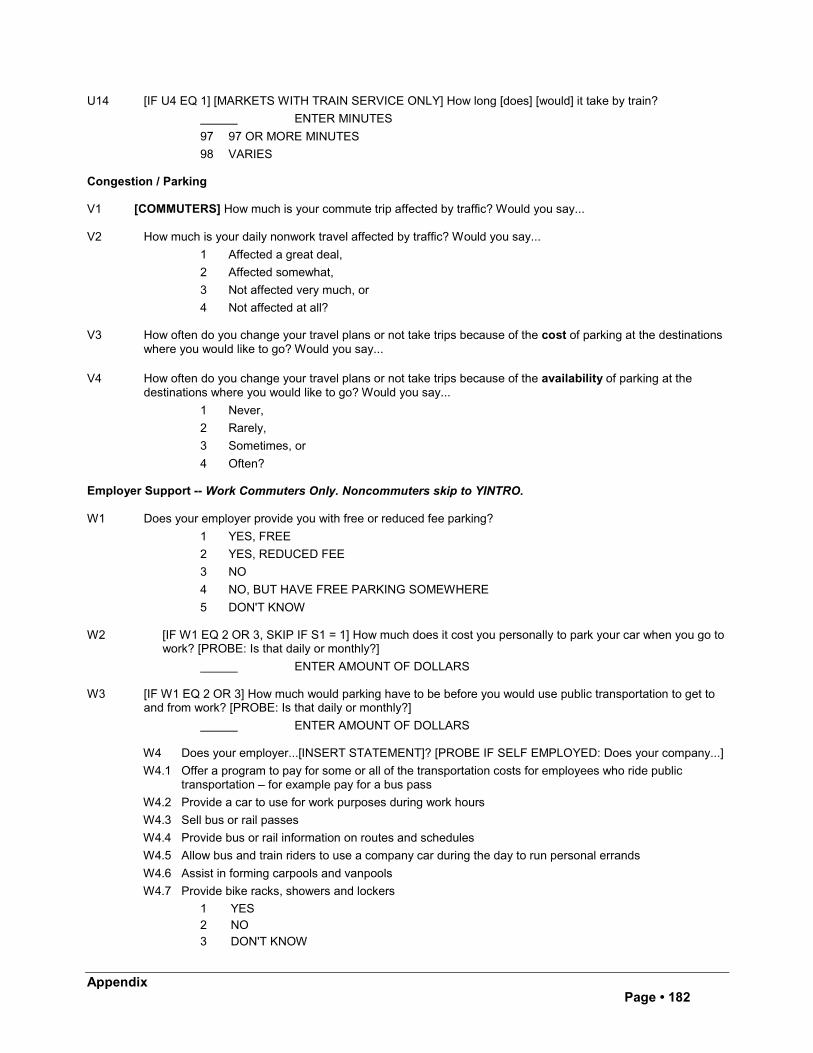
AppendixPage • 182
U14 [IF U4 EQ 1] [MARKETS WITH TRAIN SERVICE ONLY] How long [does] [would] it take by train?
ENTER MINUTES
97 97 OR MORE MINUTES
98 VARIES
Congestion / Parking
V1 [COMMUTERS] How much is your commute trip affected by traffic? Would you say...
V2 How much is your daily nonwork travel affected by traffic? Would you say...
1 Affected a great deal,
2 Affected somewhat,
3 Not affected very much, or
4 Not affected at all?
V3 How often do you change your travel plans or not take trips because of the cost of parking at the destinationswhere you would like to go? Would you say...
V4 How often do you change your travel plans or not take trips because of the availability of parking at thedestinations where you would like to go? Would you say...
1 Never,
2 Rarely,
3 Sometimes, or
4 Often?
Employer Support -- Work Commuters Only. Noncommuters skip to YINTRO.
W1 Does your employer provide you with free or reduced fee parking?
1 YES, FREE
2 YES, REDUCED FEE
3 NO
4 NO, BUT HAVE FREE PARKING SOMEWHERE
5 DON'T KNOW
W2 [IF W1 EQ 2 OR 3, SKIP IF S1 = 1] How much does it cost you personally to park your car when you go towork? [PROBE: Is that daily or monthly?]
ENTER AMOUNT OF DOLLARS
W3 [IF W1 EQ 2 OR 3] How much would parking have to be before you would use public transportation to get toand from work? [PROBE: Is that daily or monthly?]
ENTER AMOUNT OF DOLLARS
W4 Does your employer...[INSERT STATEMENT]? [PROBE IF SELF EMPLOYED: Does your company...]
W4.1 Offer a program to pay for some or all of the transportation costs for employees who ride publictransportation – for example pay for a bus pass
W4.2 Provide a car to use for work purposes during work hours
W4.3 Sell bus or rail passes
W4.4 Provide bus or rail information on routes and schedules
W4.5 Allow bus and train riders to use a company car during the day to run personal errands
W4.6 Assist in forming carpools and vanpools
W4.7 Provide bike racks, showers and lockers
1 YES2 NO3 DON'T KNOW
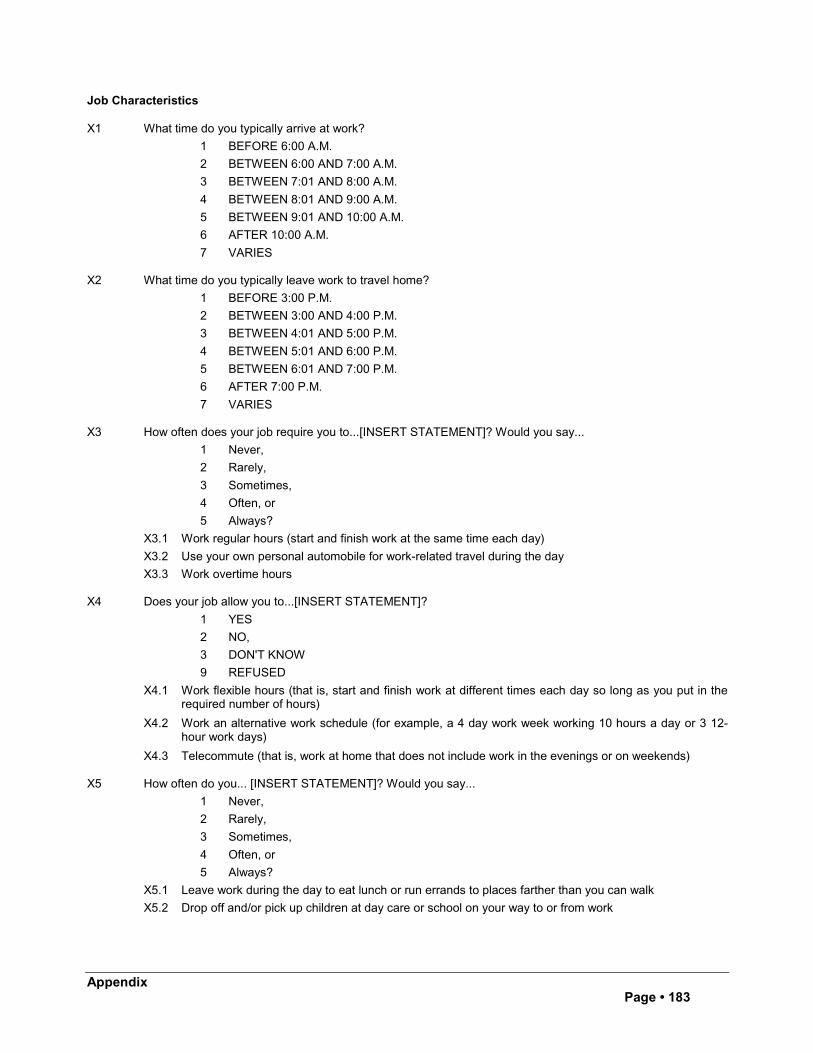
AppendixPage • 183
Job Characteristics
X1 What time do you typically arrive at work?
1 BEFORE 6:00 A.M.
2 BETWEEN 6:00 AND 7:00 A.M.
3 BETWEEN 7:01 AND 8:00 A.M.
4 BETWEEN 8:01 AND 9:00 A.M.
5 BETWEEN 9:01 AND 10:00 A.M.
6 AFTER 10:00 A.M.
7 VARIES
X2 What time do you typically leave work to travel home?
1 BEFORE 3:00 P.M.
2 BETWEEN 3:00 AND 4:00 P.M.
3 BETWEEN 4:01 AND 5:00 P.M.
4 BETWEEN 5:01 AND 6:00 P.M.
5 BETWEEN 6:01 AND 7:00 P.M.
6 AFTER 7:00 P.M.
7 VARIES
X3 How often does your job require you to...[INSERT STATEMENT]? Would you say...
1 Never,
2 Rarely,
3 Sometimes,
4 Often, or
5 Always?
X3.1 Work regular hours (start and finish work at the same time each day)
X3.2 Use your own personal automobile for work-related travel during the day
X3.3 Work overtime hours
X4 Does your job allow you to...[INSERT STATEMENT]?
1 YES
2 NO,
3 DON'T KNOW
9 REFUSED
X4.1 Work flexible hours (that is, start and finish work at different times each day so long as you put in therequired number of hours)
X4.2 Work an alternative work schedule (for example, a 4 day work week working 10 hours a day or 3 12-hour work days)
X4.3 Telecommute (that is, work at home that does not include work in the evenings or on weekends)
X5 How often do you... [INSERT STATEMENT]? Would you say...
1 Never,
2 Rarely,
3 Sometimes,
4 Often, or
5 Always?
X5.1 Leave work during the day to eat lunch or run errands to places farther than you can walk
X5.2 Drop off and/or pick up children at day care or school on your way to or from work
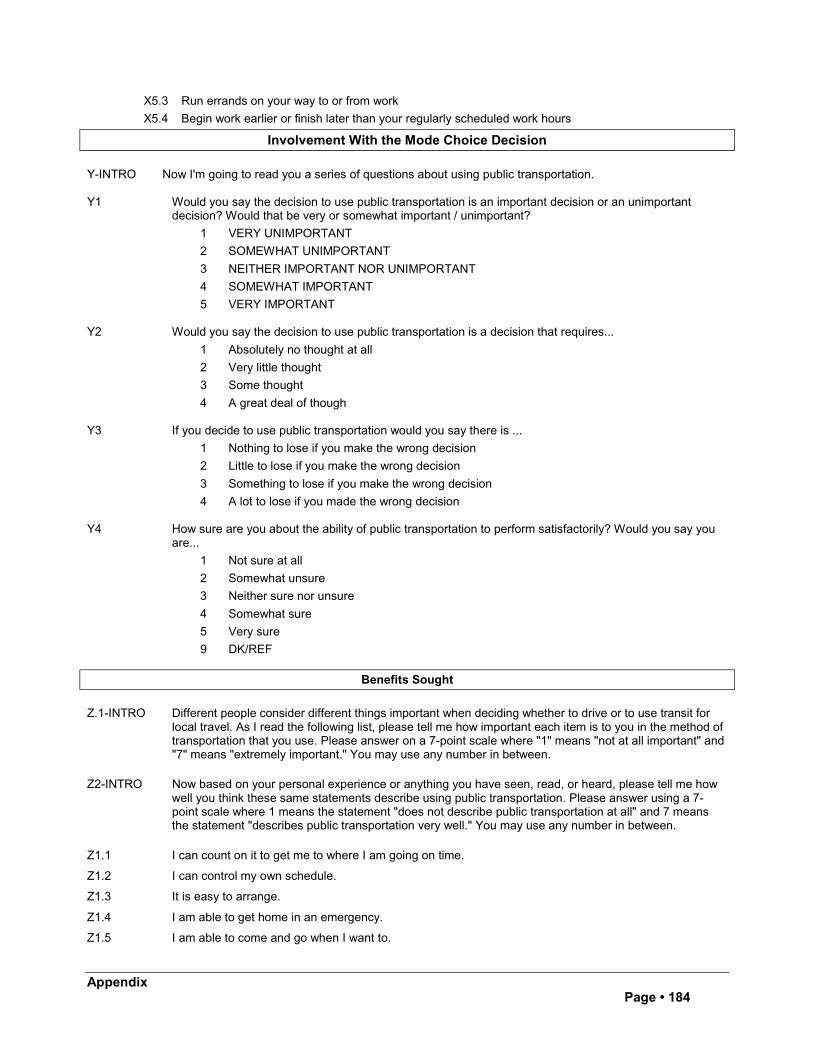
AppendixPage • 184
X5.3 Run errands on your way to or from work
X5.4 Begin work earlier or finish later than your regularly scheduled work hours
Involvement With the Mode Choice Decision
Y-INTRO Now I'm going to read you a series of questions about using public transportation.
Y1 Would you say the decision to use public transportation is an important decision or an unimportantdecision? Would that be very or somewhat important / unimportant?
1 VERY UNIMPORTANT
2 SOMEWHAT UNIMPORTANT
3 NEITHER IMPORTANT NOR UNIMPORTANT
4 SOMEWHAT IMPORTANT
5 VERY IMPORTANT
Y2 Would you say the decision to use public transportation is a decision that requires...
1 Absolutely no thought at all
2 Very little thought
3 Some thought
4 A great deal of though
Y3 If you decide to use public transportation would you say there is ...
1 Nothing to lose if you make the wrong decision
2 Little to lose if you make the wrong decision
3 Something to lose if you make the wrong decision
4 A lot to lose if you made the wrong decision
Y4 How sure are you about the ability of public transportation to perform satisfactorily? Would you say youare...
1 Not sure at all
2 Somewhat unsure
3 Neither sure nor unsure
4 Somewhat sure
5 Very sure
9 DK/REF
Benefits Sought
Z.1-INTRO Different people consider different things important when deciding whether to drive or to use transit forlocal travel. As I read the following list, please tell me how important each item is to you in the method oftransportation that you use. Please answer on a 7-point scale where "1" means "not at all important" and"7" means "extremely important." You may use any number in between.
Z2-INTRO Now based on your personal experience or anything you have seen, read, or heard, please tell me howwell you think these same statements describe using public transportation. Please answer using a 7-point scale where 1 means the statement "does not describe public transportation at all" and 7 meansthe statement "describes public transportation very well." You may use any number in between.
Z1.1 I can count on it to get me to where I am going on time.
Z1.2 I can control my own schedule.
Z1.3 It is easy to arrange.
Z1.4 I am able to get home in an emergency.
Z1.5 I am able to come and go when I want to.
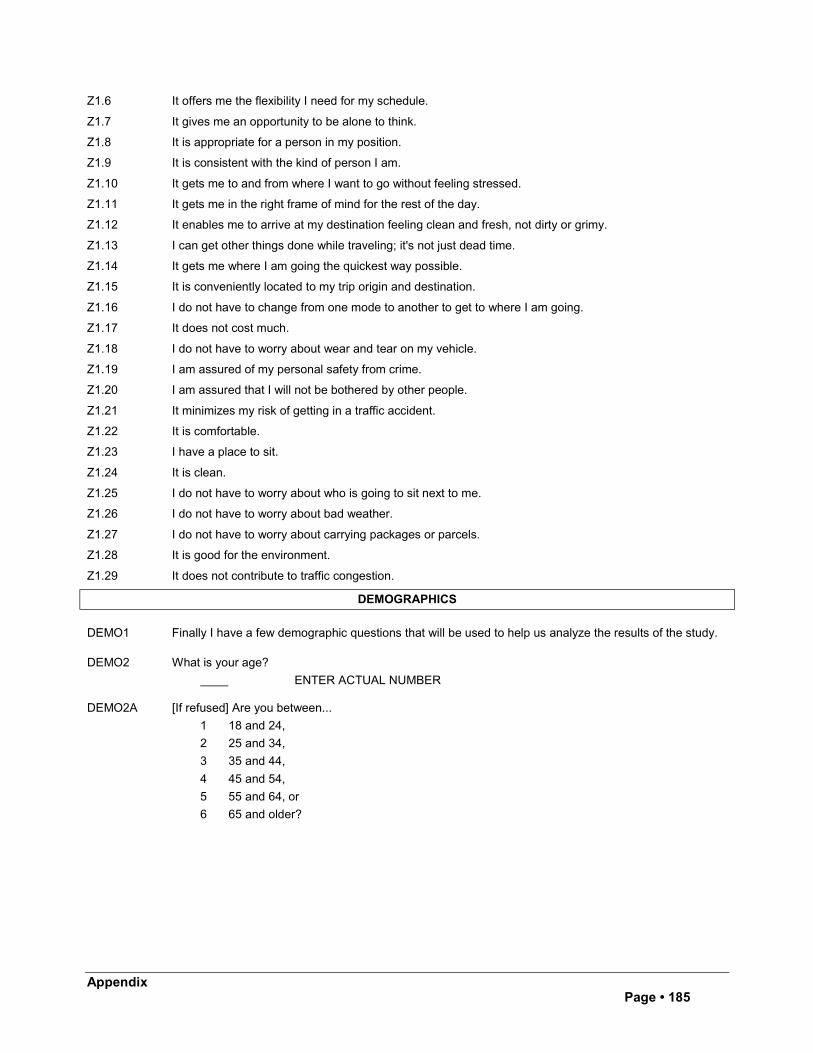
AppendixPage • 185
Z1.6 It offers me the flexibility I need for my schedule.
Z1.7 It gives me an opportunity to be alone to think.
Z1.8 It is appropriate for a person in my position.
Z1.9 It is consistent with the kind of person I am.
Z1.10 It gets me to and from where I want to go without feeling stressed.
Z1.11 It gets me in the right frame of mind for the rest of the day.
Z1.12 It enables me to arrive at my destination feeling clean and fresh, not dirty or grimy.
Z1.13 I can get other things done while traveling; it's not just dead time.
Z1.14 It gets me where I am going the quickest way possible.
Z1.15 It is conveniently located to my trip origin and destination.
Z1.16 I do not have to change from one mode to another to get to where I am going.
Z1.17 It does not cost much.
Z1.18 I do not have to worry about wear and tear on my vehicle.
Z1.19 I am assured of my personal safety from crime.
Z1.20 I am assured that I will not be bothered by other people.
Z1.21 It minimizes my risk of getting in a traffic accident.
Z1.22 It is comfortable.
Z1.23 I have a place to sit.
Z1.24 It is clean.
Z1.25 I do not have to worry about who is going to sit next to me.
Z1.26 I do not have to worry about bad weather.
Z1.27 I do not have to worry about carrying packages or parcels.
Z1.28 It is good for the environment.
Z1.29 It does not contribute to traffic congestion.
DEMOGRAPHICS
DEMO1 Finally I have a few demographic questions that will be used to help us analyze the results of the study.
DEMO2 What is your age?
ENTER ACTUAL NUMBER
DEMO2A [If refused] Are you between...
1 18 and 24,
2 25 and 34,
3 35 and 44,
4 45 and 54,
5 55 and 64, or
6 65 and older?
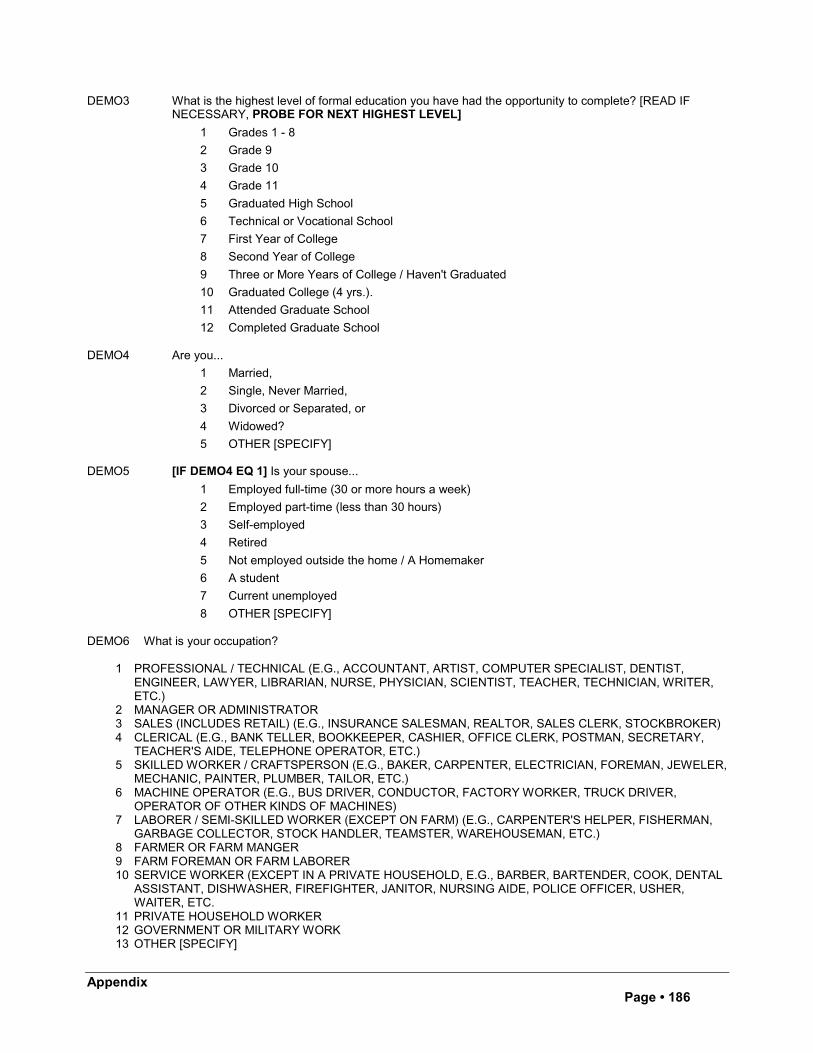
AppendixPage • 186
DEMO3 What is the highest level of formal education you have had the opportunity to complete? [READ IFNECESSARY, PROBE FOR NEXT HIGHEST LEVEL]
1 Grades 1 - 8
2 Grade 9
3 Grade 10
4 Grade 11
5 Graduated High School
6 Technical or Vocational School
7 First Year of College
8 Second Year of College
9 Three or More Years of College / Haven't Graduated
10 Graduated College (4 yrs.).
11 Attended Graduate School
12 Completed Graduate School
DEMO4 Are you...
1 Married,
2 Single, Never Married,
3 Divorced or Separated, or
4 Widowed?
5 OTHER [SPECIFY]
DEMO5 [IF DEMO4 EQ 1] Is your spouse...
1 Employed full-time (30 or more hours a week)
2 Employed part-time (less than 30 hours)
3 Self-employed
4 Retired
5 Not employed outside the home / A Homemaker
6 A student
7 Current unemployed
8 OTHER [SPECIFY]
DEMO6 What is your occupation?
1 PROFESSIONAL / TECHNICAL (E.G., ACCOUNTANT, ARTIST, COMPUTER SPECIALIST, DENTIST,ENGINEER, LAWYER, LIBRARIAN, NURSE, PHYSICIAN, SCIENTIST, TEACHER, TECHNICIAN, WRITER,ETC.)
2 MANAGER OR ADMINISTRATOR3 SALES (INCLUDES RETAIL) (E.G., INSURANCE SALESMAN, REALTOR, SALES CLERK, STOCKBROKER)4 CLERICAL (E.G., BANK TELLER, BOOKKEEPER, CASHIER, OFFICE CLERK, POSTMAN, SECRETARY,
TEACHER'S AIDE, TELEPHONE OPERATOR, ETC.)5 SKILLED WORKER / CRAFTSPERSON (E.G., BAKER, CARPENTER, ELECTRICIAN, FOREMAN, JEWELER,
MECHANIC, PAINTER, PLUMBER, TAILOR, ETC.)6 MACHINE OPERATOR (E.G., BUS DRIVER, CONDUCTOR, FACTORY WORKER, TRUCK DRIVER,
OPERATOR OF OTHER KINDS OF MACHINES)7 LABORER / SEMI-SKILLED WORKER (EXCEPT ON FARM) (E.G., CARPENTER'S HELPER, FISHERMAN,
GARBAGE COLLECTOR, STOCK HANDLER, TEAMSTER, WAREHOUSEMAN, ETC.)8 FARMER OR FARM MANGER9 FARM FOREMAN OR FARM LABORER10 SERVICE WORKER (EXCEPT IN A PRIVATE HOUSEHOLD, E.G., BARBER, BARTENDER, COOK, DENTAL
ASSISTANT, DISHWASHER, FIREFIGHTER, JANITOR, NURSING AIDE, POLICE OFFICER, USHER,WAITER, ETC.
11 PRIVATE HOUSEHOLD WORKER12 GOVERNMENT OR MILITARY WORK13 OTHER [SPECIFY]
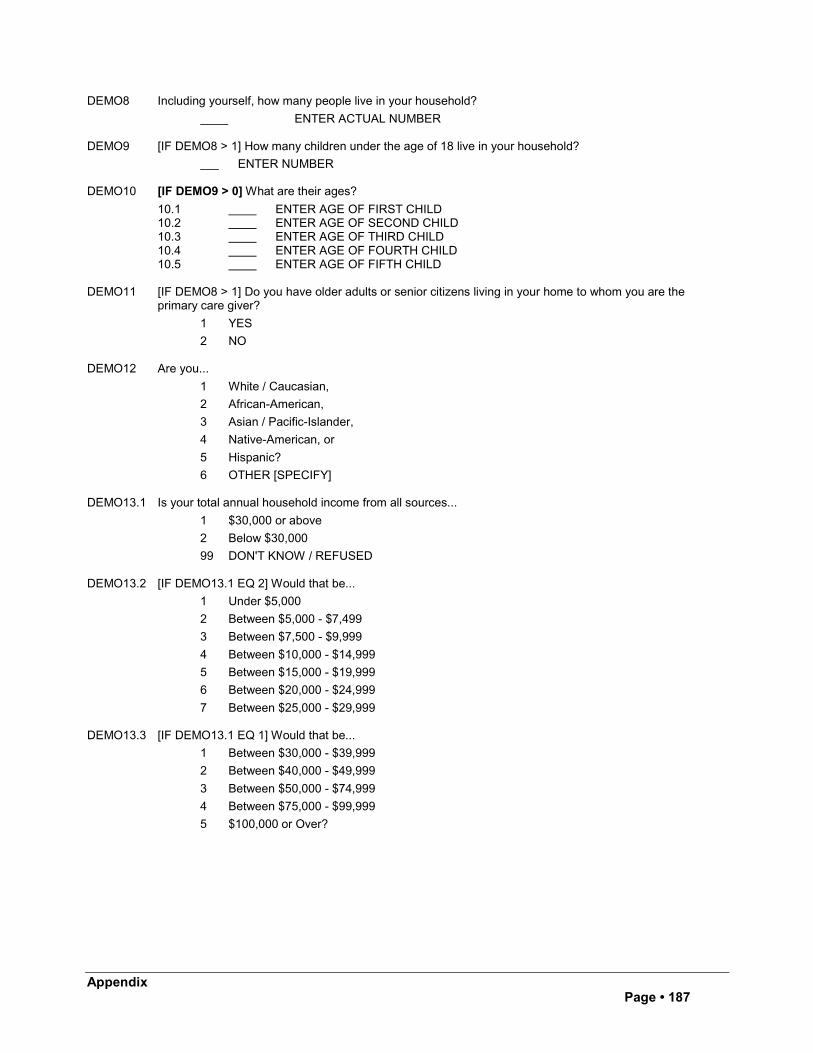
AppendixPage • 187
DEMO8 Including yourself, how many people live in your household?
ENTER ACTUAL NUMBER
DEMO9 [IF DEMO8 > 1] How many children under the age of 18 live in your household?
ENTER NUMBER
DEMO10 [IF DEMO9 > 0] What are their ages?
10.1 ENTER AGE OF FIRST CHILD10.2 ENTER AGE OF SECOND CHILD10.3 ENTER AGE OF THIRD CHILD10.4 ENTER AGE OF FOURTH CHILD10.5 ENTER AGE OF FIFTH CHILD
DEMO11 [IF DEMO8 > 1] Do you have older adults or senior citizens living in your home to whom you are theprimary care giver?
1 YES
2 NO
DEMO12 Are you...
1 White / Caucasian,
2 African-American,
3 Asian / Pacific-Islander,
4 Native-American, or
5 Hispanic?
6 OTHER [SPECIFY]
DEMO13.1 Is your total annual household income from all sources...
1 $30,000 or above
2 Below $30,000
99 DON'T KNOW / REFUSED
DEMO13.2 [IF DEMO13.1 EQ 2] Would that be...
1 Under $5,000
2 Between $5,000 - $7,499
3 Between $7,500 - $9,999
4 Between $10,000 - $14,999
5 Between $15,000 - $19,999
6 Between $20,000 - $24,999
7 Between $25,000 - $29,999
DEMO13.3 [IF DEMO13.1 EQ 1] Would that be...
1 Between $30,000 - $39,999
2 Between $40,000 - $49,999
3 Between $50,000 - $74,999
4 Between $75,000 - $99,999
5 $100,000 or Over?
AppendixPage • 188
DEMO14 If you were asked to use one of the following terms to describe your social class, which would you choose?
1 Lower class
2 Lower-middle class
3 Middle class
4 Upper middle class
5 Upper class
DEMO15 We would like to be able to identify the census tract in which you live. Could you please provide us with thenames of the cross streets or intersections nearest your home?[PROBE: Please provide me with the whole street name, directional indicators, etc. so I can locate thegeneral area on a map.][PROBE ONLY IF NECESSARY: We will be using this information to do detailed analysis by census tract.]
THANK That concludes our survey. Thank you very much for the time you spent with us today. Your responseswere very helpful.
DEMO19 SIZE OF RESIDENCE AREA (FROM ZIP CODE)
1 LARGE CENTRAL CITY (250,000 OR MORE)
2 MEDIUM CENTRAL CITY (50,000 - 250,000)
3 SUBURB OF LARGE CENTRAL CITY
4 SUBURB OF MEDIUM CENTRAL CITY
5 NOT WITHIN AN SMSA
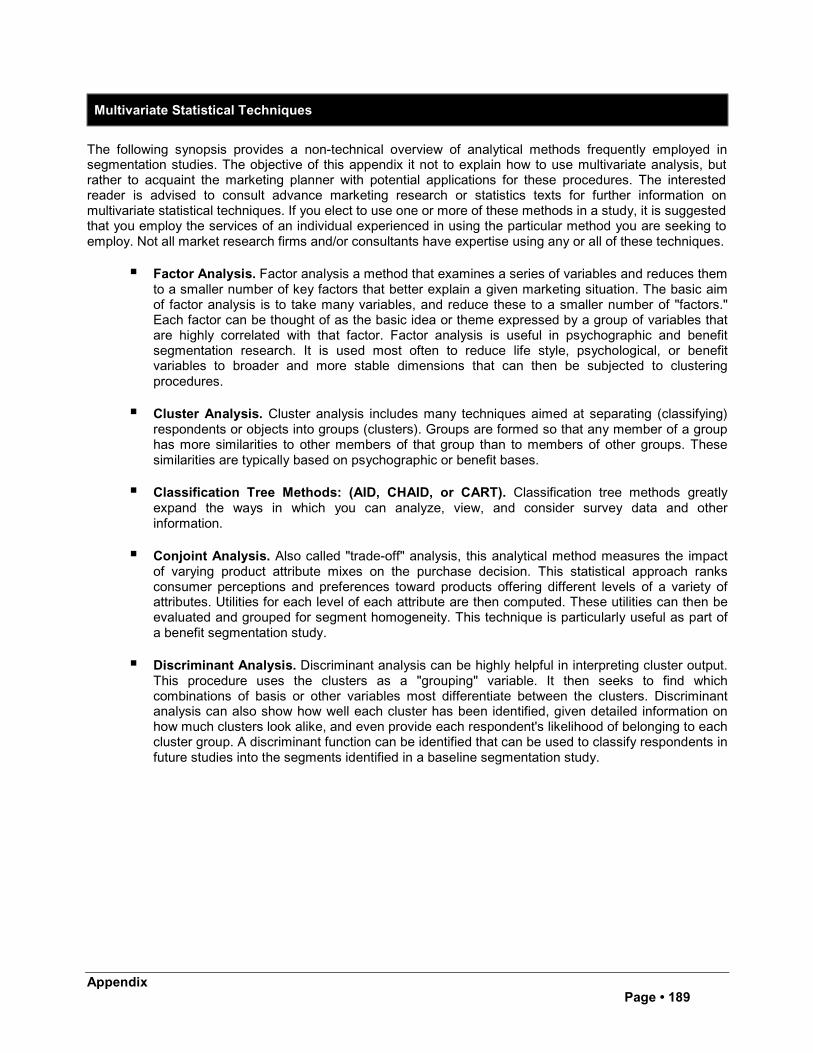
AppendixPage • 189
Multivariate Statistical Techniques
The following synopsis provides a non-technical overview of analytical methods frequently employed insegmentation studies. The objective of this appendix it not to explain how to use multivariate analysis, butrather to acquaint the marketing planner with potential applications for these procedures. The interestedreader is advised to consult advance marketing research or statistics texts for further information onmultivariate statistical techniques. If you elect to use one or more of these methods in a study, it is suggestedthat you employ the services of an individual experienced in using the particular method you are seeking toemploy. Not all market research firms and/or consultants have expertise using any or all of these techniques.
! Factor Analysis. Factor analysis a method that examines a series of variables and reduces themto a smaller number of key factors that better explain a given marketing situation. The basic aimof factor analysis is to take many variables, and reduce these to a smaller number of "factors."Each factor can be thought of as the basic idea or theme expressed by a group of variables thatare highly correlated with that factor. Factor analysis is useful in psychographic and benefitsegmentation research. It is used most often to reduce life style, psychological, or benefitvariables to broader and more stable dimensions that can then be subjected to clusteringprocedures.
! Cluster Analysis. Cluster analysis includes many techniques aimed at separating (classifying)respondents or objects into groups (clusters). Groups are formed so that any member of a grouphas more similarities to other members of that group than to members of other groups. Thesesimilarities are typically based on psychographic or benefit bases.
! Classification Tree Methods: (AID, CHAID, or CART). Classification tree methods greatlyexpand the ways in which you can analyze, view, and consider survey data and otherinformation.
! Conjoint Analysis. Also called "trade-off" analysis, this analytical method measures the impactof varying product attribute mixes on the purchase decision. This statistical approach ranksconsumer perceptions and preferences toward products offering different levels of a variety ofattributes. Utilities for each level of each attribute are then computed. These utilities can then beevaluated and grouped for segment homogeneity. This technique is particularly useful as part ofa benefit segmentation study.
! Discriminant Analysis. Discriminant analysis can be highly helpful in interpreting cluster output.This procedure uses the clusters as a "grouping" variable. It then seeks to find whichcombinations of basis or other variables most differentiate between the clusters. Discriminantanalysis can also show how well each cluster has been identified, given detailed information onhow much clusters look alike, and even provide each respondent's likelihood of belonging to eachcluster group. A discriminant function can be identified that can be used to classify respondents infuture studies into the segments identified in a baseline segmentation study.
AppendixPage • 190
Resources
Major Sources of Demographic / Marketing Information
The following list of key references is helpful for gathering information needed for segmentation studies. Thelists are arranged alphabetically under categories. Generally, these sources are readily available for reviewat your local public or academic library. Recommend that your company purchase publications thatmarketing staffs consult frequently. Also, this list is by no means complete, because research sources canvary considerably by industry and market. It does however represent a good starting point – a generalreference directory for marketers. The Appendix is organized into three parts: consumer demographics,business demographics, and secondary sources.
I. CONSUMER DEMOGRAPHICS
American Demographics. This monthly magazine is a source for demographic information relevant toconsumer change and marketing insights. This journal gives you the essential facts, figures, forecasts,analysis for identifying and segmenting marketing. It features articles on age, education, geography, income,lifestyles, subcultures, trends, spending, and timely consumer topics.
CACI's Sourcebooks. CACI Marketing Systems publishes reference books of selected census data,updates, and forecasts for every zip code and county in the United States (Sourcebook of ZIP CodeDemographics and Sourcebook of County Demographics). These desktop guides are easy to use andprovide logical and streamlined profiles of 1990 census demographics; they are also available on CD-ROM.The ZIP Code Mapbook of Metropolitan Areas displays 320 maps in an 11" × 17" format.
Census of Population and Housing 1990. This resource offers detailed data on the U.S. population forpredefined geographical areas. Census content includes basic population and housing items, as well associal and economic characteristics. Many specialized reports are available. Census products aredisseminated in several forms: printed reports, computer tapes, microfiche, online information systems(CENDATA), CD-ROM, and floppy diskettes. The TIGER mapping system provides a handy complement to1990 Census products.
County and City Data Book. This source is an all-purpose database for all U.S. counties and large cities(population over 25,000). Statistics on population, housing, race, education, marital status, income,employment, occupation, crime, and economic sectors are provided. Available on CD-ROM.
Editor and Publisher Market Guide. This annual reference combines 1990 census data with updated surveysfor U.S. and Canadian markets. Local population, household, income, retail sales, newspaper circulation,and related data (and estimates) are featured.
Rand McNally Commercial Atlas and Marketing Guide. Besides being one of the largest books in print, thisannual atlas includes traditional area maps, and data on population, economics, communications, andtransportation. Canadian statistics are also included.
Sales and Marketing Management's Special Publications. This monthly magazine aimed at sales andmarketing professionals offers reference guides such as The Survey of Buying Power, Survey of MediaMarkets, and The Sales Manager's Budget Planners. These publications feature population estimates,household data, age distributions, and retail sales information. S&MM's special issues are particularly helpfulfor evaluating existing or new markets, analyzing sales territories, measuring market potential, and relatedmarketing decisions.
AppendixPage • 191
State and Metropolitan Area Data Book. This government publication reports - via tables, charts, andmapsdata on U.S. MSAs. The largest part of the reference is arranged by city, and in that section each city isusually divided by suburbs, central city, and MSA. Includes business and government statistics as well asdemographics.
Statistical Abstracts. The U.S. Statistical Abstract is a logical starting place for many market researchers.This annual reference summarizes and indexes consumer data from the important U.S. governmentpublications. Most states have their own statistical abstracts filled with similar demographic information.
Statistical Handbooks. A series of four targeted publications on Aging Americans, the American Family,U.S. Hispanics, and Women in America. In addition to a unique demographic focus for each, these booksalso address political, social, cultural. and economic issues.
The Numbers News, a monthly newsletter by American Demographics. provides market trends and currentdata releases from government agencies, consumer surveys, and other marketing resources.
Other Good Sources of Consumer Demographics. Business reference librarians were impressed with twonew publications from Standard Rates and Data Services (SRDS), the Lifestyle Market Analyst and theLifestyle Zip Code Analyst. Claritas' National Encyclopedia of Residential Zip Code Demography (REZIDE),Donnelley's Market Profile Analysis, Woods and Poole's State Profiles, and the Zip Code Sale InformationGuide are also worth consulting.
II. BUSINESS DEMOGRAPHICS
Business Census Reports. These publications consist of the following series of individualized Censusreports: Retail Trade, Wholesale Trade, Services, Construction, Manufacturing, Mineral Industries, andTransportation. These national or state economic reports provide statistics on different kinds ofestablishments, sales and employment size, and payroll by designated geographic areas and SIC codes.The business censuses are taken every fifth year in years ending in a two or seven (such as 1992 or 1997).In addition to the basic data collected, a number of special subject reports are included detailing specificindustries or market related facts. Now available on CD-ROM.
County Business Patterns. A Census Bureau publication organized by county and prepared on an individualstate basis, this important reference provides data by SIC code and major industry group. Among theinformation provided include the number of establishments, number of employees, number of establishmentsby employment size, the number of large establishments, and payroll for states and counties. Through thissource, the industrial marketer can readily identify the number of prospects in a market, determine whetherthe market is dominated by large or small firms, and estimate market share for a given industry andgeographic area. Available on CD-ROM.
Dun's Census of American Business. Do you know how large the national market is for your product? Orwhere to find the greatest concentration of prospects for it? How about where to locate branches, outlets,and service centers? This source can answer these questions and more. Information includes sales volume,employee size, industry classification, SIC code, and other pertinent data.
Other Good Sources of Business Demographics. You might also check Markets of the U.S. for BusinessPlanners by Thomas Conrov and Manufacturing USA, a Gale publication. Many state and local/countygovernment agencies provide business demographic information. In addition, don't neglect consumer(Donnelley's Market Profile Analysis) or secondary sources (such as The U.S. Industrial Outlook). These andmany other nontraditional sources contain some business demographics, even though that is not theirprimary purpose.
AppendixPage • 192
III. SECONDARY SOURCES
Business Indexes. Some of the major library indexes that you can use to access trade-related articles arePredicasts F&S, Business Periodicals, Wall Street Journal, New York Times, American Statistical, BusinessIndex, and Magazine Index. Many of these are now available for use on a computer.
Computerized Databases. The latest and greatest entrant into the research 'arena," online databases arebecoming more prevalent as a means of finding published information. There are now dozens of usefuldatabases for marketing applications. Examples include Dialog, ABI Inform, Trade and Industry, thePredicasts' series, Nexis/Lexis, and; UMI's Newspaper Abstracts. See the Gale Directory of Databases forfurther information.
Directories. Trade directories are one of the best sources for market and customer information. Literallyhundreds of specialized directories are available, and they can be of tremendous value to companiesseeking marketing information. Some of the most widely used directories include The Encyclopedia ofAssociations; National Trade and Professional Associations of the United States; Findex Directory of MarketResearch Reports, Studies, and Surveys; Thomas Register of American Manufacturers (available on CD-ROM); MacRAE's Blue Book; Ward's Business Directory of U.S. Firms; state industrial directories; andStandard and Poor's and Dun and Bradstreet's directories. Don't know where to look? Consider Gale'sDirectory of Directories. It is an annotated guide to business and industrial directories, professional andscientific rosters, and other lists and guides of all kinds.
Statistical Sources. A variety of useful statistical sources provide descriptive information about markets.Some sources provide Statistics only, such as Predicasts Forecasts. Other sources, such as The US.Industrial Outlook and Standard and Poor's Industry Survey's, supplement statistical data with importantnarrative summaries. U.S. Department of Commerce publications are a good source to tap.
Trade Journals. Some of the best sources for market information are trade journals. These industry-specificpublications contain a wealth of information, and one or more trade journals typically exist for virtually everymajor market or industry. To locate trade journals, a variety of sources can be consulted. Some of theseinclude Ulrich's International Periodicals Directory, Standard Rate and Data Service - Business PublicationsRates and Data, Bacon's Publicity Checker, Writer's Market, and the Gale Directory of Publications andBroadcast Media.
Trade Journals (Special Issues). Three of the best sources of trade information that is publishedinfrequently are Harfax Guide to Industry Special Issues, Special Issues Index by Greenwood Press, andUlrich's Irregular Serials and Annuals.
AppendixPage • 193
Bookshelf
Ambry, Margaret. Consumer Power How Americans Spend Their Money Ithica, N.Y: New StrategistPublications, 1991.
Ambry, Margaret. The Almanac of Consumer Markets: A Demographic Guide to Finding Today's Complexand Hard-to-Reach Customers. Ithica, N.Y.: American Demographics Press, 1990.
Baker, Sunny, and Baker, Kim. Market Mapping: How to Use Revolutionary New Software to Find, Analyze,and Keep Customers. New York: McGraw-Hill, 1993.
Barabba, Vincent P., and Zaltman, Gerald. Hearing the Voice of the Market: Competitive Advantage ThroughCreative Use of Market Information. Cambridge, Mass.: Harvard Business School Press, 1991.
Beane, T.D. and Ennis, D.M. Market Segmentation: A Review. European Journal of Marketing, 21, (No. 5,1987), pp. 20-42.
Berrigan, John A., and Finkbeiner, Carol T Segmentation Marketing: New Methods for Capturing BusinessMarkets. New York: Harper Collins, 1992.
Bonoma, Thomas V., and Shapiro, Benson R. Segmenting the Industrial Market. Lexington, Mass.:Lexington Books, 1983.
Crispell, Diane (ed.). The Insider's Guide to Demographic Know-How: How to Find, Analyze, and UseInformation About Your Customers, Third Edition. Ithica, N.Y.: American Demographics Press, 1993.
Day, George S. Market Driven Strategy: Processes for Creating Value. New York: The Free Press, 1990.
Francese, Peter F, and Purto, Rebecca. Capturing Customers: How to Target the Hottest Markets of the'90s. Ithica, N.Y.: American Demographics Press, 1990.
Haley, Russell I. Developing Effective Communications Strategy: A Benefit Segmentation Approach. NewYork: Wiley, 1985.
Hoghes, Arthur M. The Complete Database Marketer: Tapping Your Customer Base to Maximize Sales andIncrease Profits. Chicago: Probos Publishing Company, 1991.
Journal of Segmentation in Marketing: Innovations in Market Identification and Targeting. The HaworthPress, Inc.
Lazer, William. Handbook of Demographics for Marketing and Advertising. Sources and Trends on the U.S.Consumer. Lexington, Mass.:Lexington Books, 1987.
Linneman, Robert, and Stanton, John I.. Making Niche Marketing Work: How to Grow Bigger by ActingSmaller New York: McGraw Hill, 1991.
McKenna, Shawn. The Complete Guide to Regional Marketing Homewood, III.: Business One Irwin, 1992.
Michman, Ronald D. Lifestyle Marketing Segmentation. New York: Praeger, 1991.
AppendixPage • 194
Morgan, Carol M., and Levy, Doran J. Segmenting the Mature Market Identifying, Targeting and ReachingAmerica's Diverse Booming Senior Markets. Chicago: Probus Publishing Company. 1993.
Niche Marketing: Identifying Opportunity Markets with Syndicated Consumer Research. New York:Mediamark Research, 1988.
Ostroff, Jeff. Successful Marketing to the 50+ Consumer: How to Capture One of the Biggest & FastestGrowing Markets in America. Englewood Cliffs, N.J.: Prentice Hall, 1989.
Piirto, Rebecca. Beyond Mind Games: The Marketing Power of Psychographics. Ithica, N.Y.: AmericanDemographics Press, 1991.
Pinson, Linda, and Jinnett, Jerry. Researching and Reaching Your Target Market. Fullerton, Calif.: Out ofYour Mind ... and Into the Marketplace, 1988.
Popcorn, Faith. The Popcorn Report. New York: Doubleday, 1991.
Ries, Al, and Trout, Jack. Marketing Warfare. New York: McGraw-Hill, 1986.
Scotton, Donald W., and Zallocco, Ronald L., editors. Readings in Market Segmentation. Chicago: AmericanMarketing Association, 1980.
Settle, Robert B., and Alreck, Pamela L. Why They Buy: American Consumers Inside and Out. New York:John Wiley & Sons, 1986.
Struhl, Steven M. Market Segmentation: An Introduction and Review Chicago: American MarketingAssociation, 1992.
Swenson, Chester A. Selling to a Segmented Market: The Lifestyle Approach. New York: Quorum Books,1990.
Vavra, Terry G. After-Marketing: How to Keep Customers for Life Through Relationship Marketing.Homewood, Ill.: Business One Irwin, 1992.
von Hippel, Eric. The Sources of Information New York: Oxford University Press, 1988.
Weinstein, Art. Market Segmentation: Using Demographics, Psychographics and Other Niche MarketingTechniques to Predict Customer Behavior. Chicago: Irwin Press, 1994.
Weiss, Michael J. The Clustering of America A Vivid Portrait of the Nation's 40 Neighborhood Types~ TheirValues, Lifestyles and Eccentricities. New York: Tilden Press, 1988.
Wind, Yoram. Issues and Advances in Segmentation Research. Journal of Marketing Research, 15 (August1978), pp. 317 – 337.
Zandl, Irma, and Leonard, Richard. Targeting the Trendsetting Consumer. How to Market Your Product orService to Influential Buyers. Homewood, Ill.: Business One Irwin, 1992.

The Transportation Research Board is a unit of the National Research Council, which serves the
National Academy of Sciences and the National Academy of Engineering. The Board's mission is to
promote innovation and progress in transportation by stimulating and conducting research, facilitating the
dissemination of information, and encouraging the implementation of research results. The Board's varied
activities annually draw on approximately 4,000 engineers, scientists, and other transportation researchers
and practitioners from the public and private sectors and academia, all of whom contribute their expertise
in the public interest. The program is supported by state transportation departments, federal agencies
including the component administrations of the U.S. Department of Transportation, and other
organizations and individuals interested in the development of transportation.
The National Academy of Sciences is a private, nonprofit, self-perpetuating society of distinguished
scholars engaged in scientific and engineering research, dedicated to the furtherance of science and
technology and to their use for the general welfare. Upon the authority of the charter granted to it by
the Congress in 1863, the Academy has a mandate that requires it to advise the federal government on
scientific and technical matters. Dr. Bruce M. Alberts is president of the National Academy of
Sciences.
The National Academy of Engineering was established in 1964, under the charter of the National
Academy of Sciences, as a parallel organization of outstanding engineers. It is autonomous in its
administration and in the selection of its members, sharing with the National Academy of Sciences the
responsibility for advising the federal government. The National Academy of Engineering also sponsors
engineering programs aimed at meeting national needs, encourages education and research, and
recognizes the superior achievements of engineers. Dr. William A. Wulf is president of the National
Academy of Engineering.
The Institute of Medicine was established in 1970 by the National Academy of Sciences to secure the
services of eminent members of appropriate professions in the examination of policy matters pertaining to
the health of the public. The Institute acts under the responsibility given to the National Academy of
Sciences by its congressional charter to be an adviser to the federal government and, upon its own
initiative, to identify issues of medical care, research, and education. Dr. Kenneth I. Shine is president of
the Institute of Medicine.
The National Research Council was organized by the National Academy of Sciences in 1916 to
associate the broad community of science and technology with the Academy's purpose of furthering
knowledge and advising the federal government. Functioning in accordance with general policies
determined by the Academy, the Council has become the principal operating agency of both the National
Academy of Sciences and the National Academy of Engineering in providing services to the government,
the public, and the scientific and engineering communities. The Council is administered jointly by both
the Academies and the Institute of Medicine. Dr. Bruce M. Alberts and Dr. William A. Wulf are
chairman and vice chairman, respectively, of the National Research Council.
Abbreviations used without definitions in TRB publications:
AASHO American Association of State Highway Officials
AASHTO American Association of State Highway and Transportation Officials
ASCE American Society of Civil Engineers
ASME American Society of Mechanical Engineers
ASTM American Society for Testing and Materials
FAA Federal Aviation Administration
FHWA Federal Highway Administration
FRA Federal Railroad Administration
FTA Federal Transit Administration
IEEE Institute of Electrical and Electronics Engineers
ITE Institute of Transportation Engineers
NCHRP National Cooperative Highway Research Program
NCTRP National Cooperative Transit Research and Development Program
NHTSA National Highway Traffic Safety Administration
SAE Society of Automotive Engineers
TCRP Transit Cooperative Research Program
TRB Transportation Research Board
U.S.DOT United States Department of Transportation