Embed Size (px)
Citation preview
Using Predictive Analyticsto
Improve the Bottom Line*****
http://www.unr.edu/ia/research
Serge Herzog, PhDDirector, Institutional AnalysisConsultant, CRDA StatLabUniversity of Nevada, RenoReno, NV 89557, [email protected] Stanley, MEdInstitutional AnalystUniversity of Hawai̒i at MānoaHonolulu, HI, [email protected]
CAIR ConferenceAnaheim, CA, Nov. 6-9, 2012

2
• Compliance vs. Self-Improvement• Developing a culture of evidence• From reporting to analysis• Converting results into ‘actionable’ statements• From ‘data silos’ to integrated warehouse• Leverage technology, stay abreast of tech• Follow highest standards, best practices• Know your customers, mission• Empower staff, continuous honing of skills
Challenges for Institutional Research

3
• Student success: a strategic imperative• Performance-based state funding impending• Dwindling state support for higher education• Tuition-revenue maximization• Reputation and marketing• Effective senior-management support by IR• K-16 Education Collaborative
– High school transcript study– High school gateway curriculum– Reversing the tide of college remediation
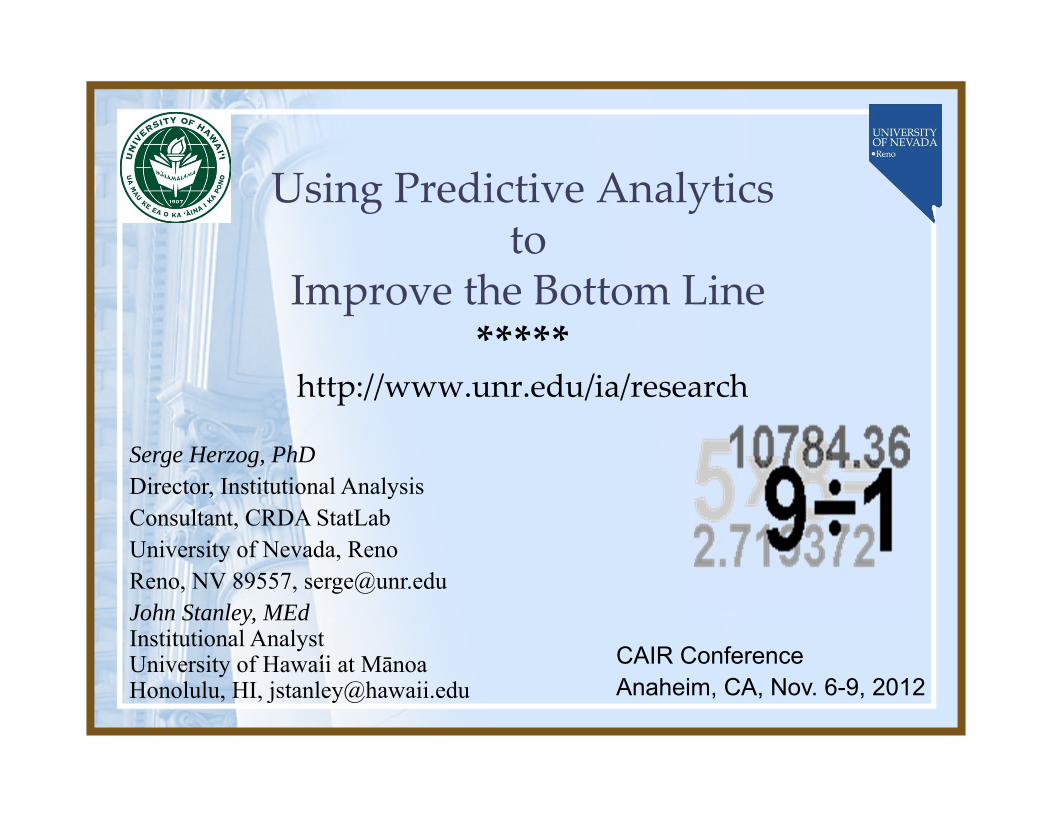
The Institutional Context
4
The Institutional Context
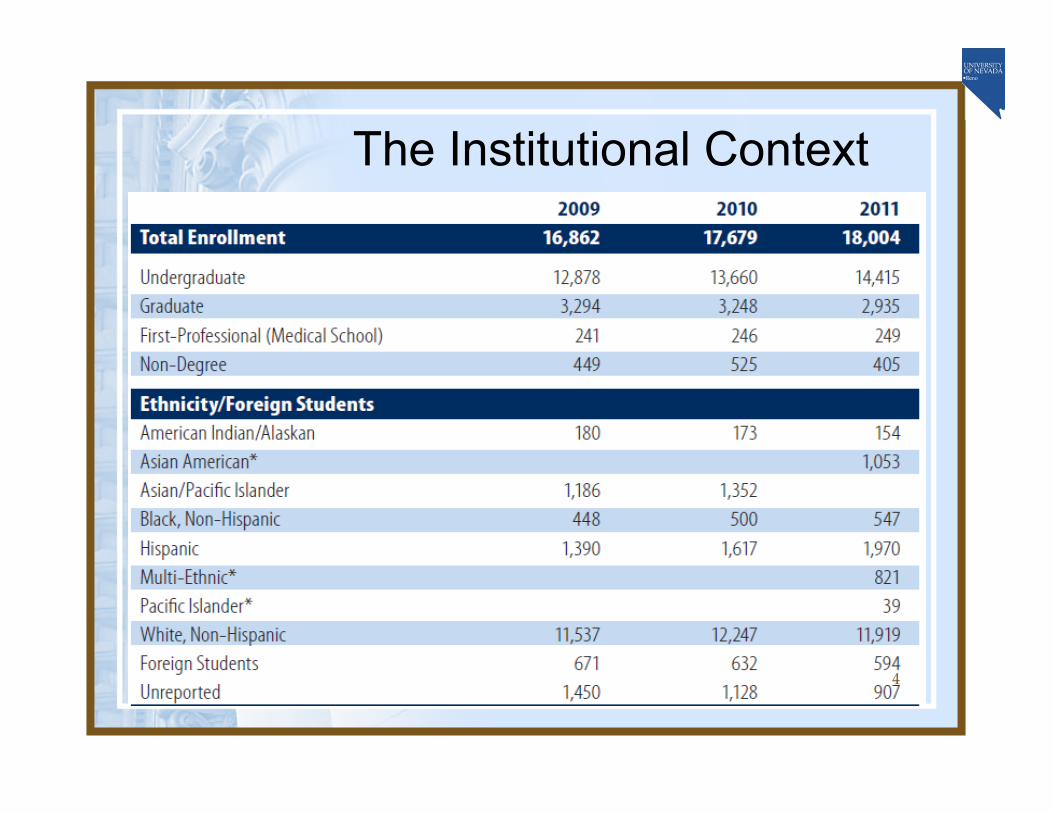
5
The Institutional Context
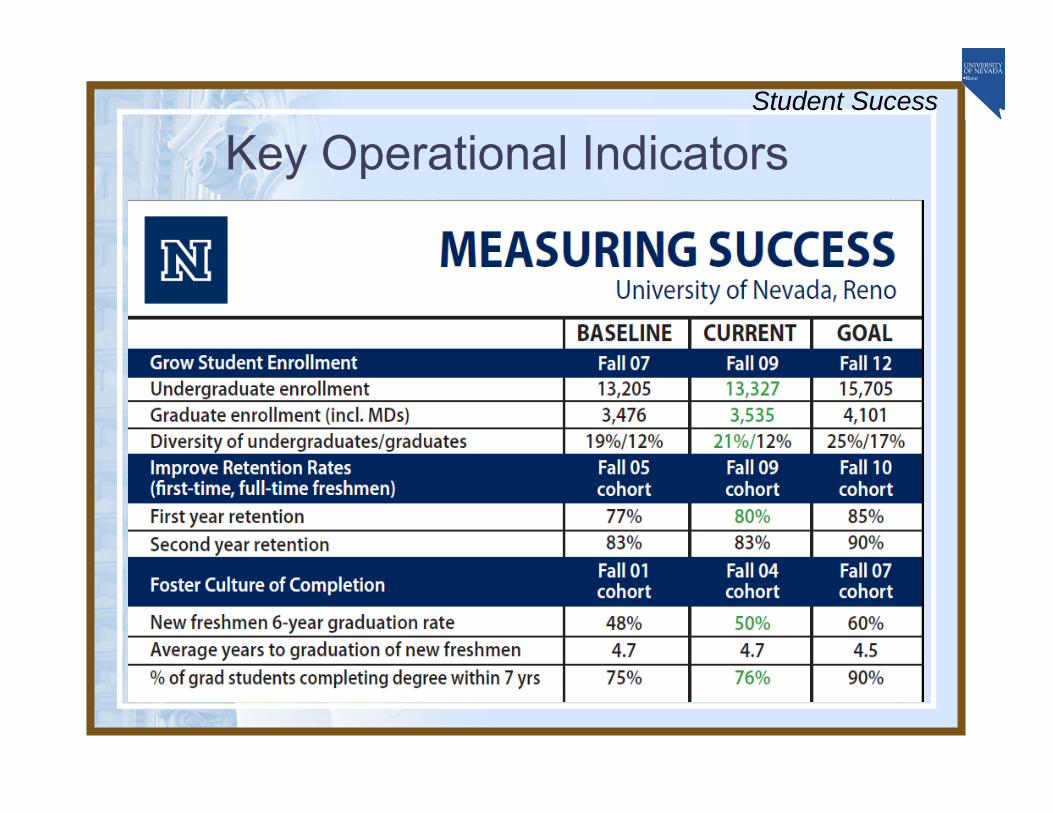
Key Operational Indicators
6
Student Sucess
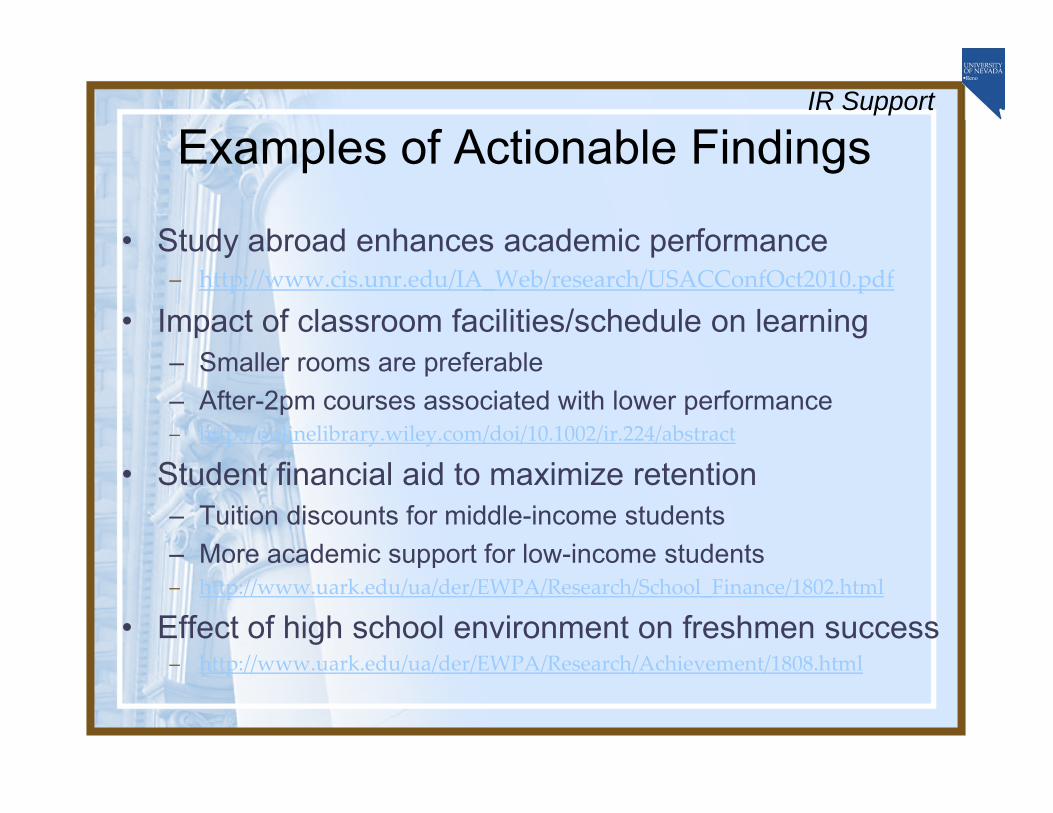
Examples of Actionable Findings
• Study abroad enhances academic performance– http://www.cis.unr.edu/IA_Web/research/USACConfOct2010.pdf
• Impact of classroom facilities/schedule on learning– Smaller rooms are preferable– After-2pm courses associated with lower performance– http://onlinelibrary.wiley.com/doi/10.1002/ir.224/abstract
• Student financial aid to maximize retention– Tuition discounts for middle-income students– More academic support for low-income students– http://www.uark.edu/ua/der/EWPA/Research/School_Finance/1802.html
• Effect of high school environment on freshmen success– http://www.uark.edu/ua/der/EWPA/Research/Achievement/1808.html
IR Support
8
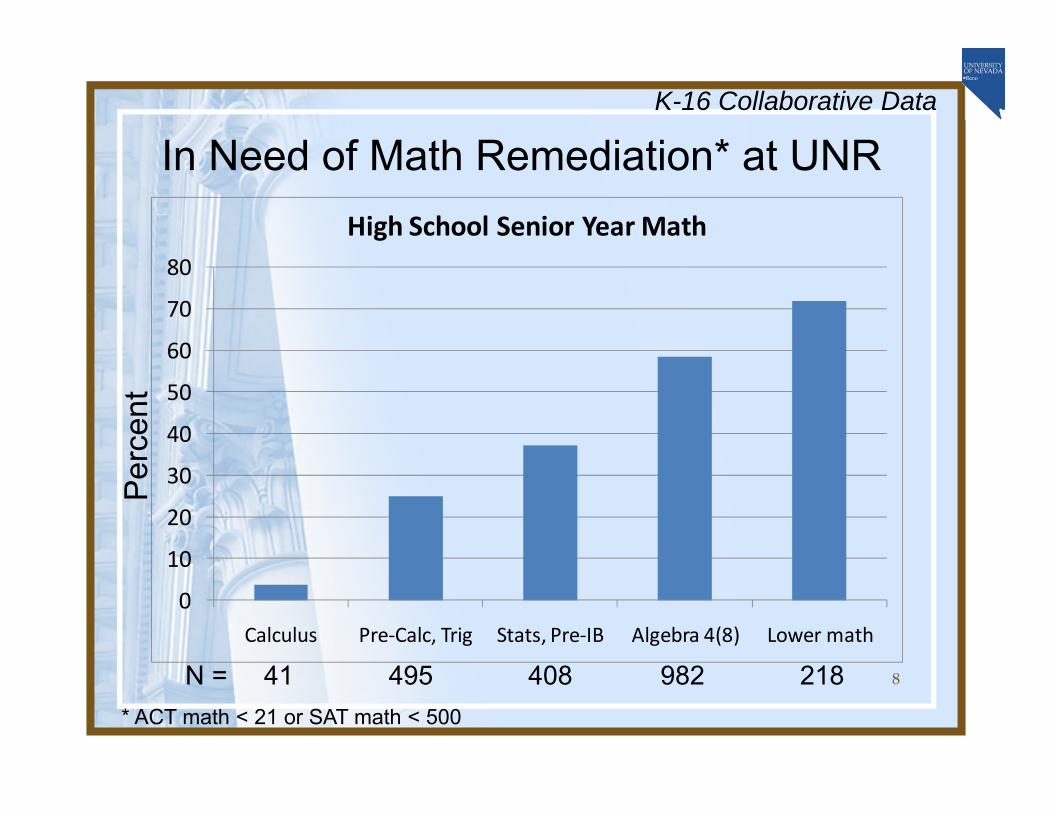
In Need of Math Remediation* at UNR
0
10
20
30
40
50
60
70
80
Calculus Pre‐Calc, Trig Stats, Pre‐IB Algebra 4(8) Lower math
High School Senior Year Math
Per
cent
* ACT math < 21 or SAT math < 500
N = 41 495 408 982 218
K-16 Collaborative Data
9
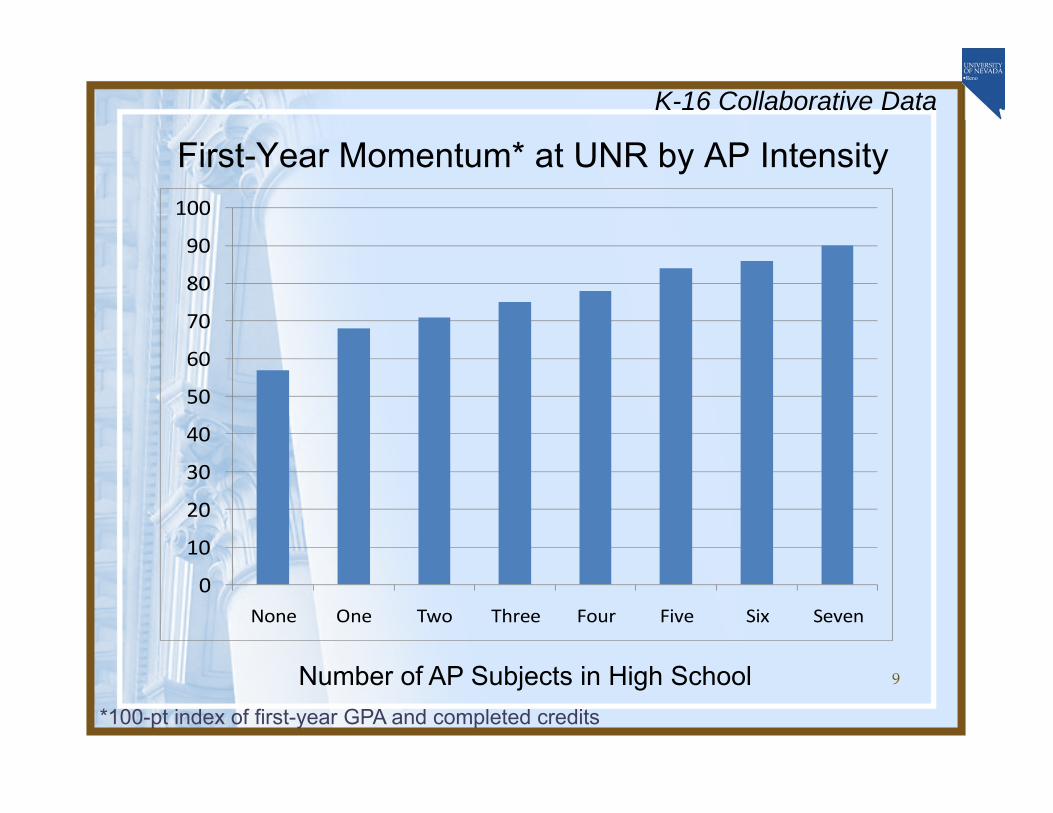
First-Year Momentum* at UNR by AP Intensity
0
10
20
30
40
50
60
70
80
90
100
None One Two Three Four Five Six Seven
Number of AP Subjects in High School*100-pt index of first-year GPA and completed credits
K-16 Collaborative Data
10
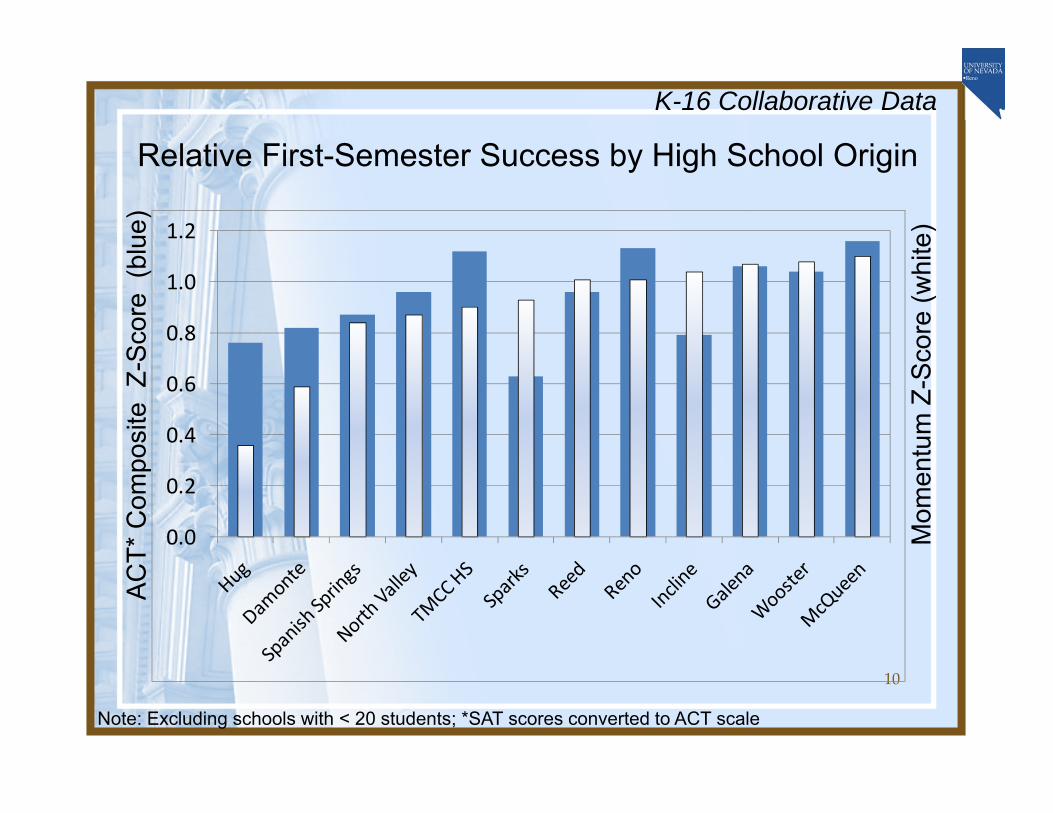
Relative First-Semester Success by High School Origin
0.0
0.2
0.4
0.6
0.8
1.0
1.2
Note: Excluding schools with < 20 students; *SAT scores converted to ACT scale
AC
T* C
ompo
site
Z-S
core
(bl
ue)
Mom
entu
m Z
-Sco
re (w
hite
)
K-16 Collaborative Data
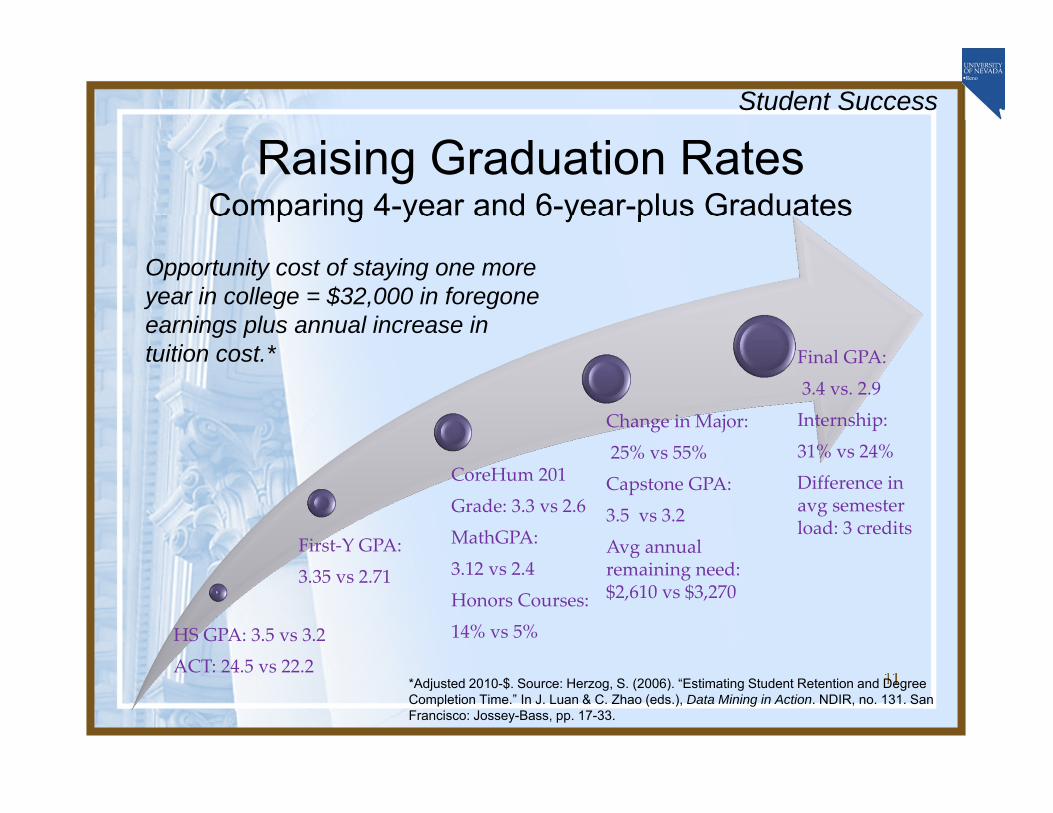
Raising Graduation RatesComparing 4-year and 6-year-plus Graduates
11
HS GPA: 3.5 vs 3.2
ACT: 24.5 vs 22.2
First‐Y GPA:
3.35 vs 2.71
CoreHum 201
Grade: 3.3 vs 2.6
MathGPA:
3.12 vs 2.4
Honors Courses:
14% vs 5%
Change in Major:
25% vs 55%
Capstone GPA:
3.5 vs 3.2
Avg annual remaining need: $2,610 vs $3,270
Final GPA:
3.4 vs. 2.9
Internship:
31% vs 24%
Difference in avg semester load: 3 credits
Opportunity cost of staying one more year in college = $32,000 in foregone earnings plus annual increase in tuition cost.*
*Adjusted 2010-$. Source: Herzog, S. (2006). “Estimating Student Retention and Degree Completion Time.” In J. Luan & C. Zhao (eds.), Data Mining in Action. NDIR, no. 131. San Francisco: Jossey-Bass, pp. 17-33.
Student Success
12
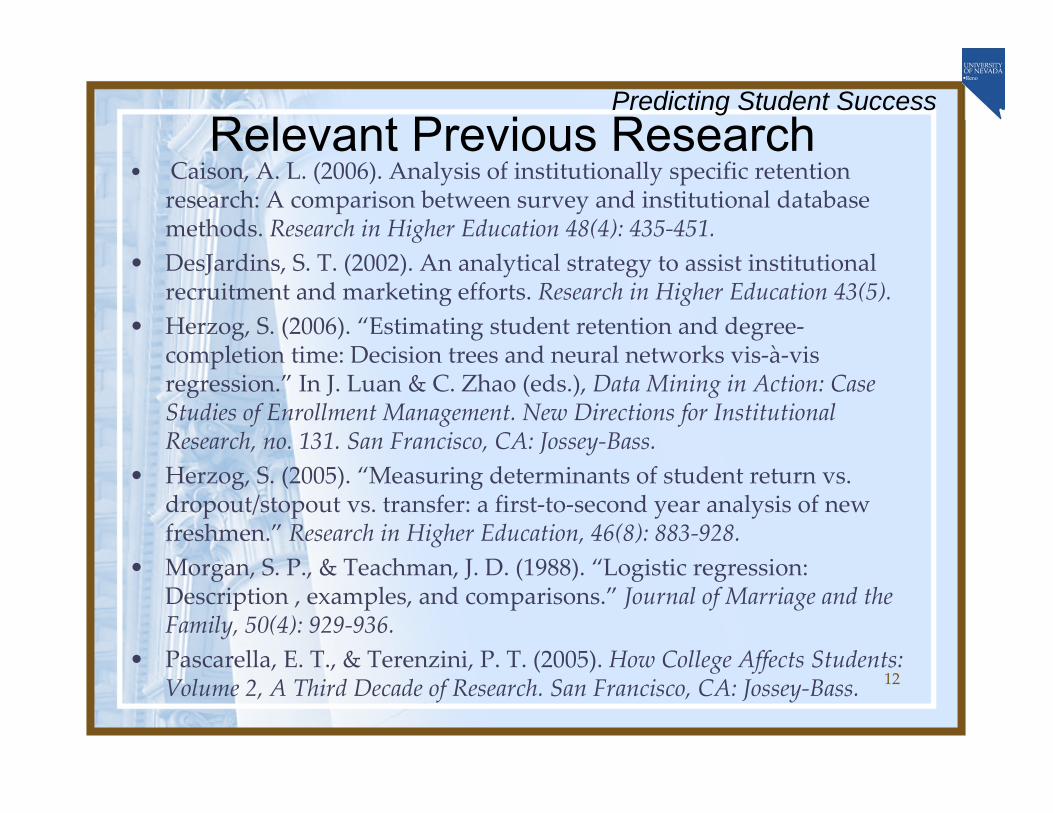
Relevant Previous Research• Caison, A. L. (2006). Analysis of institutionally specific retention
research: A comparison between survey and institutional database methods. Research in Higher Education 48(4): 435‐451.
• DesJardins, S. T. (2002). An analytical strategy to assist institutional recruitment and marketing efforts. Research in Higher Education 43(5).
• Herzog, S. (2006). “Estimating student retention and degree‐completion time: Decision trees and neural networks vis‐à‐vis regression.” In J. Luan & C. Zhao (eds.), Data Mining in Action: Case Studies of Enrollment Management. New Directions for Institutional Research, no. 131. San Francisco, CA: Jossey‐Bass.
• Herzog, S. (2005). “Measuring determinants of student return vs. dropout/stopout vs. transfer: a first‐to‐second year analysis of new freshmen.” Research in Higher Education, 46(8): 883‐928.
• Morgan, S. P., & Teachman, J. D. (1988). “Logistic regression: Description , examples, and comparisons.” Journal of Marriage and the Family, 50(4): 929‐936.
• Pascarella, E. T., & Terenzini, P. T. (2005). How College Affects Students: Volume 2, A Third Decade of Research. San Francisco, CA: Jossey‐Bass.
Predicting Student Success

13
At-Risk Forecasting Model• Identify at-risk freshmen students after initial
matriculation for early intervention program• Develop coefficients for predictors determining student
fall-to-spring/fall dropout risk– Logistic regression model using historical cohorts as training
dataset– Maximize prediction accuracy with balanced dataset
• Dropout risk scoring for new freshmen– Transformation of the logit(p) into probability scores– Decile grouping of scored students– Compare deciles with actual enrollment and other predicted
enrollment (MAP-Works: http://www.unr.edu/mapworks)
• Reporting of dropout risk via secure online access
Predicting Student Success

14
Data DescriptionPredicting Student Success
• Data sources– Matriculation system (SIS legacy, Peoplesoft, DW)– MAP-Works
• Student cohorts– New full-time freshmen (excl. foreign students)– Fall entry ‘02-’09 for model dev. (training set, N=17,311)– Fall entry 2010 for model validation (holdout set, N=2,527)
• Data elements at start of first semester– Student demographics (age, gender, ethn/race, residency)– Academic preparation (high school GPA/test score index)– Financial aid profile (unmet need, Pell, loans, scholarships)– Credits enrolled, campus housing (y/n), athlete (y/n)
• Data elements after start of first semester– MAP-Works survey risk scores (Sep., Nov., Feb)

15
Data Management Tasks• Exploratory data analysis
– Variable selection (bivariate regression on outcome variable)– Variable coding (continuous/categorical/dummy in logit model)– Missing data imputation, constant-$ conversion (fin. aid data)– Composite variable(s)
• Acad prep index = (HSGPA*12.5)+(ACTM*.69)+(ACTE*.69)– Variables excluded: college remediation, ACT/SAT test date
• Logistic regression model– Maximize model fit (-2LL test/score, pseudo R2, HL sig.)– Create balanced sample in training dataset to optimize correct
classification rate (CCR) for enrollees vs. non-enrollees (i.e. model sensitivity vs. specificity): all non-enrollees plus random sample of enrollees of ~ equal N)
Predicting Student Success
16
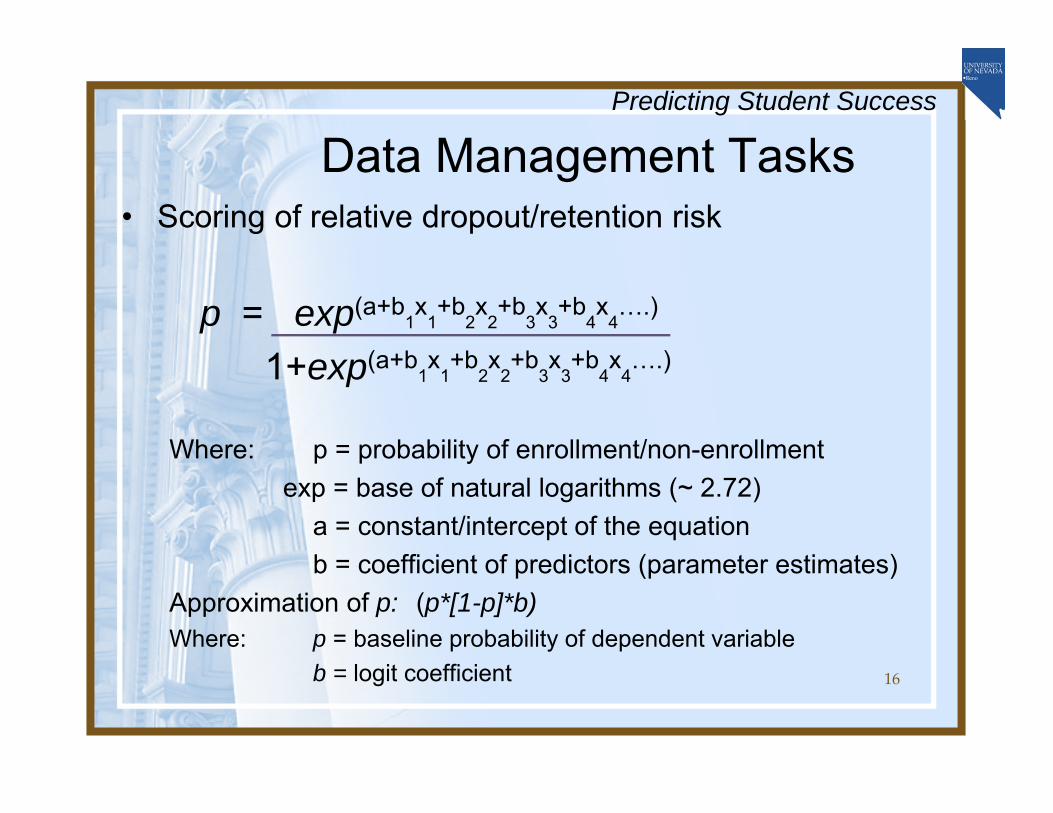
Data Management Tasks• Scoring of relative dropout/retention risk
p = exp(a+b1x
1+b
2x
2+b
3x
3+b
4x
4….)
1+exp(a+b1x
1+b
2x
2+b
3x
3+b
4x
4….)
Where: p = probability of enrollment/non-enrollmentexp = base of natural logarithms (~ 2.72)
a = constant/intercept of the equationb = coefficient of predictors (parameter estimates)
Approximation of p: (p*[1-p]*b)Where: p = baseline probability of dependent variable
b = logit coefficient
Predicting Student Success

Selected Factors and Spring RetentionFall Cohorts 2002-09 (N=17,311)
17
Predicting Student Success
Decile (Low to High)
Retention Ra
te
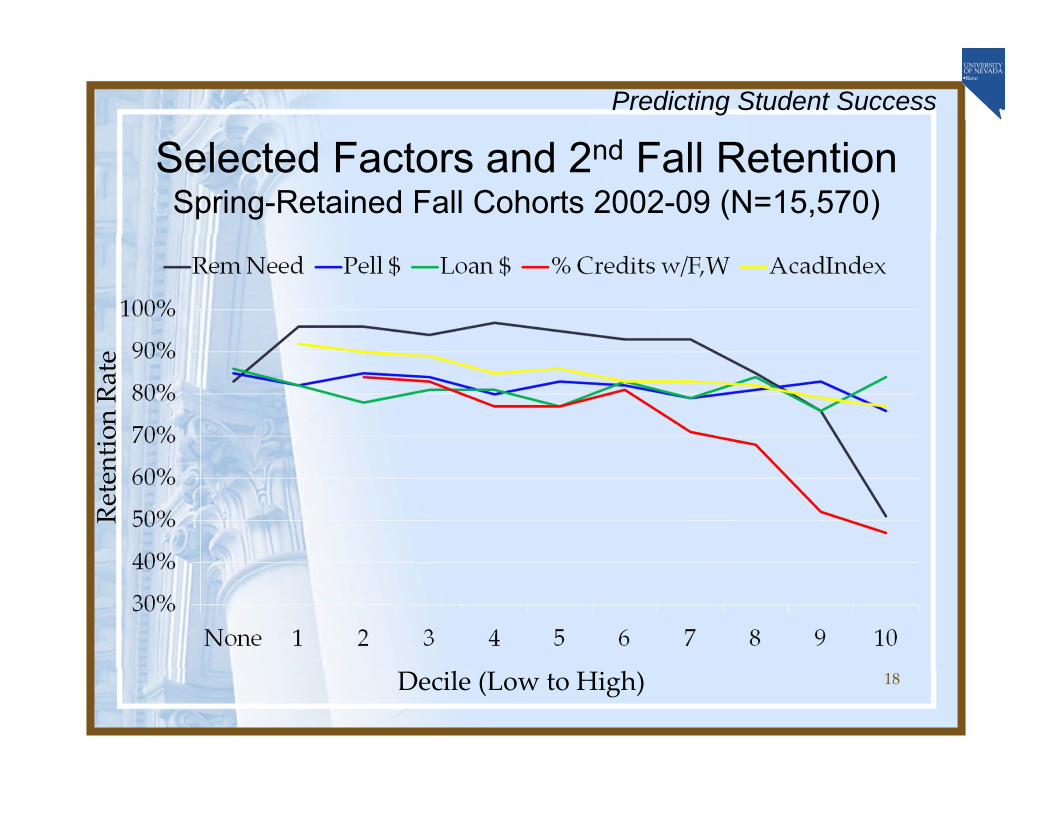
Selected Factors and 2nd Fall RetentionSpring-Retained Fall Cohorts 2002-09 (N=15,570)
18
Predicting Student Success
Decile (Low to High)
Retention Ra
te

Data Analysis
19
Predicting Student Success
Model tries to maximize correct prediction of at-risk students (non-enrollees), so they can be focused on, without raising the chance of selecting non-risk students (i.e. beyond OR = 1 or CCR = 0.5).
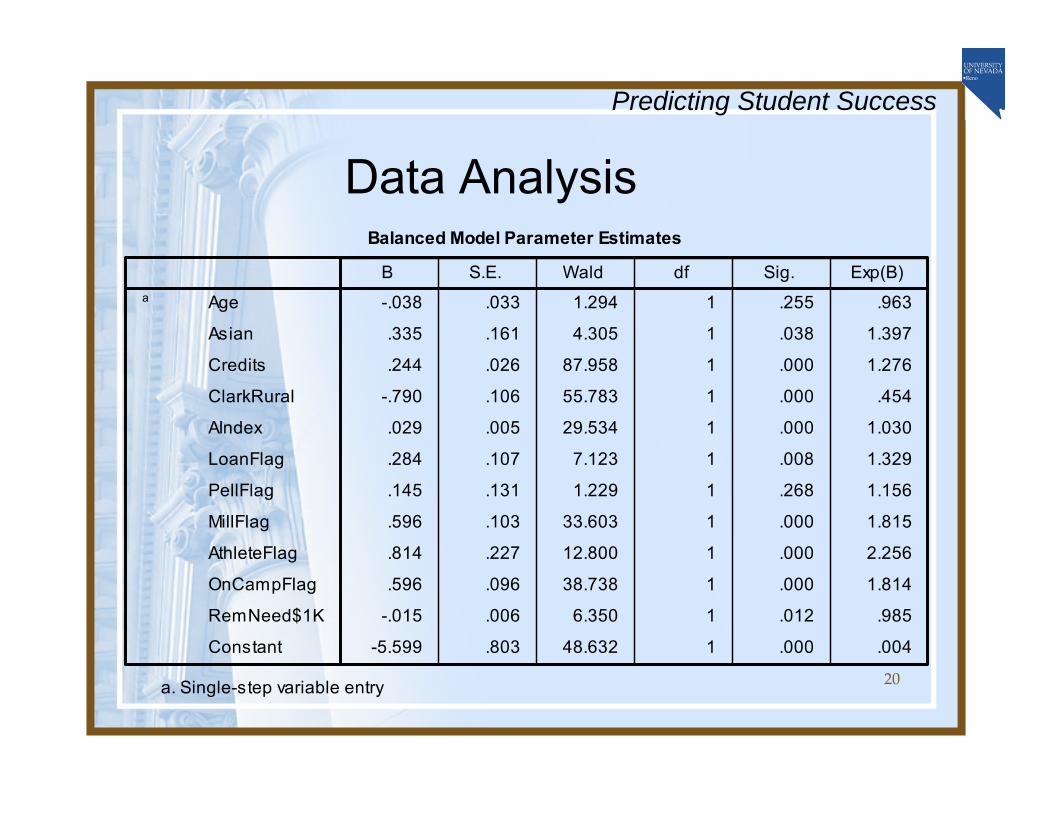
Data Analysis
20
Predicting Student Success
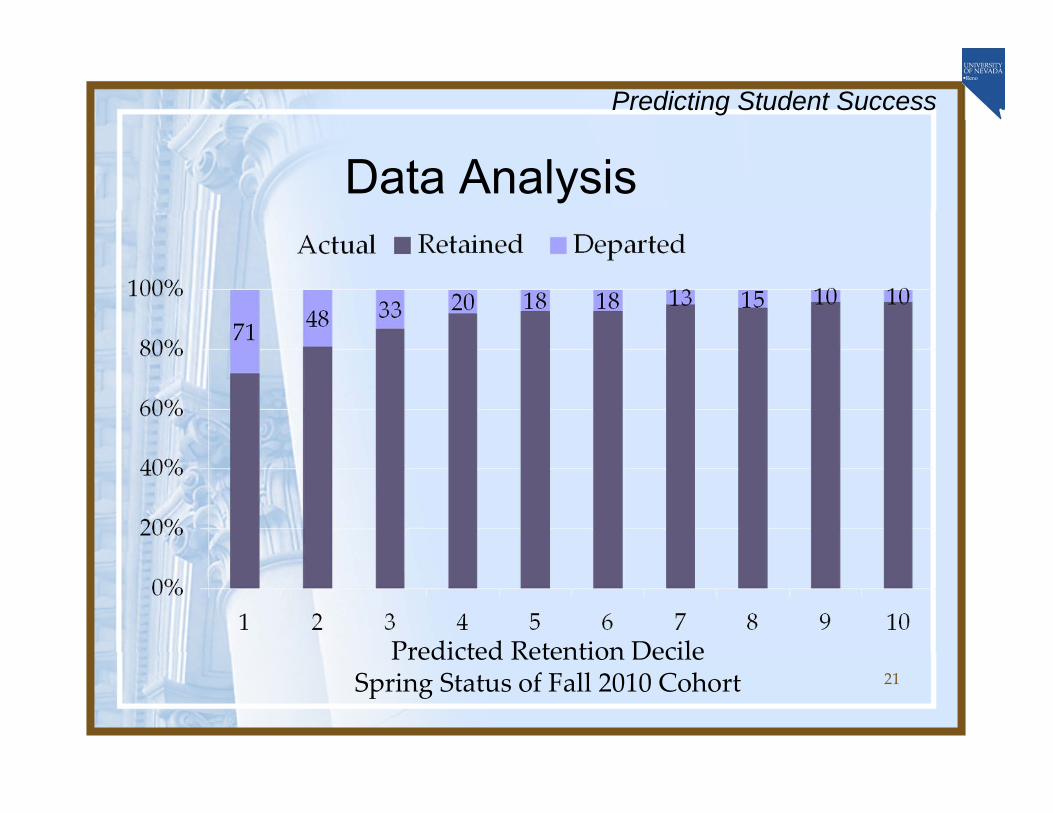
Data Analysis
21
Predicting Student Success
Predicted Retention DecileSpring Status of Fall 2010 Cohort
Data Analysis
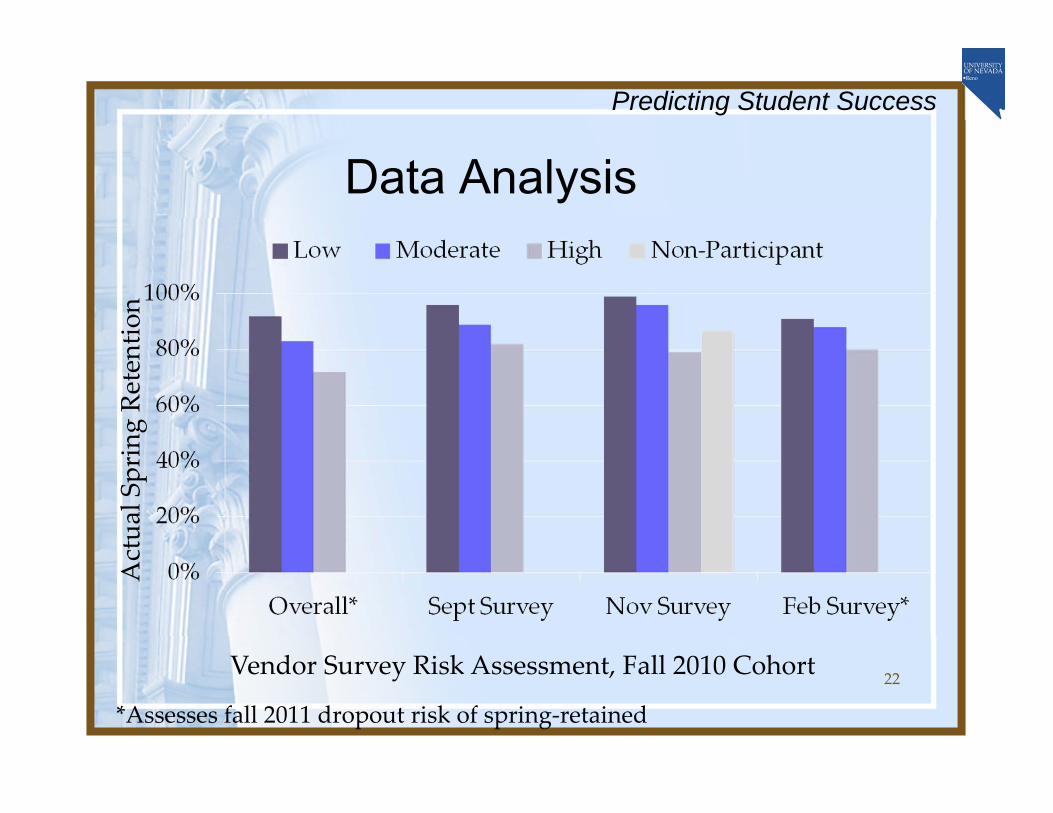
22
Predicting Student Success
Vendor Survey Risk Assessment, Fall 2010 Cohort
Actua
l Spring Re
tention
*Assesses fall 2011 dropout risk of spring‐retained
Gauging Survey Value
23
Predicting Student Success
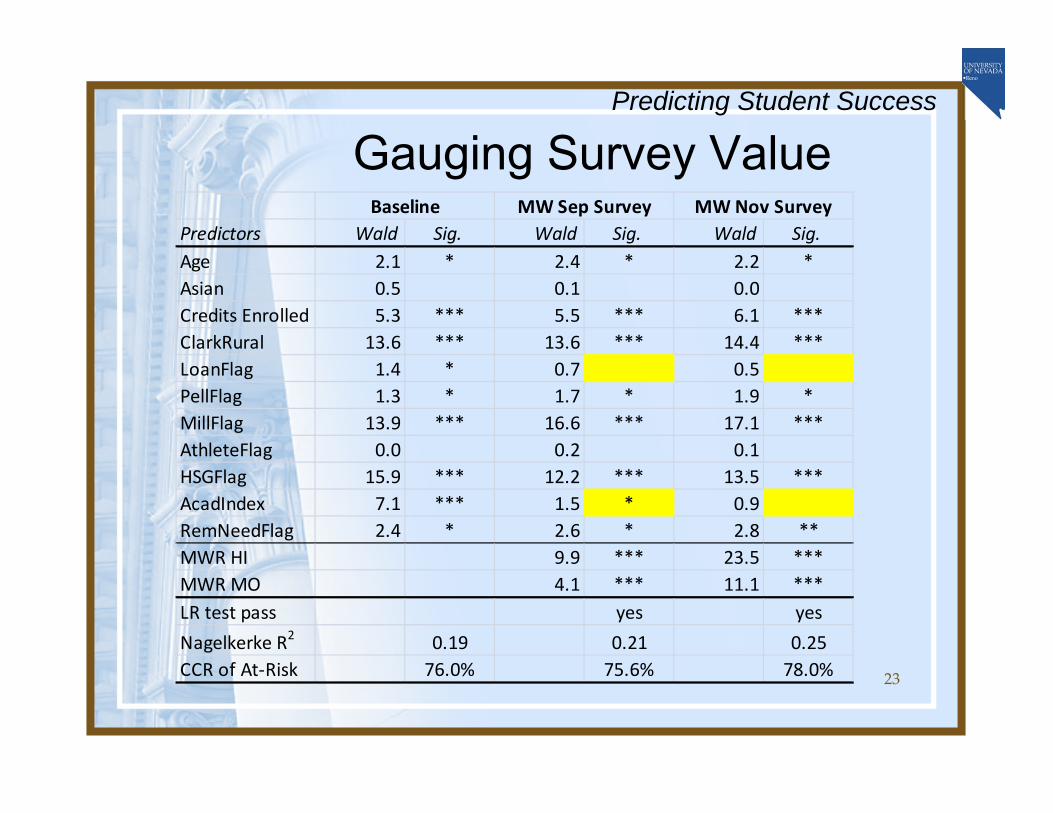
Predictors Wald Sig. Wald Sig. Wald Sig.Age 2.1 * 2.4 * 2.2 *Asian 0.5 0.1 0.0 Credits Enrolled 5.3 *** 5.5 *** 6.1 ***ClarkRural 13.6 *** 13.6 *** 14.4 ***LoanFlag 1.4 * 0.7 0.5 PellFlag 1.3 * 1.7 * 1.9 *MillFlag 13.9 *** 16.6 *** 17.1 ***AthleteFlag 0.0 0.2 0.1 HSGFlag 15.9 *** 12.2 *** 13.5 ***AcadIndex 7.1 *** 1.5 * 0.9 RemNeedFlag 2.4 * 2.6 * 2.8 **MWR HI 9.9 *** 23.5 ***MWR MO 4.1 *** 11.1 ***LR test pass yes yesNagelkerke R2 0.19 0.21 0.25CCR of At‐Risk 76.0% 75.6% 78.0%
Baseline MW Sep Survey MW Nov Survey
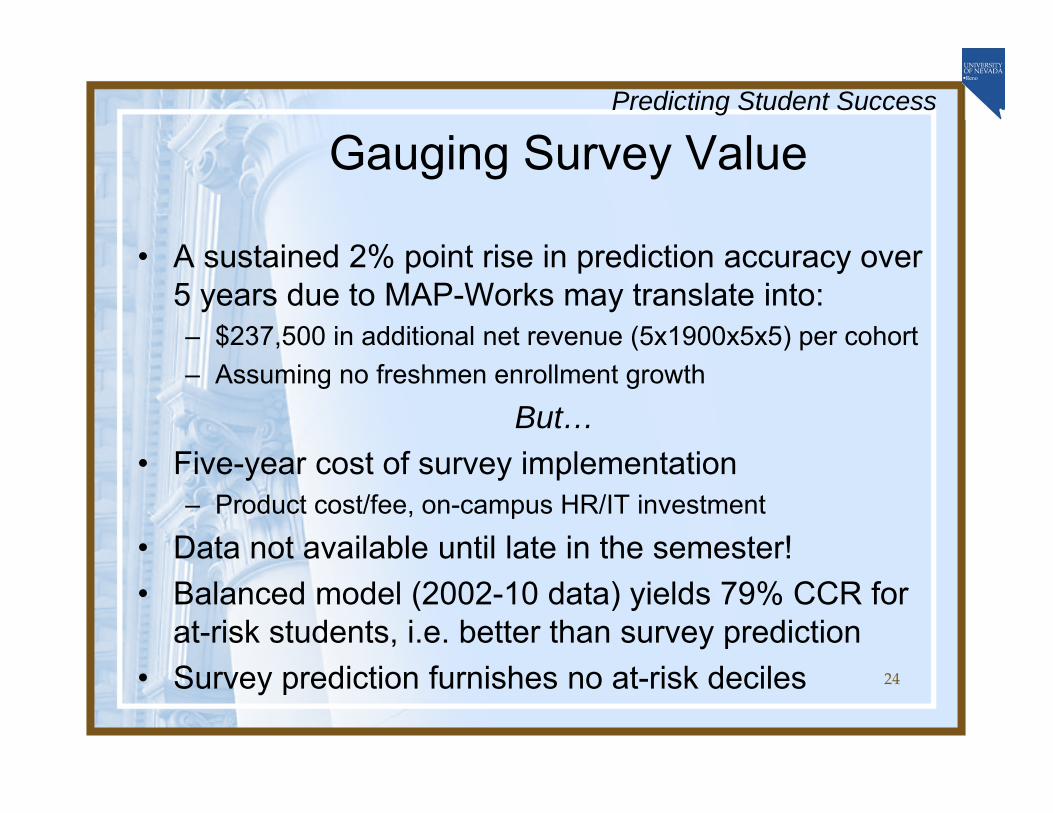
Gauging Survey Value
• A sustained 2% point rise in prediction accuracy over 5 years due to MAP-Works may translate into: – $237,500 in additional net revenue (5x1900x5x5) per cohort– Assuming no freshmen enrollment growth
But…• Five-year cost of survey implementation
– Product cost/fee, on-campus HR/IT investment
• Data not available until late in the semester!• Balanced model (2002-10 data) yields 79% CCR for
at-risk students, i.e. better than survey prediction• Survey prediction furnishes no at-risk deciles 24
Predicting Student Success
25
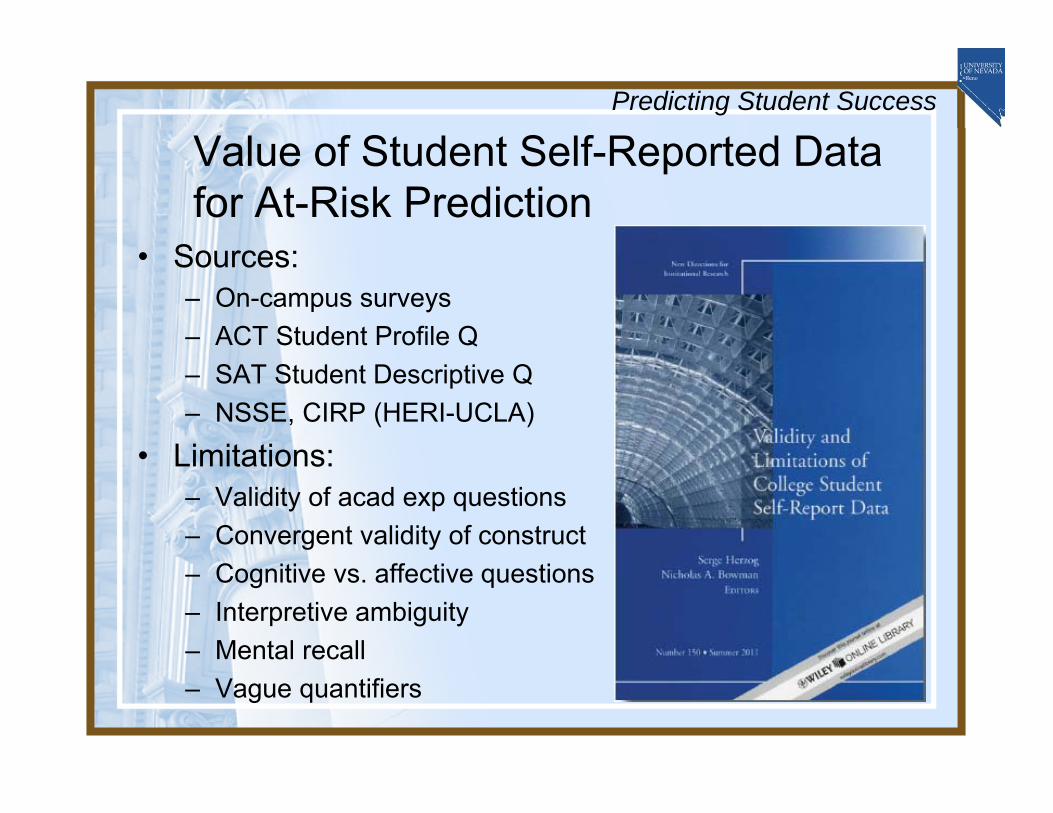
Value of Student Self-Reported Data for At-Risk Prediction
• Sources:– On-campus surveys– ACT Student Profile Q– SAT Student Descriptive Q– NSSE, CIRP (HERI-UCLA)
• Limitations:– Validity of acad exp questions– Convergent validity of construct– Cognitive vs. affective questions– Interpretive ambiguity– Mental recall– Vague quantifiers
Predicting Student Success
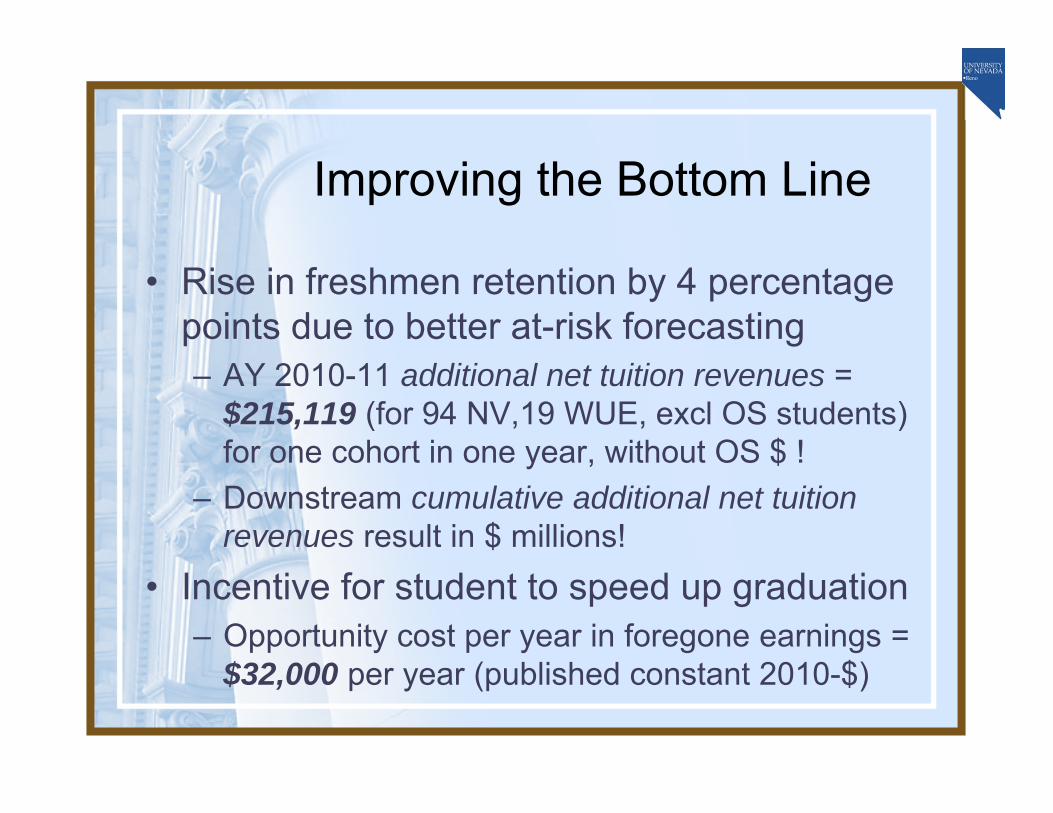
Improving the Bottom Line
• Rise in freshmen retention by 4 percentage points due to better at-risk forecasting– AY 2010-11 additional net tuition revenues =
$215,119 (for 94 NV,19 WUE, excl OS students) for one cohort in one year, without OS $ !
– Downstream cumulative additional net tuition revenues result in $ millions!
• Incentive for student to speed up graduation– Opportunity cost per year in foregone earnings =
$32,000 per year (published constant 2010-$)
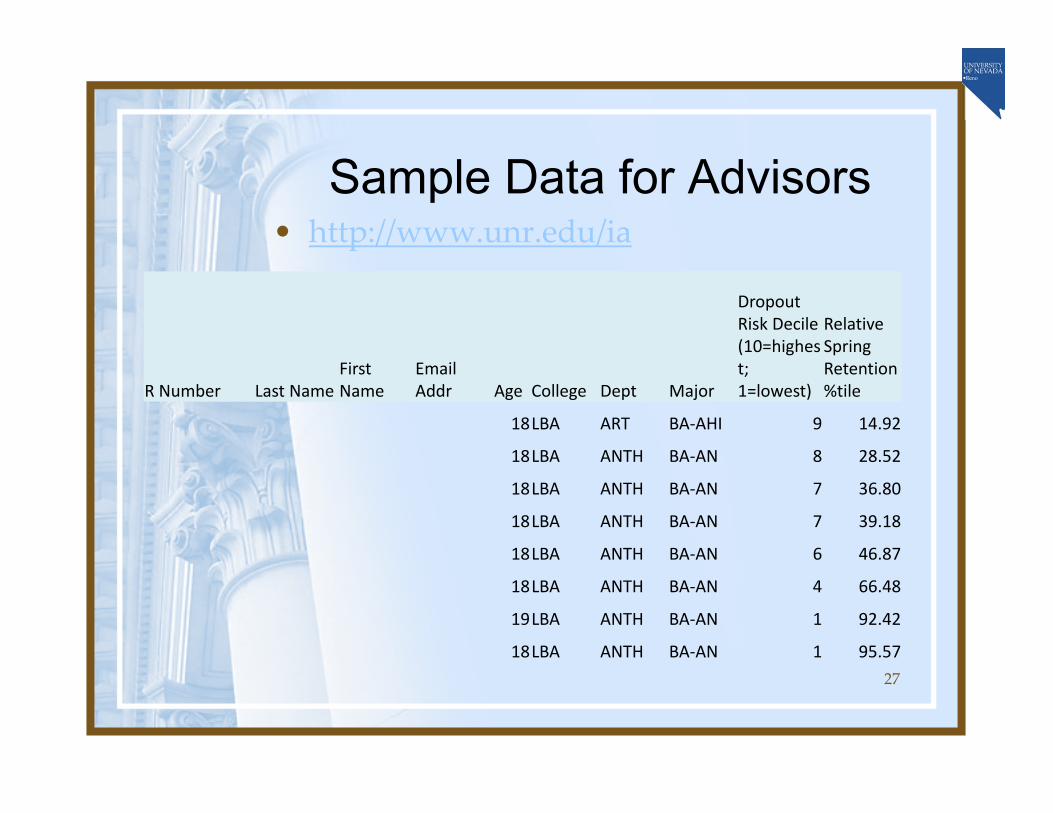
Sample Data for Advisors• http://www.unr.edu/ia
27
R Number Last NameFirst Name
Email Addr Age College Dept Major
Dropout Risk Decile(10=highest; 1=lowest)
Relative Spring Retention %tile
18LBA ART BA‐AHI 9 14.92
18LBA ANTH BA‐AN 8 28.52
18LBA ANTH BA‐AN 7 36.80
18LBA ANTH BA‐AN 7 39.18
18LBA ANTH BA‐AN 6 46.87
18LBA ANTH BA‐AN 4 66.48
19LBA ANTH BA‐AN 1 92.42
18LBA ANTH BA‐AN 1 95.57
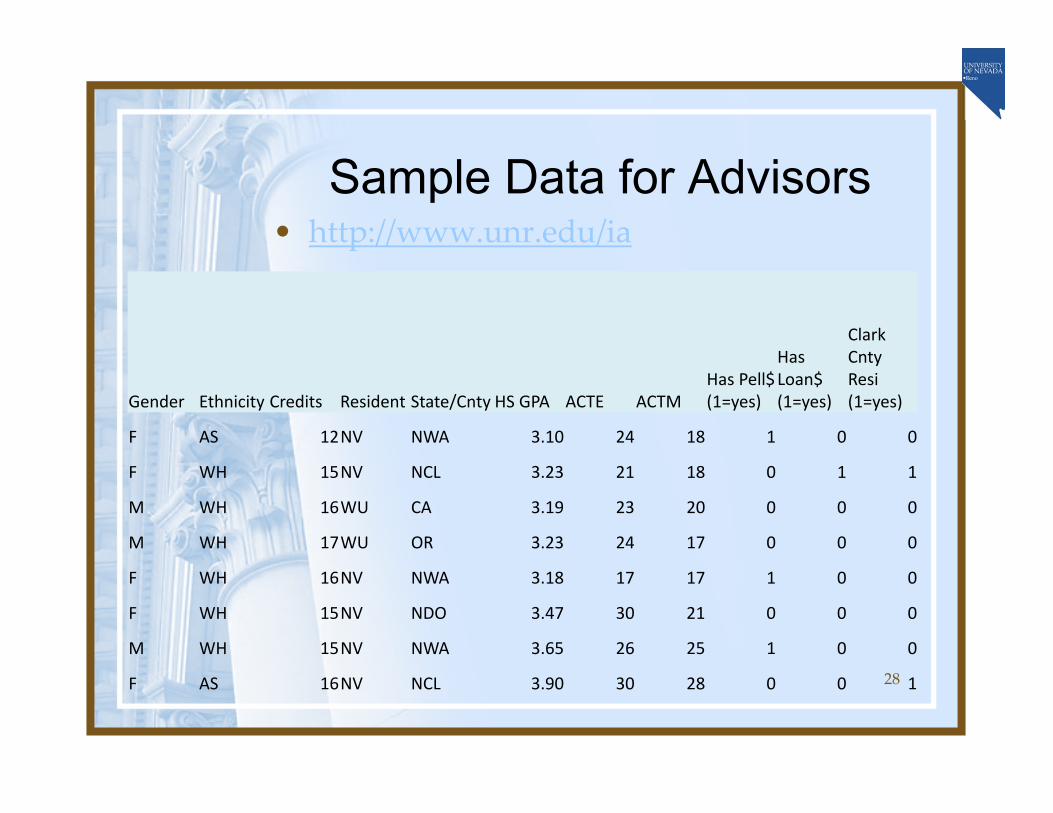
Sample Data for Advisors• http://www.unr.edu/ia
28
Gender Ethnicity Credits Resident State/Cnty HS GPA ACTE ACTMHas Pell$ (1=yes)
Has Loan$ (1=yes)
Clark Cnty Resi (1=yes)
F AS 12NV NWA 3.10 24 18 1 0 0
F WH 15NV NCL 3.23 21 18 0 1 1
M WH 16WU CA 3.19 23 20 0 0 0
M WH 17WU OR 3.23 24 17 0 0 0
F WH 16NV NWA 3.18 17 17 1 0 0
F WH 15NV NDO 3.47 30 21 0 0 0
M WH 15NV NWA 3.65 26 25 1 0 0
F AS 16NV NCL 3.90 30 28 0 0 1

Impact of this At-Risk Forecasting Model
• University Retention Rates Hold Steady As States Balance Access with Success. Scripps Howard Foundation Wire, April 15, 2011.
• Managing Talent: HCM and Higher Education. Campus Technology Magazine, October 2010, Vol. 24 Number 2, pp. 36‐42.
• From Data to Information: Business Intelligence and Its Role in Higher Education Today. University Business Magazine, January 2009, pp. 25‐27.
• Consulting services to IR offices at institutions in Arizona, California, Hawaii, and Texas.

Predictive Analytics at U. of Hawaii
• New freshmen at the University of Hawai ̒i at Mānoa, Hawai ̒i’s flagship public research university.
• 78% retention rate. 4 percentage points below peer group average. Rate flat for last 15 years.
• Excellent data storage, infrastructure, and IR reporting.
• Growing need to convert data results into actionable strategies.
Predictive Analytics at U. of Hawaii
• Relevant previous research has provided a suitable starting point for developing at-risk student forecasting model.
• Freshmen regression model has been well-received by campus stakeholders.
• Mānoa IR now moving from model building to implementation.
• IR and Advising staff from U. of Nevada-Reno travelled to Mānoa to share insights on implementing predictive analytics.

Takeaway from Collaboration
• Early-alert data key• Identify results that are actionable.• Support for student advising• Involve colleges and departments.• Ways to increase awareness of
retention and graduation rates– Campaigns– Showing impact on the bottom line
Improving the Bottom Line at the University of Hawaii
• 388 freshmen from 2010 dropped out in year one.
• Retaining 26 students from 2010 would have improved Mānoa’soverall retention rate from 78.6% to 80%.
• Additional Revenue from Tuition and Fees = $259,920 (for 18 HI, 8 WUE, excludes OS).
• Are there 26 students in this group that we can help/retain?
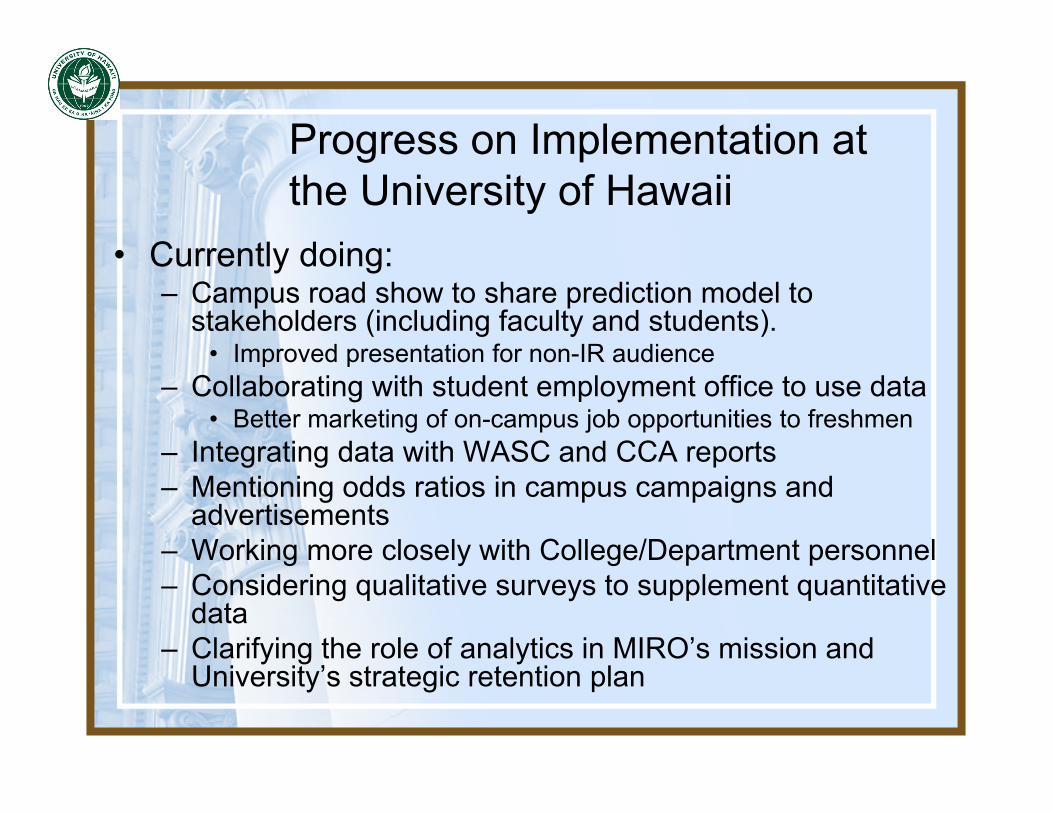
Progress on Implementation at the University of Hawaii
• Currently doing:– Campus road show to share prediction model to
stakeholders (including faculty and students).• Improved presentation for non-IR audience
– Collaborating with student employment office to use data• Better marketing of on-campus job opportunities to freshmen
– Integrating data with WASC and CCA reports– Mentioning odds ratios in campus campaigns and
advertisements– Working more closely with College/Department personnel– Considering qualitative surveys to supplement quantitative
data– Clarifying the role of analytics in MIRO’s mission and
University’s strategic retention plan
Barriers to Implementation at the University of Hawaii
• Culture change• Wary of misuse of
data• More accountability• Faculty buy-in
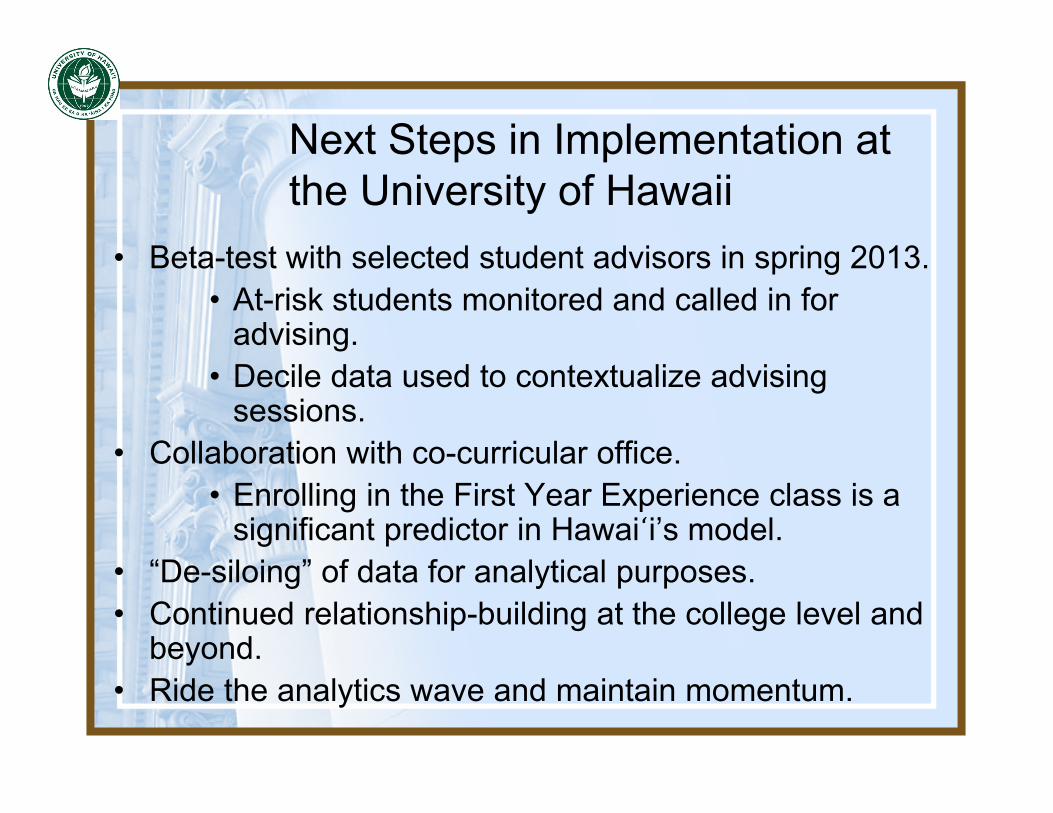
Next Steps in Implementation at the University of Hawaii
• Beta-test with selected student advisors in spring 2013.• At-risk students monitored and called in for
advising.• Decile data used to contextualize advising
sessions.• Collaboration with co-curricular office.
• Enrolling in the First Year Experience class is a significant predictor in Hawai ̒i’s model.
• “De-siloing” of data for analytical purposes.• Continued relationship-building at the college level and
beyond.• Ride the analytics wave and maintain momentum.
37
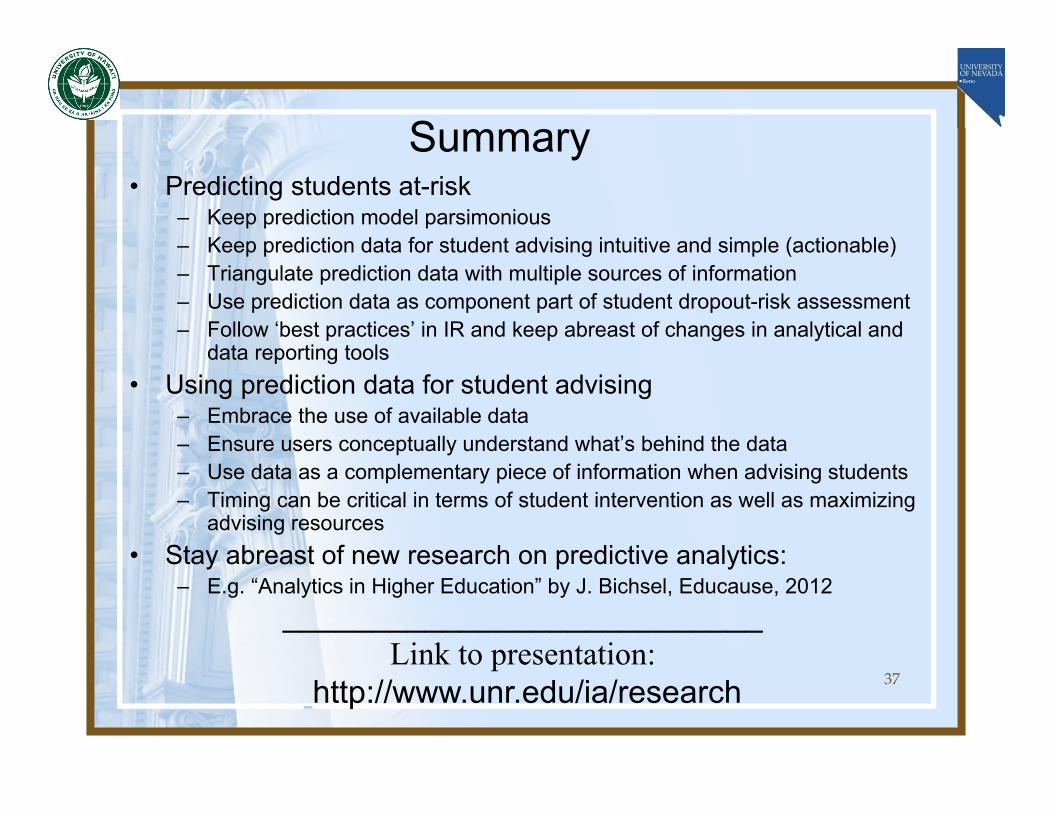
Summary• Predicting students at-risk
– Keep prediction model parsimonious– Keep prediction data for student advising intuitive and simple (actionable)– Triangulate prediction data with multiple sources of information– Use prediction data as component part of student dropout-risk assessment– Follow ‘best practices’ in IR and keep abreast of changes in analytical and
data reporting tools• Using prediction data for student advising
– Embrace the use of available data– Ensure users conceptually understand what’s behind the data– Use data as a complementary piece of information when advising students– Timing can be critical in terms of student intervention as well as maximizing
advising resources• Stay abreast of new research on predictive analytics:
– E.g. “Analytics in Higher Education” by J. Bichsel, Educause, 2012___________________________
Link to presentation:http://www.unr.edu/ia/research