Embed Size (px)
Citation preview
DOC ID© Chevron 2005
Using Sensors to Monitor Biodegradation in the subsurface
Dong LiChevron Energy Technology CompanySeptember 19, 2008
Sensors© Chevron 2007 2
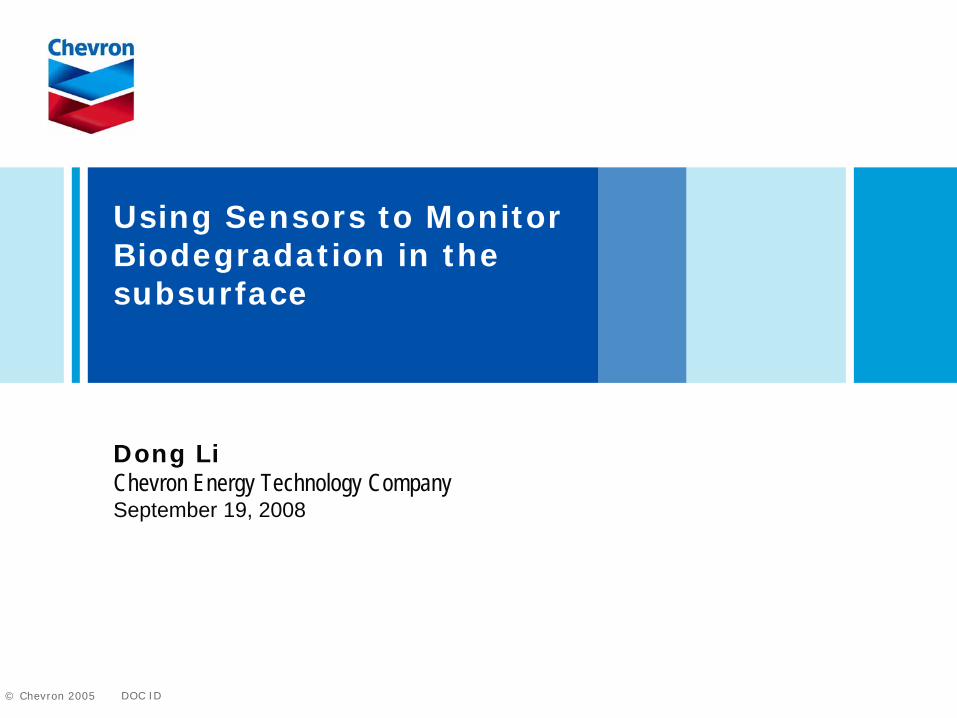
Why Use Sensors?
Diurnal Changes in Pressure and Concentration
-5-4-3-2-10123456
0 1 2 3 4 5 6 7 8 9Time (day)
Con
cent
ratio
n (p
pm)
Pre
ssur
e (0
.1"
H2O
)Combustable gas concentration near surfaceDifferential pressure between 0 - 40 fbg
Sensors© Chevron 2007 3
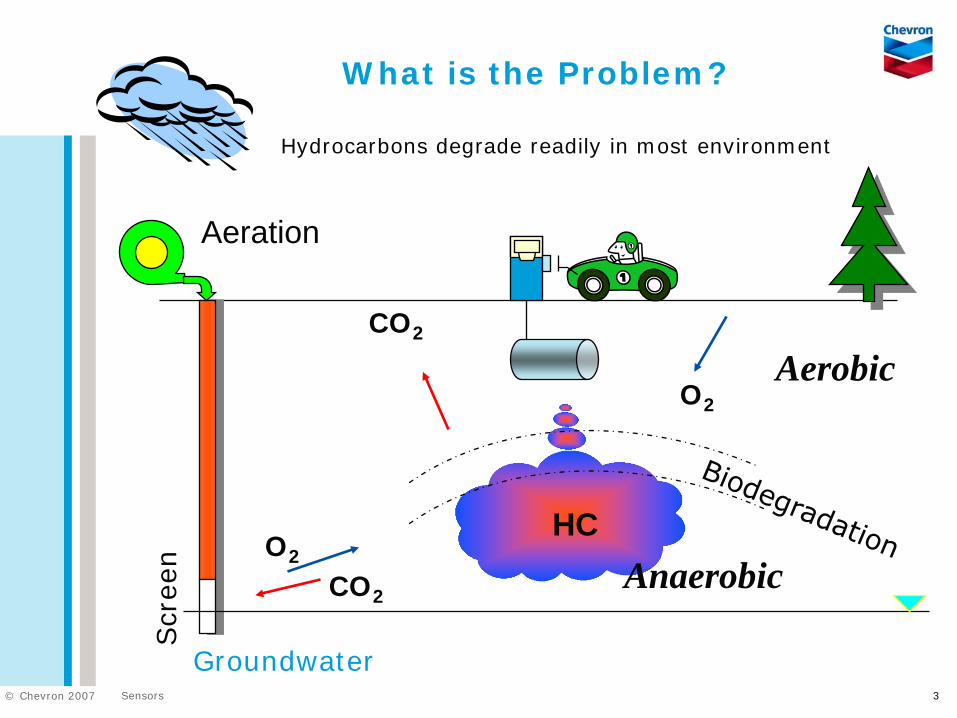
What is the Problem?
Aeration
HC
Aerobic
Anaerobic
CO2
O2
O2
Scr
een
CO2
Groundwater
Hydrocarbons degrade readily in most environment
Sensors© Chevron 2007 4
Why Monitor Biodegradation?
Hydrocarbon biodegradation process is normally not visible
There is no easy way to determine:
Is it working?
How long will it take?
Any Process adjustment?
aeration rate, water, nutrients, …
When can we stop?
Monitoring is the key to bioremediation success
Sensors© Chevron 2007 5
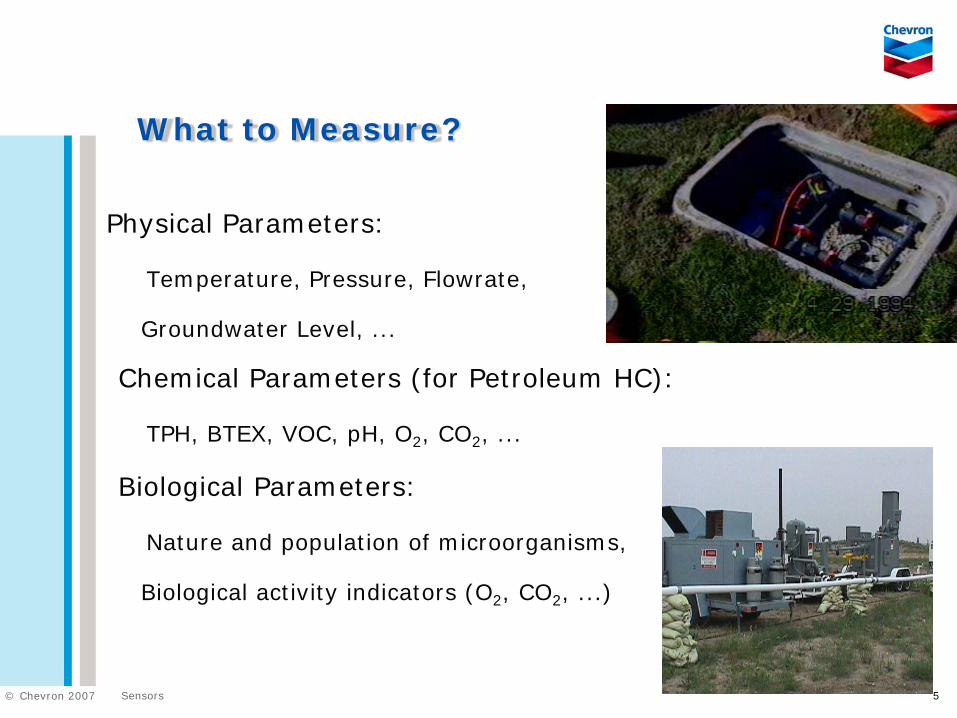
What to Measure?
Physical Parameters:
Temperature, Pressure, Flowrate,
Groundwater Level, ...
Chemical Parameters (for Petroleum HC):
TPH, BTEX, VOC, pH, O2, CO2, ...
Biological Parameters:
Nature and population of microorganisms,
Biological activity indicators (O2, CO2, ...)
Sensors© Chevron 2007 6
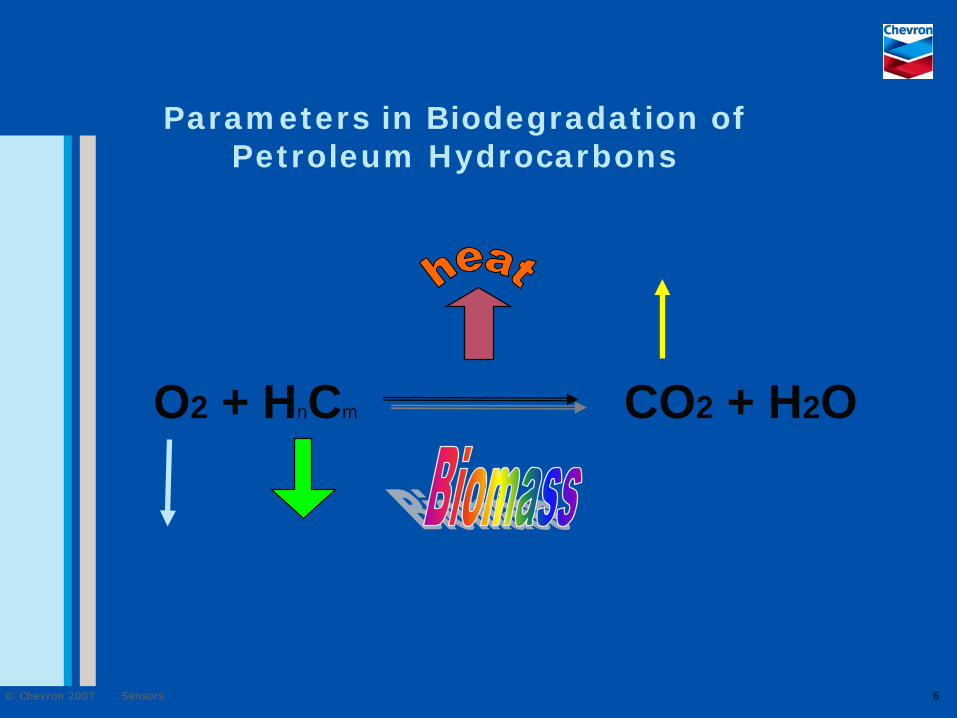
Parameters in Biodegradation of Petroleum Hydrocarbons
O2 + HnCm CO2 + H2O
Sensors© Chevron 2007 7
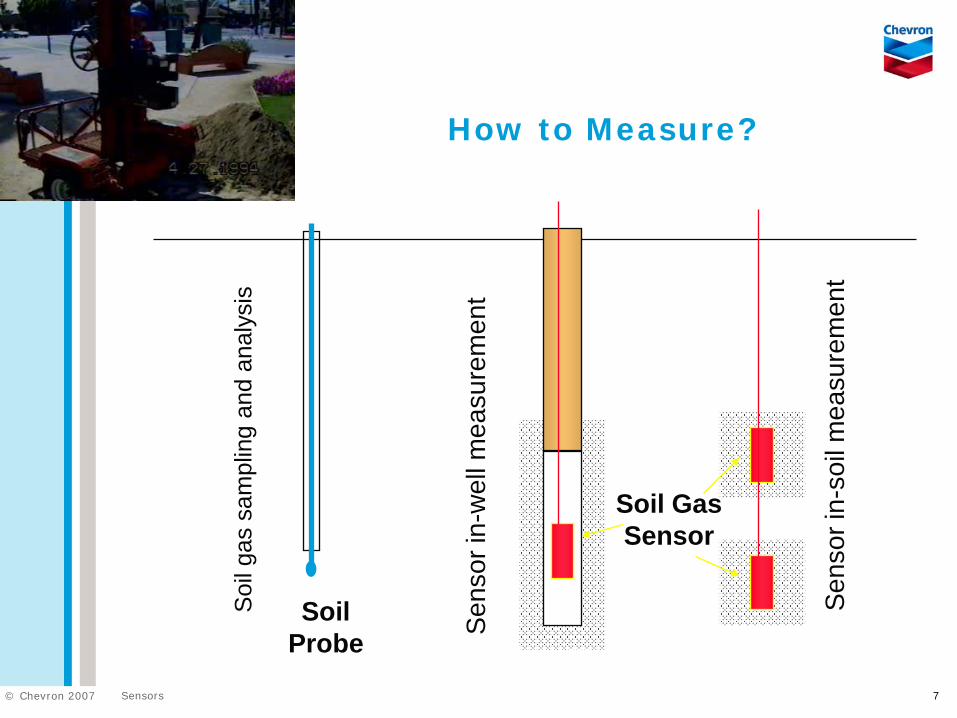
How to Measure?
Soil GasSensor
Sens
or in
-wel
l mea
sure
men
t
Sens
or in
-soi
l mea
sure
men
t
Soi
l gas
sam
plin
g an
d an
alys
is
SoilProbe
Sensors© Chevron 2007 8
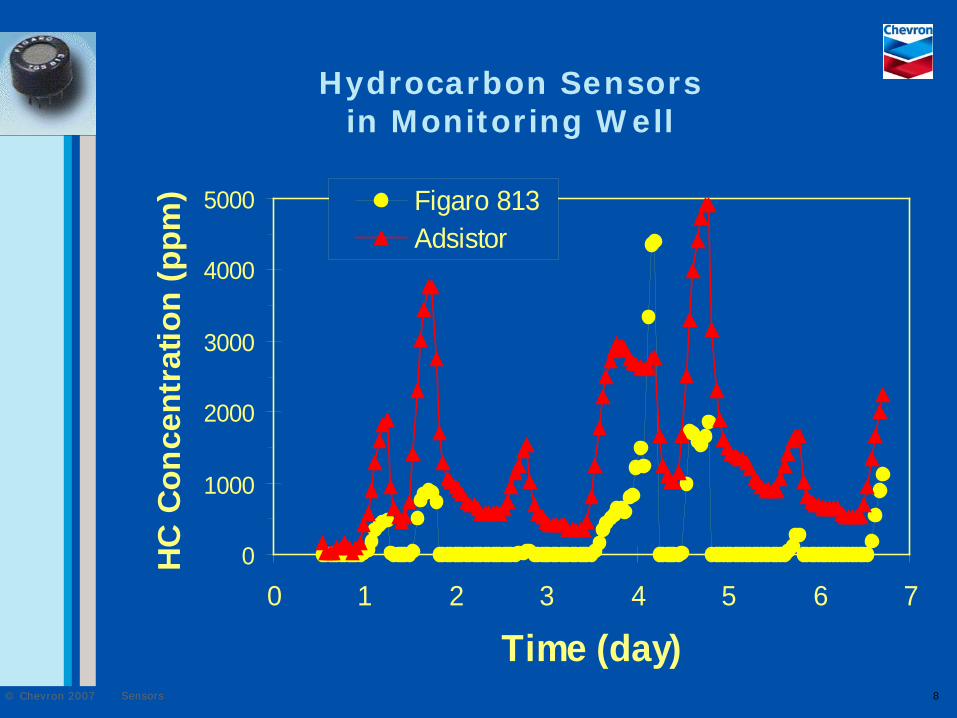
Hydrocarbon Sensors in Monitoring Well
0
1000
2000
3000
4000
5000
0 1 2 3 4 5 6 7
Time (day)
HC
Con
cent
ratio
n (p
pm) Figaro 813
Adsistor
Sensors© Chevron 2007 9
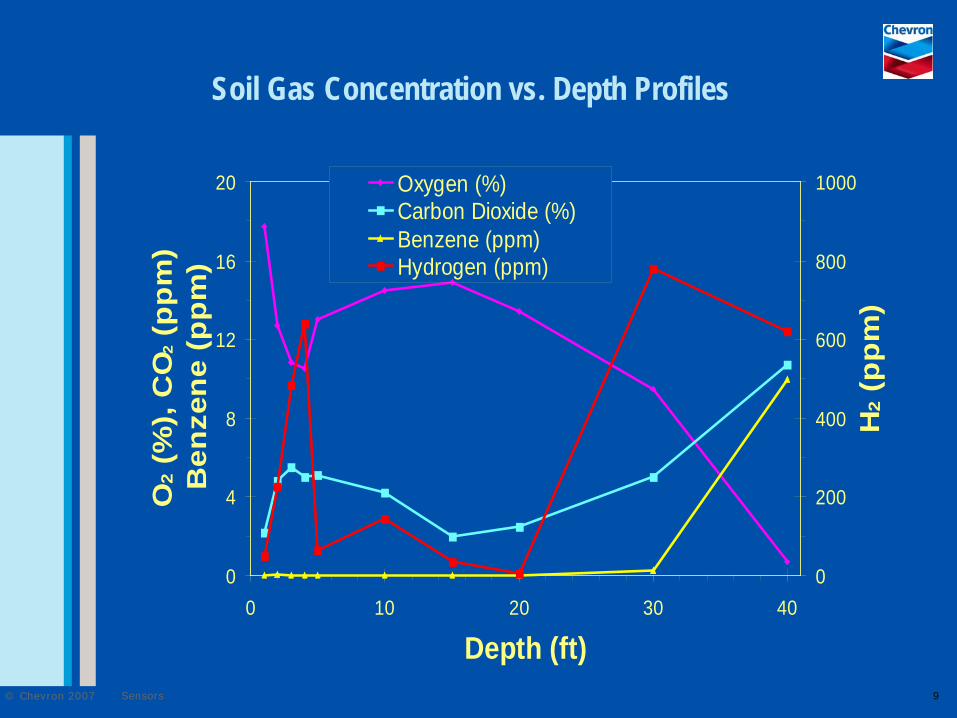
Soil Gas Concentration vs. Depth Profiles
0
4
8
12
16
20
0 10 20 30 40
Depth (ft)
O2
(%),
CO
2 (p
pm
)B
enze
ne
(pp
m)
0
200
400
600
800
1000
H2
(pp
m)
Oxygen (%)Carbon Dioxide (%)Benzene (ppm)Hydrogen (ppm)
Sensors© Chevron 2007 10
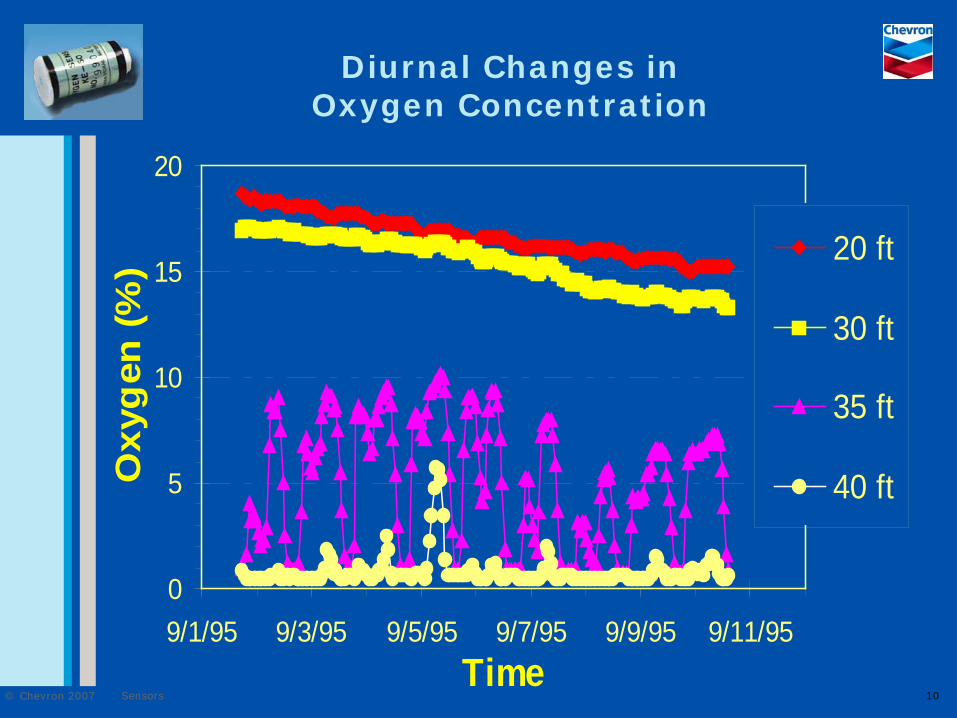
0
5
10
15
20
9/1/95 9/3/95 9/5/95 9/7/95 9/9/95 9/11/95Time
Oxy
gen
(%) 20 ft
30 ft
35 ft
40 ft
Diurnal Changes in Oxygen Concentration
Sensors© Chevron 2007 11
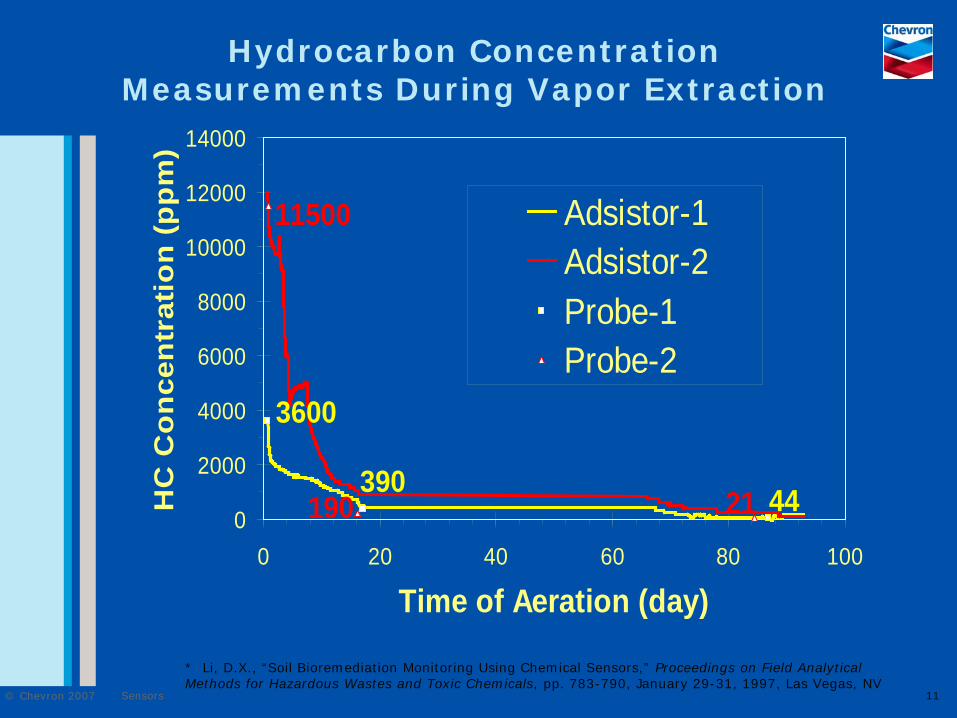
Hydrocarbon Concentration Measurements During Vapor Extraction
3600
390 44
11500
190 210
2000
4000
6000
8000
10000
12000
14000
0 20 40 60 80 100
Time of Aeration (day)
HC
Co
nce
ntr
atio
n (
pp
m)
Adsistor-1Adsistor-2Probe-1Probe-2
* Li, D.X., “Soil Bioremediation Monitoring Using Chemical Sensors,” Proceedings on Field Analytical Methods for Hazardous Wastes and Toxic Chemicals, pp. 783-790, January 29-31, 1997, Las Vegas, NV
Sensors© Chevron 2007 12
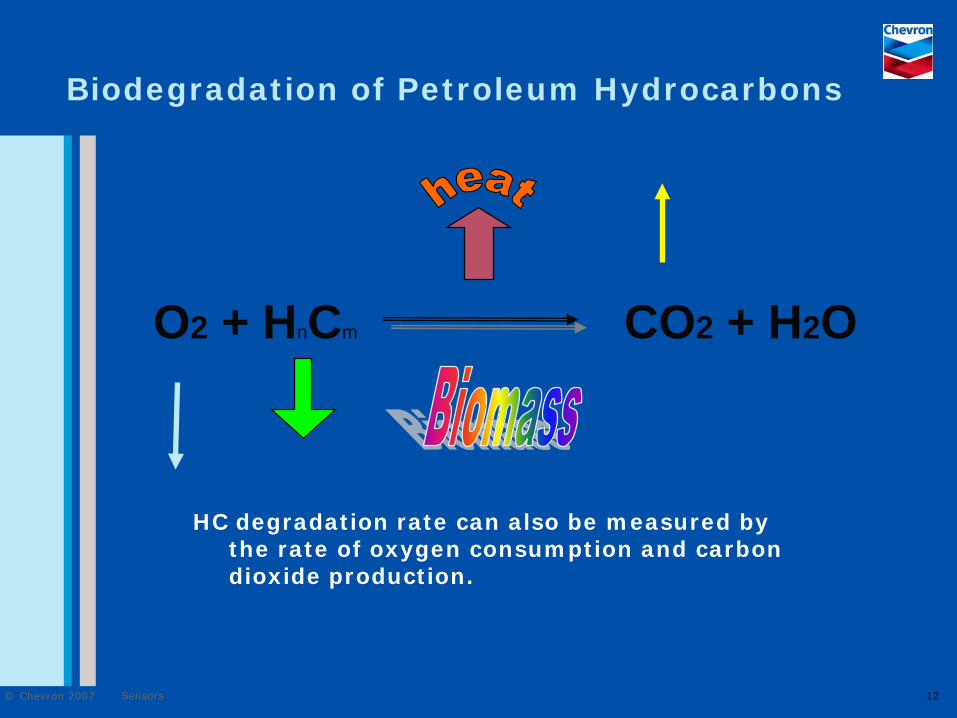
Biodegradation of Petroleum Hydrocarbons
O2 + HnCm CO2 + H2O
HC degradation rate can also be measured by the rate of oxygen consumption and carbon dioxide production.
Sensors© Chevron 2007 13
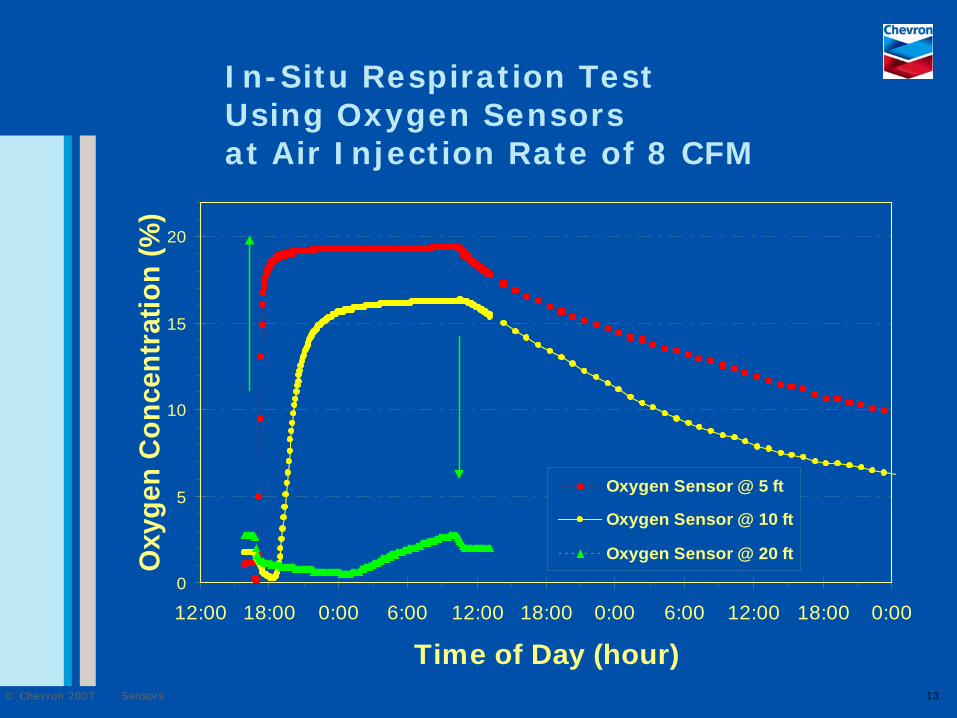
In-Situ Respiration Test Using Oxygen Sensors at Air Injection Rate of 8 CFM
0
5
10
15
20
12:00 18:00 0:00 6:00 12:00 18:00 0:00 6:00 12:00 18:00 0:00
Time of Day (hour)
Oxy
gen
Con
cent
ratio
n (%
)
Oxygen Sensor @ 5 ft
Oxygen Sensor @ 10 ft
Oxygen Sensor @ 20 ft
Sensors© Chevron 2007 14
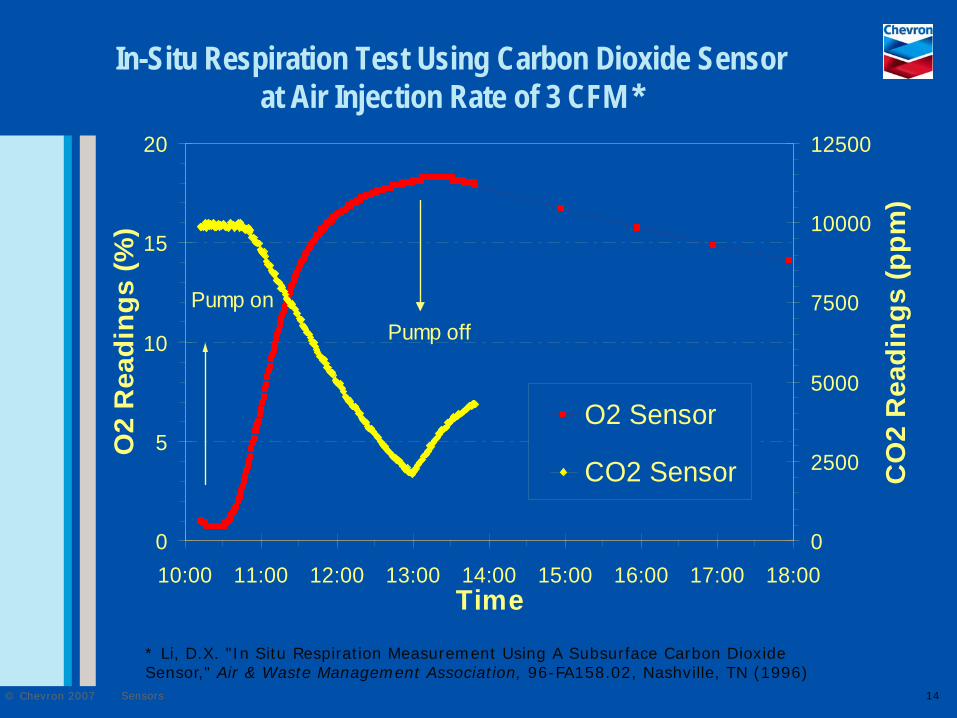
In-Situ Respiration Test Using Carbon Dioxide Sensor at Air Injection Rate of 3 CFM *
0
5
10
15
20
10:00 11:00 12:00 13:00 14:00 15:00 16:00 17:00 18:00Time
O2
Rea
ding
s (%
)
0
2500
5000
7500
10000
12500
CO
2 R
eadi
ngs
(ppm
)
O2 Sensor
CO2 Sensor
Pump onPump off
* Li, D.X. "In Situ Respiration Measurement Using A Subsurface Carbon Dioxide Sensor," Air & Waste Management Association, 96-FA158.02, Nashville, TN (1996)
Sensors© Chevron 2007 15
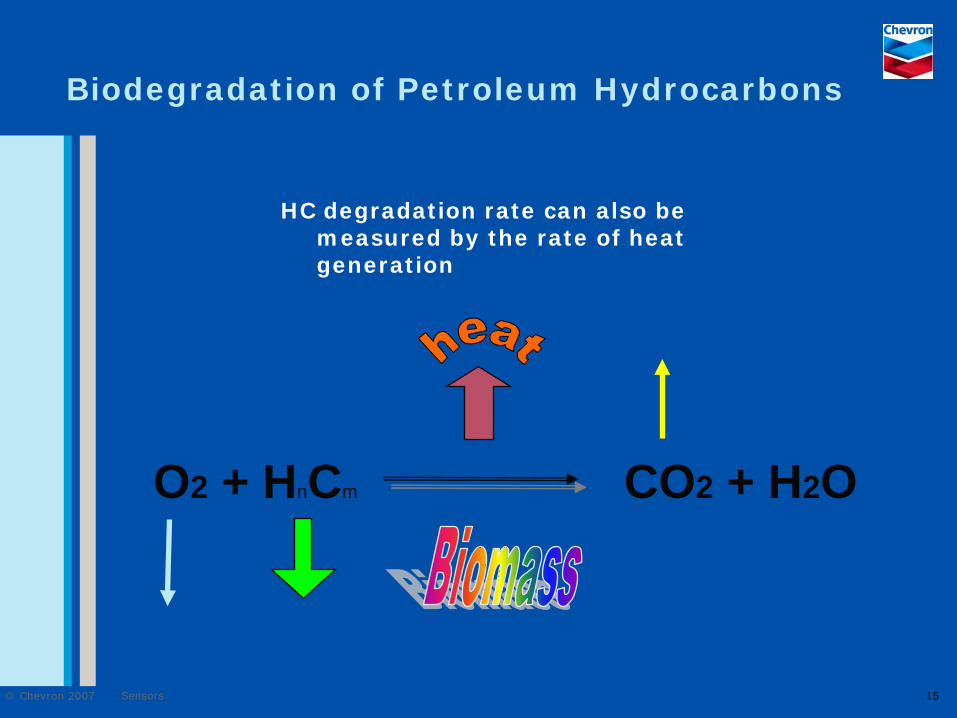
Biodegradation of Petroleum Hydrocarbons
O2 + HnCm CO2 + H2O
HC degradation rate can also be measured by the rate of heat generation
Sensors© Chevron 2007 16
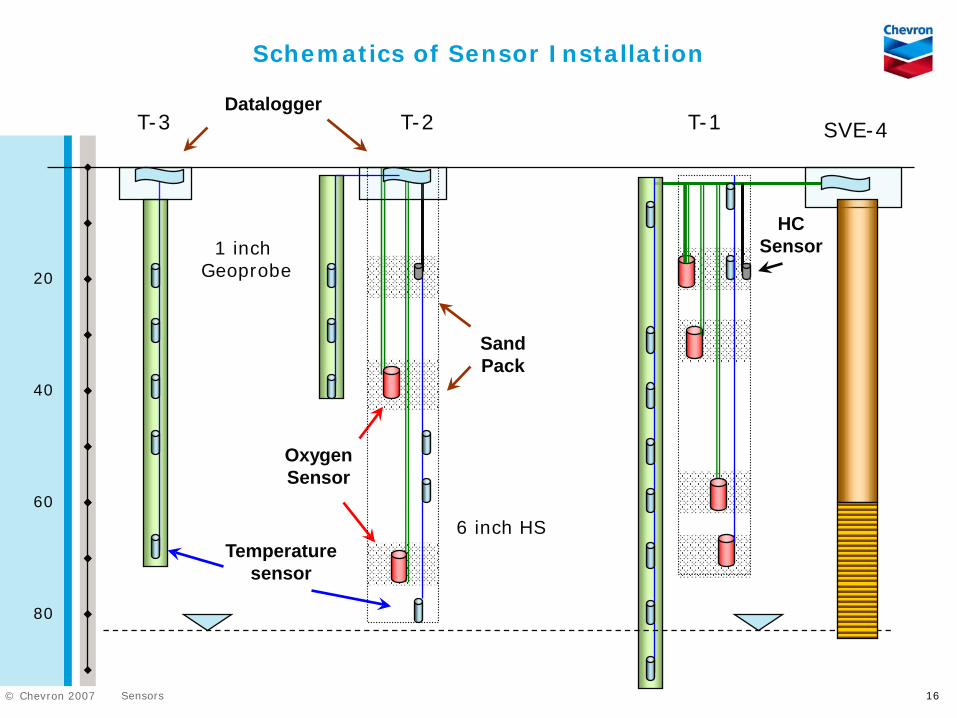
Schematics of Sensor Installation
OxygenSensor
T-1T-2T-3
Temperaturesensor
HCSensor
Datalogger
SandPack
20
80
60
40
1 inch Geoprobe
SVE-4
6 inch HS
Sensors© Chevron 2007 17
HC
0
5
10
15
20
25
30
35
40
45
50
11/1 11/3 11/5 11/7 11/9 11/11 11/13 11/15 11/17 11/19 11/21
Time
O2
(%) /
T (C
)
0
5000
10000
15000
20000
25000
30000
35000
40000
45000
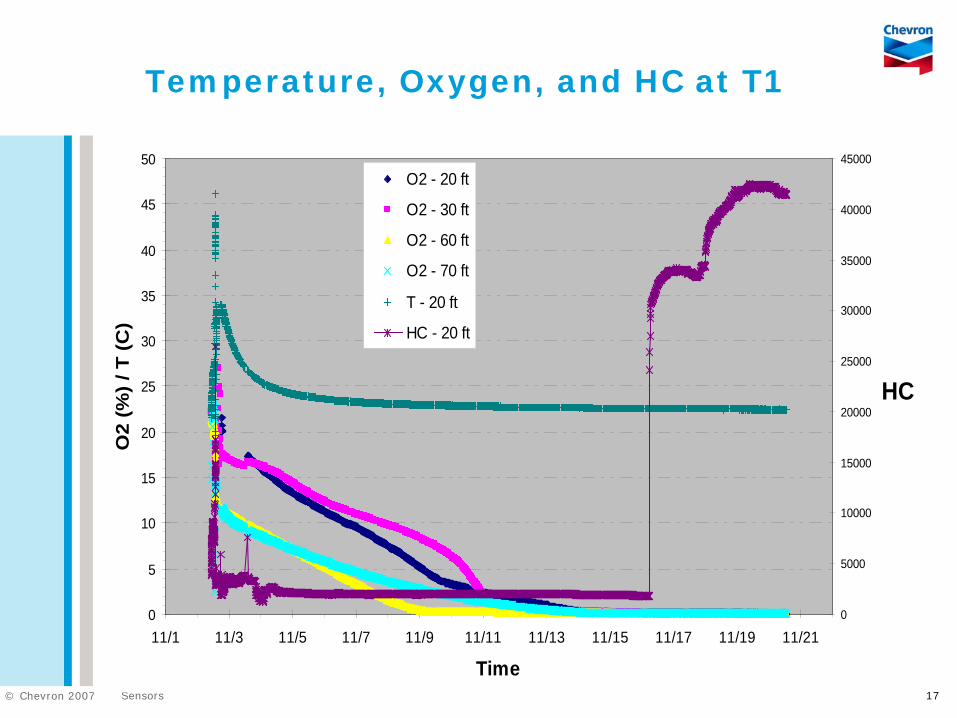
O2 - 20 ft
O2 - 30 ft
O2 - 60 ft
O2 - 70 ft
T - 20 ft
HC - 20 ft
Temperature, Oxygen, and HC at T1
Sensors© Chevron 2007 18
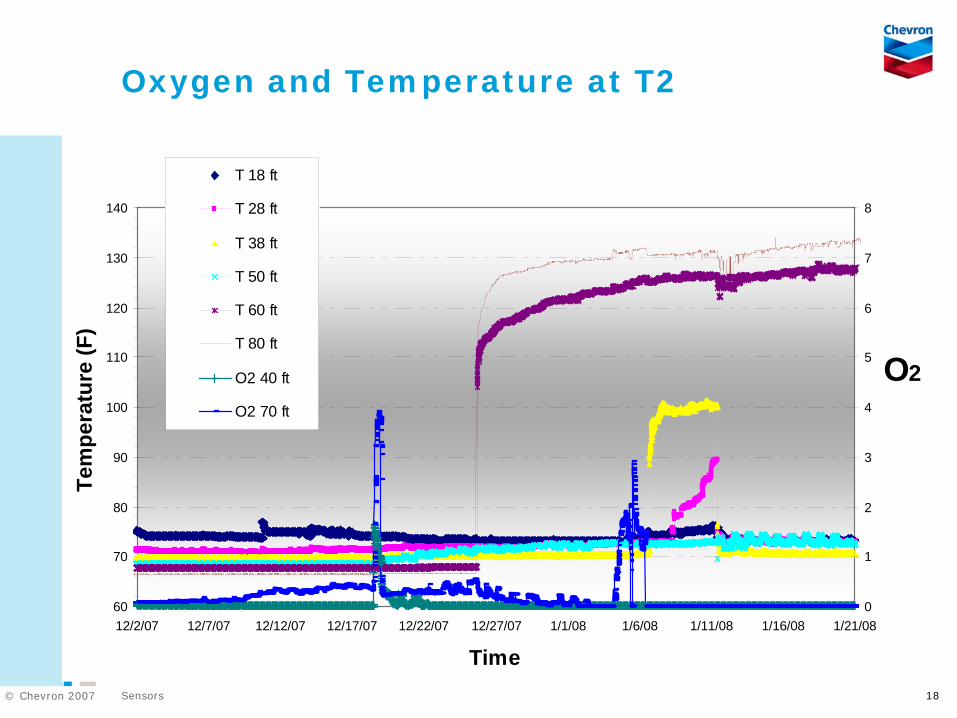
Oxygen and Temperature at T2
O2
60
70
80
90
100
110
120
130
140
12/2/07 12/7/07 12/12/07 12/17/07 12/22/07 12/27/07 1/1/08 1/6/08 1/11/08 1/16/08 1/21/08
Time
Tem
pera
ture
(F)
0
1
2
3
4
5
6
7
8
T 18 ft
T 28 ft
T 38 ft
T 50 ft
T 60 ft
T 80 ft
O2 40 ft
O2 70 ft
Sensors© Chevron 2007 19
What is the Opportunities and Challenges?
Sensors are available, reliable, and cheap.
Installation and data collection are expensive.
A large potential user base exist.
Innovation is slow in a mature industry and a regulatory driven world.