Embed Size (px)
Citation preview
Using Service and Product Providers to Leverage Your Energy Efforts
October 20, 2004

About The Web Conferences
• Monthly
• Topics are structured on a strategic approach to energy management
• Help you continually improvement energy performance
• Opportunity to share ideas with others
• Slides are a starting point for discussion
• Open & Interactive

Web Conference Tips
• Mute phone when listening! Improves sound quality for everyone.
• If slides are not advancing, hit reload button or close presentation window and press the launch button again.

Web Conference Tips
• Chat Feature
• Presentation Slides will be sent by email to all participants following the web conference.
• Hold & Music – If your phone system has music-on-hold, please don’t put the web conference on hold!

• Introduction •
Energy • • Questions & Discussion • Announcements
Today’s Web Conference
James Dore – Wheatstone
Tom Pagliuco - Prenova
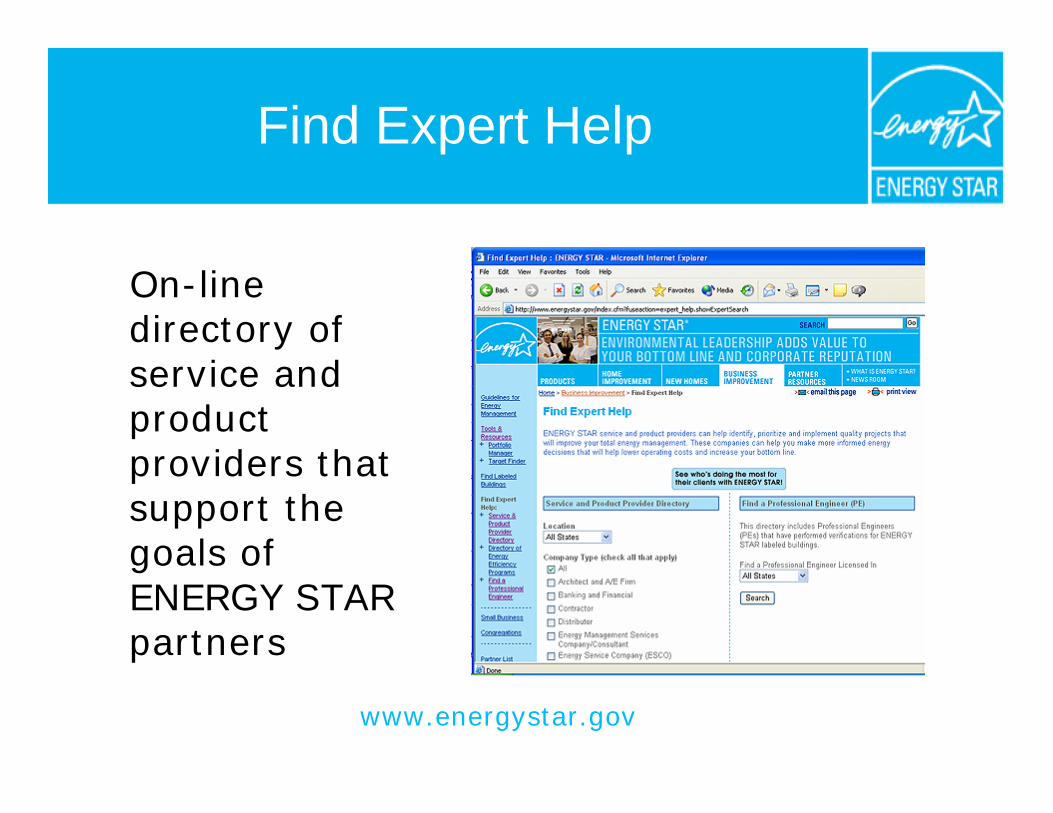
Find Expert Help
On-line directory of service and product providers that support the goals of ENERGY STAR partners
www.energystar.gov

Using Service and Product Providers to Leverage Your Energy Efforts
Prenova/Owens Corning Energy Process Optimization
Thomas Pagliuco – Prenova
Fred Dannhauser – Owens Corning
October 20, 2004

Who is Owens Corning?
• World leader in building materials systems and composites systems
• $5 billion in sales in 2003
• 70+ Manufacturing Facilities
• Proactive approach to managing energy costs
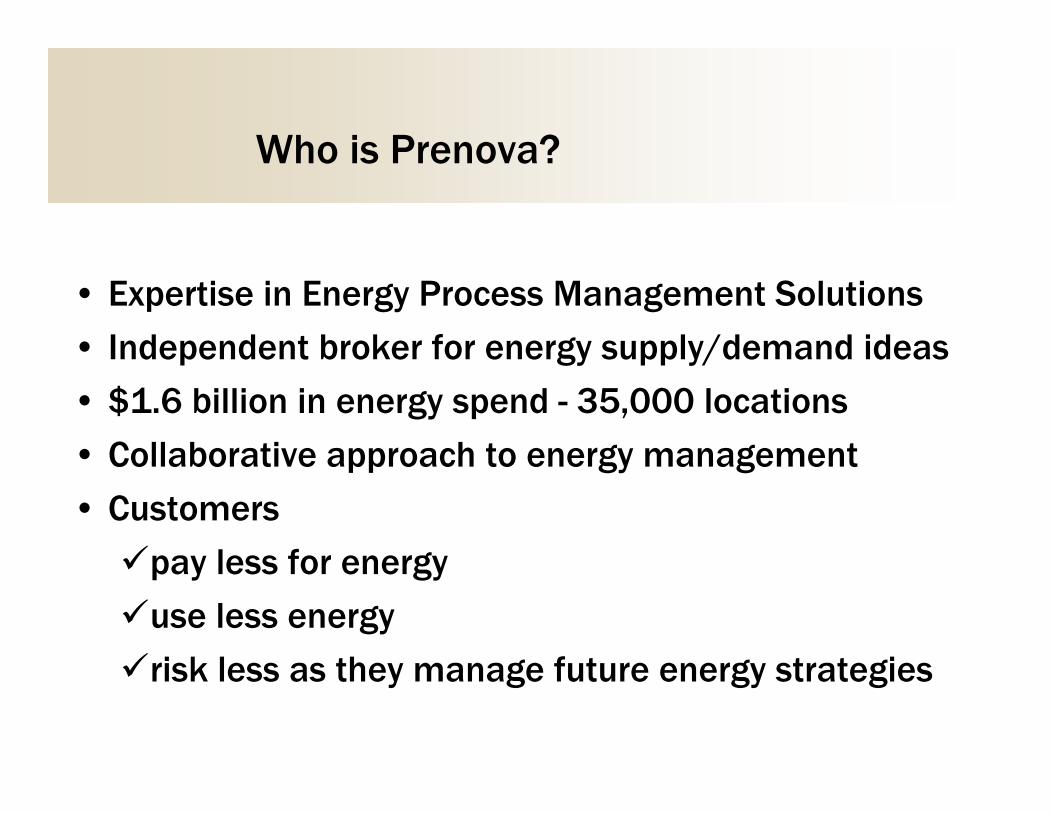
Who is Prenova?
• Expertise in Energy Process Management Solutions
• Independent broker for energy supply/demand ideas
• $1.6 billion in energy spend - 35,000 locations
• Collaborative approach to energy management
• Customers
9pay less for energy
9use less energy
9risk less as they manage future energy strategies

Owens Corning - Prenova Relationship Overview
Since 2002, Prenova provides an energy management solution to Owens Corning’s North American facilities for:
•Energy Supply Management•Energy Price Risk Management•Energy Process Optimization •Bill Payment and Data Management•Utility Due Diligence•Remote Monitoring, Scheduling, Alarming and
Trending

Owens Corning – Prenova Energy Process Optimization Overview
• 11 Insulation and Composite Glass plants
• Total energy spend of over $50 million per year
• Optimization phase: 4 - 7 months per plant
• No process area off limits for energy savings investigation

What is Energy Process Optimization?
• A methodology that realizes energy savings by leveraging existing assets and implementing processes and procedures that create sustainable results
• Benefits are: 9 Improves Return on Net Assets (RONA)
9 Establishes and propagates best practices
9 Offers low barrier to implementation
9 Requires little capital
9 Provides process for continuous improvement
9 Reduces maintenance and raw material costs

Energy Process Optimization Principles
• Process focused approach 9 Paretto analysis of energy usage
9 Statistical process control methodology
9 Cross functional team involvement
• Data driven decision making
• No cost or low cost to implement 9 Operations and maintenance opportunities
9 Capital opportunities identified - not essential to success
• Provide resources focused on energy reduction
• Ensure sustainable savings/continuous optimization
–
–
–
–
–––
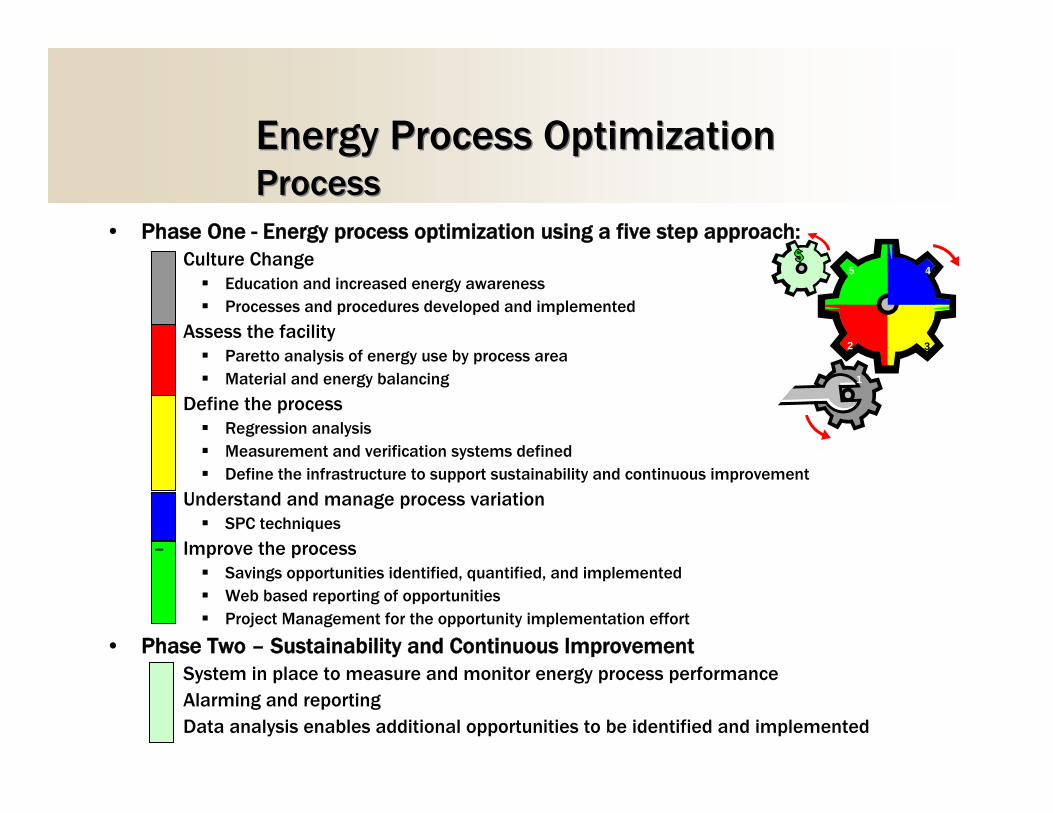
Energy Process Optimization Process Energy Process OptimizationProcess
• Phase One - Energy process optimization using a five step approach:
3 1
3
45
2
Culture Change � Education and increased energy awareness � Processes and procedures developed and implemented
Assess the facility � Paretto analysis of energy use by process area � Material and energy balancing
Define the process � Regression analysis � Measurement and verification systems defined � Define the infrastructure to support sustainability and continuous improvement
Understand and manage process variation � SPC techniques
– Improve the process � Savings opportunities identified, quantified, and implemented � Web based reporting of opportunities� Project Management for the opportunity implementation effort
• Phase Two – Sustainability and Continuous Improvement System in place to measure and monitor energy process performance Alarming and reporting Data analysis enables additional opportunities to be identified and implemented


ign
ied i
l :
)
(s) * ( ) *
(p )
rej
rej
l
A l )
()
i
i
Opportunity Identification, Approval and Acceptance Process
Complete and sOpportunity Approval
Form
Opportunity Identif
Input data into Opportunity Webs te Status: Draft
Data Inc udes* Description, * Assigned to (Customer personnel* Safety impact * Quality impact * M&V plan * Estimated Completion date * Estimated consumption reductionSavings basis ie calcs, data, etc.Estimated Cost to implement
Opportunity submitted to Plant Energy Leader for approval i.e. 90 day
lanStatus: submitted
Plant Energy Leader approves Status: approved
Plant Energy Leader ects and Prenova
agrees Status: cancelled
Plant Energy Leader ects and Prenova
disagrees Status: pending
Do work to imp ement opportunity
Work Complete Actual
implemetation costs captured
Savings Start savings start date captured
M&V plan complete: ctuasavings captured
Procedure(s and Training
completed if necessary
Opportunity submitted to Plant Energy Leader
for completion-acceptance
Plant Energy Leader approves for completion
Status: complete actual completion
date captured
Savings start sav ngs start date captured
Attach procedure to webs te
Plant Energy Leader cancels opportunity Status: cancelled
Complete and sign Opportunity Completion and
Acceptance Form

Energy Process Optimization Organization
Executive
Team Energy Management
Team VP Ops
Finance Effort
Steering
Div Energy Leader
Plant Energy Leader
Plant Manager
Energy Efficiency Improvement
Plant Energy Leader Prenova Acct Mgr
l
EfficiMgr
Key P ant Energy Stakeholders
Prenova Energy ency Program
Prenova EEPM
Operations
Maintenance
Others

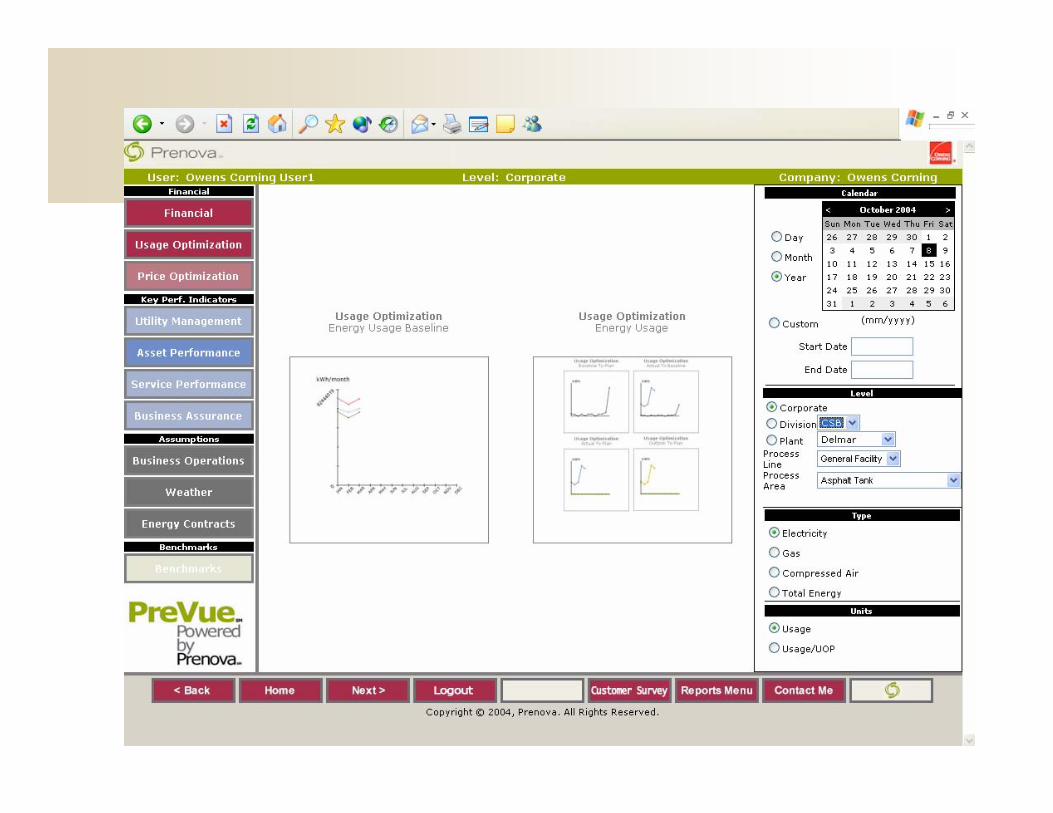
Sustainability Performance Monitoring and Management System
• Implemented at 6 plants
• Implementation in progress at remaining 5 plants
• Enhanced visibility to energy performance by plant and process area9 Web reporting
9 Alarming
• Desired Results 9 Drive sustainability of energy savings
9 Platform for continuous improvement
• Demo: PMMS and PreVUE

Results Achieved
• Energy Savings 9 7% average reduction in annual energy spend
9 71,000,000 kWh
9 476,500 MMBtu
• Costs 9 Average cost per plant was $120,000 after rebates
9 Rebate funding was $775,000
• Financial Return 9 Less than 4 months average payback

Energy Process Optimization Additional Benefits
• Energy Efficiency Program Managers integrated into plant teams
• Synergy between supply and demand efforts • Focus on energy use and reduction • Awareness of energy usage/cost by process area • Process and procedures to drive sustainable savings• Best practices and common opportunities replicated• “Engaged” other organizational teams in the effort • Performance Measurement and Monitoring System• Facilitates EPA Energy Star Partner of the year

Contact Information
Owens Corning• Fred Dannhauser, Leader, Global Energy
• 419-248-6555
Prenova • Tom Pagliuco, Director Industrial Field Services
• 732-254-9158

FritoLay and Wheatstone Energy
Using a National Service and Product Provider (SPP) to Add Value and
Leverage Resources

Table of Contents
• Introduction • Results • Program • Process • Benefits of a National SPP Strategy • Conclusions• Question and Answer

Introduction:
A 70 year old leading manufacturer in the snack food industry
A 12 year old design – build energy efficiency firm

Results:Results:
• $2.2 Million Energy Savings
• 3.1 Years Average Payback
• 96 Distribution Centers
• 16 Production Plants
• 4 Year Partnership

Program Outline:Program Outline:
• Design Program Overview
• Identify Capital and Savings Impact (ROI)
• Develop Buying Criteria (Simple Payback)
• Define a Funding Process
• Establish Goals and Timeline
• Execute Program Development Agreement

Process Outline:Process Outline:
• Design Communication Schedule
• Design and Build a Beta Site
• Design Audit Schedule
• Implement Audits and Proposal Deadline
• Review Proposals with Customer
• Develop an Implementation Strategy
• Acquire Funding
• Implement Construction Strategy

Overall Benefits to FritoLayOverall Benefits to FritoLay• $2.2 million annual energy savings
• $750, 000 maintenance savings
• Standardized Design and Equipment
• Knowledge and Experience Retention
• Economies of Scale - Competitive Pricing
• Minimal Internal Effort
• Energy Goals Attained
Conclusion:Conclusion:
• Achieved FritoLay Energy Program Goals
• Minimized FritoLay Effort and Resources
• Leveraged Wheatstone Skills and Resources
• Produced Win/Win Results

Question and AnswerQuestion and Answer
Contact: Jim Dore Director Of Sales and Marketing 770.916.7107 fax: 770.916.7108 Cell: 404.428.2343 [email protected]@wheatstoneenergy.com
www.wheatstoneenergy.com

Questions & Discussion

Energy Awareness Month
October is Energy Awareness Month
www.energystar.gov/energymonth

Upcoming Web Conferences
Performance with CHP
www.energystar.gov/networking
November 17 – Increasing Energy
January 19 – ENERGY STAR Update

Thank You!