Embed Size (px)
Citation preview
Using Short-Cycle Interim Assessment to Improve Educator Evaluation, Educator Effectiveness, and Student AchievementMichael H. Baum
Policy Brief
About the AuthorMichael H. Baum, principal of Sophia Consulting LLC, advises organizations on issues of education and management. Renaissance Learning engaged Baum to help research and develop the company’s approach to the teacher evaluation and educator effectiveness issue, assemble input from a panel of experts, and draft this paper. CEO of Renaissance Learning from 1996 to 2002, he inaugurated the company’s educator professional development programs, among other initiatives. A former high school English teacher, he holds B.A. and M.A.T. degrees from Yale University and an M.B.A. from Northwestern.
Advanced Technology for Data-Driven Schools, Renaissance Learning, the Renaissance Learning logo, STAR Early Literacy, STAR Math, and STAR Reading are trademarks of Renaissance Learning, Inc., and its subsidiaries, registered, common law, or pending registration in the United States and other countries.
© 2011 by Renaissance Learning, Inc. All rights reserved. Printed in the United States of America.
This publication is protected by U.S. and international copyright laws. It is unlawful to duplicate or reproduce any copyrighted material without authorization from the copyright holder. For more information, contact:
RENAISSANCE LEARNINGP.O. Box 8036Wisconsin Rapids, WI 54495-8036(800) [email protected]
04/11
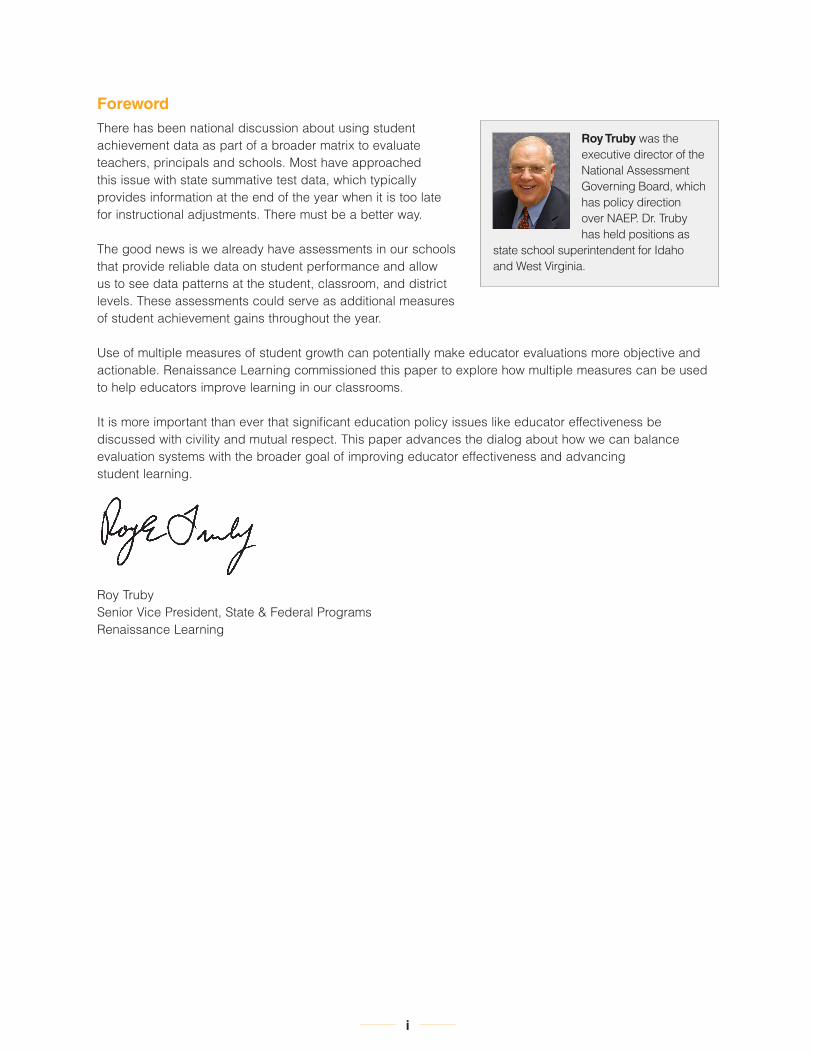
ForewordThere has been national discussion about using student achievement data as part of a broader matrix to evaluate teachers, principals and schools. Most have approached this issue with state summative test data, which typically provides information at the end of the year when it is too late for instructional adjustments. There must be a better way.
The good news is we already have assessments in our schools that provide reliable data on student performance and allow us to see data patterns at the student, classroom, and district levels. These assessments could serve as additional measures of student achievement gains throughout the year.
Use of multiple measures of student growth can potentially make educator evaluations more objective and actionable. Renaissance Learning commissioned this paper to explore how multiple measures can be used to help educators improve learning in our classrooms.
It is more important than ever that significant education policy issues like educator effectiveness be discussed with civility and mutual respect. This paper advances the dialog about how we can balance evaluation systems with the broader goal of improving educator effectiveness and advancing student learning.
Roy TrubySenior Vice President, State & Federal ProgramsRenaissance Learning
Roy Truby was the executive director of the National Assessment Governing Board, which has policy direction over NAEP. Dr. Truby has held positions as
state school superintendent for Idaho and West Virginia.
i
ii
Executive SummaryPolitical and technical debates about using student achievement data in evaluating teacher performance have shifted from whether to how. There is general agreement that multiple measures should be used, but in practice, virtually all systems discussed so far depend on one data source: annual summative state tests. In this paper, we suggest that assessment systems already in place in most school systems have the potential, if used appropriately, to supply additional estimates of teacher, principal, and school impact on student learning.
“Short-cycle interim assessments” can deliver additional insights with relatively little cost or delay. Equally important, they can do so while continuing to serve the broader goal for which they are primarily intended: helping to improve educator effectiveness and advance student learning.
Short-cycle interim assessments are a specific category of test designed to produce reliable results, whether administered weekly, monthly, or less frequently, depending on the purpose of assessment. Robust systems deliver results in multiple formats, usable for a range of purposes. Frequent use of short-cycle interim assessment data has been correlated with improved academic results. Short-cycle interim assessments are more than just monitoring devices: Incorporated into instructional planning,
they play an active role in improving teaching and learning.
The efficiency of a good short-cycle interim assessment system can result in considerable cost savings for a district. So can versatility: A good short-cycle interim assessment system performs many different functions and helps avoid buying multiple assessments for different purposes.
Rigorous short-cycle interim assessment systems provide a preview of end-of-year assessment results in time to improve student outcomes. Frequent use of data fosters conversations about student growth within educator peer groups and with administrators. To get best results from such a system, schools must provide systematic professional development in data literacy and usage as well as encourage regular collaborative use of data to develop action plans for students. The regular testing cycle promotes periodic review of progress toward goals, introduction of interventions to close achievement gaps, and adjustment of interventions based on student response.
Once schools are regularly using short-cycle interim assessments, they may be extended to teacher and principal evaluation with little, if any, additional investment in systems. There must, however, be an investment in planning and careful implementation, to ensure valid assessments and to avoid perception that these instruments have become “high-stakes,” endangering their usefulness in the classroom. With proper priorities and safeguards (see box, facing page), short- cycle interim assessments can provide a highly flexible set of
Selecting a Short-Cycle Interim Assessment
Technology is an important element of short-cycle interim assessment systems—frequent administration requires efficient testing to avoid sacrificing instructional time.
Elements of good short-cycle interim assessment systems:
• Efficient testing
• Frequent administration
• Flexible testing dates
• Alignment to state and Common Core State Standards
• Data aggregation
• Vertically-equated scale for score reporting and comparison
• Explicit instructional guidance
• Versatile reporting
• Linkage to state test
The efficiency of a good short-cycle interim assessment system can result in considerable cost savings for a district.
iii
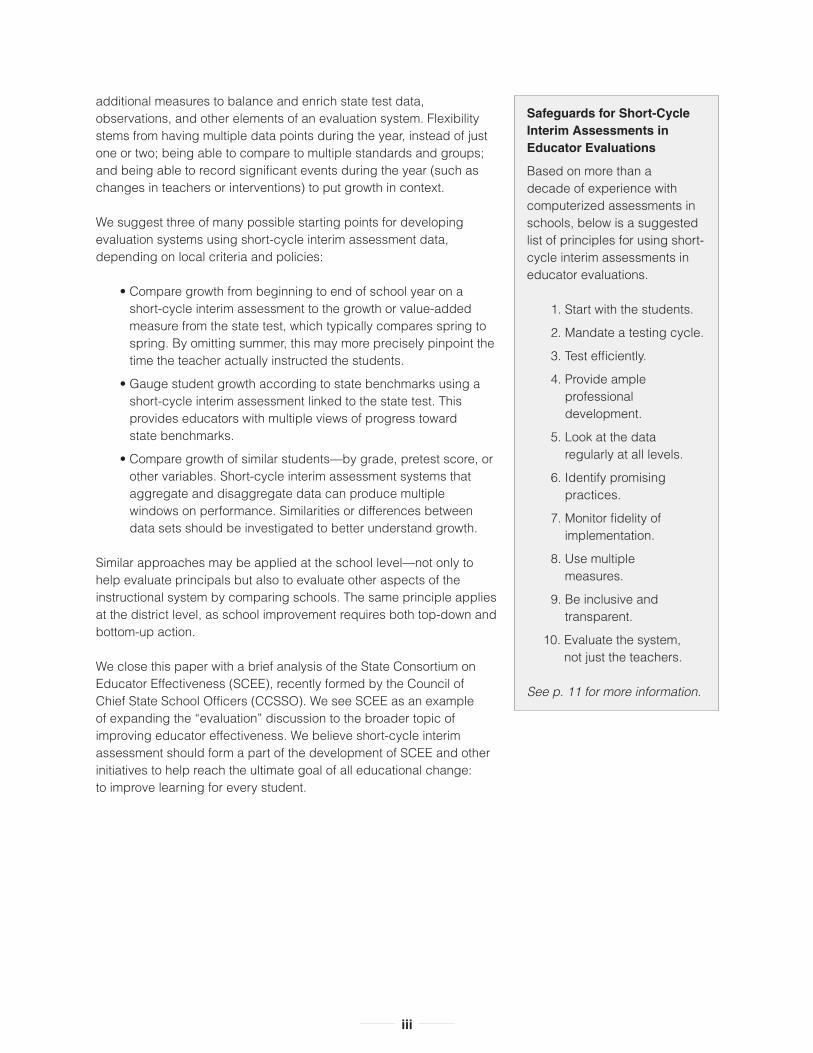
additional measures to balance and enrich state test data, observations, and other elements of an evaluation system. Flexibility stems from having multiple data points during the year, instead of just one or two; being able to compare to multiple standards and groups; and being able to record significant events during the year (such as changes in teachers or interventions) to put growth in context.
We suggest three of many possible starting points for developing evaluation systems using short-cycle interim assessment data, depending on local criteria and policies:
• Compare growth from beginning to end of school year on a short-cycle interim assessment to the growth or value-added measure from the state test, which typically compares spring to spring. By omitting summer, this may more precisely pinpoint the time the teacher actually instructed the students.
• Gauge student growth according to state benchmarks using a short-cycle interim assessment linked to the state test. This provides educators with multiple views of progress toward state benchmarks.
• Compare growth of similar students—by grade, pretest score, or other variables. Short-cycle interim assessment systems that aggregate and disaggregate data can produce multiple windows on performance. Similarities or differences between data sets should be investigated to better understand growth.
Similar approaches may be applied at the school level—not only to help evaluate principals but also to evaluate other aspects of the instructional system by comparing schools. The same principle applies at the district level, as school improvement requires both top-down and bottom-up action.
We close this paper with a brief analysis of the State Consortium on Educator Effectiveness (SCEE), recently formed by the Council of Chief State School Officers (CCSSO). We see SCEE as an example of expanding the “evaluation” discussion to the broader topic of improving educator effectiveness. We believe short-cycle interim assessment should form a part of the development of SCEE and other initiatives to help reach the ultimate goal of all educational change: to improve learning for every student.
Safeguards for Short-Cycle Interim Assessments in Educator Evaluations
Based on more than a decade of experience with computerized assessments in schools, below is a suggested list of principles for using short-cycle interim assessments in educator evaluations.
1. Start with the students.
2. Mandate a testing cycle.
3. Test efficiently.
4. Provide ample professional development.
5. Look at the data regularly at all levels.
6. Identify promising practices.
7. Monitor fidelity of implementation.
8. Use multiple measures.
9. Be inclusive and transparent.
10. Evaluate the system, not just the teachers.
See p. 11 for more information.

iv
v
ContentsThe Evolving Discussion: Data for Evaluating and Improving Education ............................................................ 1
Data for Different Purposes: Short-Cycle Interim Assessment and Where It Fits................................................. 3
Using Short-Cycle Interim Assessment to Improve Educator Effectiveness ........................................................ 6
Short-Cycle Interim Assessment in Educator Evaluations ................................................................................. 10
The State Consortium on Educator Effectiveness Initiative: A Model for Using Data to Improve Teaching, Leading, and Student Achievement ......................................... 13
Conclusion .......................................................................................................................................................... 14
References ......................................................................................................................................................... 15
Acknowledgements ............................................................................................................................................ 17
FiguresFigure 1: Assessment Pyramid ............................................................................................................................. 3
Figure 2: Frequent Progress Monitoring Helps Teachers Boost Student Achievement ....................................... 4
Figure 3: How Computer-Adaptive Technology Works......................................................................................... 5
Figure 4: State Screening Report ......................................................................................................................... 6
Figure 5: Class Instructional Planning Report ...................................................................................................... 7
Figure 6: Student Progress Monitoring Report ..................................................................................................... 7
Figure 7: Scatterplot of Proficiency and Growth ................................................................................................... 8
Figure 8: Evidence of Student Learning ............................................................................................................. 12

vi
1
The Evolving Discussion: Data for Evaluating and Improving EducationAcross the country, a process of improving educator evaluation has begun. Sound approaches for evaluating teachers traditionally include measures of instructional practices, for which there are many instruments available (Milanowski, Prince, & Koppich, 2007). More recently, many have asserted that teacher evaluations should also include measures of teacher impact on student learning. Though the issue has sparked controversy, by now the debate about whether to use student test data for this purpose is essentially over. Propelled by requirements of the federal Race to the Top program, states and school districts are now making plans to factor student data into evaluation systems (Baker et al., 2010). The timely question now is which data will be used and how (Sawchuk, 2009).
A general consensus is also growing that what should be measured for these purposes is student growth, rather than just absolute measures of proficiency, cohort-to-cohort growth, or other ways of gauging educational performance (Harris, 2011). The controversy raised by this direction is how, and to what extent, to attribute this growth to teacher inputs. Systems known as “value-added models” (VAMs) start from the widespread belief that teacher quality is the primary in-school factor influencing student performance (Auguste, Kihn, & Miller, 2010; Rivkin, Hanushek, & Kain, 2002), and then attempt to measure this influence by isolating it from other factors by applying various sophisticated statistical techniques to summative state data (Sanders & Horn, 1998; Sanders & Rivers, 1996).
VAMs have attracted both advocates and detractors (Kane & Cantrell, 2010; National Research Council & National Academy of Education [NRC & NAE], 2010). Their measurement tends to be more stable for schools or districts than for individual teachers, largely due to differences in sample size. Even their supporters agree these models should not be used as sole determinants of teacher employment actions (Glazerman et al., 2010) and do not offer a “magical elixir” (Goldhaber, 2010). But as Randi Weingarten, president of the American Federation of Teachers, points out: “We cannot expect any measures of teacher quality— value-added or others—to be perfect….I think most teachers are willing to accept the fact that they might not easily understand every technical detail...as long as they can know enough to be confident that it is being used responsibly, collaboratively, and for the purpose of improving instruction” (Harris, 2011).
Incorporating student data into evaluating and improving teaching is a complex issue with many moving parts that will require experimentation and changes based on experience (Steele, Hamilton, & Stecher, 2010). Improving schools involves many significant and related factors (Bryk, Sebring, Allensworth, Luppescu, & Easton, 2010; Fullan, 2001). Ultimately, it is vital to remember that evaluations are only a means to an end: It is teacher performance in the classroom that is “the lifeblood of the enterprise” (Milanowski, 2010).
One major issue in all these discussions is how much to rely on state test data. Debates about VAMs and other growth measures often assume state tests will be the source of data; however, even the Race to the Top mandate provides for “other measures of student learning…provided they are rigorous and comparable across classrooms” (U.S. Department of Education, as cited in Goe & Holdheide, 2011). For one thing, state test data are not even applicable to perhaps 70% of teachers, who teach nontested subjects or do not have sole charge of a particular group of students (Goe & Holdheide, 2011; Marion, 2010; Sawchuk, 2011). Some alternative source of data will be required in these cases. And even where tested subjects reasonably
Incorporating student data into evaluating and improving teaching is a complex issue with many moving parts that will require experimentation and changes based on experience.
(Steele, Hamilton, & Stecher, 2010)
2
correlate with the work of a given set of teachers, analyses based on two data points (from two administrations of an annual test, usually administered in spring) inherently create high error rates due to lack of data (NRC & NAE, 2010; Schochet & Chiang, 2010). There is also the problem of “summer learning loss.” Student achievement at the start of a school year is often lower than when tested the previous spring, especially for students in lower socioeconomic strata, so simply comparing year-end scores may underestimate growth attributable to the teacher in that year (Harris, 2011). For many reasons, experts who may disagree on VAMs do agree that accountability systems should include multiple measurements (Kane & Cantrell, 2010; NRC & NAE, 2010; Odden, 2011; Schochet & Chiang, 2010), not just data from the state test.
Even more to the point, the purpose of improving instruction is not fully served by annual state summative assessments because they do not provide useful instructional information (Wurtzel, Marion, Perie, & Gong, 2009). The data do not arrive in time to help improve performance during the school year; they only identify problems afterwards. Retrospective analyses of student results tell us where additional growth is needed but often tell little about how to make it happen. An increasing number of evaluation systems specify that administrators may intervene if a teacher is struggling (Donaldson, 2009), but such an option means little without data to identify problems as they arise.
Fortunately, “short-cycle interim assessments” can provide an additional indicator of educator impact without adding another testing system. Short-cycle interim assessments already regularly measure student achievement and progress to help teachers advance learning in the majority of schools in America. The same data, looked at differently and used with appropriate safeguards, can improve the stability and validity of teacher and principal evaluations. In fact, appropriate use of well-designed short-cycle interim assessments can improve overall educator effectiveness, by helping enrich not only evaluation but also the effectiveness of the teacher practices evaluation is intended to measure.
With appropriate safeguards, short-cycle interim assessments can improve the stability and validity of teacher and principal evaluations.
3
The more frequently a test is administered, the more data it will provide. The combination of frequency of administration and quantity of data in Level 2 interim assessments allows for the following:
• More frequent insights into student learning means more timely predictions of progress and adjustments to instruction.
• Greater frequency means a wider choice of data points to compare—not just one point per year.
• Comparing data points from multiple administrations can foster richer conversations.
Data for Different Purposes: Short-Cycle Interim Assessment and Where It FitsAssessments take many forms. Often they are described as either “summative” or “formative,” based on whether they simply measure learning or are intended to influence instruction. This categorization, however, employs the term “formative assessment” in an overly broad manner.
Formative assessment is a powerful tool for improving learning—indeed, its impact exceeds most other types of educational intervention (Black & Wiliam, 1998a, 1998b)—but as a result, the term is often misappropriated to describe any classroom assessment. Properly speaking, “formative” refers to the use of the data rather than the type of test, and describes a process rather than an instrument. True formative assessment supplies data that change teaching by providing immediate or nearly immediate feedback to the teacher that is acted on to adjust instructional practice; it often also provides feedback to students to help them move forward in their learning.
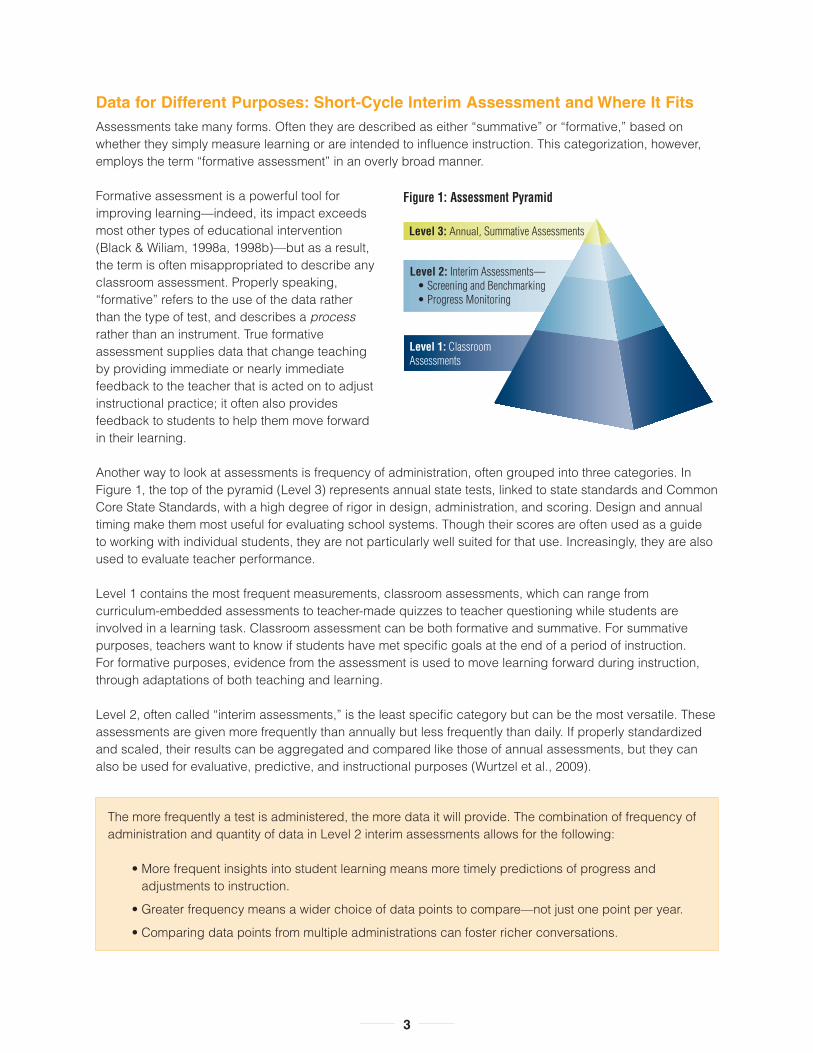
Another way to look at assessments is frequency of administration, often grouped into three categories. In Figure 1, the top of the pyramid (Level 3) represents annual state tests, linked to state standards and Common Core State Standards, with a high degree of rigor in design, administration, and scoring. Design and annual timing make them most useful for evaluating school systems. Though their scores are often used as a guide to working with individual students, they are not particularly well suited for that use. Increasingly, they are also used to evaluate teacher performance.
Level 1 contains the most frequent measurements, classroom assessments, which can range from curriculum-embedded assessments to teacher-made quizzes to teacher questioning while students are involved in a learning task. Classroom assessment can be both formative and summative. For summative purposes, teachers want to know if students have met specific goals at the end of a period of instruction. For formative purposes, evidence from the assessment is used to move learning forward during instruction, through adaptations of both teaching and learning.
Level 2, often called “interim assessments,” is the least specific category but can be the most versatile. These assessments are given more frequently than annually but less frequently than daily. If properly standardized and scaled, their results can be aggregated and compared like those of annual assessments, but they can also be used for evaluative, predictive, and instructional purposes (Wurtzel et al., 2009).
Level 2: Interim Assessments— • Screening and Benchmarking • Progress Monitoring
Level 1: ClassroomAssessments
Level 3: Annual, Summative Assessments
Figure 1: Assessment Pyramid
4
The term “interim assessment” is applied to a wide range of instruments for various purposes. One study remarks that “interim assessments occupy a gray area between formative and summative uses” (Goertz, Oláh, & Riggan, 2009). Though there is no universal consensus, interim assessments are often assumed to occur every few months (Popham, 2011). This paper focuses on “short-cycle interim assessments,” which are specifically designed for much more frequent use and have precise characteristics:
• Capable of frequent administration while maintaining reliability
• Allow adjustable administration dates, per a school’s needs, without jeopardizing psychometric rigor
• Align to state standards and Common Core State Standards
• Aggregate results across classrooms, schools, even districts
• Report data on a vertically-equated scale so results can be compared month-to-month, year-to-year, classroom-to-classroom, grade level-to-grade level
• Employ technology that makes them efficient, consistent, and secure
• Minimize time taken from instruction—10–20 minutes per student, per administration
• Provide explicit instructional guidance
• Generate intuitive, readily-accessible reporting to serve multiple instructional and planning needs
• Align closely with the state test, and ideally also have been statistically linked with the state test
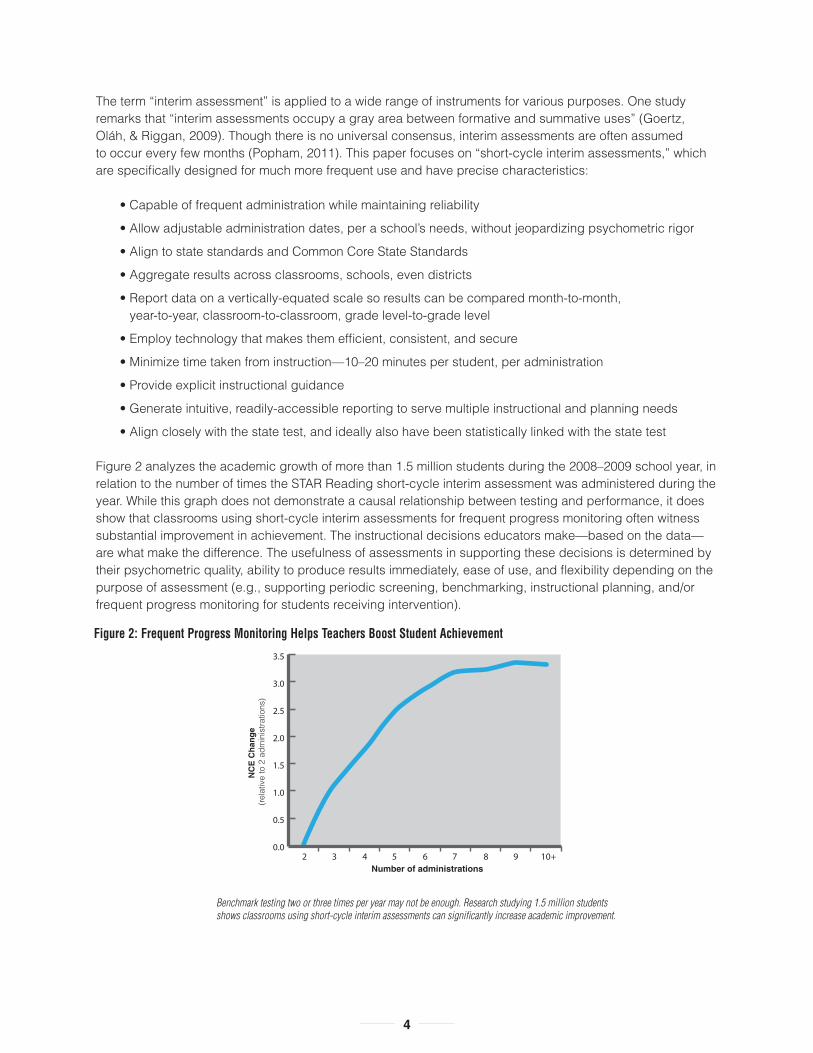
Figure 2 analyzes the academic growth of more than 1.5 million students during the 2008–2009 school year, in relation to the number of times the STAR Reading short-cycle interim assessment was administered during the year. While this graph does not demonstrate a causal relationship between testing and performance, it does show that classrooms using short-cycle interim assessments for frequent progress monitoring often witness substantial improvement in achievement. The instructional decisions educators make— based on the data— are what make the difference. The usefulness of assessments in supporting these decisions is determined by their psychometric quality, ability to produce results immediately, ease of use, and flexibility depending on the purpose of assessment (e.g., supporting periodic screening, benchmarking, instructional planning, and/or frequent progress monitoring for students receiving intervention).
Figure 2: Frequent Progress Monitoring Helps Teachers Boost Student AchievementFrequent Progress Monitoring Helps Teachers Boost Student Achievement
Users of STAR Reading assessment, 2009-10 (n=1,507,075)
Number of administrations
NC
E C
han
ge
(rel
ativ
e to
2 a
dmin
istra
tions
)
0.0
0.5
1.0
1.5
2.0
2.5
3.0
3.5
Benchmark testing two or three times per year may not be enough. Research studying 1.5 million students shows classrooms using short-cycle interim assessments can significantly increase academic improvement.
5
Technology is absolutely necessary in such a system, to avoid a drain on instructional time in test administration and data processing, as well as to provide secure and timely access to results. As researchers working with Response to Intervention (RTI) and other multi-tier models that call for regular assessment have concluded, “In the absence of technology, the data burden becomes unmanageable” (Kurns & Tilly, 2008).
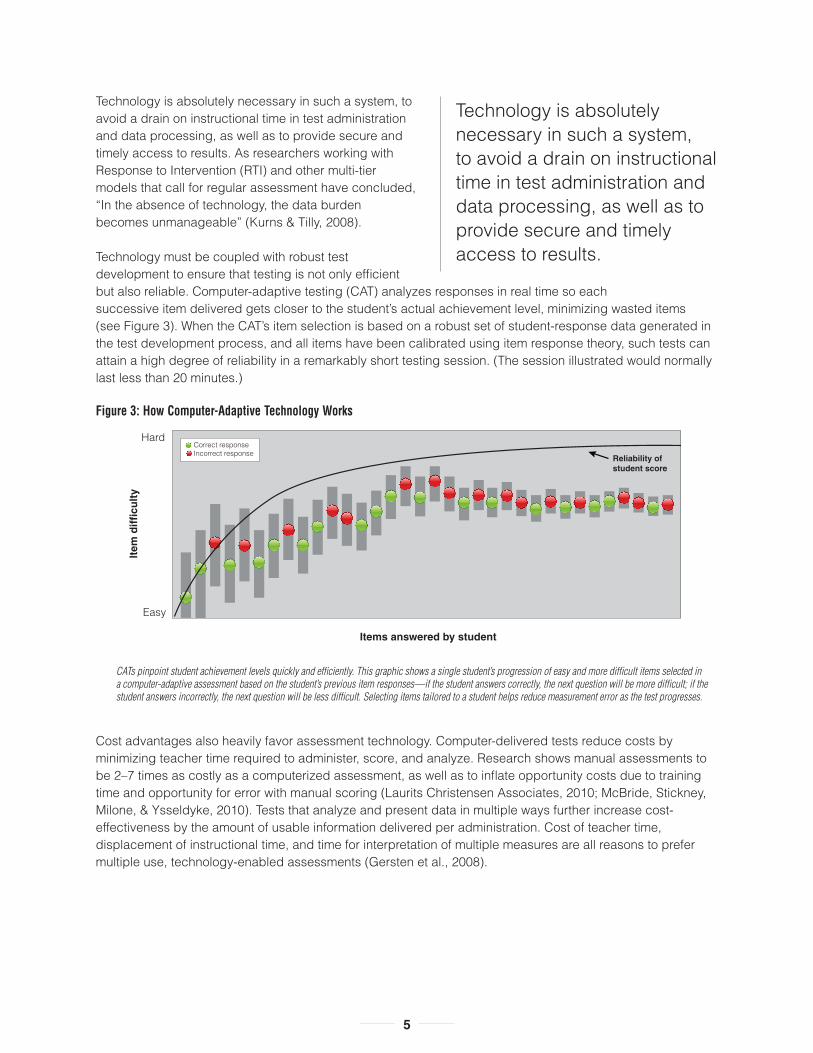
Technology must be coupled with robust test development to ensure that testing is not only efficient but also reliable. Computer-adaptive testing (CAT) analyzes responses in real time so each successive item delivered gets closer to the student’s actual achievement level, minimizing wasted items (see Figure 3). When the CAT’s item selection is based on a robust set of student-response data generated in the test development process, and all items have been calibrated using item response theory, such tests can attain a high degree of reliability in a remarkably short testing session. (The session illustrated would normally last less than 20 minutes.)
Cost advantages also heavily favor assessment technology. Computer-delivered tests reduce costs by minimizing teacher time required to administer, score, and analyze. Research shows manual assessments to be 2–7 times as costly as a computerized assessment, as well as to inflate opportunity costs due to training time and opportunity for error with manual scoring (Laurits Christensen Associates, 2010; McBride, Stickney, Milone, & Ysseldyke, 2010). Tests that analyze and present data in multiple ways further increase cost- effectiveness by the amount of usable information delivered per administration. Cost of teacher time, displacement of instructional time, and time for interpretation of multiple measures are all reasons to prefer multiple use, technology-enabled assessments (Gersten et al., 2008).
Figure 3: How Computer-Adaptive Technology Works
Hard
Easy
Items answered by student
Reliability ofstudent score
Item
dif
ficu
lty
Correct responseIncorrect response
CATs pinpoint student achievement levels quickly and efficiently. This graphic shows a single student’s progression of easy and more difficult items selected in a computer-adaptive assessment based on the student’s previous item responses—if the student answers correctly, the next question will be more difficult; if the student answers incorrectly, the next question will be less difficult. Selecting items tailored to a student helps reduce measurement error as the test progresses.
Technology is absolutely necessary in such a system, to avoid a drain on instructional time in test administration and data processing, as well as to provide secure and timely access to results.
6
Using Short-Cycle Interim Assessment to Improve Educator EffectivenessThe primary purpose of short-cycle interim assessment is to help improve learning for all students through regular review of student achievement, as well as subsequent adjustment of instructional strategies, difficulty level of instructional and practice materials, and targeted interventions. From this use flows the additional application to teacher and principal evaluation, but a careful and thorough implementation for instructional purposes must come first.
To clarify the use of short-cycle interim assessment in educational improvement, next is a short summary of a good implementation, which examines four key components: (1) frequency of testing, (2) prompt and knowledgeable review of data, (3) development of an action plan, and (4) periodic review of results. We will illustrate each of these elements by showing reports an assessment system generates in each phase. Note these reports show different views of the same data gathered via regular administrations of the test throughout the year. As mentioned, making multiple use of the same data is one reason why technological assessment is so highly cost-effective.
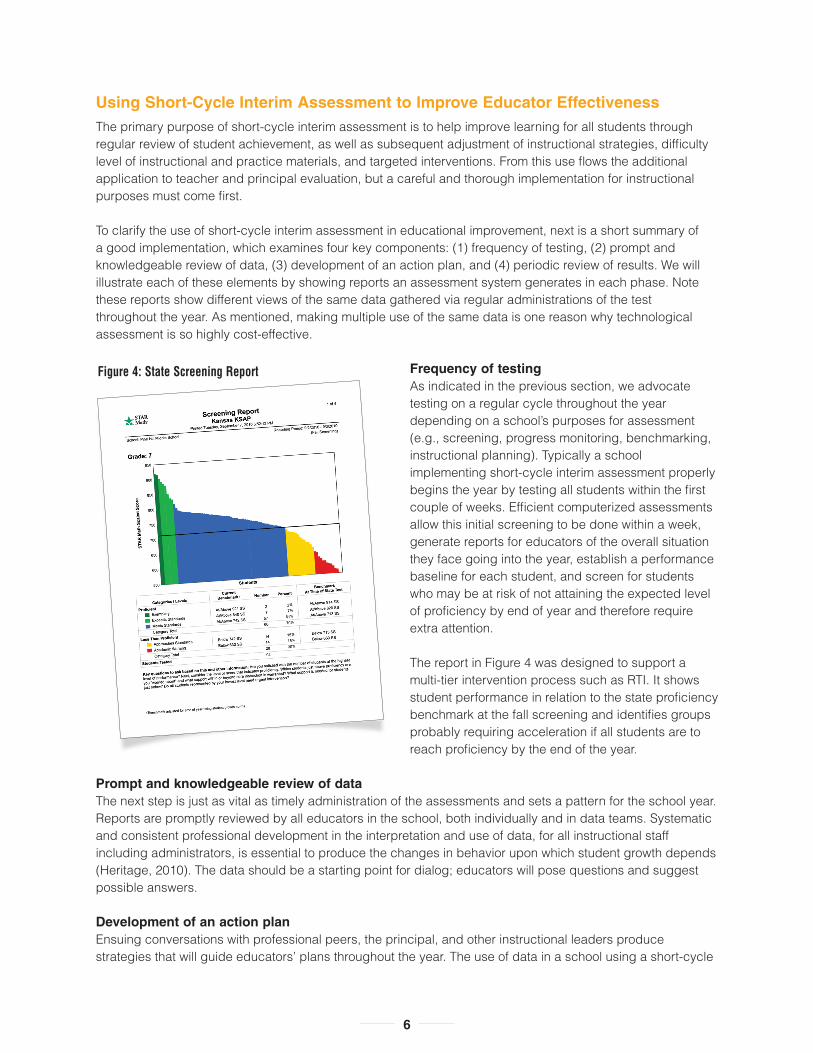
Frequency of testingAs indicated in the previous section, we advocate testing on a regular cycle throughout the year depending on a school’s purposes for assessment (e.g., screening, progress monitoring, benchmarking, instructional planning). Typically a school implementing short-cycle interim assessment properly begins the year by testing all students within the first couple of weeks. Efficient computerized assessments allow this initial screening to be done within a week, generate reports for educators of the overall situation they face going into the year, establish a performance baseline for each student, and screen for students who may be at risk of not attaining the expected level of proficiency by end of year and therefore require extra attention.
The report in Figure 4 was designed to support a multi-tier intervention process such as RTI. It shows student performance in relation to the state proficiency benchmark at the fall screening and identifies groups probably requiring acceleration if all students are to reach proficiency by the end of the year.
Prompt and knowledgeable review of dataThe next step is just as vital as timely administration of the assessments and sets a pattern for the school year. Reports are promptly reviewed by all educators in the school, both individually and in data teams. Systematic and consistent professional development in the interpretation and use of data, for all instructional staff including administrators, is essential to produce the changes in behavior upon which student growth depends (Heritage, 2010). The data should be a starting point for dialog; educators will pose questions and suggest possible answers.
Development of an action planEnsuing conversations with professional peers, the principal, and other instructional leaders produce strategies that will guide educators’ plans throughout the year. The use of data in a school using a short-cycle
Figure 4: State Screening Report
7
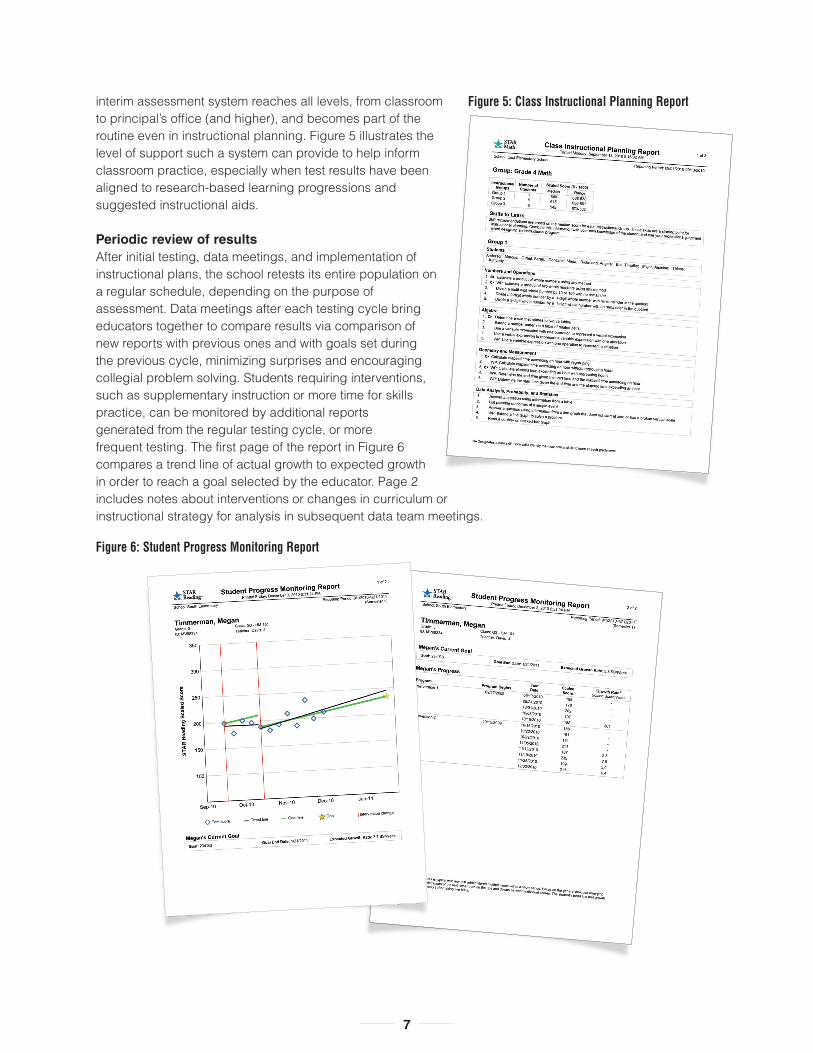
interim assessment system reaches all levels, from classroom to principal’s office (and higher), and becomes part of the routine even in instructional planning. Figure 5 illustrates the level of support such a system can provide to help inform classroom practice, especially when test results have been aligned to research-based learning progressions and suggested instructional aids.
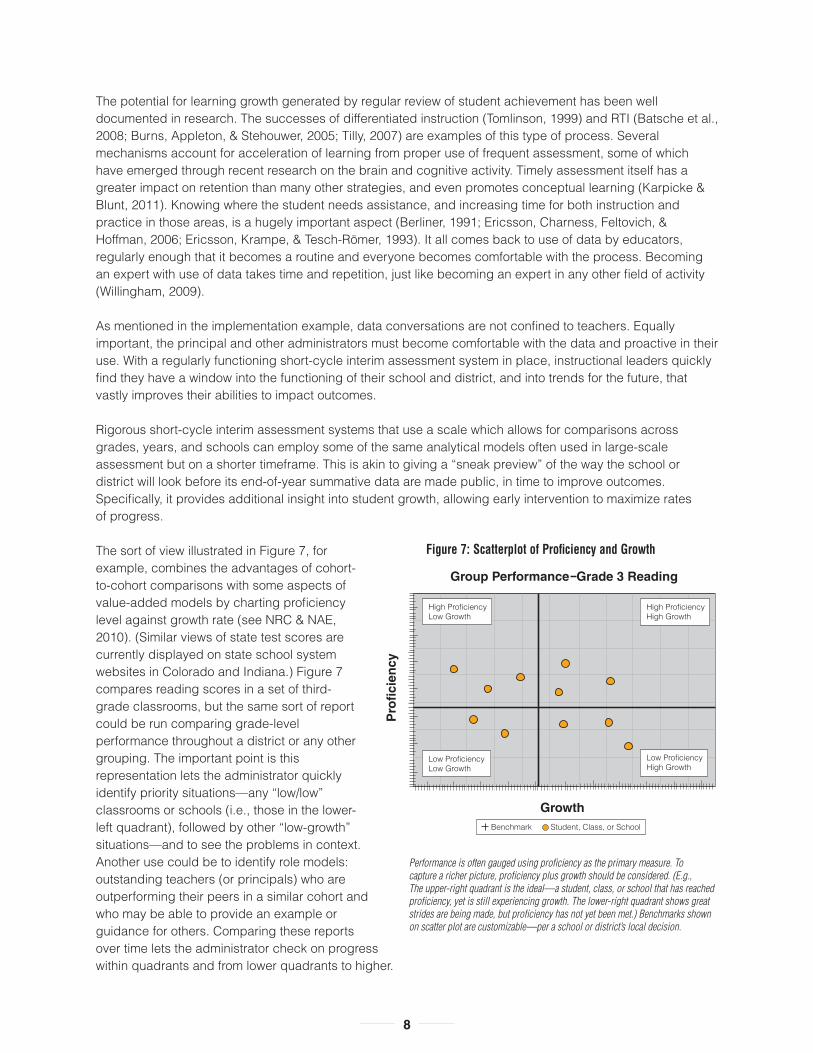
Periodic review of resultsAfter initial testing, data meetings, and implementation of instructional plans, the school retests its entire population on a regular schedule, depending on the purpose of assessment. Data meetings after each testing cycle bring educators together to compare results via comparison of new reports with previous ones and with goals set during the previous cycle, minimizing surprises and encouraging collegial problem solving. Students requiring interventions, such as supplementary instruction or more time for skills practice, can be monitored by additional reports generated from the regular testing cycle, or more frequent testing. The first page of the report in Figure 6 compares a trend line of actual growth to expected growth in order to reach a goal selected by the educator. Page 2 includes notes about interventions or changes in curriculum or instructional strategy for analysis in subsequent data team meetings.
Figure 6: Student Progress Monitoring Report
Figure 5: Class Instructional Planning Report
8
The potential for learning growth generated by regular review of student achievement has been well documented in research. The successes of differentiated instruction (Tomlinson, 1999) and RTI (Batsche et al., 2008; Burns, Appleton, & Stehouwer, 2005; Tilly, 2007) are examples of this type of process. Several mechanisms account for acceleration of learning from proper use of frequent assessment, some of which have emerged through recent research on the brain and cognitive activity. Timely assessment itself has a greater impact on retention than many other strategies, and even promotes conceptual learning (Karpicke & Blunt, 2011). Knowing where the student needs assistance, and increasing time for both instruction and practice in those areas, is a hugely important aspect (Berliner, 1991; Ericsson, Charness, Feltovich, & Hoffman, 2006; Ericsson, Krampe, & Tesch-Römer, 1993). It all comes back to use of data by educators, regularly enough that it becomes a routine and everyone becomes comfortable with the process. Becoming an expert with use of data takes time and repetition, just like becoming an expert in any other field of activity (Willingham, 2009).
As mentioned in the implementation example, data conversations are not confined to teachers. Equally important, the principal and other administrators must become comfortable with the data and proactive in their use. With a regularly functioning short-cycle interim assessment system in place, instructional leaders quickly find they have a window into the functioning of their school and district, and into trends for the future, that vastly improves their abilities to impact outcomes.
Rigorous short-cycle interim assessment systems that use a scale which allows for comparisons across grades, years, and schools can employ some of the same analytical models often used in large-scale assessment but on a shorter timeframe. This is akin to giving a “sneak preview” of the way the school or district will look before its end-of-year summative data are made public, in time to improve outcomes. Specifically, it provides additional insight into student growth, allowing early intervention to maximize rates of progress.
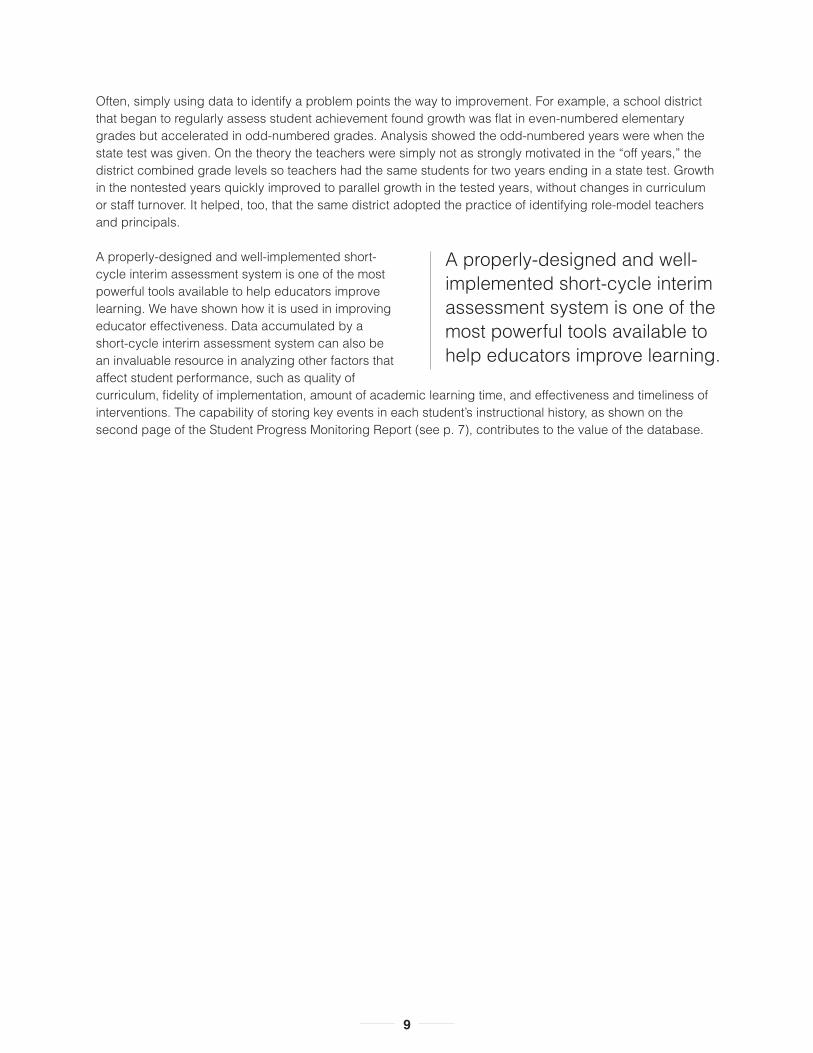
The sort of view illustrated in Figure 7, for example, combines the advantages of cohort-to-cohort comparisons with some aspects of value-added models by charting proficiency level against growth rate (see NRC & NAE, 2010). (Similar views of state test scores are currently displayed on state school system websites in Colorado and Indiana.) Figure 7 compares reading scores in a set of third-grade classrooms, but the same sort of report could be run comparing grade-level performance throughout a district or any other grouping. The important point is this representation lets the administrator quickly identify priority situations—any “low/low” classrooms or schools (i.e., those in the lower-left quadrant), followed by other “low-growth” situations—and to see the problems in context. Another use could be to identify role models: outstanding teachers (or principals) who are outperforming their peers in a similar cohort and who may be able to provide an example or guidance for others. Comparing these reports over time lets the administrator check on progress within quadrants and from lower quadrants to higher.
Pro
fici
ency
Group Performance Grade 3 Reading
Growth
Low ProficiencyLow Growth
Low ProficiencyHigh Growth
High ProficiencyLow Growth
High ProficiencyHigh Growth
Benchmark Student, Class, or School
Figure 7: Scatterplot of Proficiency and Growth
Performance is often gauged using proficiency as the primary measure. To capture a richer picture, proficiency plus growth should be considered. (E.g., The upper-right quadrant is the ideal—a student, class, or school that has reached proficiency, yet is still experiencing growth. The lower-right quadrant shows great strides are being made, but proficiency has not yet been met.) Benchmarks shown on scatter plot are customizable—per a school or district’s local decision.
9
Often, simply using data to identify a problem points the way to improvement. For example, a school district that began to regularly assess student achievement found growth was flat in even-numbered elementary grades but accelerated in odd-numbered grades. Analysis showed the odd-numbered years were when the state test was given. On the theory the teachers were simply not as strongly motivated in the “off years,” the district combined grade levels so teachers had the same students for two years ending in a state test. Growth in the nontested years quickly improved to parallel growth in the tested years, without changes in curriculum or staff turnover. It helped, too, that the same district adopted the practice of identifying role-model teachers and principals.
A properly-designed and well-implemented short-cycle interim assessment system is one of the most powerful tools available to help educators improve learning. We have shown how it is used in improving educator effectiveness. Data accumulated by a short-cycle interim assessment system can also be an invaluable resource in analyzing other factors that affect student performance, such as quality of curriculum, fidelity of implementation, amount of academic learning time, and effectiveness and timeliness of interventions. The capability of storing key events in each student’s instructional history, as shown on the second page of the Student Progress Monitoring Report (see p. 7), contributes to the value of the database.
A properly-designed and well-implemented short-cycle interim assessment system is one of the most powerful tools available to help educators improve learning.
10
Short-Cycle Interim Assessment in Educator EvaluationsIt is clear that rigorous short-cycle interim assessment systems provide a wealth of the same sort of data employed by value-added systems that use state test data. So why is short-cycle interim assessment data not used as part of every school system’s evaluation system?
One immediate answer is to avoid falling afoul of Campbell’s Law: “The more any quantitative social indicator is used for social decision-making, the more subject it will be to corruption pressures and the more apt it will be to distort and corrupt the social processes it is intended to monitor” (Campbell, 1976, as cited in Harris, 2011). If use of short-cycle interim assessment data in evaluation causes teachers to become less comfortable using those assessments as instructional improvement tools, they might start resisting their use, thereby reducing the integrity of short-cycle data for any purpose (Marion, 2010). Assuming schools are loath to lose the value of short-cycle interim assessment in the classroom, how can they avoid this pitfall?
On the facing page are guidelines for prudent evaluative use of short-cycle interim assessment, but the basic principles are simple: Make the short-cycle interim assessment data supplement, not become, the primary evaluation criterion, and always focus on the primary purpose of the short-cycle interim assessment system: helping teachers improve the performance of their students. The more regularly short-cycle interim assessment is used to support the work of the classroom, the more comfortable teachers become at relying on the data.
Although a relatively new issue in education, there is some research indicating this concern can be managed with proper planning and implementation. Studies of teacher attitudes show teachers oppose evaluation systems that are not seen as fair and accurate (Goe & Holdheide, 2011), but understand the need to include achievement data in evaluation (Harris, 2011). One recent study where the same evaluations were used for both administrative and developmental purposes showed no effect on teacher stress, turnover, performance, or acceptance of feedback (Milanowski, 2006), implying that a system which genuinely contributes to teacher development allays concerns about its evaluative uses. It is vital that short-cycle interim assessment not become the primary metric used in evaluations but a supplement to state test data and other measures of instructional practice.
Bringing short-cycle interim assessment into evaluations is not without risks, but done with proper safeguards and in the larger context of improving academic performance, it can improve the fairness of, and confidence in, evaluations. In the box at right we elaborate on a suggested list of principles for thoughtful use of short-cycle interim assessment data in educator evaluations and the overall context of improving educator effectiveness.
Bringing short-cycle interim assessment into evaluations is not without risks, but done with proper safeguards and in the larger context of improving academic performance, it could improve the fairness of, and confidence in, evaluations.
11
Short-Cycle Interim Assessment in Educator Evaluations—Safeguards for Use
1. Start with the students. Improving student achievement is the primary purpose for short-cycle interim assessment. Its use in evaluation is a consequence of its use throughout the school and throughout the school year—not a substitute for it.
2. Mandate a testing cycle. Select an assessment system that allows administrators to set regular testing windows in which all students are required to be assessed and that supplies reports monitoring compliance.
3. Test efficiently. Select a short-cycle interim assessment system that is time-effective and makes multiple uses of data, to avoid impinging on learning time and make best use of educator human resources (see the “cost of data” discussion, p. 5).
4. Provide ample professional development on understanding and using data. Training should be job-embedded, continuous, and progressive, and should reach all members of the instructional team—from administrators to classroom teachers to resource personnel.
5. Look at the data regularly at all levels. The instructional teams should have regular collegial planning sessions. Administrators should review data regularly as part of their instructional leadership, but also connected with evaluation, to avoid end-of-process surprises.
6. Identify promising practices and role models based on student growth. Regular use of data provides many opportunities for coaching and mentoring.
7. Monitor fidelity of implementation. Use a short-cycle interim assessment system that monitors student participation, appropriate progress between administrations, and other factors that can provide indicators of possible abuses.
8. Use multiple measures. Short-cycle interim assessment data should be a supplement to, not a replacement for, analysis of state test data. Also, consider using the wealth of possible comparison standards to look at growth in several different ways.
9. Be inclusive and transparent. Just as state test data on schools ultimately find their way to a public website, short-cycle interim assessment data can provide feedback to various constituencies. Feedback during the year to teachers goes without saying, but students and parents should also be kept aware of progress. A secure web-based system facilitates this kind of data sharing.
10. Evaluate the system, not just the teachers. Many factors play a part in student growth (or lack thereof). Administrators should be prepared to look at themselves, the curriculum, instructional time allocations, attendance rates, and other evidence that can provide clues on how to improve. The richness and timeliness of short-cycle interim assessment data should make this process easier, but administrators still have to ask the questions and answer them.
12
What would an evaluation system using short-cycle interim assessment data look like? The answer will depend on local preferences; given the richness of data available, the possibilities are many. Next we examine three options among many possible approaches, with the caveat that these are, at most, starting points. Much detail would need to be added, and validity carefully and professionally determined, before a district could actually put any such system into operation. These examples use only beginning and ending average student scores from a single school year, for the sake of simplicity, though comparison of intra-year trends to final outcomes could also be a fertile field for exploration.
• Example 1: Compare growth from beginning to end of school year on a short-cycle interim assessment to the growth or value-added measure from the state test, which typically compares spring to spring. Benefit: This pinpoints the actual time the teacher taught the students, omitting the potential “summer learning loss,” which can cloud conclusions based only on spring-to-spring comparisons.
• Example 2: Gauge student growth according to state benchmarks using a short-cycle interim assessment linked to the state test. This provides educators with multiple views of progress toward state benchmarks. Benefit: In addition to omitting the problematic summer period, this enables comparison of multiple data points. If the predicted and actual growth scores at both times of year are reasonably close, the two assessments tend to support each other. If they differ significantly, it may suggest additional indicators should be sought for evaluation.
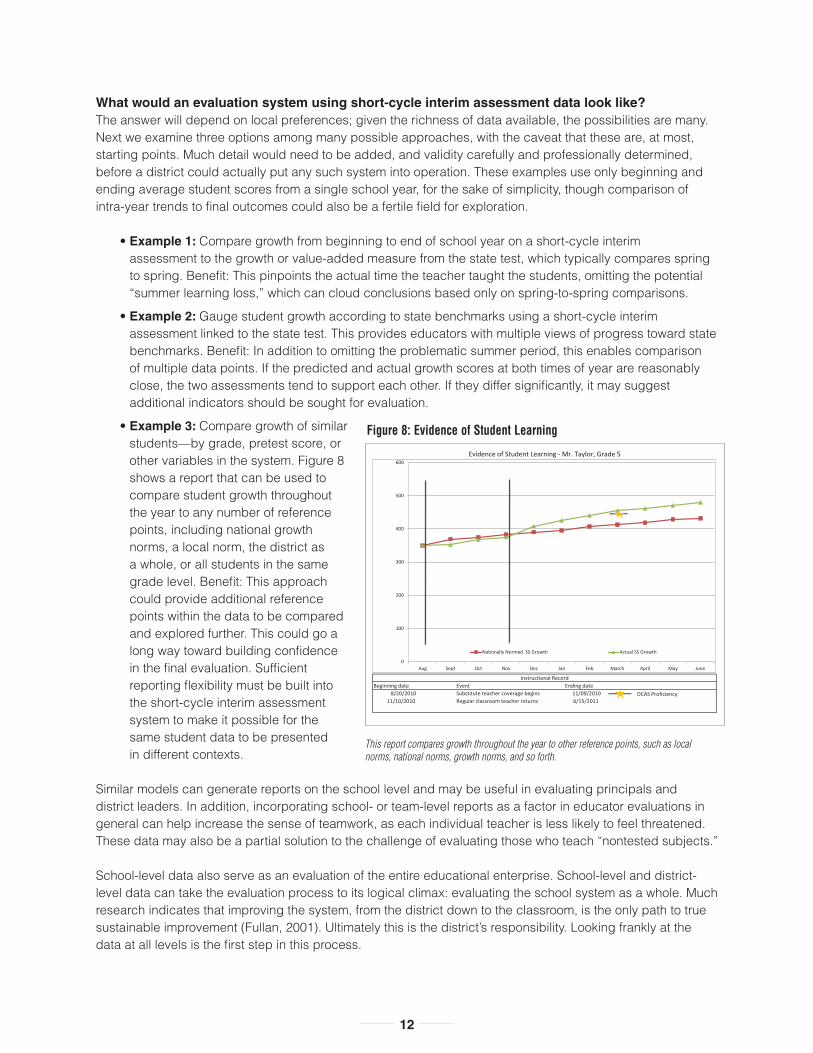
• Example 3: Compare growth of similar students—by grade, pretest score, or other variables in the system. Figure 8 shows a report that can be used to compare student growth throughout the year to any number of reference points, including national growth norms, a local norm, the district as a whole, or all students in the same grade level. Benefit: This approach could provide additional reference points within the data to be compared and explored further. This could go a long way toward building confidence in the final evaluation. Sufficient reporting flexibility must be built into the short-cycle interim assessment system to make it possible for the same student data to be presented in different contexts.
Similar models can generate reports on the school level and may be useful in evaluating principals and district leaders. In addition, incorporating school- or team-level reports as a factor in educator evaluations in general can help increase the sense of teamwork, as each individual teacher is less likely to feel threatened. These data may also be a partial solution to the challenge of evaluating those who teach “nontested subjects.”
School-level data also serve as an evaluation of the entire educational enterprise. School-level and district-level data can take the evaluation process to its logical climax: evaluating the school system as a whole. Much research indicates that improving the system, from the district down to the classroom, is the only path to true sustainable improvement (Fullan, 2001). Ultimately this is the district’s responsibility. Looking frankly at the data at all levels is the first step in this process.
Figure 8: Evidence of Student Learning
Beginning date Event Ending date 8/20/2010 Substitute teacher coverage begins 11/10/2010 Regular classroom teacher returns
Evidence of Student Learning - Mr. Taylor, Grade 5
Instructional Record
6/15/2011
11/09/2010
0
100
200
300
400
500
600
Aug Sept Oct Nov Dec Jan Feb March April May June
Nationally Normed SS Growth Actual SS Growth
DCAS Proficiency
This report compares growth throughout the year to other reference points, such as local norms, national norms, growth norms, and so forth.
13
The State Consortium on Educator Effectiveness Initiative: A Model for Using Data to Improve Teaching, Leading, and Student AchievementThe recently-formed State Consortium on Educator Effectiveness (SCEE) of the Council of Chief State School Officers (CCSSO) provides one framework for what we propose in this paper: to improve learning, teaching, and leading by incorporating evaluation into the larger “effectiveness” context. CCSSO has announced an ambitious initiative to bring together state teams of chief school officers, administrators, board members, practitioners, union representatives, and legislators, with representatives of philanthropic and business organizations, to work out detailed recommendations for policies and procedures to improve educator effectiveness.
SCEE’s framework comprises six strands in a strategy to “increase the effectiveness of teaching and leading to improve student achievement and eliminate disparities” (http://scee.groupsite.com/main/summary). The three strands that will be prioritized during the first year parallel the uses of short-cycle interim assessment data outlined in this paper. Each of these strands will require use of data in one manner or another and should, we believe, incorporate short-cycle interim assessment into its planning and implementation.
• Standards: Aligning the new Common Core State Standards with state standards and making them tools for reform strongly implies they must be incorporated into daily classroom work in a natural way. Regular assessment with tests linked to standards keeps the teacher focused on standards-based goals; if such assessments also generate instructional guidance (as recommended on pp. 6–9), they can go a long way toward making the standards tangible and relevant to teachers and students.
• Professional Growth: Learning from results, feedback, and collaborative work with other educators is an essential aspect of implementing short-cycle interim assessment. As mentioned on p. 7, short-cycle systems that allow teachers to record information about interventions and other classroom activities can help measure effectiveness of instructional strategies. And, as has been stated throughout this paper, regular professional development is integral to a short-cycle interim assessment implementation in both its evaluation and effectiveness aspects.
• Evaluation: Topics already identified for the SCEE initiative include multiple measures of student performance, as well as how to measure it, use it in teacher evaluations, and aggregate it for principals (and superintendent) evaluations. On pp. 6–9 is considerable information about how short-cycle interim assessment addresses these issues and others in evaluating teaching and leading.
The SCEE initiative shows great promise for tapping the combined momentum of two movements—Common Core State Standards and teacher evaluation—to power meaningful improvements in overall educator effectiveness. Many tools will need to be employed to reach this goal, and short-cycle interim assessment technology should be one of those tools.
14
ConclusionShort-cycle interim assessment—the scheduled, frequent assessment of student progress toward standards-based goals—should play a central role in the development of systems to improve schools and student outcomes, both through teacher evaluation and through broader improvement of educator effectiveness. The proper use of classroom-based assessment technology to advance learning is well documented in research. With due care, the same technology can play a part in systemwide improvement. Only technology that is efficient, versatile, psychometrically sound, and teacher-friendly will deliver on this promise—and only if it is implemented with full attention to training and coaching to make regular and constructive use of it.
During the more than 20 years Renaissance Learning has been helping educators use data to improve student achievement, we have seen many reform movements come and go. Most that have “gone” have done so because they were based on flawed theories or insufficient data, or were insufficiently supported at the grassroots or policy level—or both. Using achievement data to improve school performance is amply supported by research, and such initiatives as SCEE are indications the different constituencies involved in public education may be coming to a consensus on this direction. If these trends can continue and be brought to fruition, it bodes well for the future of the country and our students.
Short-cycle interim assessment should play a central role in the development of systems to improve schools and student outcomes, both through teacher evaluation and through broader improvement of educator effectiveness.
15
ReferencesAuguste, B., Kihn, P., & Miller, M. (2010). Closing the talent gap: Attracting and retaining top-third graduates to careers in teaching: An international and market research-based perspective. New York: McKinsey & Company. Retrieved March 17, 2011, from http://www.mckinsey.com/App_Media/Reports/SSO/closing_the_talent_gap_september_2010.pdf
Baker, E. L., Barton, P. E., Darling-Hammond, L., Haertel, E., Ladd, H. F., Linn, R. L., Ravitch, D., ... Shephard, L. A. (2010). Problems with the use of student test scores to evaluate teachers (EPI Briefing Paper #278). Washington, DC: Economic Policy Institute.
Batsche, G., Elliott, J., Graden, J. L., Grimes, J., Kovaleski, J. F., Prasse, D., et al. (2008). Response to intervention: Policy considerations and implementation. Alexandria, VA: ASCD.
Berliner, D. C. (1991). What’s all the fuss about instructional time? In M. Ben-Peretz & R. Bromme (Eds.), The nature of time in schools: Theoretical concepts, practitioner perceptions. New York: Teachers College Press. Retrieved March 16, 2011, from
http://www.timeandlearning.org/pdf/Berliner%20What%27s%20all%20the%20fuss%20about%20instructional%20time.pdf
Black, P., & Wiliam, D. (1998a). Assessment and classroom learning. Educational Assessment: Principles, Policy and Practice, 5(1), 7–74
Black, P., & Wiliam, D. (1998b). Inside the black box: Raising standards through classroom assessment. Phi Delta Kappan, 80(2), 139–148.
Bryk, A. S., Sebring, P. B., Allensworth, E., Luppescu, S., & Easton, J. Q. (2010). Organizing schools for improvement: Lessons from Chicago. Chicago, IL: The University of Chicago Press.
Burns, M. K., Appleton, J. J., & Stehouwer, J. D. (2005). Meta-analysis of response-to-intervention research: Examining field-based and research-implemented models. Journal of Psychoeducational Assessment, 23, 381–394.
Donaldson, M. L. (2009). So long, Lake Wobegon? Using teacher evaluation to raise teacher quality. Washington, DC: Center for American Progress. Available online from http://www.americanprogress.org
Ericsson, K. A., Charness, N., Feltovich, P. J., & Hoffman, R. R. (Eds.). (2006). The Cambridge handbook of expertise and expert performance. New York: Cambridge University Press.
Ericsson, K. A., Krampe, R. T., & Tesch-Römer, C. (1993). The role of deliberate practice in the acquisition of expert performance. Psychological Review, 100(3), 363–406.
Fullan, M. (2001). The new meaning of educational change. New York: Teachers College Press.
Gersten, R., Compton, D., Connor, C. M., Dimino, J., Santoro, L., Linan-Thompson, S., & Tilly, W. D., III. (2008). Assisting students struggling with reading: Response to intervention and multi-tier intervention for reading in the primary grades. A practice guide. (NCEE 2009-4045). Washington, DC: U.S. Department of Education, Institute of Education Sciences, National Center for Educational Evaluation and Regional Assistance. Retrieved March 16, 2011, from http://ies.ed.gov/ncee/wwc/pdf/practiceguides/rti_reading_pg_021809.pdf
Glazerman, S., Loeb, S., Goldhaber, D., Staiger, D., Raudenbush, S., & Whitehurst, G. (2010). Evaluating teachers: The important role of value-added. Washington, DC: The Brown Center Task Group on Teacher Quality at Brookings.
Goe, L., & Holdheide, L. (2011). Measuring teaching contributions to student learning growth for “the other 69 percent” (Policy- to-Practice Brief). Washington, DC: National Comprehensive Center for Teacher Quality.
Goertz, M. E., Oláh, L. N., & Riggan, M. (2009). From testing to teaching: The use of interim assessments in classroom instruction (CPRE Research Report # RR-65). Philadelphia: University of Pennsylvania, Graduate School of Education, Consortium
for Policy Research in Education.
Goldhaber, D. (2010). When the stakes are high, can we rely on value-added? Washington, DC: Center for American Progress.
Harris, D. N. (2011). Value-added measures in education: What every educator needs to know. Cambridge, MA: Harvard Education Press.
Heritage, M. (2010). Formative assessment and next-generation assessment systems: Are we losing an opportunity? Washington, D.C: Council of Chief State School Officers.
Kane, T. J., & Cantrell, S. (2010). Learning about teaching: Initial findings from the Measures of Effective Teaching Project. Seattle, WA: Bill & Melinda Gates Foundation. Karpicke, J. D., & Blunt, J. R. (2011). Retrieval practice produces more learning than elaborative studying with concept mapping. Science, 331(6018), 772–775. Available online from http://www.terpconnect.umd.edu/~jpfisher/index_files/L0P1.pdf
16
Kurns, S., & Tilly, W. D., III. (2008, May). Response to intervention blueprints for implementation: School building level. Alexandria, VA: National Association of State Directors of Special Education, Inc. Retrieved February 19, 2009, from
http://www.nasdse.org/Portals/0/SCHOOL.pdf
Laurits R. Christensen Associates. (2010). A cost analysis of early literacy, reading, and mathematics assessments: STAR, AIMSweb, DIBELS, and TPRI. Madison, WI: Author. Available online from http://doc.renlearn.com/KMNet/R003711606GF4A4B.pdf
Marion, S. (2010, October). Theories of action as a tool for explicating policy goals and intended uses of assessments. Presentation in Reidy Interactive Lecture Series, Cambridge, MA. Dover, NH: National Center for the Improvement of Educational Assessment.
McBride, J., Stickney, E., Milone, M., & Ysseldyke, J. (2010). Technical adequacy and cost benefit of four measures of early literacy. Canadian Journal of School Psychology, 25(2), 189–204.
Milanowski, A. T. (2006). Split roles in performance evaluation—A field study involving new teachers. Journal of Personnel Evaluation in Education, 18, 153–169.
Milanowski, A. T. (2010, November). Measuring teacher performance for strategic human capital management. Paper presented at Educator Effectiveness Symposium of Connecticut Association of Public School Superintendents, West Hartford, CT.
Milanowski, A. T., Prince, C. D., & Koppich, J. (2007). Observation of teachers’ classroom performance. Washington, DC: U.S. Department of Education, Office of Elementary and Secondary Education, Center for Educator Compensation Reform.
National Research Council, & National Academy of Education. (2010). Getting value out of value-added: Report of a workshop. Committee on Value-Added Methodology for Instructional Improvement, Program Evaluation, and Educational
Accountability, H. Braun, N. Chudowsky, & J. Koenig (Eds.). Center for Education, Division of Behavioral and Social Sciences and Education. Washington, DC: The National Academies Press.
Odden, A. (2011). Strategic management of human capital in education. New York: Routledge.
Popham, W. J. (2011, February 22). Formative assessment—A process, not a test. Education Week.
Rivkin, S. G., Hanushek, E. A., & Kain, J. F. (2002). Teachers, schools, and academic achievement. Dallas: University of Texas, Texas Schools Project.
Sanders, W., & Horn, S. (1998). Research findings from the Tennessee value-added assessment system (TVAAS) database: Implications for educational evaluation and research. Journal for Personnel Evaluation in Education, 12(3), 247–256.
Sanders, W., & Rivers, J. (1996). Cumulative and residual effects of teachers on future student academic achievement: Research progress report. Knoxville: University of Tennessee Value-Added Research and Assessment Center.
Sawchuk, S. (2009, December 16). New teacher-evaluation systems face obstacles. Education Week. Sawchuk, S. (2011, February 2). Wanted: Ways to assess most teachers. Education Week.
Schochet, P. Z., & Chiang, H. S. (2010). Error rates in measuring teacher and school performance based on student test score gains (NCEE 2010-4004). Washington, DC: U.S. Department of Education, Institute of Education Sciences, National
Center for Education Evaluation and Regional Assistance.
Steele, J. L., Hamilton, L. S., & Stecher, B. M. (2010). Incorporating student performance measures into teacher evaluation. Santa Monica, CA: RAND Corporation.
Tilly, W. D., III. (2007). Response to intervention on the ground: Diagnosing the learning enabled. Presentation to Alaska Department of Education and Early Development Winter Education Conference, Informing Instruction: Improving
Achievement, Johnston, IA.
Tomlinson, C. (1999). The differentiated classroom: Responding to the needs of all learners. Alexandria, VA: ASCD.
Willingham, D. T. (2009). Why don’t students like school? A cognitive scientist answers questions about how the mind works and what it means for the classroom. San Francisco: John Wiley & Sons, Inc.
Wurtzel, J., Marion, S., Perie, M., & Gong, B. (2009). The role of interim assessments in a comprehensive assessment system. In L. M. Pinkus (Ed.), Meaningful measurement: The role of assessments in improving high school education in the twenty-
first century. Washington, DC: Alliance for Excellent Education.
17
Acknowledgements Renaissance Learning sincerely thanks the following individuals for lending their expertise in reviewing this paper.
Damian Betebenner, Ph.D., is an associate at The National Center for the Improvement of Educational Assessment in Dover, New Hampshire. His areas of specialization include applied statistics, particularly with regard to large scale data analysis. His current research interests center around longitudinal data analysis, specifically with regard to state and federal performance mandates.
Joseph Betts, MMIS, Ph.D., NCSP, is the senior measurement statistician at Renaissance Learning. His research has focused on the development of growth norms for evaluating student growth relative to similar performing peers and the use of technology-enhanced progress-monitoring tools. In addition, he has done research on the moderating role of language proximity between the development of oral fluency and reading comprehension. Margaret Heritage, Ph.D., is assistant director for professional development at the National Center for Research on Evaluation, Standards, and Student Testing (CRESST) at UCLA. Her current work focuses the development of academic language for EL students and formative assessment, including teachers’ use of formative assessment evidence. She has made numerous presentations on these topics all over the United States, in Europe, and in India.
James R. McBride, Ph.D., is vice president and chief psychometrician for Renaissance Learning. He was a leader of the pioneering work related to computerized adaptive testing (CAT) conducted by the Department of Defense and co-authored a leading book on the development of CAT. McBride has also been instrumental in the practical application of item response theory (IRT). At Renaissance Learning, he has contributed to the research and development of STAR Math, STAR Reading, and STAR Early Literacy.
Allan Odden, Ph.D., is co-director of Strategic Management of Human Capital (SMHC) in education, a project of the Consortium for Policy Research in Education (CPRE). He also is professor of educational leadership and policy analysis at the University of Wisconsin–Madison. He is an international expert on the strategic management of human capital in education, teacher compensation, teacher evaluation, education finance, effective resource allocation and use, and educational policy.
We also appreciate the feedback received from the following associations:
Council of Chief State School OfficersNational Association of State Boards of EducationNational Conference of State LegislaturesNational Education Association
A special thank you to the following Renaissance Learning State Advisors:
Marilyn Howard, Ed.D., former Idaho State Superintendent Michael Ward, Ed.D., former North Carolina State Superintendent

18
19
About Renaissance LearningRenaissance Learning, Inc., is a leading provider of technology-based school improvement and student assessment programs for K–12 schools. Adopted by more than 70,000 schools, Renaissance Learning’s software tools range from daily classroom assessment and periodic progress-monitoring technology to norm- and criterion-referenced assessments of early literacy, reading, and math.
First released in 1996, STAR Early Literacy, STAR Reading, and STAR Math—short-cycle interim assessments that provide student achievement data during the school year for use in instructional planning—are the most widely used standardized tests in American schools. Computer-adaptive and employing the best practices of item response theory, these assessments generate highly reliable results at any time during the school year and for students at widely varying levels of academic achievement, with full comparability of scores from month to month, year to year, and grade level to grade level. Administered entirely on computer to maximize teachers’ time for instruction, they can be given frequently (e.g., monthly) for screening, monitoring growth, determining the effectiveness of instruction and intervention, instructional planning, and gauging progress toward state and Common Core standards. STAR assessments also have been linked to most state summative tests, often through student-to-student studies that produce the highest attainable confidence level in extrapolating end-of-year results from interim assessment.
Renaissance Learning’s testing and mastery management programs are highly rated by the National Center on Response to Intervention (NCRTI), the National Center on Student Progress Monitoring, and the National Dropout Prevention Center, among other agencies. Renaissance Learning is a frequent collaborator with the Council of Chief State School Officers (CCSSO) and other organizations on matters related to educational improvement.
Damian Betebenner, Ph.D., is an associate at The National Center for the Improvement of Educational Assessment in Dover, New Hampshire.
Joseph Betts, MMIS, Ph.D., NCSP, is the senior measurement statistician at Renaissance Learning.
Margaret Heritage, Ph.D., is assistant director for professional development at the National Center for Research on Evaluation, Standards, and Student Testing (CRESST) at UCLA.
James R. McBride, Ph.D., is vice president and chief psychometrician for Renaissance Learning.
Allan Odden, Ph.D., is co-director of Strategic Management of Human Capital (SMHC) in education, a project of the Consortium for Policy Research in Education (CPRE).
AcknowledgementsRenaissance Learning sincerely thanks the following individuals for lending their expertise in reviewing this paper. (To learn more, please see the detailed Acknowledgements section inside.)
L2716.0411.FP.2.5MR53142