Embed Size (px)
Citation preview

Using Simulation-based Optimization in the Context of IT ServiceManagement Change Process
Mercedes Ruiza,∗, Javier Morenob, Bernabe Dorronsoroa, Daniel Rodriguezb
aDept. of Computer Science and Engineering, University of Cadiz, 11519 - Puerto Real (Cadiz), SpainbDept. of Computer Science, University of Alcala, 28871, Spain
Abstract
Today’s IT systems and IT processes must be ready to handle change in an efficient and responsive
manner to allow businesses to both evolve and adapt to a changing world. In this paper we describe
an approach that consists of using simulation based multi-objective optimization to select optimal
ITIL change management process strategies that help IT managers achieve process efficiency as a
Critical Success Factor (CSF). A multi-method simulation model, which is based on agent-based
and discrete-event simulation paradigms, has been built to simulate the whole process lifecycle,
since the change initiation until its closure. As most engineering problems, assuring an efficient
delivery of the change management process requires optimizing simultaneously the corresponding
Key Performance Indicators (KPIs) in which the process-efficiency CSF can be rolled down. In this
paper, we show the results of applying two well-known Multi-Objective Evolutionary Algorithms,
namely NSGA-II and SPEA2, to obtain a set of optimal solutions for the KPIs associated with
delivering process efficiency as a CSF. We also compare the results obtained with the output from
the single-objective optimization algorithm provided by the simulation tool. The experimental
work included shows how the approach can provide the IT manager with a wide range of high
quality solutions to support them in their decision-making towards CSF achievement.
Keywords: Service Management, Change Process, ITIL, Multi-objective optimization,
Evolutionary algorithms, Simulation
∗Corresponding authorEmail addresses: [email protected] (Mercedes Ruiz), [email protected] (Javier Moreno),
[email protected] (Bernabe Dorronsoro), [email protected] (Daniel Rodriguez)
Preprint submitted to DSS June 14, 2018

1. Introduction
In our current digital world, Information Technology (IT) plays a crucial role to help organi-
zations succeed in delivering value to their customers. In response to this growing dependence
on technology, today’s IT organizations need to be both effective and efficient in transforming re-
sources into valuable services. IT Service Management (ITSM) is defined as the strategic approach5
to the design, delivery, management, and improvement of the way in which IT is used within an
organization.
Since technology and the IT infrastructure are constantly changing and advancing in today’s
world, organizations such as IT service providers must be ready and able to adapt themselves to
evolving conditions if they want to remain competitive and innovative. To this end, the different10
ITSM guides and standards provide guidance about how to manage change in a productive way,
ensuring that new or modified IT services evolve along their lifecycle under a controlled and well-
organized manner that keeps these services compliant with the business requirements.
There are different ITSM best-practice guides and standards that help organizations implement
an ITSM strategy. A 2017 report, based on a survey of 261 IT leaders in large organizations around15
the world [18], shows that the top five most used ITSM approaches are: Information Technology
Infrastructure Library (ITIL) (47%) [3], Business Process Framework (eTOM) (36%) [48], Control
Objectives for Information and Related Technologies (COBIT) (36%) [20], Microsoft Operations
Framework (MOF) (34%) [33] and ISO/IEC 20000 (29%) [21].
Among all the existing ITSM guides, we focus in this work on the ITIL proposal, the most widely20
used one. In fact, it is regarded by many as the de-facto standard for ITSM and its terminology is
widely understood and used. ITIL follows a process-driven approach that is grounded in business
experience. It offers a set of best practices for IT service management and delivery under an
ITSM approach. The ITIL framework comprises the definition of 26 process areas used to describe
how IT services evolve through the five main stages of their lifecycle. ITIL consists of five core25
publications, namely, (i) Service Strategy, (ii) Service Design, (iii) Service Transition, (iv) Service
Operation, and (v) Continual Service Improvement, each one dedicated to describe in depth each
of the five stages of an IT service lifecycle.
The ITIL service transition stage is precisely aimed at helping organizations plan and manage
the change of state of services in their lifecycle, in a controlled manner, minimizing the risks and30
2

ensuring that the services meet the customer’s expectations and the business requirements [36].
One of the critical processes within service transition is change management. According to ITIL,
the purpose of the change management process is to control the lifecycle of all changes, enabling
beneficial changes to be made with minimum disruption to IT services [36]. The scope of change
management covers changes to service assets and configuration items across the whole service35
lifecycle. The process addresses all changes at all levels: strategic, tactical and operational.
Today’s organizations demand service changes to be performed in less and less time without
compromising efficiency. Thus, efficient change management is essential, since the consequences
associated with process inefficiency reach the customer. Low quality service changes often lead to
new incidents that result in customer dissatisfaction.40
Change management needs the involvement of several types of resources, with their correspon-
dent costs. Among them, human resources are crucial for the outcomes of the process. These
resources are commonly structured in IT support groups. Each one plays a different role in the
process such as change initiators, developers, deployers, etc., that can be part of IT staff or working
for third-party organizations. In practice, all these factors are combined to make the entire change45
process highly unpredictable, where outcomes depend on complex interactions between different
changes, people and groups, each of which, have their own priorities and objectives. Although ITIL
and other ITSM frameworks provide important guidance, managing change in real organizations
is a very complex process. Also, change management often requires optimizing several objectives
simultaneously, such as maximizing the percentage of changes completed on time and minimizing50
the change duration ratio and the number of resources used.
Therefore, change management is a complex problem that organizations need to handle in an
effective way when coping with service transition processes. The goal is to perform the changes with
the lowest impact on the Quality of Experience (QoE) perceived (as service disruption, incidents
with other live services, or any other issue that might affect customers’ satisfaction), but also55
with the lowest effort for the organization (as minimizing the cost of the change or the resources
required). Often, the interests of organization and customers are in conflict, e.g., reducing the time
required for the change management process leads to a cost rise for the organization. Optimization
techniques can be very valuable tools used to both find high quality solutions to support decision-
making and to ensure an efficient change management delivery.60
3

Particularly, multi-objective optimization algorithms can effectively handle the optimization of
different conflicting objectives simultaneously, offering a wide and diverse range of trade-off solu-
tions to the problem, helping the IT manager to make the most appropriate decisions. In order
to guide the search towards high-quality solutions for such a complex problem involving a large
number of processes, interactions among them, and uncertainties, these algorithms must rely on ac-65
curate simulations. This approach is explicitly proposed in frameworks to improve decision-making
in the ITSM scope, such as the Sim4ITSM framework, which includes activities of simulation op-
timization in the experimentation phase of the method [39].
The main contribution of this work is a novel application of the multi-objective simulation op-
timization approach for the IT change management process problem aimed at supporting effective70
decision making. To this end, we introduce a simulation approach that relies on both the agent-
based and discrete event simulation paradigms to model the ITIL change process. We define the
problem of optimizing process efficiency according to three main goals: 1) the size of the staff to
perform the changes, 2) the change duration ratio, and 3) the percentage of changes completed,
which are optimized simultaneously. The problem is tackled with two well-known Multi-Objective75
Evolutionary Algorithms (MOEAs), NSGA-II and SPEA2. The MOEAs outperform the reference
result provided by the single-objective optimization obtained from the simulation software used
to build the simulation model. This research represents pioneering work related to the use of
multi-objective approaches in simulation-based optimization in the context of ITSM.
The structure of the paper is organized as follows. Section 2 summarizes the works related to our80
proposal. Section 3 describes the simulation model built for the ITIL change process. Section 4
introduces the MOEAs used in this study and the coupling structure followed to integrate the
simulation software with the multi-objective optimization framework. Section 5 describes the
experimental work performed. Finally, Section 6 outlines the conclusions and our further work.
2. Related Work85
In this section, we cover the most relevant works related to our study. Section 2.1 addresses
contributions focusing on the design of ITSM simulators. We present the results of a systematic
search in the literature of simulation-based optimization in the context of ITSM in Section 2.2.
4

2.1. Simulation in ITSM
Simulators have been demonstrated to be very useful tools for decision support systems to help90
decision makers in their activity. We can find many examples in the literature, with different fields
of application as logistics [17], planning [41], economics [52, 8], or supply chains [19], among many
others. The use of simulation modeling to address ITSM problems has been an active topic of
research in the last years. The most relevant works in the scope of the service change management
process are reviewed next, and we refer the reader to the work by Orta et al [39] for a more95
comprehensive literature review.
In [32], authors describe a System Dynamics model to address the problem of low-performing
IT operation by adopting and sustaining IT change and access controls. The simulation model built
helped to validate “underlying observations that change and access controls simultaneously reduce
the security risk and increase the efficiency and effectiveness of IT management and operations”.100
Planning and scheduling of changes were identified among the main challenges in IT change
management according to the results of a survey carried out by Hewlett Packard in 2006 [40]. The
topic of the efficient management of a set of application changes under possible scheduling conflicts
was addressed by Luo et al [31]. The authors use graph and queue modeling to simulate different
scheduling heuristics and find their impact on the change completion time and the change capacity105
of the system. The work finds the limit values for the degree of the scheduling conflicts and the
cross-training of executing personnel that help keep the average change delay in the lowest level.
In addition to an efficient scheduling of changes, it is also very important to estimate the business
impact of operational risk resulting from changes. One proposal that quantifies this impact in terms
of financial loss was described by Setzer et al [42]. In this work, a probabilistic model for analyzing110
the business impact of changes in a network of services is introduced together with a decision model
for service changes scheduling with the aim of reducing the total expected change-related costs.
The proposal is then evaluated by using discrete event simulations of different scenarios.
Silva and Yaix [44] propose process simulation as a key element to guide the CIO and CEO in
strategic business and IT alignment. They show the benefits of their proposal by simulating the115
incident and problem management process from the COBIT framework (which are sub-processes
of the change management process in the ITIL framework). In this case, the simulation model is
built using ADOIT R©, which uses its own modeling language and provides basic simulation analysis
5

tools, such as cycle-time and resource-utilization reports.
Simulation has also been used as a means to generate data that help validate conceptual as-120
sumptions. One example of this kind of application was reported by Cordeiro et al [11]. In this
work, simulation is used to generate the change logs that are consumed during the mining process
whose conceptual and technical feasibility is being proved. Yang et al [51] is another example of
the use of simulated data to evaluate a proposal. In this case, the term simulation is used with its
most general meaning, that is, the data used to validate “a patch management framework based on125
SLA-driven patch applicability analysis” is not real but mocked, i.e., simulated. Even though these
works are in the context of improving some aspects of the change management process, their main
contributions are not aimed at building simulation models. They make use of the term “simulation”
to denote that to test their proposals they are using data that imitates real-life ones. Therefore,
they differentiate from our work since in our case, the simulation model is the core element of our130
contribution aimed to design and test effective process improvement initiatives.
To the best of our knowledge, Thanheiser et al [47] is the only existing work describing the
architecture of an agent-based simulation model developed to assess an IT service architecture with
respect to service availability and service level management. Our research shares with Thanheiser
et al [47] the use of the agent-based simulation to address problems in the IT service management135
landscape. However, while Thanheiser et al’s work aims at building a simulator to help in the
”design-time assessment of an IT service architecture”, our work is focused on optimizing the
execution of one key IT service management process: the service change management. Besides,
while their work is focused on providing IT management with an assessment tool for particular
service-oriented architecture implementations using agent-based simulation, our work is aimed at140
helping IT management to improve their decision making by optimizing the simulation of the IT
management processes, being the IT service change management process the focus of this work.
2.2. Simulation Optimization in ITSM
Simulation models allow the user to evaluate the outcomes of different process configurations
and can help them find the combination of input values that lead to optimal process performance.145
When the number of different process configurations one is interested in evaluating is very large, the
number of alternative configurations to simulate and compare grows exponentially. In these cases,
it is helpful to integrate simulation with optimization techniques [29]. Simulation optimization
6

Table 1: Keywords used for the search
Category Keywords
Information Technology Service Management ITSM, ITIL
Simulation Simulation, simulating, simulate
Optimization Optimization, optimization
Multi-objective Multi-objective
can be defined as the process of finding the best values for a number of decision variables of a
system, where the performance is evaluated based on the output of a simulator that models the150
system [37]. Simulation optimization is not a novel concept. Metaheuristics addressing problems
that involve simulation are known as simheuristics [9, 25]. They have been widely used to deal with
problems that require reproducing the behavior of real systems, where uncertainties can be present
in different ways. Simheuristics have also been applied with multi-objective optimization [49]. Some
application examples include problems related to mobile networks [15], production planning [35],155
medicine [30], or water reservoir hedging [45], among many others.
In order to find similar research initiatives aimed at using simulation optimization in the scope
of ITIL, and more specifically, in the scope of the change management process, we performed a
methodical search of the literature. Our aim is not to perform a systematic literature review study,
but to apply a rigorous method to our searches so that the relevant related works can be identified.160
A set of different categories and keywords, together with their respective synonyms, acronyms, and
alternative spellings was designed as shown in Table 1 with the keywords used for the searching
process. When adding the keyword multi-objective, there were no results.
The digital libraries (DL) where the searches were performed were: IEEE Xplore, ACM Digital
Library, ScienceDirect, ISI Web of Knowledge, EI Compendex, SpringerLink, Inspec, Scopus and165
Kluwer.
Only 14 papers where found by the searches conducted. In most of the papers retrieved, the
term optimization is used in its most general meaning, far from any form of mathematical or
meta-heuristic optimization. After removing three papers that were duplicated, the final number
of papers retrieved in the search was 11. A first analysis of the papers retrieved, led us to discard 4170
papers based on the fact that they were not properly related to the field of simulation optimization
within the IT service management scope. This is the case of Xu et al [50], which describes the
7

current state and development plans for research and education on Services Sciences, Management
and Engineering (SSME) in the Harbin Institute of Technology (HIT) or Amin et al [1], which
introduces the ProCEM R© method (Process-Centric Enterprise Modeling & Management) that175
follows the process-centric application systems development style and integrates different services
concerned with organization structure and IT applications to support, execute, or even automate
the processes. Simulation and Optimization are among the components of this framework. They
are also mentioned as part of the method described by Shrinivasan et al [43] that helps validate
the intuitive direction and the polarity of a causal relationship among IT service Key Performance180
Indicators (KPIs) and estimate the values of the KPIs. Finally, simulation is used as a means to
assess a distributed IT management framework as described by Jiang [24].
The exclusion of these non-related works left us with only 7 papers that could be analyzed as
truly related to the aim of our work, which is to find existing works that apply simulation-based
optimization in the scope of IT service management, and more specifically the ITIL change process.185
Most of the regular papers retrieved propose the use of simulation as a means to help decision-
making or mitigate risks. The trade-off between energy-efficiency and resilience in communication
networks is addressed by Cholda and Jaglarz [10] as a risk mitigation problem. In their work,
the authors propose a method to find an optimal solution that mitigates risk by iteratively com-
bining simulations and linear programming. The method is based on repeating a simplified risk190
management cycle, where the optimization represents the risk control phase and the simulation
represents the risk assessment. Risk mitigation and management is among the challenges of IT
processes and among the priorities of IT governance activities carried out in organizations. Krey
et al [27] deal with the importance of IT governance in the Swiss healthcare sector. They conclude
that IT governance can help optimize the business processes in the medical as well as non-medical195
areas of a hospital. This work highlights the importance of having specific process models for the
health sector to optimize hospital strategies, making adequate business decisions and minimize
risks. It does not propose any method of integrating simulation and optimization techniques in the
IT processes of the healthcare sector and concludes with the necessity of carrying out a survey to
find out the current status and spread of IT governance in the mentioned sector.200
The incident management process has been the process that has attracted most of the research
done applying simulation techniques. According to ITIL [22], incident management is “the process
8

through which IT support organizations manage to restore normal service operation after a service
disruption”. Therefore, IT organizations need to measure the efficiency and effectiveness of their
incident management strategies. Simulation can help design and assess the outcomes of different205
strategies so that the organization can implement the ones that provide the best process results.
SYMIAN is a simulation -based decision support tool that helps to analyze and optimize the
incident management process of IT support organizations [4]. SYMIAN is based on a discrete-event
simulation model and therefore models the IT support organization as a queuing system. In their
work, Bartolini and his colleagues introduce the tool and provide an experimental evaluation of210
SYMIAN in a fictitious situation. Although the experimental results are intended to show how the
tool optimizes the process outputs, there is no evidence of the application optimization techniques,
and the results come from what seems to be scenario comparison rather than proper simulation
optimization. In a later work [5], the same authors introduce HANNIBAL, a discrete-event sim-
ulation tool that works together with SYMIAN for business impact analysis and improvement of215
the incident management process. We share a similar motivation with this work since both initia-
tives aim to find the values for process options that optimize the process outcomes. However, the
simulation optimization methods used are substantially different. In [5], the user defines a set of
business strategies and is interested in finding the one that best aligns with a business objective. A
business objective is a function that can aggregate different objectives into a single function using220
weights that represent the importance that the user gives to each objective. The tool performs a
sequence of activities that starts with a complete simulation for each business strategy and calcu-
lates its cost. After that, the optimization process consists on selecting the business strategy that
has the best alignment to the business objective. In our approach, the user first sets the acceptable
range for the decision variables and their constraints and then selects the outputs whose values225
are to be either maximized or minimized together. Then, it is the multi-objective evolutionary
algorithm, and not the user, who defines the best strategy, relying on simulations to obtain the
process performance of all tentative solutions generated (i.e., process configurations). The process
performance obtained by simulation is used to calculate the fitness of the tentative solution within
the solution domain. Therefore, our approach does not evaluate several ad hoc strategies as in [5],230
but it automatically generates and evaluates several tens of thousands of them.
Bartolini et al [6] deepen in the simulation modeling of a single IT support group. In this
9

case, the support group is modeled by using a discrete-event mode with multiple-priority queues.
This component is then integrated into SYMIAN simulation core to allow the users simulate what-
if scenarios. In addition, the tool counts with an optimizer component materialized as an R235
application. The optimizer allows to find the values for the model parameters that ”enable the
most accurate reenactment of a real life support group”. To do that, the optimizer relies on a non-
linear optimization algorithm based on the Limited memory Broyden-Fletcher-Goldfarb-Shanno
(L-BFGS) algorithm [34] to minimize the Wilcoxon distance [34] between the simulation outputs
and the real values collected from historic data. In this work, optimization is only used to guide240
the inference of model parameters that make the simulation outputs reproduce closely the historic
data collected, i.e. model calibration. The application of simulation-based optimization to improve
process performance, which is our goal, is not among the aims of this work.
The remaining related works in the scope of the IT service management simulation optimization
has been proposed by Orta et al [39], and Orta and Ruiz[38]. In their first work [39], the authors245
offer a comprehensive review of the research papers that apply simulation modeling in the ITSM
context, propose a decision-making framework based on simulation modeling to improve ITSM and
illustrate the usefulness of this framework with two application cases including model simulations
and optimization experiments to determine the optimal process configuration. In a following con-
tribution, the authors propose a business-process and simulation-based method to support ITIL250
implementation and present the results of an application case in the context of the incident man-
agement process of a real company. In both works, the simulation optimization experiments were
set in the scope of the ITIL incident management process and made use of the optimization engine
implemented in OptQuest R© to find the best process configuration that maximizes the number of
incidents solved. These works serves as clear examples of single-objective simulation optimization255
in the ITSM domain.
After the analysis of the previous works describing the use of simulation optimization in the
scope of IT service management, we can conclude that this is a topic where very little research
effort has been applied (see Table 2). In the small number of cases describing an application of
simulation optimization, this has been of the single-objective category, despite the multi-objective260
nature of the problem: in IT service management, it is usual that conflicting objectives (i.e., the
KPIs) interact with each other in nonlinear ways. As a result, a multi-objective optimization
10

Table 2: Summary of relevant works related to ITIL Process optimization based on simulation
Ref. Simulation Scope Method Simulation-based Optimization
[10] Risk mitigation in resilient green communication
networks
Networks represented as undirected
graphs and linear programming to op-
timize recovery strategies risk and cost
Bi-objective linear program-
ming
[27] IT process optimization for hospitals No method integrating simulation &
optimization is proposed
No
[4] Performance analysis and optimization of the in-
cident management process
Discrete-event simulation No
[5] Business impact analysis and improvement of
the incident management process
Discrete-event simulation Limited to a number of ad hoc
strategies
[6] Modeling of a single IT support group Discrete-event simulation with
multiple-priority queues
No
[39], [38] ITIL Incident management process performance Discrete-event simulation Single objective
Our work ITIL Change management process Discrete-event and agent-based simu-
lation
Multi-objective metaheuristics
approach seems to be more adequate in this domain. To the best of our knowledge, which is based
on the findings of the systematic searches performed, our proposal is the first one that aims at
using simulation-based multi-objective optimization to improve decision making in ITSM domain265
and, more specifically, in the scope of the change management process.
3. Simulation Model for the ITIL Change Management Process
This section introduces briefly the change management process abstraction and describes the
simulation model built following Law’s methodology [28]. The layout of the description is partly
based on Kellner’s proposal for describing simulation models [26].270
3.1. Process abstraction
This section provides a short introduction to the ITIL change management process with a
focus on those aspects of the process that are especially relevant to the purpose of the model. A
comprehensive description of the process can be found in the ITIL Service Transition Guide [36].
The ITIL definition of change is the addition, modification or removal of anything that could275
have an effect on IT services [36]. Changes are requested by a formal proposal called RFC (Request
for Change). A change can be requested by an individual or a business unit. ITIL describes three
types of service change: a) Standard, a relatively common low-risk and pre-authorized change, b)
Emergency, an urgent change to solve a critical situation, and c) Normal, a change that is neither
11
standard or urgent. Additionally, changes can be categorized depending on their cost and risk into280
major, significant and minor changes. This classification helps identifying the suitable authority
level to authorize and manage them. Once a RFC is produced, a change record is created. A
change record is a record that contains all the information of the lifecycle of a particular change.
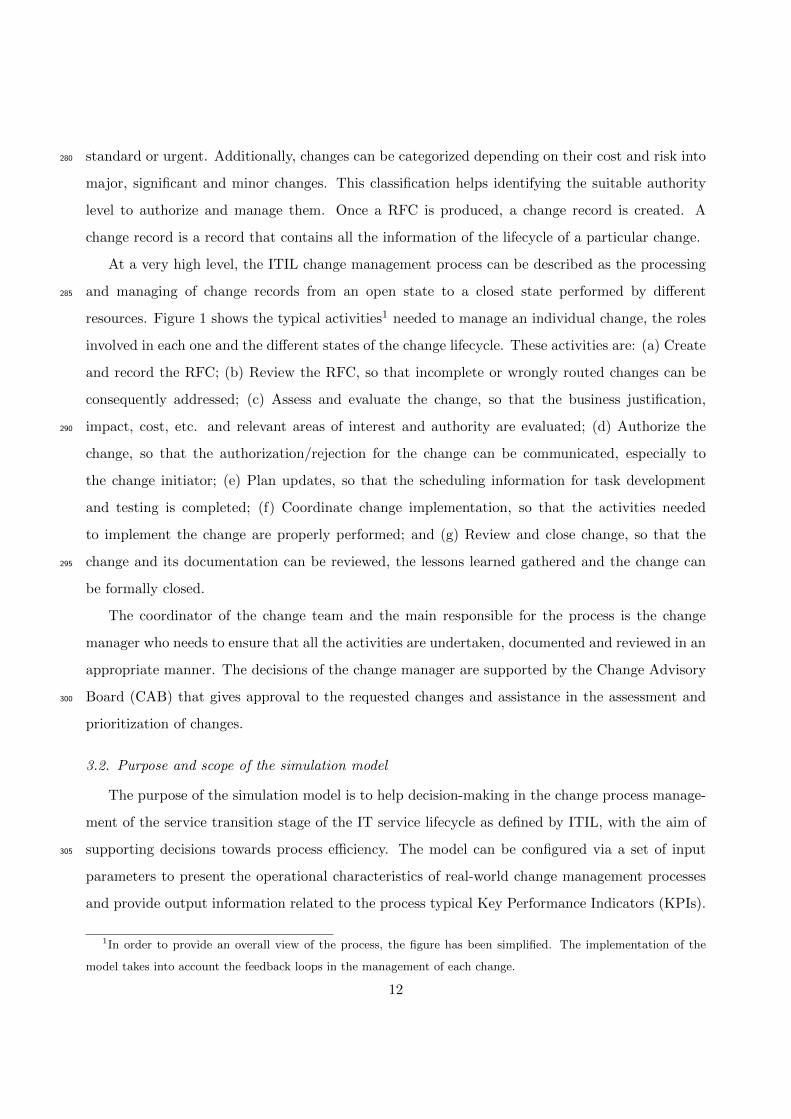
At a very high level, the ITIL change management process can be described as the processing
and managing of change records from an open state to a closed state performed by different285
resources. Figure 1 shows the typical activities1 needed to manage an individual change, the roles
involved in each one and the different states of the change lifecycle. These activities are: (a) Create
and record the RFC; (b) Review the RFC, so that incomplete or wrongly routed changes can be
consequently addressed; (c) Assess and evaluate the change, so that the business justification,
impact, cost, etc. and relevant areas of interest and authority are evaluated; (d) Authorize the290
change, so that the authorization/rejection for the change can be communicated, especially to
the change initiator; (e) Plan updates, so that the scheduling information for task development
and testing is completed; (f) Coordinate change implementation, so that the activities needed
to implement the change are properly performed; and (g) Review and close change, so that the
change and its documentation can be reviewed, the lessons learned gathered and the change can295
be formally closed.
The coordinator of the change team and the main responsible for the process is the change
manager who needs to ensure that all the activities are undertaken, documented and reviewed in an
appropriate manner. The decisions of the change manager are supported by the Change Advisory
Board (CAB) that gives approval to the requested changes and assistance in the assessment and300
prioritization of changes.
3.2. Purpose and scope of the simulation model
The purpose of the simulation model is to help decision-making in the change process manage-
ment of the service transition stage of the IT service lifecycle as defined by ITIL, with the aim of
supporting decisions towards process efficiency. The model can be configured via a set of input305
parameters to present the operational characteristics of real-world change management processes
and provide output information related to the process typical Key Performance Indicators (KPIs).
1In order to provide an overall view of the process, the figure has been simplified. The implementation of the
model takes into account the feedback loops in the management of each change.
12

Figure 1: ITIL change management process
Accordingly, the scope of the model is the whole of the process as described by ITIL: from change
initiation to change closure.
3.3. Input parameters310
The input parameters of the simulation model are used to tune the operation of the model to
mimic that of the real-world change management process carried out in an organization. Different
sets of parameter values enable the simulation of wide range of change processes using different
scenarios. Since our intention is to make this simulation model highly configurable to simulate ITIL-
based change management process from different organizations and be able to replicate multiple315
adjustments to these change processes, the model accepts a large number of input parameters (a
total of 136, between scalar and vectorial inputs). These input parameters help the model user tune
the model to each particular process implementation, adjusting the model’s behavior to different
situations and thus improving its flexibility. The model parameters have been selected by analyzing
carefully the description of the IT service change process in the ITIL Service Transition guide [36]320
and our experience with simulation model building for ITIL implementations [39, 38], with the aim
13

of providing a sufficiently flexible and highly adaptable model assuring that every parameter has
a real-world counterpart.
In order to design the scenario the user is interested in simulating, the input parameters need to
receive values. These values can be obtained from different sources. The most realistic simulation325
outputs will be obtained when the model parameters are fed with real data that the organization
has already collected. However, sometimes organizations do not count with either reliable data
about the execution of their processes or the data available is not enough to provide all the input
parameter values. In the absence of real data or in the case that the model is used to provide
insights about a hypothetical situation, the users can provide subjective estimates for the model330
inputs. On the other hand, when actual the data of the outputs of the model is available, running
optimization experiments can help users to find the input parameters that fit such data, following
what is known as a calibration process. Practically, the input parameters used to set a simulation
experiment with this model are configured in an Excel spreadsheet that is loaded into the model at
run time. Because it is not feasible to describe each of them individually in this paper, we outline335
the different categories of inputs that the model accepts and provide some examples of parameters
in each category.
• Change types. This group helps define the input stream of changes to be processed. Examples
of inputs in this group are the change type, the change complexity factor and the range of
configuration items affected by the change.340
• Processing durations. The parameters grouped in this category help define the duration of
each task of change processing, desegregated by change type and category. Providing an
estimate for the duration of every task within a process execution implies a high level of
uncertainty given the multiple factors of different nature that lead to a wide range of possible
completion times. This is particularly true in tasks that can be performed within feedback345
loops, like the ones in the service change process, since the number of repetitions of the
task and the completion time of each execution is unpredictable. The problem of uncertain
task durations has been traditionally overcome in management by estimating the probability
distribution of the duration times. The triangular distribution of three-point distribution
is commonly used to solve this estimation problem since it is easy to used and requires350
only three estimates of minimum, most likely and maximum durations which should be
14

within the estimating capability of the IT manager [12, 29]. For this reason, tasks durations
are modeled as a three-point estimation for the lower limit, upper limit and mode of a
triangular distribution. At the beginning of a simulation run, the value for each task duration
is stochastically calculated from its corresponding triangular distribution. The tasks included355
in the model are the ones represented in Figure 1.
• Change resources. This group helps define the size and features of the resource pools available
to process changes. Examples of inputs in this group are the number of change reviewers,
the number of change developers, their processing efficiency, the number and timetable of
each working shift and the resource allocation to working shifts.By processing efficiency, we360
mean how well the processing task is performed, i.e. does it introduce errors or delays into
the process? This is directly related to the skill of the resources performing the change
processing tasks, i.e. how well they do their jobs. The value is provided as the probability
that the resource has of introducing errors or delays in the process, measured in percent.
• Task parameters. This group helps define the tasks features such as their priorities in the365
resource request queues. Examples of inputs in this group are the weighting factors applied
to the priority of requests and to the priority of long running tasks, so that, during the
simulation, resource monopolization can be avoided.
• Process decisions. This group of parameters help define the decisions made by the different
roles with responsibility in the change management process, for instance, whether a change370
is authorized or rejected. Examples of inputs in this group are the statistical distributions
that define the activation probability of each decision component coded in the model imple-
mentation.
There are other input parameters that help configure the general settings of the model such as
the model time, the randomness etc. Since these are not particular inputs of the change process375
management model, but general inputs applicable to every simulation model, they have not been
described in this section.
3.4. Output variables
The output variables are the information elements needed to fulfill the purpose of the model.
Change process success can be studied under different and complementary dimensions. First, the380
15

value dimension, which means that the process must assure the reduction of the negative impacts
of change over the business. Second, the efficiency dimension, which means the process must be
carried out in a timely and costly effective way. Third, the risk dimension, which means that
changes must be handled in a risk-controlled way. Our simulation model is suitable to explore the
efficiency dimension of the process as described above.385
In order to provide meaningful outputs to help improve process efficiency, the outputs selected
for this model are intended to serve as a basic for the calculation of the typical Key Performance
Indicators (KPIs) suggested for the ITIL change management process [36]. It is important to notice
that since this is a dynamic simulation model, the outputs do not only contain the values achieved
at the end of the simulation, but are being updated dynamically during a simulation run. The user390
interface of the model updates and represents graphically the evolution of the output variables
selected by the user during the model run. The model outputs are grouped into the following
categories:
• Change Counts by State. This category groups the outputs regarding the total number of
change records that are currently in each change state (i.e. new, authorized, scheduled, etc.395
See Figure 1 for the complete list of change states).
• Average Durations of Completed Changes by State. This category groups the outputs re-
garding the 4M (Minimum, Maximum, Mean and Median) values for time that all completed
change records have spent in each change estate.
• Percentage of Changes Completed on Time by Type. This category groups the outputs regard-400
ing the ratio of changes completed on time divided by the total number of changes completed,
both values separated by change type (i.e. major, significant, and minor).
• Percentage of Closed Changes by State. This category groups the outputs regarding the
number of closed changes by state divided by the total number of closed changes.
• Number of Completed Changes by Type. This category groups the outputs regarding the405
number of completed changes by type.
• Overall Percentage of Changes completed on Time. This category groups the outputs regard-
ing the total number of changes completed on time divided by the total number of changes
completed.
16

• Overall Process Step Count. This category groups the outputs regarding the 4M values for410
the number of process steps taken by completed changes by change type.
• Change Duration. This category groups the outputs regarding the 4M values for the duration
of all completed changes for each change type.
• Overall Actual/Predicted Duration Ratio. This category groups the outputs regarding the 4M
values of the ratio of actual change duration divided by predicted duration for all completed415
changes.
• Change Success Rate. Percentage of changes deemed successful at review/number of RFCs
approved.
• Change Resource Utilization. This category groups the outputs regarding the percentage
utilization of each resource type. It is measured as the ratio of the resources busy time420
divided by its available working time.
• Total Change Hours Required. This category groups the outputs regarding the sum of the
number of hours used per resource type across all work shifts.
For the aggregated variables, their values are based on a one-year window of data, i.e. at any
moment in time the output variable value will be based on the last 365 days of a closed change425
data.
3.5. Model implementation
The model is built under a multi method simulation approach with components built under
the agent-based and the discrete-event simulation approaches. The AnyLogicTM modeling and
simulation software has been used to seamlessly integrate these components into a single simulation430
model. The combined usage of the different simulation methods allows us to take advantage of
the strengths of each of the simulation approaches in modeling the ITIL change management pro-
cess. After developing early prototypes under different simulation approaches (System Dynamics,
Discrete-event and Agent-based), we decided that the agent-based approach was the most suitable
to model the process. The early prototypes developed using the other simulation methods did not435
provide as good representation of the reality of the change management process and resulted in
excessively complex models, with little flexibility and difficult to update.
In this model, there are several agent types, each one representing each of the model’s logical
sections. These agent types can be grouped logically into two groups: a) Change Record agent
17
type, and b) Change Processing Role agent type. The event- and time-driven behavior of the440
agents in the model have been implemented using statecharts and action charts. Additionally, the
discrete-event simulation method is used to implement the utilization of resources by the agents.
The following subsections provide detailed information about the different agent types and their
behavior, as well as the different resource pools of the discrete-event model.
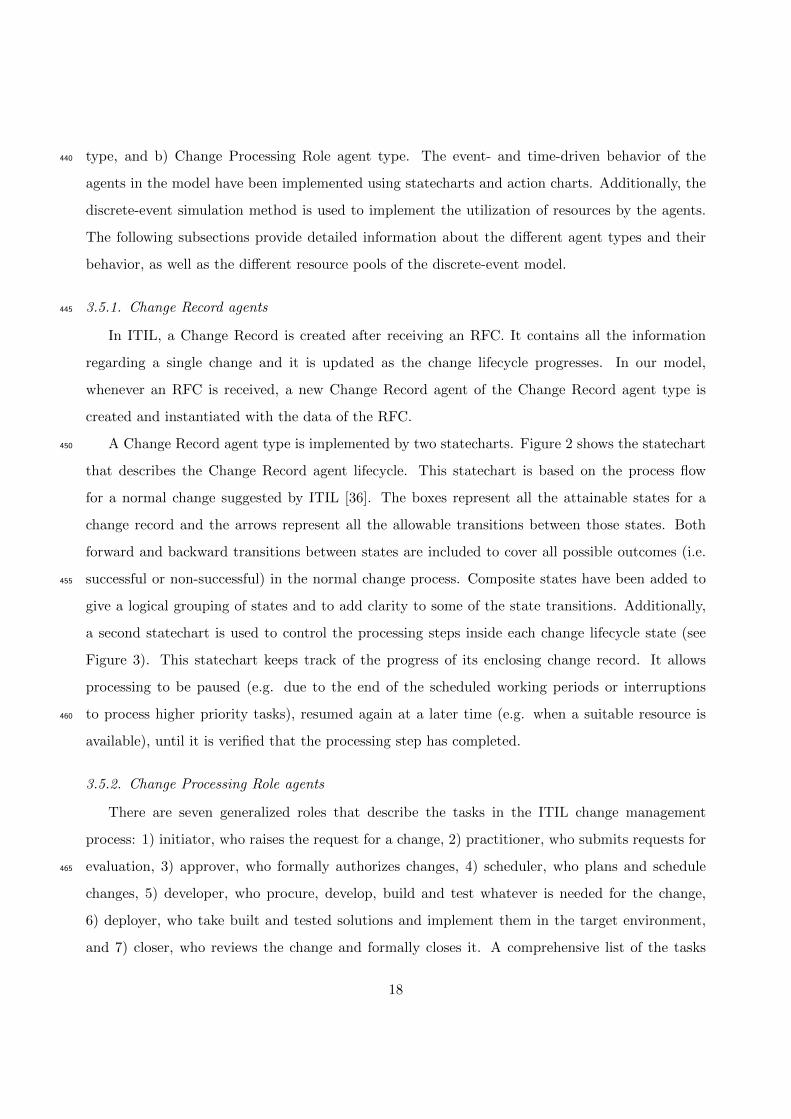
3.5.1. Change Record agents445
In ITIL, a Change Record is created after receiving an RFC. It contains all the information
regarding a single change and it is updated as the change lifecycle progresses. In our model,
whenever an RFC is received, a new Change Record agent of the Change Record agent type is
created and instantiated with the data of the RFC.
A Change Record agent type is implemented by two statecharts. Figure 2 shows the statechart450
that describes the Change Record agent lifecycle. This statechart is based on the process flow
for a normal change suggested by ITIL [36]. The boxes represent all the attainable states for a
change record and the arrows represent all the allowable transitions between those states. Both
forward and backward transitions between states are included to cover all possible outcomes (i.e.
successful or non-successful) in the normal change process. Composite states have been added to455
give a logical grouping of states and to add clarity to some of the state transitions. Additionally,
a second statechart is used to control the processing steps inside each change lifecycle state (see
Figure 3). This statechart keeps track of the progress of its enclosing change record. It allows
processing to be paused (e.g. due to the end of the scheduled working periods or interruptions
to process higher priority tasks), resumed again at a later time (e.g. when a suitable resource is460
available), until it is verified that the processing step has completed.
3.5.2. Change Processing Role agents
There are seven generalized roles that describe the tasks in the ITIL change management
process: 1) initiator, who raises the request for a change, 2) practitioner, who submits requests for
evaluation, 3) approver, who formally authorizes changes, 4) scheduler, who plans and schedule465
changes, 5) developer, who procure, develop, build and test whatever is needed for the change,
6) deployer, who take built and tested solutions and implement them in the target environment,
and 7) closer, who reviews the change and formally closes it. A comprehensive list of the tasks
18

Figure 2: Change Record agent type — Lifecycle statechart
Figure 3: Change Record agent type — Processing steps statechart
19

performed by each role can be found in the ITIL Service Transition guide [36].
To model the tasks performed by each change processing role, a particular agent type, with470
its correspondent statecharts, has been created. Change record processing is carried out by a
population of agents of these agent types. For a given change, its current state change record
lifecycle state determines which change processing role and therefore which change processing
agent should be processing the change to make it progress to the next lifecycle state.
To add realism, task processing within the simulation model can only occur when there are475
resources available and only during the resource’s scheduled work times. The agents compete with
each other to obtain resources from their assigned resource pools in order to perform the required
change processing tasks on the change records. The model reproduces the common situation that
occurs when the processing of longer running tasks get interrupted by higher priority tasks and
lower priority tasks have to wait for others to complete before they can be advanced. In addition,480
at the end of each scheduled work period, processing will stop and will not start again until the
start of the next scheduled period.
3.5.3. Change Processing resources
In the model, each of the change roles requiring change management resources sends a resource
request to a queue. From there, as resources become available, the resource requests are selected in485
priority order, the resource is assigned and the task processing is performed. When the processing
of the task has completed, the resource is released and becomes available again for any other queued
requests. This queuing and task assignment functionality has been developed as a discrete-event
model and embedded inside the agent-based model.
Each resource pool is constrained by the number of people compromising the group and by490
the group work schedule. The actual number of resources in each resource pool and their different
shifts are configured using the input parameters of the model and thus can be varied during the
simulation experiments.
During a simulation run, the user interface represents the real-time evolution of the main output
variables as well as allows the user to make changes to the most relevant input parameters so that495
questions of the What if...? type can be analyzed.
Simulation modeling serves as a valuable technique towards ITIL implementation, especially
in the process design, analysis and improvement phases [38]. In the particular case of the change
20

management process, the model presented in this work enables the IT change manager to perform
different types of simulation studies such as interactive simulations, parameter variation experi-500
ments, sensitivity analyses and optimization experiments that can help such managers improve
their decisions in real-life situations, such as deciding on the prioritization strategies applied to
evaluate the change requests, the size and features of the resources used or the activities designed
to improve the duration of the change processing tasks.
4. Metaheuristics and Simulation-based Optimization505
Metaheuristics [46] are a family of approximate techniques for solving optimization problems,
capable of providing accurate solutions to difficult problems in reasonable time. Evolutionary
Algorithms (EAs) are particularly suitable metaheuristics to solve Multi-objective Optimization
Problems (MOP) [13]. One reason for that is that they deal simultaneously with a set of tenta-
tive solutions (the so-called population) that is evolved, allowing them to capture the dominance510
relations among solutions, helping to efficiently guide the search towards the Pareto-optimal front.
Indeed, EAs can find good approximations of Pareto optimal set in a single run [13].
4.1. Metaheuristics Algorithms
As previously stated, a large number of problems within the software engineering domain can be
solved with metaheuristic techniques. Among their many different applications, they can be used to515
solve MOP, which are those involving multiple and conflicting objective functions simultaneously.
In general, the solutions for MOPs form a Pareto front of non-dominated solutions, which can be
formally defined as follows.
Given the minimization of n components fk, k = 1, . . . , n, of a vector function f of a vector
variable x in D, i.e., f(x) = (f1(x), . . . , fn(x)), and subject to inequality and equality constraints520
(gj(x) ≥ 0, j = 1, . . . , J and hk(x) = 0, k = 1, . . . ,K):
Definition 1. Pareto Dominance. A vector ~u = (u1, . . . , uk) dominates a vector ~v = (v1, . . . , vk),
denoted by ~u � ~v iff ~u is partially less than ~v, i.e., ∀i ∈ (1, . . . , k), ui ≤ vi ∧∃i ∈ (1, . . . , k) : ui < vi
(assuming minimization of all objectives).
The Pareto front is the set of optimal solutions, for which no objective can be improved without525
worsening at least one of the other objectives.
21

We have selected two well-known multi- objective evolutionary algorithms from the literature
to solve the proposed problem, NSGA-II [14] and SPEA2 [53]. Although, there are more recent
algorithms discussed in the literature, these two are among the most frequently used, and are still
considered state of the art even though they were published more than fifteen years ago.530
The Non-dominated Sorting Genetic Algorithm II, NSGA-II [14], is a Genetic Algorithm (GA)
that assigns a fitness value to individuals according to their dominance level (through Ranking
method) and diversity (thanks to Crowding technique). In every generation, a new population
(with the same size as the original one) is created through the iterative application of the genetic
operators. The next generation population is created by merging the two populations using the535
Ranking and Crowding methods to select the most promising solutions for the search process.
Ranking orders solutions according to the dominance concept. Crowding assigns higher fitness to
those solutions that are more isolated, representing the areas of the Pareto front approximation
that are less explored.
The Strength Pareto Evolutionary Algorithm 2, SPEA2 [53], makes use of an external archive540
to store the best non-dominated solutions found. The size of the archive is limited, therefore the
algorithm implements a mechanism to keep the most promising solutions when it becomes full.
For that, the strength of individuals is defined in terms of the number of other individuals they
dominate in the population. A fitness value is assigned to every individual, computed as the sum
of its strength raw fitness and a density estimation, so that individuals with the lowest fitness can545
be discarded, if needed. The algorithm evolves the population through the iterative application
of the variation operators on the individuals, storing all generated non-dominated solutions in the
archive. After every generation, the population of the next generation is built from the current
population and the archive, using the previously defined fitness to discard less promising solutions.
In this work, we use the implementation provided by the jMetal2 framework [16], a metaheuristic550
algorithm framework that implements many of the current state of the art MOEAs, including
NSGA-II and SPEA2. We also used the parameter settings proposed in the original papers, with
the exception of the population and archive sizes that was set to 50 solutions. The termination
condition of the algorithms was set to 5,000 iterations.
2https://github.com/jMetal/jMetal
22
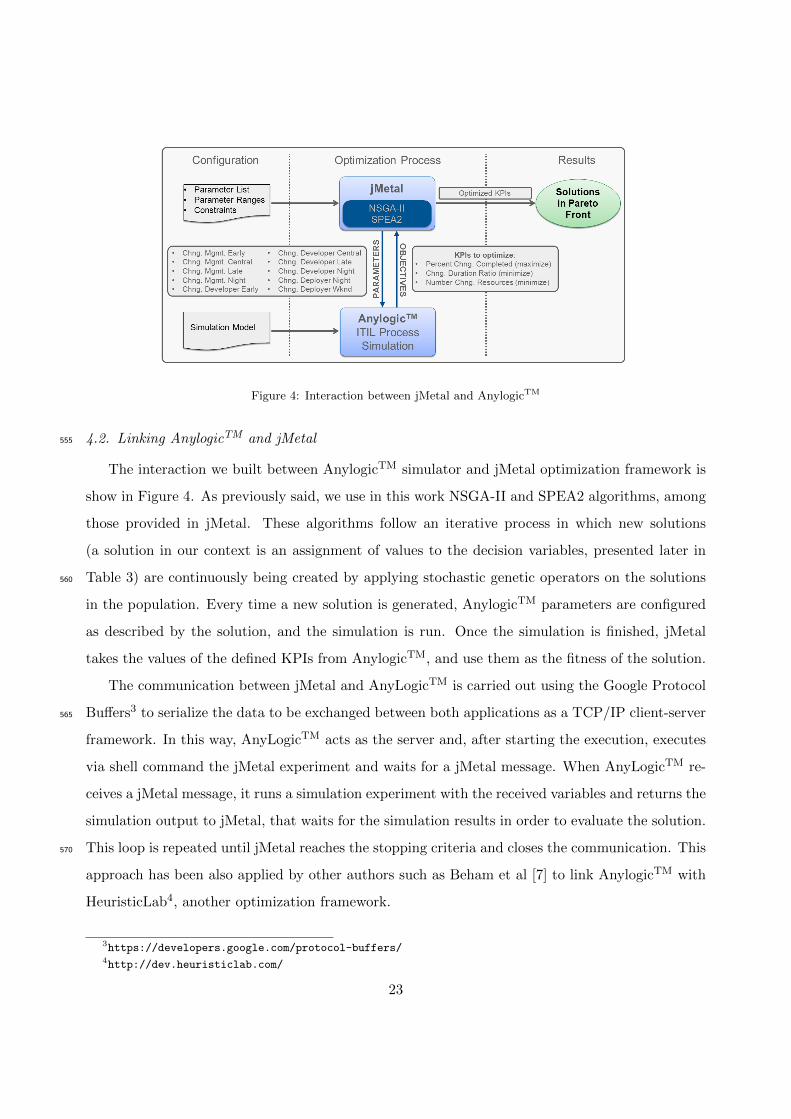
Figure 4: Interaction between jMetal and AnylogicTM
4.2. Linking AnylogicTM and jMetal555
The interaction we built between AnylogicTM simulator and jMetal optimization framework is
show in Figure 4. As previously said, we use in this work NSGA-II and SPEA2 algorithms, among
those provided in jMetal. These algorithms follow an iterative process in which new solutions
(a solution in our context is an assignment of values to the decision variables, presented later in
Table 3) are continuously being created by applying stochastic genetic operators on the solutions560
in the population. Every time a new solution is generated, AnylogicTM parameters are configured
as described by the solution, and the simulation is run. Once the simulation is finished, jMetal
takes the values of the defined KPIs from AnylogicTM, and use them as the fitness of the solution.
The communication between jMetal and AnyLogicTM is carried out using the Google Protocol
Buffers3 to serialize the data to be exchanged between both applications as a TCP/IP client-server565
framework. In this way, AnyLogicTM acts as the server and, after starting the execution, executes
via shell command the jMetal experiment and waits for a jMetal message. When AnyLogicTM re-
ceives a jMetal message, it runs a simulation experiment with the received variables and returns the
simulation output to jMetal, that waits for the simulation results in order to evaluate the solution.
This loop is repeated until jMetal reaches the stopping criteria and closes the communication. This570
approach has been also applied by other authors such as Beham et al [7] to link AnylogicTM with
HeuristicLab4, another optimization framework.
3https://developers.google.com/protocol-buffers/4http://dev.heuristiclab.com/
23
5. Experimental Work
In this section, we describe the experimental work carried out to perform multi-objective sim-
ulation optimization on the simulation model created. First, we introduce the motivation and575
formulation of the problem; next, we show the optimal solutions found by both (i) AnylogicTM (as
standalone tool with its built-in optimizer) and (ii) combining AnylogicTM and jMetal for multi-
objective simulation optimization.
5.1. Problem formulation
ITIL recommends each organization to define their own Critical Sucess Factors (CSFs) to580
achieve their particular mission, objectives or goals. The ITIL Service Transition Glossary defines
a CSF as “Something that must happen if a Process, Project, Plan, or IT Service is to succeed” [36].
Basically, a CSF can be understood as a hig-level goal critical for the success of the organization.
Given the strategic nature of CSFs, they are often tracked and measured in terms of a set of Key
Performance Indicators (KPIs). KPIs can be defined as the most important metrics used to report585
on process performance that contribute to measure the achievement of CSFs. Thus each CSF will
have a small set of KPIs associated. Frequently, CSFs are qualitative and meant to answer the
question What should be done to achieve success? Complementarily, KPIs are quantitative and
meant to answer the question Are we successful?
For the purpose of this study, we will consider an IT service organization with a set of CSFs590
defined. Let us assume that among their CSFs, there is one related to delivering process efficiency.
This decision is based upon the widely accepted assumption that every organization should success
in delivering efficient processes.
The problem of IT change process efficiency can be defined as another instance of the well-
known time-cost-quality triangle, in which three conflicting factors need to be optimized in order595
to achieve efficiency [2, 23]. Under this consideration, the KPIs that can be associated with
delivering an effective IT service change process are:
• KPI 1: Percentage of changes completed successfully within the time estimates, as a measure
of the time factor. The higher the value of this KPI, the better for the process efficiency.
• KPI 2: Actual change duration/estimated change duration, as a measure of internal quality.600
The lower the value of this KPI, the better for the process efficiency.
24

• KPI 3: Overall number of resources utilized, as a measure of cost. The lower the value of
this KPI, the better for the process efficiency.
Before using the simulation model to show how multi-objective simulation optimization can
help decision-makers achieving efficiency-based CSF, it is necessary to establish the simulation605
scenario that will serve as the foundation for this experiment. One of the critical decisions that
change process managers need to make relates to the configuration of the process staff, as different
staff configurations may lead to different outcomes. We assume that the staff involved in the
fulfillment of the change management process have the following roles (besides the initiator, the
practitioner, the approver,a and the closer): a) change management, b) change developer, and c)610
change deployer. For each role, let us assume there are four possible basic shifts:
• Central, from 9 am to 6 pm, with one-hour break at 1 pm.
• Early, from 6 am to 3 pm, with one-hour break at 10 am.
• Late, from 2 pm to 11 pm, with one-hour break at 6 pm.
• Night, from 10 pm to 7 am, with a break at 2 am.615
For change developers, there is a special shift:
• Weekend, Saturdays and Sundays, 7 am to 10 pm, with one-hour breaks at noon and 5 pm.
We are interested in finding the optimal combination of staff resulting in the best possible
solution towards the achievement of the CSF measured in terms of the KPIs previously described.
An optimization process can help in finding these values by running repetitive simulations of the620
model, each with different values in the input parameters and locating the values that solve the
problem. For this particular study, the optimization parameters, i.e., decision variables, selected
are the ones defining the number of people per role who are working on each of the working shifts.
In order to propose a realistic simulation scenario, and based on our own experience, we set the
problem variables and their range of allowed values as listed below. However, users will probably625
need to adjust the values of these parameters in order to tailor the simulation to his/her own
particular needs.
• Bounds for change management central staff: cmC ∈ [1, 3]
25

• Bounds for change management early staff: cmE ∈ [0, 2]
• Bounds for change management late staff: cmL ∈ [0, 2]630
• Bounds for change management night staff: cmN ∈ [0, 1]
• Bounds for change developer central staff: cDvC ∈ [3, 14]
• Bounds for change developer early staff: cDvE ∈ [0, 1]
• Bounds for change developer late staff: cDvL ∈ [0, 11]
• Bounds for change developer night staff: cDvN ∈ [0, 3]635
• Bounds for change deployer night staff: cDpN ∈ [1, 5]
• Bounds for change deployer weekend staff: cDpW ∈ [1, 5]
Not every combination of values for the optimization parameters is acceptable in a real-life
situation. For this reason, we also need to add some constraints upon the values of the optimization
parameters. The constraints set for the optimization experiments performed is formally defined as:640
• The change management staff cannot exceed 3 workers: cmC + cmE + cmL + cmN ≤ 3
• The change developer staff cannot exceed 14 workers: cDvC + cDvE + cDvL + cDvN ≤ 14
• The change deployer staff cannot exceed 6 workers: cDpN + cDpW ≤ 6
Formally, our problem is defined as the optimization of the following three functions:
fKPI1 = arg max
∑|C|
i=1 xi|C|
× 100
∣∣∣∣∣∣∣ xi =
1 if ti ≤ eti
0 otherwise
(1)
645
fKPI2 = arg min
|C|∑i=1
tieti
(2)
fKPI3 = arg min {cmC+cmE+cmL+cmN+cDvC+cDvE+cDvL+cDvN+cDpN+cDpW}
(3)
where C is the set of required changes, ti is the real time required to process change i and eti is
the estimated time to process change i.
It is important to note that, as described in Section 3.3, the number of working shifts, their650
respective timetable and the allocation of staff to each shift can be configured by using the different
input parameters of the simulation model. The values shown in this section are only intended to
26

Figure 5: AnylogicTMoptimization via OptQuestTMsoftware
illustrate a possible configuration of the process within an IT organization that is based on the
authors’ experience and the information found in the available literature. Similarly, the configura-
tion of the parameters range and constraints is also illustrative and can be adapted to the values655
of interest in any given particular situation.
5.2. AnylogicTM optimization
AnylogicTM simulation software comes with OptQuestTM 5 optimization engine. This opti-
mization tool helps to find the values of model parameters that maximize or minimize the model’s
objective function. Figure 5 depicts this process.660
We used AnylogicTM optimization facilities to find a solution for the problem previously stated.
However, the type of simulation-based optimization problem that one can solve with AnylogicTM falls
in the category of single-objective optimization. For this reason, we created a simulation optimiza-
tion experiment in AnylogicTM that minimizes the total number of staff involved in the change
process, while assuring that at least 90% of the changes are completed on time.665
5.3. Multi-objective optimization
We executed six independent runs of NSGA-II and SPEA2 to find accurate trade-off solutions
to our problem. The simulation process is shown in Figure 4. From all the solutions found in
the different runs of the two algorithms, we built a single Pareto front containing all best non-
dominated solutions. The resulting Pareto front is composed of 27 highly accurate solutions, and670
it is shown in Figure 6 (the solution provided by the optimizer embedded in AnylogicTM is plotted
as a gray square for reference). In this figure, we can observe that 89% of the solutions require
a change duration ratio less than 5.0. Additionally, it can be seen that those solutions with the
highest percentage of changes completed are, as it could be expected, the more expensive ones
5http://www.opttek.com/OptQuest
27

0
20
40
60
80
100
0
5
10
15
20
25
5
10
15
20
25
Change Duration Ratio (KPI 2)% Changes Completed (KPI 1)
Ch
an
ge
Sta
ff (
KP
I 3
)
Figure 6: Pareto front of the best non-dominated solutions found. The solution found by AnylogicTM optimizer is
represented as a gray square.
(i.e., the ones requiring the highest number of staff). The solutions with more than 80% changes675
completed on time require at least 15 persons.
Furthermore, we are interested in analyzing our solutions, and compare them versus the one
reported by AnyLogicTM. To so so, we select a subset of three solutions we consider interesting,
out of the 27 ones in the Pareto front approximation we computed, just like a decision maker would
do. We also defined and followed some ad hoc criteria. The selected solutions are shown in Table 3,680
and we consider they are interesting solutions for the organization for the following reasons:
• Solution 1. The one with the best percentage of completed changes on time (KPI 1 ).
• Solution 2. We first select the 30% best solutions from the Pareto front, according to the
percentage of changes completed on time (KPI 1 ). From those solutions, we keep the 30%
best solutions that minimize the duration ratio (KPI 2 ). Finally, from this resulting set, the685
solution that needs the minimum number of staff was selected as Solution 2 (KPI 3 ).
• Solution 3. We choose the 30% best solutions from the Pareto front in terms of the duration
ratio (KPI 2 ) and, among them, we further select the 30% best solutions guided by the
number of staff were selected (KPI 3 ). Solution 3 is the one maximizing the percentage of
changes completed on time (KPI 1 ) from the selected ones.690
28

Table 3: Solutions selected from the Pareto front and solution obtained by AnyLogicTM
Decision variable Solution 1 Solution 2 Solution 3 AnyLogicTM
Input
para
met
ers
Change Management Early 0 0 0 1
Change Management Central 1 1 1 1
Change Management Late 2 2 0 1
Change Management Night 1 1 1 1
Change Developer Early 1 7 7 5
Change Developer Central 4 4 3 6
Change Developer Late 9 2 2 1
Change Developer Night 1 0 0 1
Change Deployer Night 3 3 4 3
Change Deployer Weekend 1 1 1 2
KP
Is
Percent Changes Completed OnTime 94.77 93.67 93.07 92.83
Change Duration Ratio 0.70 0.84 1.05 0.88
Number of Change Resources 23 21 19 22
From the ITSM point of view, all these solutions are among the most expensive ones for the
organization, as they require a large number of personnel. However, the solutions found that
needed a low number of personnel were always poor solutions that do not lead to the process-
efficiency CSF achievement. If we compare the solutions provided by our approach versus that of
AnylogicTM (shown in Table 3), we can see that the latter cannot outperform any of the selected so-695
lutions from the multi-objective algorithms. Indeed, Solution 2 (from the proposed multi-objective
approach) outperforms the solution provided by AnylogicTM for the three objectives.
It is beyond the scope of this work to conduct a detailed comparison of the two used multi-
objective optimization algorithms. However, we noticed that the three best solutions (those pre-
sented in Table 3) were all found by the SPEA2 algorithm. Both algorithms implement the same700
selection, recombination, and mutation operators. In addition, the number of non-dominated so-
lutions in the Pareto front approximations do not reach the limit in any of the two algorithms (set
to 50 in our experiments), so the strength raw fitness operator of SPEA2 does not have any effect
on the performance of the algorithm (note that it is used to select the solutions to discard from the
archive when its limit is exceeded). Therefore, we suspect that the use of an external archive of705
solutions benefits SPEA2 against NSGA-II. Implementing an external archive allows SPEA2 keep-
ing a more diverse population with respect to NSGA-II, which requires a stronger elitist policy to
29

avoid missing any non-dominated solutions from the population.
6. Conclusions and Future Work
IT service management frameworks provide important guidance for change management in IT710
organizations. However, decision-making in this area is a complex process that involves a large
number of difficult decisions which have a crucial impact on the achievement of the organization’s
Critical Success Factors (CSFs). Similarly to many other engineering problems, efficient change
management requires optimizing several objectives simultaneously, such as maximizing the per-
centage of changes completed on time and minimizing the change duration ratio and the number715
of resources used.
In this paper, to help change process managers make better decisions, we have described a
proposal based on using multi-objective optimization to optimize the outputs of a multi-method
simulation model of the ITIL change process. The simulation model built is based on the agent-
based and discrete-event simulation paradigms and simulates the whole process lifecycle, from720
change initiation to change closure, allowing the study of the average yearly performance of the
process. Google Protocol Buffers has been used to facilitate the exchange of information between
AnylogicTM software, which runs the simulation model, and the jMetal framework, which imple-
ments the multi-objective optimization algorithms used in this study.
To illustrate how multi-objective simulation optimization can help improve decision-making in725
this area, we have formulated a problem consisting on helping to achieve a very common CSF
aimed at ensuring change process efficiency, i.e. the process is carried out in a timely and cost-
effective way. The problem of IT change process efficiency has been defined as another instance of
the well-known time-cost-quality triangle, in which three conflicting variables need to be optimized
in order to achieve efficiency. After setting a particular simulation scenario, selecting the decision730
variables and setting the constraints for the optimization experiment, the problem was solved
with two well-known multi-objective evolutionary algorithms, i.e. NSGA-II and SPEA2. Three
solutions were selected from the best non-dominated solutions found in our experiments. These
solutions were selected for being the ones leading to optimal values for the Key Performance
Indicators (KPIs) associated with the CSF previously mentioned. Furthermore, the solutions735
found by the multi-objective evolutionary algorithms were compared with the solution provided by
30

the AnylogicTM built-in optimizer. As a result, the multi-objective evolutionary algorithms could
find better solutions than the ones offered by AnylogicTM in all objectives.
Even though our experimental work has been done in the scope of the ITIL change management
process, our proposal is clearly extensible to other ITIL processes or other processes defined in740
other ITSM frameworks. In fact, we plan to continue the development of the simulation models
of the ITIL processes that interact with the change management process such as: configuration
management, problem management and incident management, being the last one already built
[38], to give a more complete support to decision-making towards process efficiency in the Service
Transition stage of the IT service lifecycle. Since this proposal benefits from the advantages of745
the multi-objective optimization approach applied to the results of simulation models, the range of
the solutions provided in the Pareto front can help IT managers understand the effect of different
management strategies and improve their decision-making towards more efficient processes.
As future work, we also intend to apply multiple algorithms to this new optimization problem
we have defined in this work, and carry out a thorough comparison of their performance. Also,750
we need to consider parallel versions of the algorithms, because the simulations require a high
computational cost. In this sense, our architecture with Google protobuffer allows us to easily
distribute the load to multiple machines. Finally, as the number of variables and solutions in the
Pareto can be large, we will need to explore visualization and clustering techniques to present the
results, as well as defining new multicriteria decision making methods to choose the solutions to755
adopt among those in the Pareto front.
Acknowledgments
This research was partly supported by the Spanish Ministry of Science and Innovation and the
ERDF funds under projects BadgePeople (TIN2016-76956-C3-3-R), SAVANT (TIN2014-60844-
R), the Ramon y Cajal fellowship with contract RYC-2013-13355 and the Andalusian Plan for760
Research, Development and Innovation (TIC-195). The authors also thank David W. Gawn for
his collaboration in an earlier version of this work, and the Universities of Cadiz and Alcala. The
authors also thank the anonymous reviewers for their help improving the manuscript.
31

References
[1] Amin, T., Grollius, T., Ortner, E., 2010. Language-Critical Development of Process-Centric Application Sys-765
tems. Springer Berlin Heidelberg, Berlin, Heidelberg. pp. 31–46.
[2] Atkinson, R., 1999. Project management: cost, time and quality, two best guesses and a phenomenon, its time
to accept other success criteria. International Journal of Project Management 17, 337–342.
[3] Axelos, . ITILR© - IT Service Management. URL: https://www.axelos.com/best-practice-solutions/itil.
[4] Bartolini, C., Stefanelli, C., Tortonesi, M., 2008. SYMIAN: A simulation tool for the optimization of the770
IT incident management process, in: Managing large-scale service deployment, IFIP; IEEE. 19th IFIP/IEEE
International Workshop on Distributed Systems - Operations and Management.
[5] Bartolini, C., Stefanelli, C., Tortonesi, M., 2009. Business-impact analysis and simulation of critical incidents
in it service management, in: IFIP/IEEE Int. Symp. on Integrated Network Management, pp. 9–16.
[6] Bartolini, C., Stefanelli, C., Tortonesi, M., 2012. Modeling it support organizations using multiple-priority775
queues, in: 2012 IEEE Network Operations and Management Symposium, pp. 377–384.
[7] Beham, A., Pitzer, E., Wagner, S., Affenzeller, M., Altendorfer, K., Felberbauer, T., Back, M., 2012. Integration
of flexible interfaces in optimization software frameworks for simulation-based optimization, in: Genetic and
Evolutionary Computation Conference, GECCO, pp. 125–132.
[8] Chesney, T., Gold, S., Trautrims, A., 2017. Agent based modelling as a decision support system for shadow780
accounting. Decision Support Systems 95, 110–116.
[9] Chica, M., Juan Perez, A.A., Cordon, O., Kelton, D., 2017. Why simheuristics? benefits, limitations, and best
practices when combining metaheuristics with simulation. SSRN URL: https://ssrn.com/abstract=2919208.
[10] Cho lda, P., Jaglarz, P., 2016. Optimization/simulation-based risk mitigation in resilient green communication
networks. Journal of Network and Computer Applications 59, 134–157.785
[11] Cordeiro, W., Machado, G., Andreis, F., Wickboldt, J.A., Lunardi, R., dos Santos, A., Both, C., Gaspary,
L., Granville, L., Trastour, D., Bartolini, C., 2009. CHANGEMINER: A solution for discovering IT change
templates from past execution traces, in: IFIP/IEEE Symp. on Integrated Network Management, pp. 97–104.
[12] Dawson, R., Dawson, C., 1998. Practical proposals for managing uncertainty and risk in project planning.
International Journal of Project Management 16, 299 – 310.790
[13] Deb, K., Kalyanmoy, D., 2001. Multi-Objective Optimization Using Evolutionary Algorithms. John Wiley &
Sons, Inc., New York, NY, USA.
[14] Deb, K., Pratap, A., Agarwal, S., Meyarivan, T., 2002. A fast and elitist multiobjective genetic algorithm:
Nsga-ii. IEEE Transactions on Evolutionary Computation 6, 182–197.
[15] Dorronsoro, B., Ruiz, P., Danoy, G., Pigne, Y., Bouvry, P., 2014. Evolutionary Algorithms for Mobile Ad Hoc795
Networks. Wiley/IEEE Computer Society.
[16] Durillo, J.J., Nebro, A.J., 2011. jMetal, a java framework for multi-objective optimization. Advances in
Engineering Software 42, 760–771.
[17] Fanti, M.P., Iacobellis, G., Ukovich, W., Boschian, V., Georgoulas, G., Stylios, C., 2015. A simulation based
decision support system for logistics management. Journal of Computational Science 10, 86–96.800
32

[18] Forbes Insights, 2017. Delivering Value to Today’s Digital Enterprise - The State of IT Service Management,
2017. Technical Report. Forbes.
[19] Fu, X., Dong, M., Liu, S., Han, G., 2016. Trust based decisions in supply chains with an agent. Decision
Support Systems 82, 35–46.
[20] ISACA, . COBIT 5 - A Business Framework for the Governance and Management of Enterprise IT. URL:805
www.isaca.org/cobit.
[21] ISO/IEC 20000-1:2011. Information technology - Service management - Part 1: Service management system
requirements, . URL: https://www.iso.org/standard/51986.html.
[22] ITIL, 2011. ITIL Continual Service Improvement 2011 Edition. The Stationery Office, Norwich.
[23] J.B. Ebbesen, A.H., 2013. Re-imagining the iron triangle: embedding sustainability into project constraints.810
PM World Journal 2, 1–13.
[24] Jiang, C., Shi, H., Zhang, H., 2015. A novel quantitative model for system performance based on distributed IT
management structure, in: IEEE Int. Conf. on Communication Software and Networks (ICCSN), pp. 449–453.
[25] Juan, A.A., Faulin, J., Grasman, S.E., Rabe, M., Figueira, G., 2015. A review of simheuristics: Extending
metaheuristics to deal with stochastic combinatorial optimization problems. Op. Res. Perspectives 2, 62–72.815
[26] Kellner, M.I., Madachy, R.J., Raffo, D.M., 1999. Software process simulation modeling: Why? What? How?
Journal of Systems and Software 46, 91–105.
[27] Krey, M., Harriehausen, B., Knoll, M., Furnell, S., 2010. IT governance and its impact on the Swiss healthcare,
in: 12th International Conference on Computer Modelling and Simulation, pp. 340–345.
[28] Law, A.M., 2008. How to build valid and credible simulation models, in: Proceedings of the 40th Conference820
on Winter Simulation, Winter Simulation Conference. pp. 39–47.
[29] Law, A.M., 2014. Simulation Modeling and Analysis. 5th. ed., McGraw-Hill.
[30] Lin, R.C., Sir, M.Y., Pasupathy, K.S., 2013. Multi-objective simulation optimization using data envelopment
analysis and genetic algorithm: Specific application to determining optimal resource levels in surgical services.
Omega 41, 881–892.825
[31] Luo, X., Kar, K., Sahu, S., Pradhan, P., Shaikh, A., 2008. On improving change management process for
enterprise IT services, in: IEEE International Conference on Services Computing (SCC2008), pp. 341–348.
[32] Moorer, A., Antao, R., 2006. Improving management of information technology: System dynamics analysis of
IT controls in context, in: Proceedings of the 24th International Conference of the System Dynamics Society.
[33] MS Operation Framework (MOF) and Service Management, . URL: blogs.technet.microsoft.com/mof/.830
[34] Nocedal, J., Wright, S.J., 2006. Numerical optimization. Springer.
[35] Novak, D.C., Ragsdale, C.T., 2003. A decision support methodology for stochastic multi-criteria linear pro-
gramming using spreadsheets. Decision Support Systems 36, 99–116.
[36] Office, C., 2011. ITIL Service Transition. The Stationery Office, London.
[37] Olafsson, S., Kim, J., 2002. Simulation optimization: simulation optimization, in: Proceedings of the 34th835
conference on Winter simulation: exploring new frontiers, Winter Simulation Conference. pp. 79–84.
[38] Orta, E., Ruiz, M., 2018. Met4ITIL: A process management and simulation-based method for implementing
ITIL. Computer Standards & Interfaces .
33

[39] Orta, E., Ruiz, M., Hurtado, N., Gawn, D., 2014. Decision-making in IT service management: a simulation
based approach. Decision Support Systems 66, 36–51.840
[40] Reboucas, R., Santos, R., Sauve, J., Moura, A., 2006. IT Change Management Challenges – Results of 2006 Web
Survey. Technical Report HPL-TR-2006-3. Computing Systems Department, Federal Univ. Campina Grande.
[41] Schmaranzer, D., Braune, R., Doerner, K.F., 2016. A discrete event simulation model of the viennese subway
system for decision support and strategic planning, in: Winter Simulation Conference (WSC), pp. 2406–2417.
[42] Setzer, T., Bhattacharya, K., Ludwig, H., 2010. Change scheduling based on business impact analysis of845
change-related risk. IEEE Transactions on Network and Service Management 7, 58–71.
[43] Shrinivasan, Y.B., Dasgupta, G.B., Desai, N., Nallacherry, J., 2012. A Method for Assessing Influence Rela-
tionships among KPIs of Service Systems. Springer Berlin Heidelberg, Berlin, Heidelberg. pp. 191–205.
[44] Silva, E., Chaix, Y., 2008. Business and IT governance alignment simulation essay on a business process and IT
service model, in: 41st Annual Hawaii International Conference on System Sciences (HICSS 2008), pp. 434–434.850
[45] Srinivasan, K., Kumar, K., 2018. Multi-objective simulation-optimization model for long-term reservoir opera-
tion using piecewise linear hedging rule. Water Resources Management 32, 1901–1911.
[46] Talbi, E.G., 2009. Metaheuristics: From Design to Implementation. Wiley Publishing.
[47] Thanheiser, S., Liu, L., Schmeck, H., 2009. SimSOA - an approach for agent-based simulation and design-time
assessment of SOC-based IT systems, in: ACM Symposium on Applied Computing, pp. 2162–2169.855
[48] TMForum, . Business Process Framework (eTOM). URL: www.tmforum.org/business-process-framework.
[49] Willis, K.O., Jones, D.F., 2008. Multi-objective simulation optimization through search heuristics and relational
database analysis. Decision Support Systems 46, 277–286.
[50] Xu, X.F., Wang, Z.J., Mo, T., 2008. The Current State and Development Plan of Research and Education on
SSME in Harbin institute of Technology. Springer US, Boston, MA. pp. 219–224.860
[51] Yang, B., Zeng, S., Ayachitula, N., Puri, R., 2011. SLA-driven applicability analysis for patch management, in:
12th IFIP/IEEE International Symposium on Integrated Network Management (IM 2011), pp. 438–445.
[52] Zaffar, M.A., Kumar, R.L., Zhao, K., 2011. Diffusion dynamics of open source software: An agent-based
computational economics (ACE) approach. Decision Support Systems 51, 597–608.
[53] Zitzler, E., Laumanns, M., Thiele, L., 2001. SPEA2: Improving the Strength Pareto Evolutionary Algorithm.865
Technical Report 103. Comp. Eng. & Networks Laboratory (TIK), Swiss Federal Institute of Technology (ETH).
34