Embed Size (px)
Citation preview

Using STATA This document gives instructions for learning the basics of the Stata econometrics package used in the problem sets and for your dissertation. Getting Started To begin working with Stata, go to the Start icon at the bottom left hand corner of your screen. Left click on the icon, then left click on “Programs”, “academic applications”, “Economics”, “Stata” and finally “Intercooled Stata” You should see a screen which has four windows; the main “Stata Results” window, where your commands and the resulting output appear; a “Stata command” window, where all commands, or instructions appear when typed; a “Review” window containing previous commands you have typed – which can be recalled into the command window by left-clicking on any line; and finally a “Variables” window containing the names of all the variables you have in your data set.
The dot halfway down the Stata results screen is a prompt key, (the cursor will also be flashing in the command screen), which means that Stata is waiting for instructions.
At the top of the screen is a series of icons There is a built-in help resource, just click on the “Help” bar at the top left of the screen. You can search for commands or if you know the name of the command you can access Stata’s documentation using the “PDF Documentation” option. Stata also has its own web site and user network where you can post questions – see the “Stata Website” option.
There are also several on-line tutorials which are worth pursuing. For example, just type help graph intro and follow the instructions given by the package. There is also a useful website http://www.ats.ucla.edu/stat/stata/ which has lots of Stata tutorials, worked examples and data
Can I change the size of the windows?
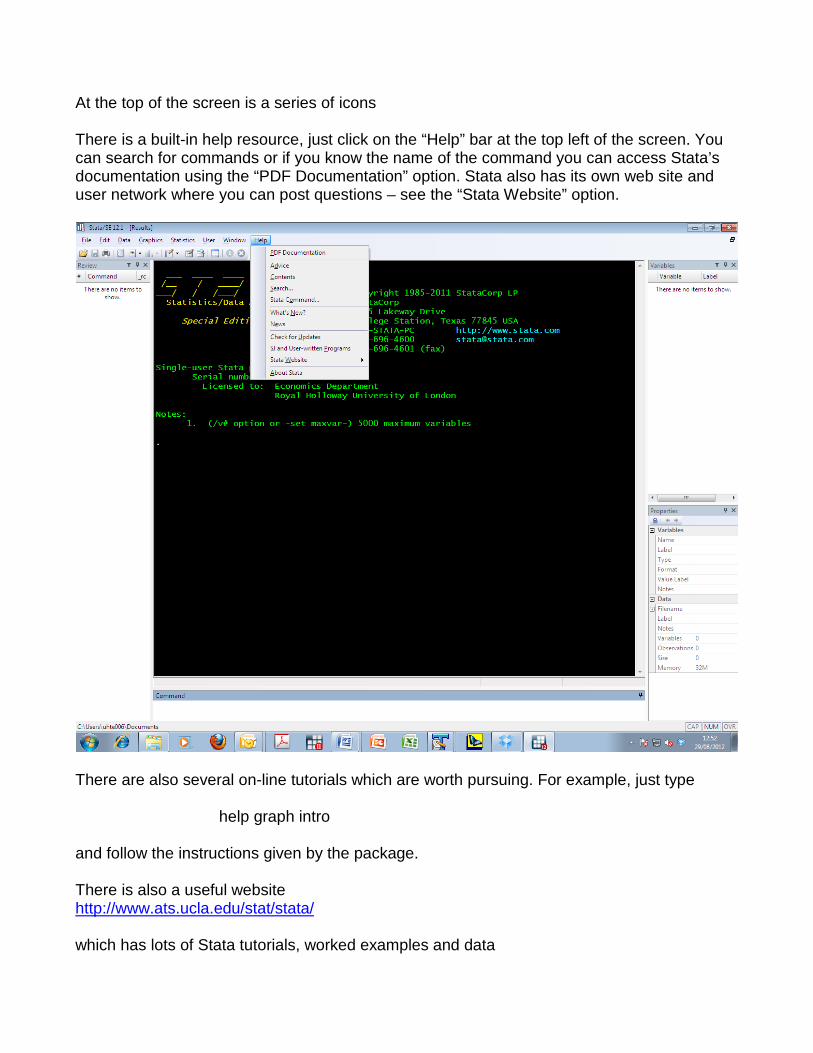
Yes. You can move and adjust the size of the Stata windows just as you would for any other windows. However, if you want these changes to be permanent, then choose Prefs then Save Windowing Preferences. Giving commands in Stata Stata is windows driven. Many commands can be accessed by clicking on the icons in the relevant windows.
However any command or instruction can always be input by hand in the “command” window at the bottom of the screen and this method is a useful way of learning the relevant commands. If you do this remember that STATA is case sensitive. All commands must be typed in lower case, (but variables names can have upper case characters).
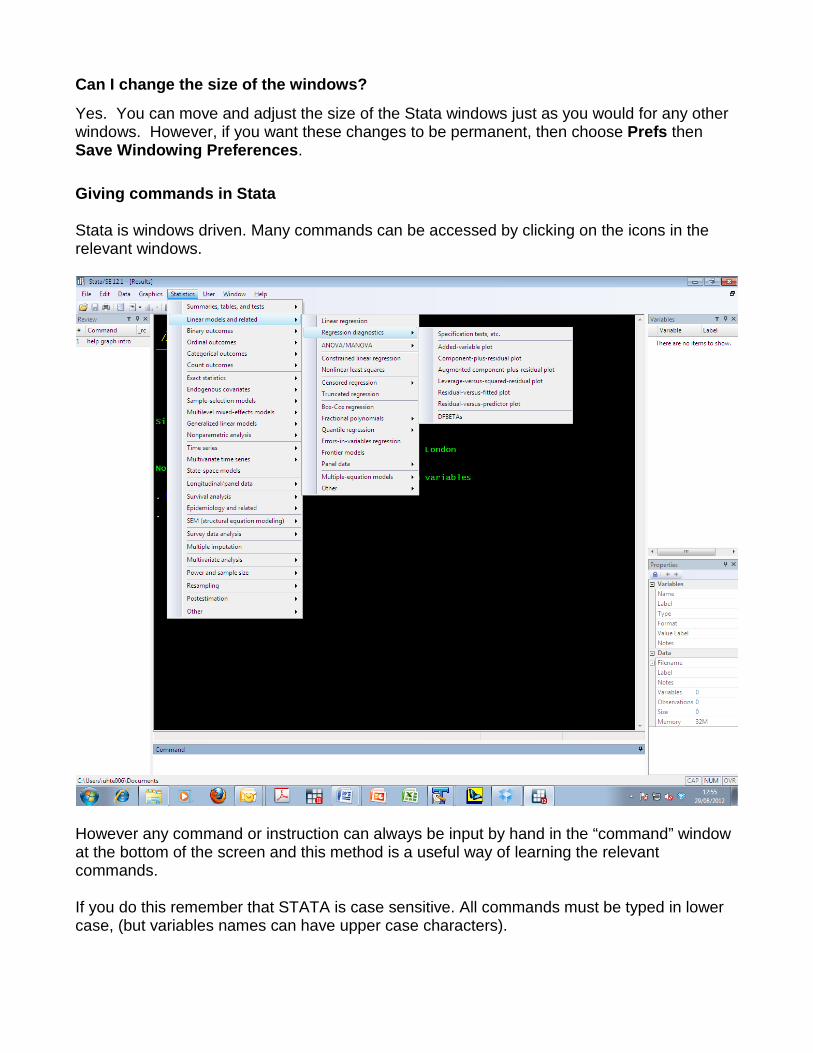
Log Files It is always a good idea to keep a record of all your commands and resulting output. Stata does this by writing everything to a “log” file. To start this process, left click on the “Log Begin” icon in the left-hand top corner of the screen. This will prompt you to give a name for this log file and a directory where you want the file kept. Usually this will be on your floppy disk, so you should specify the a: drive. They are ASCII (text) files and can be imported with no fuss into any word-processing package.
To close the log file at any time type log off To re-open the log file type log on When you have finished everything type log close
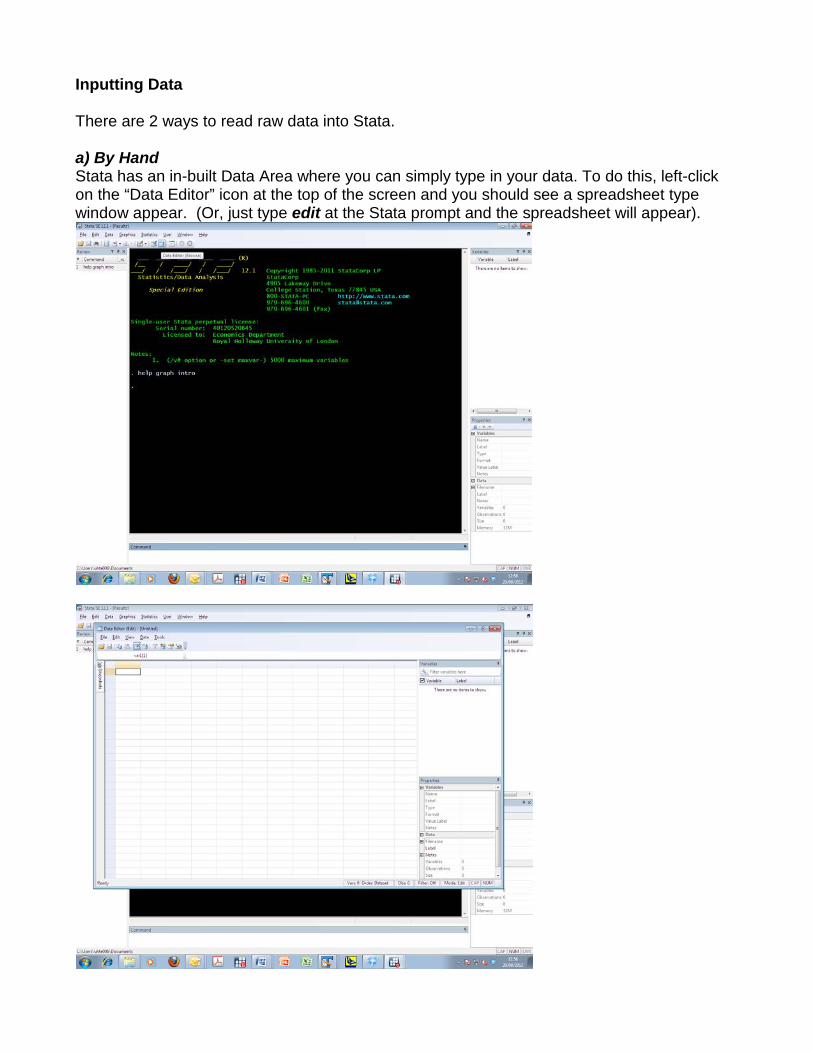
Inputting Data There are 2 ways to read raw data into Stata. a) By Hand Stata has an in-built Data Area where you can simply type in your data. To do this, left-click on the “Data Editor” icon at the top of the screen and you should see a spreadsheet type window appear. (Or, just type edit at the Stata prompt and the spreadsheet will appear).
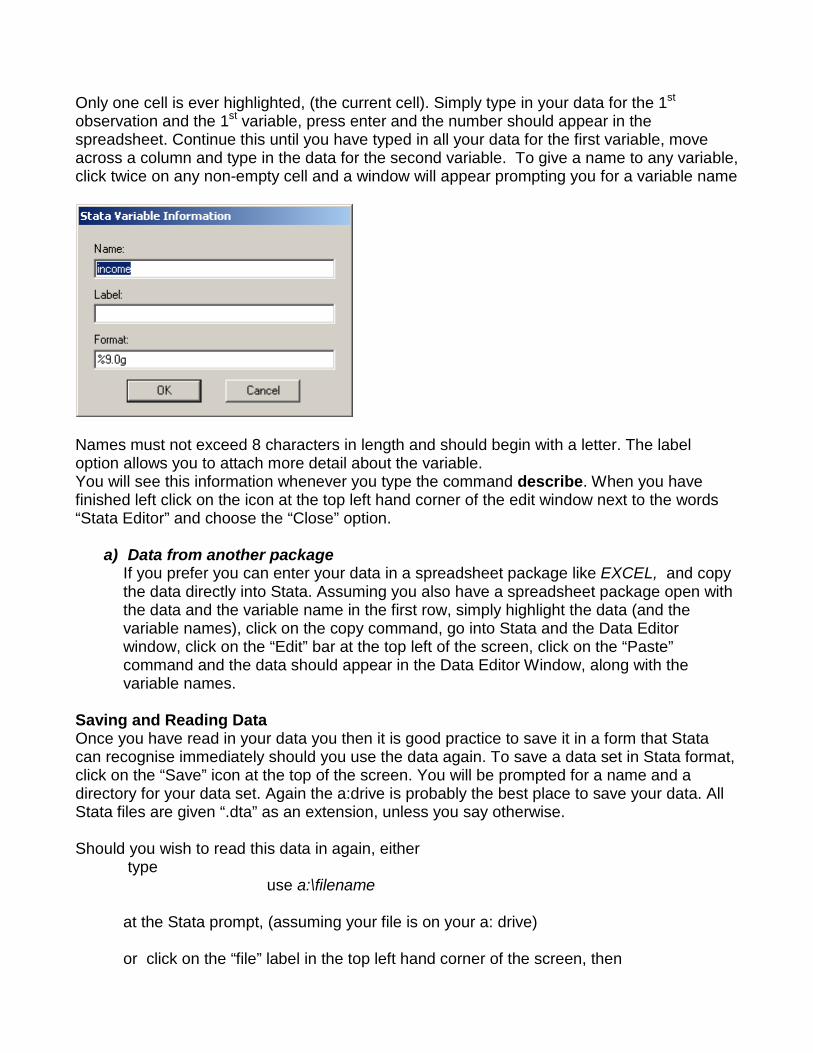
Only one cell is ever highlighted, (the current cell). Simply type in your data for the 1st observation and the 1st variable, press enter and the number should appear in the spreadsheet. Continue this until you have typed in all your data for the first variable, move across a column and type in the data for the second variable. To give a name to any variable, click twice on any non-empty cell and a window will appear prompting you for a variable name
Names must not exceed 8 characters in length and should begin with a letter. The label option allows you to attach more detail about the variable. You will see this information whenever you type the command describe. When you have finished left click on the icon at the top left hand corner of the edit window next to the words “Stata Editor” and choose the “Close” option.
a) Data from another package
If you prefer you can enter your data in a spreadsheet package like EXCEL, and copy the data directly into Stata. Assuming you also have a spreadsheet package open with the data and the variable name in the first row, simply highlight the data (and the variable names), click on the copy command, go into Stata and the Data Editor window, click on the “Edit” bar at the top left of the screen, click on the “Paste” command and the data should appear in the Data Editor Window, along with the variable names.
Saving and Reading Data Once you have read in your data you then it is good practice to save it in a form that Stata can recognise immediately should you use the data again. To save a data set in Stata format, click on the “Save” icon at the top of the screen. You will be prompted for a name and a directory for your data set. Again the a:drive is probably the best place to save your data. All Stata files are given “.dta” as an extension, unless you say otherwise.
Should you wish to read this data in again, either
type use a:\filename at the Stata prompt, (assuming your file is on your a: drive)
or click on the “file” label in the top left hand corner of the screen, then
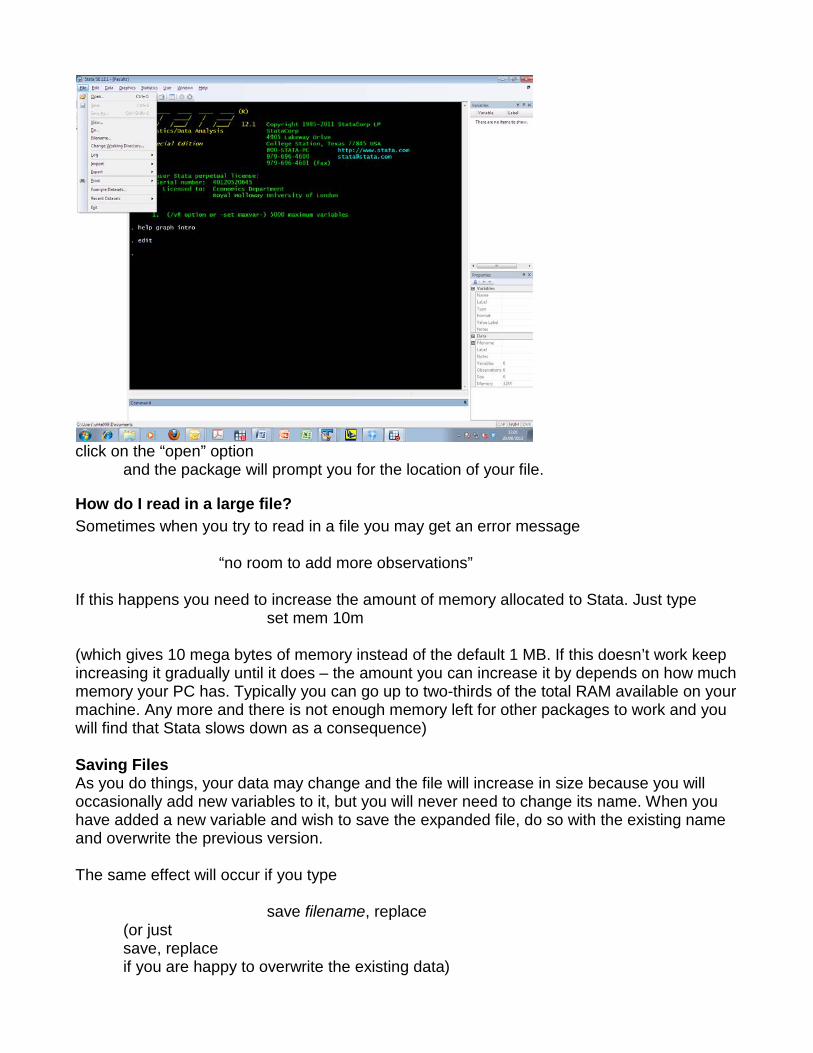
click on the “open” option and the package will prompt you for the location of your file.
How do I read in a large file? Sometimes when you try to read in a file you may get an error message
“no room to add more observations”
If this happens you need to increase the amount of memory allocated to Stata. Just type set mem 10m
(which gives 10 mega bytes of memory instead of the default 1 MB. If this doesn’t work keep increasing it gradually until it does – the amount you can increase it by depends on how much memory your PC has. Typically you can go up to two-thirds of the total RAM available on your machine. Any more and there is not enough memory left for other packages to work and you will find that Stata slows down as a consequence)
Saving Files As you do things, your data may change and the file will increase in size because you will occasionally add new variables to it, but you will never need to change its name. When you have added a new variable and wish to save the expanded file, do so with the existing name and overwrite the previous version. The same effect will occur if you type
save filename, replace (or just save, replace if you are happy to overwrite the existing data)

You cannot print Stata files directly because it is in a special format that no printer can recognise. If you wish to print out some of the data, you have to do this from within Stata. If you wish to preserve the output for each exercise, you should give each file a different name. If you have loaded a file, completed your analysis, and then wish to use a different data set, you simply clear the existing data set from memory: clear In doing this, it is important to know that any changes you made to the previous data set will be lost. If, for example, you created a bunch of new variables, and you would like to have these variables available the next time you use the data, you should save the data set before using the clear command. Common diagnostic commands Here are a few commands that will be useful in the exercises:
If you want to look at the first 20 observations on the variables wage and educ in a data set then type list hourpay age female in 1/20 and you will see
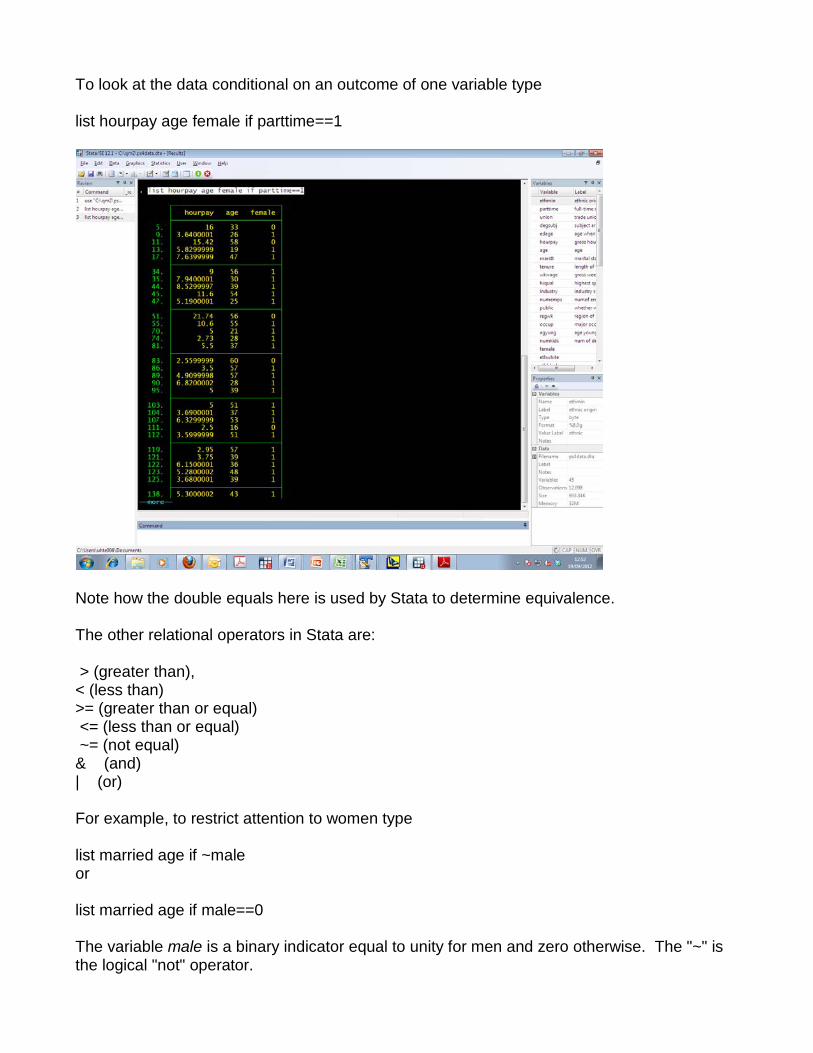
To look at the data conditional on an outcome of one variable type list hourpay age female if parttime==1
Note how the double equals here is used by Stata to determine equivalence. The other relational operators in Stata are: > (greater than), < (less than) >= (greater than or equal) <= (less than or equal) ~= (not equal) & (and) | (or) For example, to restrict attention to women type list married age if ~male or list married age if male==0 The variable male is a binary indicator equal to unity for men and zero otherwise. The "~" is the logical "not" operator.
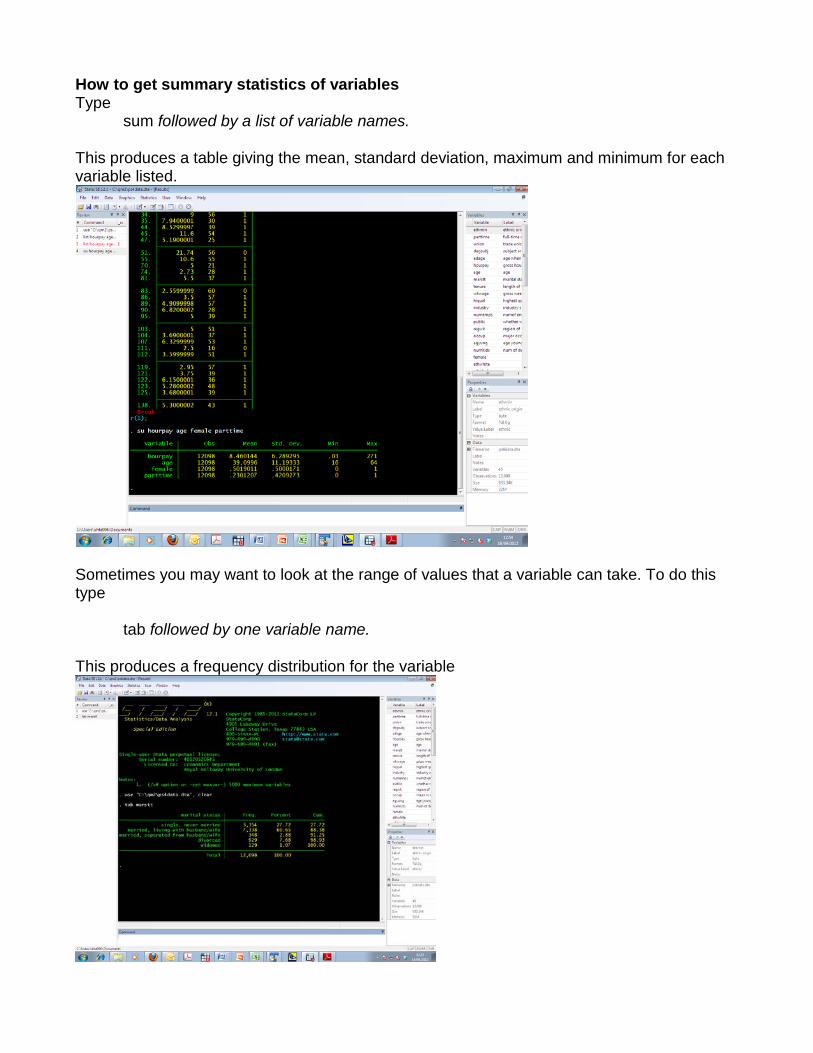
How to get summary statistics of variables Type
sum followed by a list of variable names. This produces a table giving the mean, standard deviation, maximum and minimum for each variable listed.
Sometimes you may want to look at the range of values that a variable can take. To do this type
tab followed by one variable name. This produces a frequency distribution for the variable
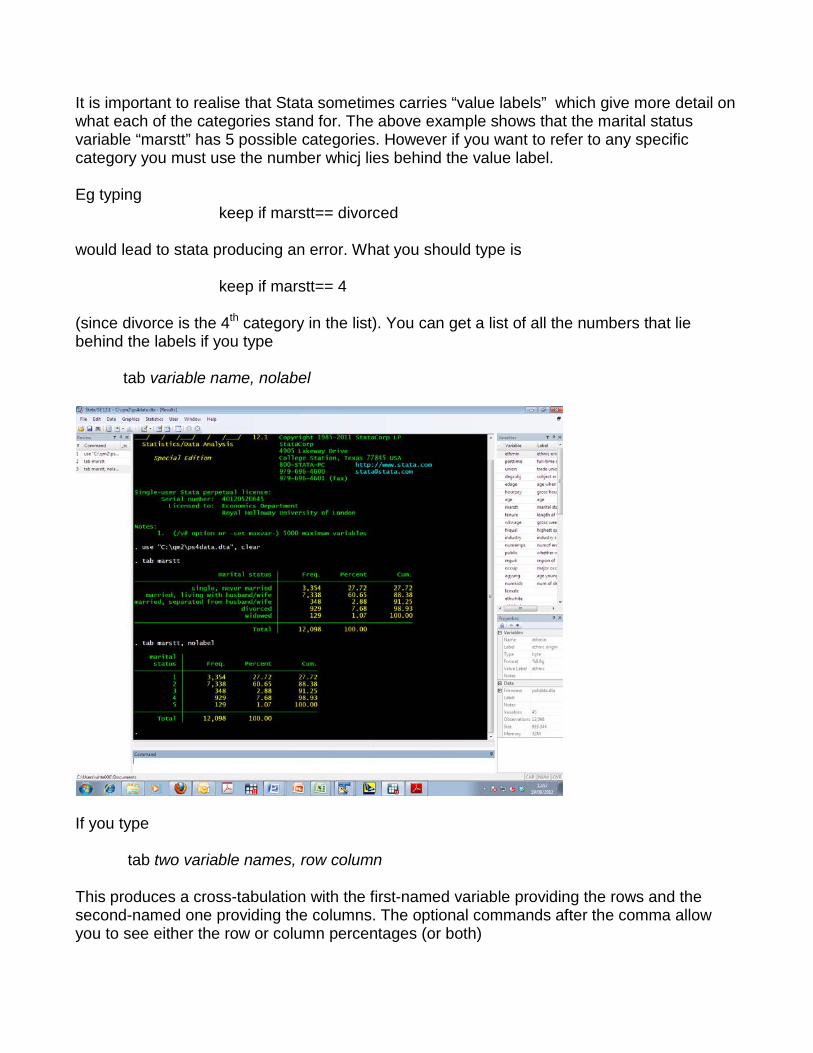
It is important to realise that Stata sometimes carries “value labels” which give more detail on what each of the categories stand for. The above example shows that the marital status variable “marstt” has 5 possible categories. However if you want to refer to any specific category you must use the number whicj lies behind the value label. Eg typing
keep if marstt== divorced would lead to stata producing an error. What you should type is
keep if marstt== 4 (since divorce is the 4th category in the list). You can get a list of all the numbers that lie behind the labels if you type
tab variable name, nolabel
If you type
tab two variable names, row column This produces a cross-tabulation with the first-named variable providing the rows and the second-named one providing the columns. The optional commands after the comma allow you to see either the row or column percentages (or both)
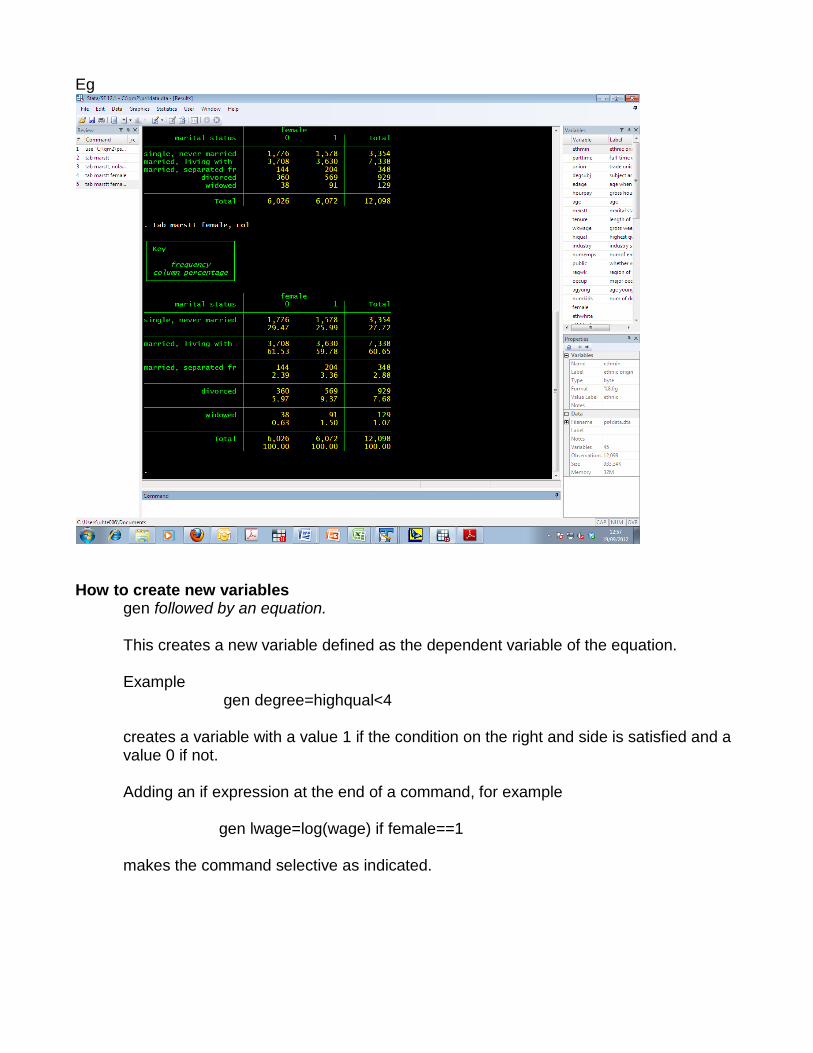
Eg
How to create new variables
gen followed by an equation.
This creates a new variable defined as the dependent variable of the equation.
Example gen degree=highqual<4
creates a variable with a value 1 if the condition on the right and side is satisfied and a value 0 if not.
Adding an if expression at the end of a command, for example
gen lwage=log(wage) if female==1
makes the command selective as indicated.
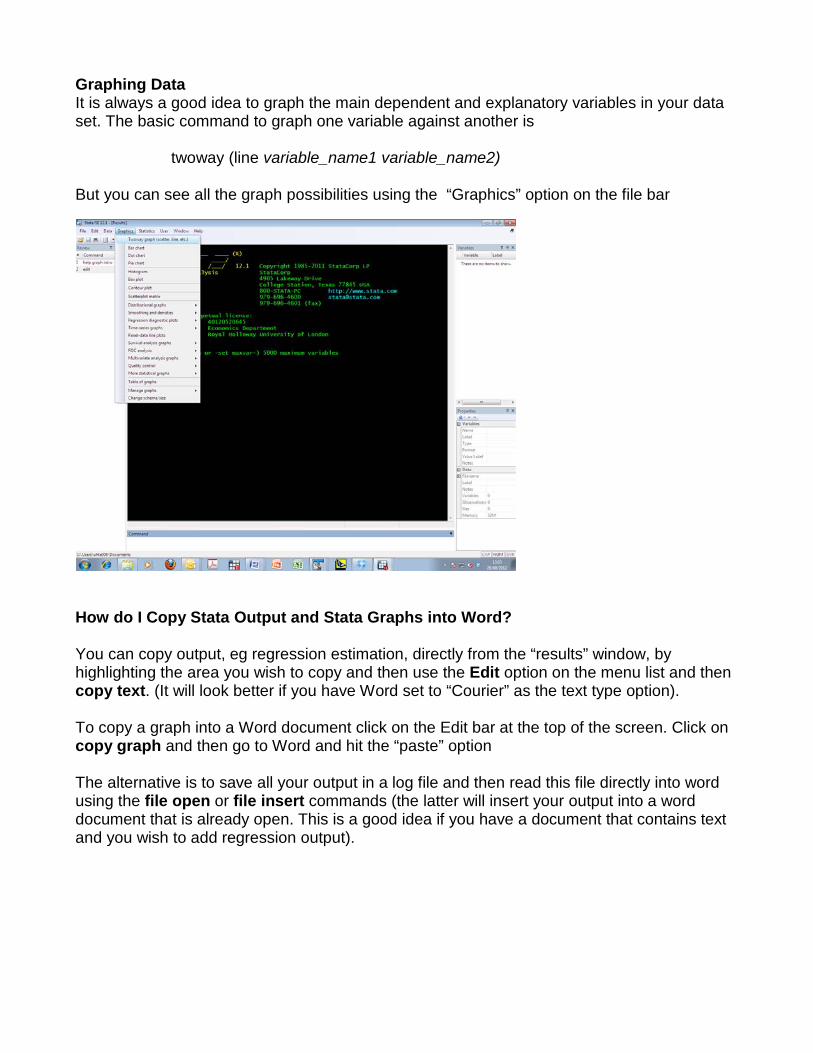
Graphing Data It is always a good idea to graph the main dependent and explanatory variables in your data set. The basic command to graph one variable against another is twoway (line variable_name1 variable_name2) But you can see all the graph possibilities using the “Graphics” option on the file bar
How do I Copy Stata Output and Stata Graphs into Word? You can copy output, eg regression estimation, directly from the “results” window, by highlighting the area you wish to copy and then use the Edit option on the menu list and then copy text. (It will look better if you have Word set to “Courier” as the text type option). To copy a graph into a Word document click on the Edit bar at the top of the screen. Click on copy graph and then go to Word and hit the “paste” option The alternative is to save all your output in a log file and then read this file directly into word using the file open or file insert commands (the latter will insert your output into a word document that is already open. This is a good idea if you have a document that contains text and you wish to add regression output).
Regression Estimation Commands To produce OLS estimates, standard errors, t statistics, confidence intervals, and a variety of other statistics usually reported with OLS.
reg followed by a list of variable names. The first variable is regressed on the rest. An example is reg lwage educ exper expersq married Unless a specific range of observations or a logical statement is included, Stata uses all possible observations in obtaining estimates. It does not use observations for which data on the dependent variable or any of the independent variables is missing. Thus, you must be aware of the fact that adding another explanatory variable can result in fewer observations used in the regression if some observations do not contain a value for that variable. To restrict our regression based on the size of one or more of the explanatory variables. In the regression reg contribs mtchrate size sizesq if size <= 5000 where size is number of employees of a firm, the analysis is restricted to firms with no more than 5,000 employees. Most if conditions are straightforward, but there is one that is not: a condition which uses an double = sign, like
reg wage age if female==1
(says regress wages on age if (and only if) the individual in the sample is female)
You must repeat the = sign as shown. This is to distinguish between the use of = in equations defining variables and its use in tests for equality. If you prefer to use the windows icons at the top of the screen then click on “statistics” followed by “linear models and related” and then “linear regression”

You will then be prompted to enter the name of the dependent variable and the set of independent variables along with any conditions
Remember if ever you get stuck, you can always type help command or instruction or
search command or instruction
and Stata should respond Leaving Stata If no changes are made to your data file, to leave Stata (after closing your log file, if opened), type exit Stata will not exit if new variables have been created, or if part of the sample has been dropped. If you do not wish to save any changes you have made then type exit, clear This is especially useful if, after reading in the initial file, you dropped some observations before undertaking your analysis. In most cases you do not want to save the smaller data set over the original one.