Embed Size (px)
Citation preview

†Correspondence should be directed to: Sarah Flood University of Minnesota, 50 Willey Hall, 225 19th Ave S., Minneapolis, MN 55455 e-mail: [email protected] , phone: 612-624-5818, fax:612-626-8375
Using the Annual Social and Economic Supplement with Current Population Survey Panels
Sarah Flood†
Minnesota Population Center University of Minnesota
José Pacas U.S. Census Bureau
Washington, DC
September 2016
Working Paper No. 2016-4

Abstract The Annual Social and Economic Supplement (ASEC) is the most widely used type of Current Population Survey (CPS) data because of its rich information on employment, unions, health insurance and taxes. Researchers typically use these data as repeated cross sections despite the longitudinal component of the CPS, which many researchers are unaware of and very few leverage. The IPUMS-CPS (https://cps.ipums.org) project at the University of Minnesota is undergoing a large-scale effort to unlock the enormous research potential of the CPS by making it easier to access and use monthly CPS data and to link observations over time. Making the ASEC available to the research community as part of the larger collection of linked CPS panel data is of enormous value given the widespread use of the ASEC. But the unique aspects of the ASEC compared to other Basic Monthly CPS files make it cumbersome to use it as part of a longitudinal CPS panel. This paper details the complexities of the ASEC oversampling and the creation of an identifier that links the ASEC and the March Basic Monthly data which drastically simplifies analyzing ASEC data as part of a panel of CPS observations. Keywords: Data integration, linking, panel data, Current Population Survey
2
Section 1 – Introduction
The Annual Social and Economic Supplement (ASEC) is the most commonly used file from the
Current Population Survey (CPS) with its rich information about employment, union membership, health
insurance and taxes. While the monthly CPS, referred to henceforth as the Basic Monthly CPS, is the
official source of labor force statistics of the United States, the ASEC gathers data on social and economic
indicators. These data are used to calculate the official poverty rate of the United States and have been
used to measure health insurance coverage rates in the post-Affordable Care Act period. The breadth of
data collected in the ASEC means it is among the most popular datasets for analyzing the United States
population and it is arguably the most popular CPS supplement.
Despite its longitudinal component, researchers typically use these data as repeated cross sections
because of the effort required to correctly link the data across years. Researchers have documented the
difficulties of and strategies for linking CPS monthly data as well as how to link adjacent ASEC samples
[1, 2, 3, 4, 5, 6]. No paper, however, has addressed how to use ASEC data in conjunction with Basic
Monthly CPS data.
IPUMS-CPS (https://cps.ipums.org) is eliminating barriers for researchers who want to use linked
CPS data. Building on previous work to enhance access to the ASEC, IPUMS-CPS is also simplifying
access to Basic Monthly CPS data and facilitating the linking of CPS observations over time via the
creation of a new unique identifier (CPSID) [7]. Unfortunately, due to the unique aspects of the ASEC
compared to the other Basic Monthly CPS data, the power of CPSID is limited by the exclusion of the
ASEC. This paper documents the creation of an additional identifier (MARBASECID) that makes the
linkage between the ASEC and the March Basic Monthly CPS data straightforward and simplifies
analyzing ASEC data as part of a panel of CPS observations. Making the ASEC available as part of the
larger collection of linked CPS panel data is of enormous value given the widespread use of the ASEC
and underutilization of linked CPS data. This effort promises to save the research community countless

3
hours of duplicated effort, eliminates a huge potential source of error, and increases replicability of
research results.
We begin with an overview of the CPS and a description of the ASEC oversamples. The CPS
overview details differences between the ASEC and other months of CPS data and the implications of
oversample changes for users who want to link ASEC observations both to other ASEC files and to Basic
Monthly CPS files. We then detail the process we followed to create MARBASECID, which allows us to
easily link ASEC and March Basic Monthly CPS data, add CPSID to ASEC files, and drastically simplify
researcher use of ASEC data along with other Basic Monthly CPS data as a panel. Finally, we also
provide substantive examples to illustrate the value in combining the ASEC with other Basic Monthly
CPS data.
Section 2 – Brief Overview of the Current Population Survey
To link respondents from the ASEC to Basic Monthly CPS data, one must understand the purpose
and design of the CPS. The primary function of the CPS is to be "the source of the official Government
statistics on employment and unemployment" [7]. These data have been collected on a monthly basis
since 1940 when record levels of unemployment during the Great Depression heightened the need for
reliable unemployment statistics. To that point there had been little effort to count the number of jobless
persons in the country, much less to develop precise definitions and concepts of employment. During the
late 1930s, these concepts were developed and adopted for a national survey of households implemented
by the Works Progress Administration. This effort resulted in the first iteration of the Monthly Report of
Unemployment, introduced in 1940. In 1942, the Census Bureau took over the survey and changed the
name to the Monthly Report on the Labor Force. In 1948, a final name change occurred to the CPS "to
reflect the survey's expanding role as a source for data on a wide variety of demographic, social, and
economic characteristics of the population" [8]. A final significant event in the history of the survey is
that, in 1959, the task of analyzing and publishing CPS labor force data was given to the Bureau of Labor

4
Statistics while the Census Bureau maintained the task of data collection. In short, the CPS has
historically been and continues to be a monthly labor force survey [8].
The Basic Monthly CPS is a sample representative of the civilian, household-based population of
the United States. The CPS samples households1 (physical structures) and surveys their occupants. Once a
household is selected into the sample, household members are surveyed in four consecutive months, left
out of the sample for the following eight months, and then re-interviewed in each of the following four
months; the rotation pattern is illustrated in Table 1. CPS refers to each interview month as a Month-in-
Sample (MIS) and thus there are at most eight MIS for a particular household (MIS 1- MIS 8). For
example, consider a dwelling that is selected for the survey in January of 2001. The individuals in the
dwelling will be interviewed in January 2001, February 2001, March 2001, and April 2001. For the
following eight months (May 2001-December 2001), they will not be interviewed. The individuals in the
dwelling will be interviewed four more times: January 2002, February 2002, March 2002, and a final
interview in April 2002.
[Table 1 about here]
Section 2a – CPS Supplements
In addition to the Basic Monthly CPS, supplements to the CPS are frequently fielded. CPS
supplements vary widely in scope and type (see Table 11-1 from [8] for a complete list of CPS
supplements) and usually contain only individuals who also complete the Basic Monthly Survey in the
1 A household consists of all the people who occupy a housing unit. A house, an apartment or other group of rooms, or a single room, is regarded as a housing unit when it is occupied or intended for occupancy as separate living quarters; that is, when the occupants do not live with any other persons in the structure and there is direct access from the outside or through a common hall. A household includes the related family members and all the unrelated people, if any, such as lodgers, foster children, wards, or employees who share the housing unit. A person living alone in a housing unit, or a group of unrelated people sharing a housing unit such as partners or roomers, is also counted as a household. The count of households excludes group quarters. (http://www.census.gov/cps/about/cpsdef.html)

5
month the supplement is fielded.2 For example, the Voting and Registration supplement is fielded
biennially and administered only to respondents from the November Basic Monthly CPS. Supplement
eligibility (i.e. universes) varies, however, meaning that some respondents to a Basic Monthly CPS will
not receive the supplemental questionnaire fielded in that month. For example, the Displaced Worker
supplement is asked of workers 20 years of age and older who were displaced from their jobs and who
were interviewed in the January Basic Monthly CPS. The ASEC is an exception; this supplement is
administered during the March Basic Monthly CPS, but also includes CPS participants from other months
who are not scheduled to receive the March Basic Monthly CPS. This unique aspect of the ASEC
requires special handling in the process of linking it to other CPS data files.
Section 2b – The "March Supplement"
The most popular CPS supplement is the "March Supplement." The technical name for this
supplement since 2003 is the Annual Social and Economic Supplement (ASEC) or the Annual
Demographic File (ADF) between 1947 and 2003. The ASEC was first introduced in 1947. Between 1947
and 1955, the ASEC was administered in April and included households from the April Basic Monthly
CPS (see Table 2). After 1955, the ASEC was implemented in March, and began being commonly
referred to as the "March Supplement." Between 1956 and 1975, the ASEC consisted only of respondents
from the March Basic Monthly CPS. Over time, the ASEC sample has expanded to improve the reliability
of information about certain subpopulations (i.e. persons of Spanish (Hispanic) origin and low-income
children who do not have health insurance coverage). Currently, the ASEC contains basic monthly
demographic and labor force data as well as supplementary data on work experience, income, noncash
benefits, and migration [7]. Given the expansion and implementation of the ASEC – drawing the ASEC
2 There are three exceptions to the Basic Monthly CPS serving as the sampling scheme for CPS supplements. The Housing Vacancy Supplement (HVS) and the American Time Use Survey (ATUS) are surveys that base their samples from the Basic Monthly CPS but do not happen at the time of the Basic Monthly CPS. The HVS collects information on housing units that were vacant at the time of the Basic Monthly CPS. The ATUS collects information on how respondents spend their time and is conducted a few months after a respondent's final Basic Monthly CPS survey. The third is the ASEC described in detail here.

6
sample from the March Basic Monthly CPS and households from non-March Basic Monthly CPS
samples – there are complications for longitudinal linking of Basic Monthly CPS files [8].
[Table 2 about here]
Section 2c – ASEC Oversamples
The ASEC oversampling scheme has important ramifications for researchers who want to link
CPS respondents across time. Though all of the ASEC respondents participate in the Basic Monthly CPS,
only ASEC households that were administered the March Basic Monthly CPS can be matched. Linking
ASEC oversample respondents to their Basic Monthly CPS observations is extremely tedious and labor
intensive at best, if not impossible in some cases. We therefore focus our efforts on matching March
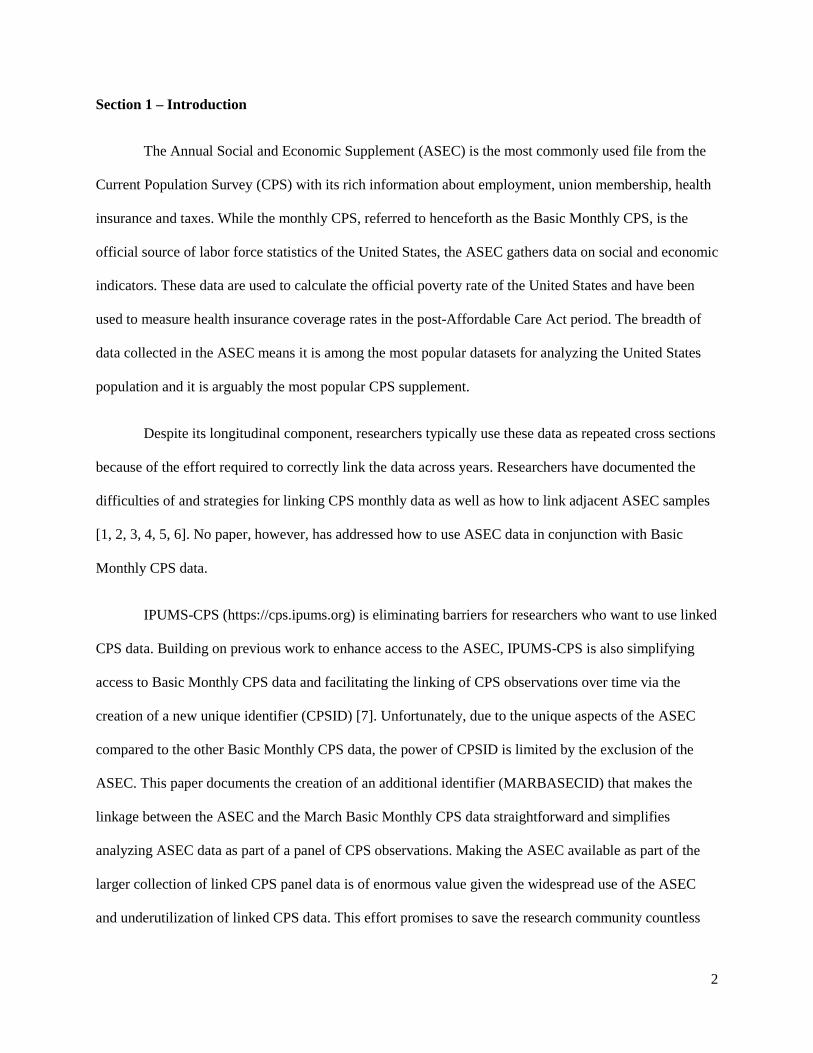
Basic Monthly CPS observations to records in the ASEC (see Table 3). Figure 1 graphs the size of the
ASEC oversample from 1989 to 2013 and shows that in each year the ASEC is larger than the March
Basic Monthly CPS with larger differences when the SCHIP (State Children’s Health Insurance Program)
oversample is introduced (details on this below). MARBASECID is currently created for the 1989 to
2013 period, but will be created forward (up to the most current ASEC) and backward (up to ASEC 1976)
in time so that CPSID can be made available via IPUMS-CPS.
From March 1976 through 2000 the Census Bureau increased the reliability of estimates for
people of "Spanish origin" by conducting additional interviews with November households (from the
previous year) that contain one or more persons of Spanish origin [9]. The ASEC oversample of people of
Spanish origin is commonly referred to as the "November Hispanic oversample." The November Hispanic
oversample increased the size of the ASEC by about 2,500 additional households (see the 1989-2000
range in Figure 1). Because of the CPS rotation pattern (4-8-4), all of the Spanish households identified in
November are out of the CPS sample when the March Basic Monthly CPS is conducted (in fact, no
households interviewed in November are eligible for the March interview based on the 4-8-4 CPS rotation
pattern). For example, a household in MIS 1 in November will be MIS 4 in February and thus out of the

7
CPS in March (similarly, MIS 5 households in November will be MIS 8 in February). Because the
oversample households would not have otherwise been in the ASEC, we refer to these extra visits as MIS
9 and 10, respectively; in the data, however, the Hispanic oversample cases are assigned MIS values
between one and eight, making the oversample cases more complicated to identify.3 During the extra
interviews, the November Hispanic oversample receives both the March Basic Monthly CPS and the
ASEC, though the responses to the Basic Monthly are never released [8]. Thus, the November Hispanic
oversample results in additional cases in the ASEC from other months of the CPS that would not have
otherwise been in the March Basic Monthly CPS.
The second CPS sample expansion in 2001 was funded by a Congressional allocation of $10
million annually to the Census Bureau. The expansion was motivated by an interest in producing reliable
state-level estimates on low-income children without health insurance and to measure the effects of the
State Children's Health Insurance Program (SCHIP) established by Congress in 1997 [10]. This initiative
funded a general expansion of the CPS as well as an additional oversample to the ASEC. The general
expansion added 12,000 units to the sample monthly [10]. The Basic Monthly CPS sample size increases
were completed between September 2000 and July 2001 as is evident by the increasing sample sizes
during this period in Figure 1. While the sample increases were completed in July 2001, the expansion is
not evident in the March Basic Monthly CPS until 2002 [10].
[Figure 1 about here]
In contrast to the November Hispanic oversample, the SCHIP oversample is drawn using two
strategies: "split-path" assignment and month-in-sample 9 (MIS 9) assignment. The "split-path" strategy
selects respondents from the February Basic Monthly CPS and April Basic Monthly CPS (adjacent
months to the March Basic Monthly CPS). February households with MIS 4 and 8 that contain children
3 In the ASEC files, all households receive an MIS value of 1-8. In Census documentation, extra interviews are occasionally referred to as MIS 9. For convenience, we refer to the second additional interview for oversample cases as MIS 10.

8
(18 or younger) or non-White household members complete the ASEC at the time of the February Basic
Monthly CPS interview. Similarly, April households in MIS 1 and 5 that included children (18 or
younger) or non-White household members receive the ASEC during the April CPS Basic interview.
Neither the “split-path” eligible respondents from February or April would have otherwise participated in
the ASEC because of the survey’s rotation pattern. The term "split-path" thus refers to these February and
April cases that would normally have received the supplements assigned for February and April
(potentially Job Tenure or Child Support) but instead are "split" into the ASEC. Theoretically, one should
be able to identify ASEC respondents selected as part of this split-path assignment [10].
The second set of households in the SCHIP oversample – the MIS 9 households – is administered
an extra interview. 4 These cases are contacted for a ninth interview in either February or April. From
2001 to 2003, these households are drawn from the November Basic Monthly CPS of the previous year if
they are in MIS 6, 7, or 8 in November and they are not part of the November Hispanic oversample and
they are not Hispanic and either have at least one child 18 years or younger or a non-White member. Note
that these households will have completed all eight interviews of the CPS rotation pattern by January at
the latest (for MIS 6). Starting in 2004, the MIS 9 oversample was chosen from August (MIS 8),
September (MIS 8) and October (MIS 8); the same condition applies as before of either having at least
one child 18 years or younger or a non-White member and being non-Hispanic [10].
Section 3 – IPUMS-CPS Constructed Identifiers for Linking CPS Data
4 Notice that the November Hispanic oversample respondents are also contacted an extra time outside of their 8 scheduled CPS Basic interviews. In fact, since the November Hispanic oversample includes households from all MIS's, it is possible that a household from the November Hispanic oversample is contacted two extra times. Thus, though the common understanding of the CPS rotation pattern implies that households are interviewed at most 8 times is technically incorrect. As part of the ASEC oversampling, it is possible for Hispanic oversample households to be contacted 10 separate times and MIS-9 oversample households to be contacted 9 times. Unfortunately, MIS values in the public use data do not exceed 8.

9
IPUMS-CPS has created two identifiers for linking CPS data. CPSID uniquely identifies each
individual in the CPS and is used to linking Basic Monthly CPS files to one another. MARBASECID is
used to identify individuals in both the March Basic Monthly CPS and in the ASEC and allows IPUMS-
CPS to put CPSID on the ASEC files. Our creation of two identifiers serves two purposes. First, it is an
opportunity to encourage researchers to be deliberate about their use of the ASEC data with Basic
Monthly CPS data and to more thoroughly understand CPS survey design details. Second,
MARBASECID allows us to be transparent about the assignment of CPSID to ASEC records, an effort
that was parallel to but not the same as that to create CPSID.
Section 3a – CPSID
The ASEC is unique among CPS data and that has implications for linking, which we describe in
the next section. To lay the foundation for our work on MARBASECID, we first outline the procedures
for linking CPS Basic Monthly data. Using linking keys available on all public use Basic Monthly CPS
files, users can link observations over time to create short sixteen-month panels with up to eight
observations per person. This work, however, is cumbersome and expensive for each individual
researcher to perform independently. The several obstacles researchers face in linking Basic Monthly CPS
observations, including recycled identifiers, changing linking keys, and the household rather than the
person as a sampling unit, are detailed elsewhere [6]. As a service to users, IPUMS-CPS staff created a
single unique identifier – CPSID – that lowers the barrier to using repeated observations of individuals
from Basic Monthly CPS files as a panel. CPSID uses the original linking keys provided by CPS to match
records over time, accounts for the complex CPS rotation pattern, and assigns a new unique identifier to
each record in the Basic Monthly CPS. However, CPSID was not initially created for ASEC files because
the ASEC lacks all of the linking keys required for matching records to other Basic Monthly CPS files.
Section 3b – MARBASECID

10
To make CPSID available on the ASEC, we create MARBASECID, a variable we use and make
available to users to matches individuals in the ASEC to the March Basic Monthly CPS. MARBASECID
is a 10-digit variable that links individuals in the March Basic Monthly CPS of year X (1989-2013) to the
ASEC in the same year. Each person in both the March Basic Monthly CPS and the ASEC in a given year
are assigned a unique ID that consists of two digits (either 00 or 11), a two-digit year, and a six-digit
sequence number. For individuals who appear in both the March Basic Monthly CPS and the ASEC, the
two-digit number that becomes the first two digits in MARBASECID is 11; the six-digit sequence
number begins at 000001 and increments by one for each additional person in the file who also matches.
For a matched observation in the 1989 March Basic Monthly CPS, MARBASECID is 11 + 89 + six-digit
sequence number. The two-digit number for unlinked observations in both the March Basic Monthly CPS
and the ASEC is 00. For unlinked March Basic Monthly CPS individuals, MARBASECID takes the
form: 00 + two-digit year + six-digit sequence number starting at 000001 and incrementing by one for
each unlinked March Basic Monthly CPS person. For unlinked ASEC individuals, MARBASECID is a
concatenation of 00, two-digit year, and a six-digit number starting at 500,000 and incrementing by one
for each unlinked ASEC observation. This method ensures that MARBASECID is unique within and
across years. For example, a MARBASECID value of 1100012345 is decoded as follows: “11” refers to
the individual who is in both the March Basic and ASEC; “00” refers to the ASEC survey year of 2000;
“012345” refers to that household being given the randomly sequenced order number of 12345. Similarly,
a MARBASECID of 0098000012 refers to an unlinked person from the March Basic of 1998 while
0098500012 refers to an unlinked person from the 1998 ASEC.
Section 3c – Creating MARBASECID
We now turn to the technical details for creating MARBASECID, the identifier for linking the
March Basic Monthly CPS and the ASEC. The creation of MARBASECID is a critical step in the process
of attaching CPSID, a unique IPUMS-created identifier, to the ASEC. As discussed previously, CPSID
allows researchers to may easily and reliably link data across CPS months, including the ASEC. The

11
creation of MARBASECID eliminates the need for individual researchers to perform this tedious and
cumbersome process of linking the March Basic Monthly Survey and the ASEC, which is complicated for
two primary reasons. First, the variables required to link the ASEC to CPS monthly files are not available
for all years on the ASEC. As a result of omitted linking keys and the ASEC oversample, duplicate and
false matches are problematic. Second, we speculate, despite the absence of technical documentation to
be certain, that the Census Bureau transition to a computer-based interview resulted in more prominent
data quality issues for linking across months even if they did not compromise the integrity of each
individual month of data.
The March Basic Monthly CPS to ASEC matching algorithm overcomes these difficulties and
allows us to put CPSID on the ASEC for easy linkages to other CPS monthly data. With CPSID on the
ASEC, opportunities for using the CPS as a panel multiply since the ASEC is the premier CPS
supplement. Theoretically, Census-provided household and person identifiers should be sufficient to link
the March Basic Monthly CPS and ASEC files. If that were the case, researchers would have many
demographic variables with which to check the validity of matches. Practically, however, the linking keys
that should uniquely identify records do not always [2]. Table 3 details by year (1989-2013) the variables
used to link the March Basic Monthly CPS and ASEC, the number of persons in the March Basic
Monthly CPS, the number of matches/non-matches to the ASEC, and the number of invalidated matches.
From 1994 forward, we validate matches based on AGE, SEX, and RACE (we follow the evaluation of
validity using age, sex and race in line with [1]), and we find high validation rates for links made between
the March Basic Monthly CPS and ASEC files.
Our strategy for creating MARBASECID is slightly different depending on the types of problems
we encounter linking the March Basic Monthly CPS and ASEC files. From 2005 to 2013, the matching
algorithm is very simple. Using the variables listed in Table 3, one is able to uniquely identify all March
Basic Monthly CPS respondents and ASEC respondents and March Basic Monthly CPS observations are
easily located in the ASEC.
12
[Table 3 about here]
From 1996 to 2004, the matching algorithm is more complicated because of duplicate records
caused by non-unique linking keys. Our strategy for handling the duplicate records is as follows. During
the first stage, duplicate records based on the first stage linking keys in Table 3 are identified and flagged
in both the March Basic Monthly CPS and the ASEC. Then, March Basic Monthly CPS records that are
not uniquely identified are dropped from the file. Within a pair of ASEC duplicates, we keep the duplicate
with the lowest H_SEQ (the household identifier created by Census Bureau that is unique within a given
survey month) value since these records are part of the March Basic Monthly CPS rather than an ASEC
oversample [11]. We then merge the pruned March Basic Monthly CPS and ASEC files using the first
stage linking keys in Table 3. The second stage of work uses the observations from the duplicate record
file (i.e. the “pruned” observations) and the non-matches from the first round of matching. We link
records using the fewest variables possible. Even then, the data sometimes require a close analysis of a
few observations in order to find the correct match. The period 2001 to 2004 was potentially problematic
because of the SCHIP expansion of the ASEC oversample. Though CPS documentation details the
variables researchers should use for linking, these variables do not uniquely identify records, thus
complicating the process. The 1996 to 2000 period was also problematic for unknown reasons. These
complications are detailed in Appendix A.
The greatest challenges in creating MARBASECID occur prior to 1996 when data quality
problems (i.e. duplicate records based on linking keys and missing observations) are more common. In
1995, we employed the two-stage matching approach and were unable to match 951 observations from
the March Basic Monthly CPS to the ASEC. It is possible that the observations are missing from the
ASEC, though we have yet to find documentation about this specific issue. To link the 1994 March Basic
Monthly CPS and ASEC files, we employ first and second stage matching (Table 3) and also make
additional adjustments. The most important adjustment is that the ASEC file must contain a corrected
version of HRHHID (the originally released 1994 ASEC file contained an error in HRHHID resulting

13
from the program that created the variable [12]; a corrected file was made available via NBER in 2003
and is available via IPUMS-CPS); matching is impossible without the corrected version of HRHHID.
Several other minor adjustments must be made, including harmonizing age for a few observations (i.e. an
observation may have age of 81 in the March Basic Monthly CPS but 80+ in the ASEC) and handling
duplicate observations; our handling of these issues is detailed in Appendix B.5
Section 4 – Linking Research Potential
The ability to easily link CPS observations over time to the ASEC creates opportunities for many
lines of research that have previously been limited without deep knowledge of the ASEC and the CPS
more generally. The ASEC is especially important for researchers who want to leverage information
about taxes, health insurance, public benefit use, among other things because these data are not collected
in the CPS outside of the ASEC. Below, we provide two substantive examples of linking CPS Basic
Monthly data to the ASEC that demonstrate the potential of MARBASECID for the research community.
Because of the CPS rotation pattern, in which each household appears in the CPS up to eight
times denoted by their month in sample (MIS) value, one can link individuals who participate in the
March Basic Monthly CPS and the ASEC to up to three months prior (December, January, February) and
up to three months after (April, May, June) (see Table 1).6 In theory 25% of the December/June Basic
Monthly CPS will link to March (respondents in MIS 1, 5 for December of the previous year, respondents
in MIS 4, 8 for June of the current year); 50% of the January/May Basic Monthly CPS will link to March
(respondents in MIS 1, 2, 5, 6 for January of the current year, respondents in MIS 3, 4, 7, 8 for May of the
current year); 75% of the February/April Basic Monthly CPS will link to March (respondents in MIS 1, 2,
3, 5, 6, 7 for February of the current year, respondents in MIS 2, 3, 4, 6, 7, 8 for April of the current year).
5 Prior to 1994, Census released very few variables for linking surveys. Despite trying to avoid matching March Basic Monthly CPS and ASEC observations on AGE, SEX, and RACE, we used these variables to uniquely identify and match records between 1989 and 1993. 6 We do not consider oversample cases here because we have been unable to locate documentation for linking oversample members to their respective Basic Monthly CPS observations.

14
In practice, however, mobility, mortality, births, and non-response are major issues for the CPS, resulting
in actual linkage rates that are lower than possible linkage rates.
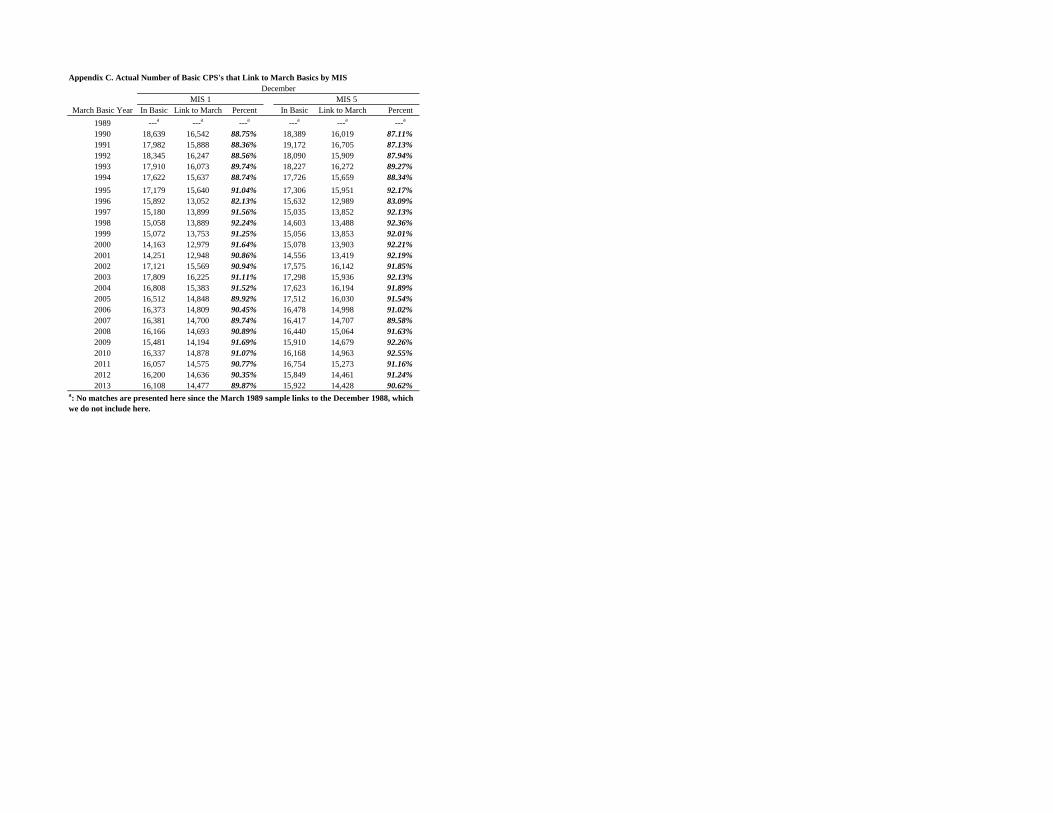
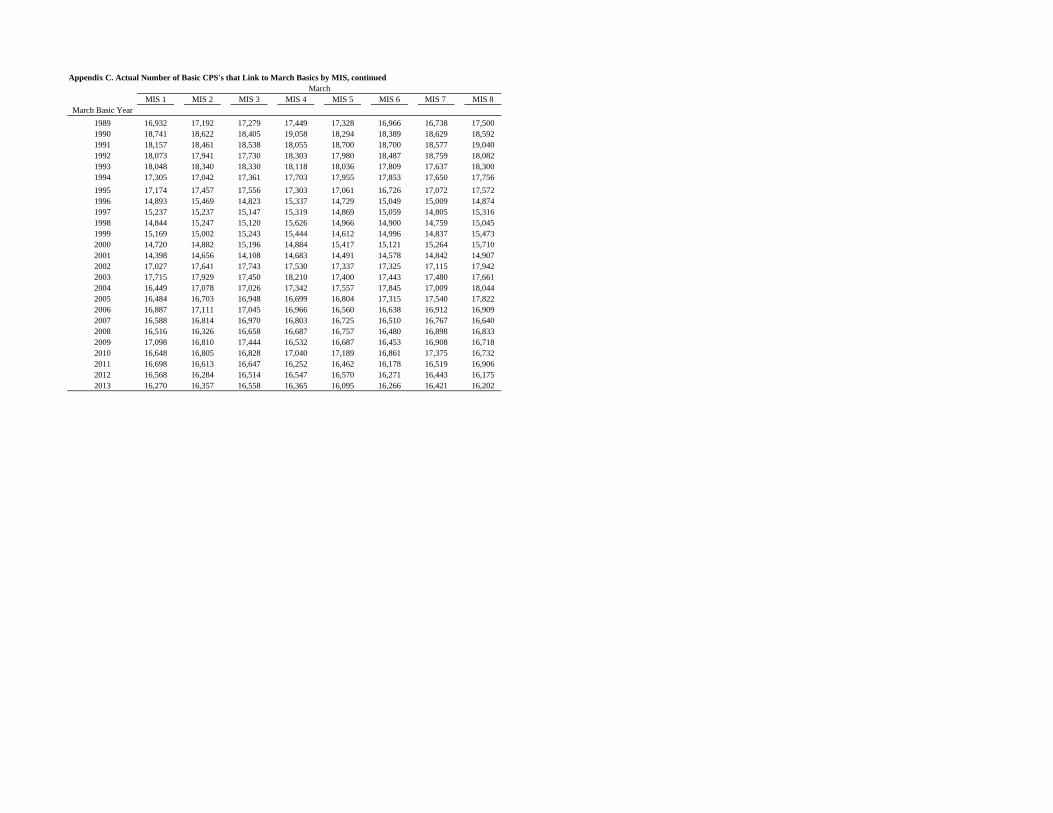
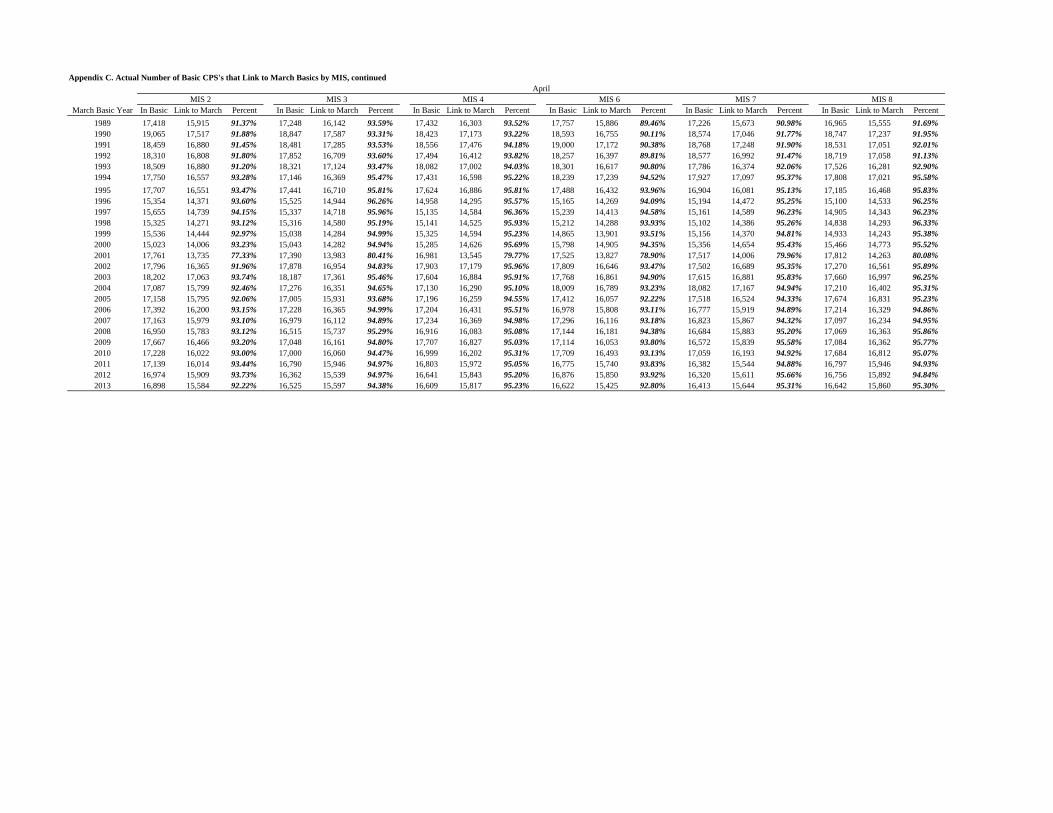
Appendix C shows the actual number of linkages between December of year x to June of year
x+1 to the ASEC in year x+1 for all years between 1989 and 2013. Linkage rates to the ASEC are
consistently high; as expected, we also see that that the months furthest from March (December, June)
have the lowest percentage of actual links (around 90% of the potential links) while the months adjacent
to March (February, April) have the highest percentages (most commonly around 95%).[6] The
percentage of links for April, May and June of 2001 are substantially lower than in other years (see
Appendix C). Note also that there are no links between the ASEC and the June Basic Monthly CPS in
1995; this is because the Census Bureau scrambled household identifiers to protect respondent
confidentiality due to changes in geography, making it impossible to use linking keys to match June, July
and August 1995 to surrounding months. This results in three different time frames for making individual
linkages over time: 1) May 1995 and prior, 2) June, July, and August 1995, 3) September 1995 forward.
As a result, June 1995 respondents are not linkable to the March 1995 sample [12].
Section 4a – Substantive Example #1: Child Tax Credit Receipt and Food Security
The link between food insecurity and low income in the United States has been widely
documented [13]. Using the CPS, a researcher could examine the relationship between receiving the Child
Tax Credit (CTC) and food security. The CTC reduces the amount of taxes families pay (depending on
adjusted gross income) by $1,000 dollars per qualifying child. This tax credit increases the disposable
annual income of low-income families, potentially reducing their food insecurity.
Answering this question using CPS requires linking ASEC and December Food Security files
since tax credit questions are only asked in the ASEC and food security is only assessed in the Food
Security Supplement. For illustration purposes, we link the 2005, 2006, 2007, and 2008 Food Security
Supplement respondents (from December) to their ASEC records in the following year (2006-2009). We

15
use CPSID to link the Food Security Supplement to the March Basic Monthly CPS and MARBASECID
to link March Basic Monthly CPS and ASEC observations (see Table 4). Only one quarter of December
Basic Monthly CPS respondents (those in MIS1 and 5) are eligible to be linked to the March Basic
Monthly CPS using CPSID (see Column 3 of Table 4). We match 90% of eligible observations between
the December and March Basic Monthly surveys (or 22% of the entire December Basic Monthly CPS
sample [see Table 4, Column 5]). The linkage rates are consistent with other observations four months
apart [6].
[Table 4 about here]
After linking December and March Basic Monthly CPS observations using CPSID, we use
MARBASECID to link to the March Basic Monthly CPS to the ASEC. The March Basic Monthly CPS to
ASEC linkage is perfect, but the number of records with both food security and tax responses is slightly
lower because the CTC variable is only available for persons 15 and older (Table 4, Column 7). The final
linked and eligible sample is about 15% of the December Basic Monthly CPS (Table 4, Column 8) and
about 62% of the total MIS 1 and 5 observations from the December Basic Monthly CPS (Table 4,
Column 9). Nonetheless, sample sizes for examining the relationship between CTC receipt and food
security are large in each of the four years (~20,000 respondents).7
One may also use CPS data to examine how the CTC has affected population food security over
time. This requires extending the December (MIS 1) to ASEC linkage (MIS 4) forward in time to include
the subsequent December (MIS 5) and ASEC (MIS 8) observations. For example, individuals from MIS 1
7 This very process of linking first the March and December Basic Monthly CPS files and then the December Basic Monthly file to the ASEC file was omitted in a recently published paper on poverty and food insecurity [14]. The authors draw on poverty data from the ASEC and food security data from the December Food Security supplement. Rather than make linkages between the ASEC and Food Security supplement, the authors impute poverty, which is available in the ASEC, for the sample of December respondents in their analysis for whom poverty is not available. Imputation allows the authors to retain more cases since they are not linking to the ASEC, though making the linkages to the ASEC would allow the authors to get exact rather than imputed measures of poverty. At the very least, using CPSID and MARBASECID, the authors could compare the imputed and actual poverty values for the linked sample.

16
in December 2005 are linked first to the 2006 March Basic Monthly CPS using CPSID (and then to the
2006 ASEC using MARBASECID); CPSID is then used again to link to December 2006 (when
respondents are MIS 5) and then to March 2007 (via CPSID and then to the 2007 ASEC via
MARBASECID). About 5% of respondents from each of the December Basic Monthly CPS surveys from
2005-2008, with both food security and child tax credit data in both years, may be linked in this way (see
Table 4, Column 11). Of those eligible (MIS 1 in December of a given year), about 70% are linked (see
Table 4, Column 12), and the resulting samples are sizeable (~7,000 observations for each year).
Section 4b – Substantive Example #2: Outgoing Rotation Groups and the ASEC
A popular set of employment questions have been asked only of the outgoing rotation groups
(ORG) from MIS 4 and 8 of each Basic Monthly Survey. This set of variables is commonly known as the
ORG questions or the Earner Study questions. Information is collected on topics such as usual hours
worked, hourly wage rate, usual weekly earnings, union membership, class of worker, and multiple job
holdings (hereafter referred to as the "earner study" questions). Earnings data from the earner study refer
to a usual week in the last month while the earnings data collected in the ASEC refer to the “past year”.
Given these differences, researchers may want to use these variables in combination with ASEC
variables. For example, any research question looking at unionization alongside taxes paid or poverty will
require the use of both the ORG and the ASEC. Using the earner study variables from the March Basic
Monthly CPS with the ASEC, researchers encounter a substantial reduction in observations—typically
about 20% of the March Basic Monthly CPS (see Table 5). This limitation may be overcome by linking
ASEC and ORG data from surrounding non-March months. By linking the ASEC to subsequent ORG
responses from the Basic Monthly CPS in April, May, and June, the number of cases is nearly
quadrupled, increasing the power for combining earnings from the ASEC with information about union
participation from the Basic Monthly CPS.

17
Because not all earner study variables are part of the ASEC file, at the very least using the full set
of earner study variables with the ASEC data requires linking the March Basic Monthly CPS with the
ASEC; MARBASECID drastically simplifies this effort. About 25% of March Basic Monthly CPS
respondents would have this weekly wage data available since only the outgoing rotations (MIS 5 and 8)
respond to the earner study questions. Using CPSID and extending the linkage of ORG data from
different months to the ASEC, researchers can easily increase their sample sizes. Table 5 shows for the
years 2005-2009 the number of cases in the March Basic, linkages to their ORG months, and the number
of cases with earnings data collected for individuals8 in ORGs. Researchers can leverage the power of the
short panel aspect of the CPS and use CPSID to link from March to April, May, and June and
MARBASECID to link from March to the ASEC; the resulting sample size for 2005 is 100,042 compared
to 26,503 if only ORG data from March are used (Table 5, Column 4). Larger sample sizes, for example,
allow for detailed subgroup analyses which would otherwise be limited.
Researchers may also make these kinds of linkages across years to get ASEC data combined with
earnings data from two points in time. The process just described would be performed for two points in
time, year x and year x+1. Year x and year x+1 are then linked together using CPSID. As Table 5 shows,
this is possible for just over one quarter of the March Basic Monthly CPS respondents (26% in 2005)9,
which is substantially higher than if we only linked individuals from MIS 4 of the 2005 March Basic
Monthly CPS to 2006, which would be 7% (or 9,548 individuals) of the 2005 March Basic Monthly CPS
sample (see Table 5, Column 7). Including individuals in the March Basic Monthly whose earnings data
come from April, May, or June increases the total sample size to 35,030 in 2005 (see Table 5, Column 6).
Patterns are similar for the 2006-2009 period.
[Table 5 about here]
8 Recall that only civilians age 15 and older who are currently employed as a wage or salaried worker respond to ORG questions. 9 Only half of the March Basic Monthly CPS respondents are linkable across years because individuals in MIS 5-8 in year x will not be in the CPS in year x+1.

18
The value of MARBASECID and CPSID is evident in recent research on unionization and
poverty published in the American Sociological Review [15]. The authors replicate a previous study using
the ASEC union status variable. The limitations of the analysis are acknowledged: “the CPS asks the
union membership question only for one-fourth of the sample (the two outgoing rotation groups). As a
result the CPS samples are much smaller” (p. 886). The substantial loss of observations the authors
lament could easily be overcome with MARBASECID and CPSID. Using MARBASECID to link the
March Basic Monthly CPS and the ASEC and then CPSID to link the ASEC to other monthly surveys,
the authors could have combined earnings from the ASEC with union membership information from
April, May, and June and retained a much larger number of observations (roughly four times as many).
Section 5 – Conclusion
Our objectives in this paper were threefold. First, we described the ASEC, its oversamples, and
the complexities of linking the ASEC to other CPS monthly data. Researchers who want to use the ASEC
with other CPS data must understand how the ASEC is different from other CPS monthly data and why
sample sizes in the ASEC are larger than in the Basic Monthly CPS. Second, we documented our methods
for linking the ASEC to the March Basic Monthly CPS, which is required to link the ASEC to any other
months of CPS data. Our description of the challenges associated with linking and our approach to this
work allows others to replicate our work. Third, we provided two possible research applications for
linking individuals in the AESC to surrounding months thereby illustrating some advantages of linking
the ASEC to other CPS Basic Monthly data. This kind of information is critical for researchers designing
new longitudinal analyses that incorporate the popular – and not available elsewhere in the CPS –
information from the ASEC on topics such as poverty, taxes, and detailed income.
With support from the National Institute for Child Health and Human Development, we are
developing integrated data, dissemination software, and associated metadata that will make combining
information from the ASEC and other CPS Basic Monthly files dramatically easier. The creation of

19
MARBASECID, which unlocks the vast research potential of longitudinal CPS data by facilitating the
inclusion of the ASEC, promises to serve the scientific community. MARBASECID and CPSID will both
be freely available exclusively via IPUMS-CPS, updated as new data become available and fully
documented for use by researchers around the world. These investments in data infrastructure eliminate
the need for each individual researcher to perform the tedious task of linking Basic Monthly CPS data to
ASEC data, reduces technical errors in linking, simplifies replication of existing studies, and encourages
researchers to rethink the possibilities of CPS data.
The changing and complex oversamples of the ASEC present serious obstacles for linking March
Basic Monthly CPS responses (and other months) to the ASEC. These barriers to use are real as
evidenced by the limited research linking ASEC to monthly CPS data and previous work documenting
how to link ASEC observations one year apart [1]. The opportunities are also rich as indicated by recent
work that uses ASEC data with other monthly data through imputation as opposed to direct linkages. The
availability of the ASEC as a part of a panel of linked CPS data dramatically magnifies the utility of
CPSID – the variable that links CPS monthly observations across time – since the ASEC is by far the
most widely used of CPS data.

20
Acknowledgments
We thank Camilo Bohorquez, Maggie Charleroy, Julia Drew, Marina Gorsuch, and Joe Grover for helpful feedback on earlier versions of this paper. We also thank Ben Klaas for developing software to link the ASEC to other CPS data. This study was supported by the Minnesota Population Center at the University of Minnesota (R24HD041023) and the Data Extract Builder of the American Time Use Survey (University of Maryland, R01HD053654; University of Minnesota, Z195701), both funded through grants from the Eunice Kennedy Shriver National Institute for Child Health and Human Development (NICHD).

21
References
[1] Madrian BC, Lefgren LJ. An approach to longitudinally matching Current Population Survey (CPS) respondents. Journal of Economic and Social Measurement. 2000 Jan 1;26(1):31-62.
[2] Feng S. The longitudinal matching of current population surveys: A proposed algorithm. Journal of Economic and Social Measurement. 2001 Jan 1;27(1, 2):71-91.
[3] Feng S. Longitudinal matching of recent current population surveys: Methods, non-matches and mismatches. Journal of Economic and Social Measurement. 2008 Jan 1;33(4):241-52.
[4] Katz A, Tenter K, Sidel P. Comparison of alternative ways of deriving panel data from the annual demographic files of the current population survey. Review of Public Data Use. 1984 Mar 1;12(1):35-44.
[5] Pitts A. Matching adjacent years of the Current Population Survey, Unpublished manuscript, Los Angeles, CA: Unicon Research Corporation; 1988.
[6] Drew JA, Flood S, Warren JR. Making full use of the longitudinal design of the Current Population Survey: Methods for linking records across 16 months. Journal of economic and social measurement. 2014;39(3):121.
[7] U.S. Census Bureau, 2010. Annual Social and Economic (ASEC) Supplement. Technical Documentation. Washington, D.C.: U.S. Department of Labor, Bureau of the Census.
[8] U.S. Bureau of Labor Statistics, 2006. Design and Methodology: Current Population Survey. Technical Paper 66. Washington, D.C.: U.S. Department of Labor, Bureau of the Census.
[9] U.S. Census Bureau, 1978. Annual Demographic File (March Supplement of Current Population Survey). Technical Documentation. Washington, D.C.: U.S. Department of Labor, Bureau of the Census.
[10] U.S. Bureau of Labor Statistics, 2002. Design and Methodology: Current Population Survey. Technical Paper 63RV. Washington, D.C.: U.S. Department of Labor, Bureau of the Census.
[11] U.S. Census Bureau. 2014. American Time Use Survey User’s Guide: Understanding ATUS 2003 to 2013. Technical Paper. Washington, D.C.: Bureau of the Census.
[12] U.S. Census Bureau. (1996). Appendix for March 1994. Retrieved from http://www.nber.org/morg/docs/usernote.asc
[13] Gundersen C, Ziliak JP. Childhood food insecurity in the US: Trends, causes, and policy options. The Future of Children. 2014;24(2):1-9.
[14] Wight V, Kaushal N, Waldfogel J, Garfinkel I. Understanding the link between poverty and food insecurity among children: Does the definition of poverty matter?. Journal of Children and Poverty. 2014 Jan 2;20(1):1-20.
[15] Brady D, Baker RS, Finnigan R. When Unionization Disappears State-Level Unionization and Working Poverty in the United States. American Sociological Review. 2013 Oct 1;78(5):872-96.
[16] U.S. Census Bureau. (2010). Analysis of Perturbed and Unperturbed Age Estimates: 2008. Retrieved from https://www.census.gov/cps/user_note_age_estimates.html

Table 1. CPS Rotation Pattern
Jan Feb Mar Apr May Jun Jul Aug Sep Oct Nov Dec Jan Feb Mar Apr
MiS 1 JanX FebX MarX AprX MayX JunX JulX AugX SepX OctX NovX DecX JanX+1 FebX+1 MarX+1 AprX+1
MiS 2 DecX-1 JanX FebX MarX AprX MayX JunX JulX AugX SepX OctX NovX DecX JanX+1 FebX+1 MarX+1
MiS 3 NovX-1 DecX-1 JanX FebX MarX AprX MayX JunX JulX AugX SepX OctX NovX DecX JanX+1 FebX+1
MiS 4 OctX-1 NovX-1 DecX-1 JanX FebX MarX AprX MayX JunX JulX AugX SepX OctX NovX DecX JanX+1
MiS 5 JanX-1 FebX-1 MarX-1 AprX-1 MayX-1 JunX-1 JulX-1 AugX-1 SepX-1 OctX-1 NovX-1 DecX-1 JanX FebX MarX AprX
MiS 6 DecX-2 JanX-1 FebX-1 MarX-1 AprX-1 MayX-1 JunX-1 JulX-1 AugX-1 SepX-1 OctX-1 NovX-1 DecX-1 JanX FebX MarX
MiS 7 NovX-2 DecX-2 JanX-1 FebX-1 MarX-1 AprX-1 MayX-1 JunX-1 JulX-1 AugX-1 SepX-1 OctX-1 NovX-1 DecX-1 JanX FebX
MiS 8 OctX-2 NovX-2 DecX-2 JanX-1 FebX-1 MarX-1 AprX-1 MayX-1 JunX-1 JulX-1 AugX-1 SepX-1 OctX-1 NovX-1 DecX-1 JanX
Note: Table reports the month and year in which respondents began the CPS, separately by calendar month and survey month-in-sample. For example, "OcX-2" in the bottom left cell means that respondents in month-in-sample 8 in January of Year X first entered the CPS in October of Year X-2.
Year X Year X+1

Table 2. Administering the ASEC to Oversamples Over Time.
ASEC Sample Includes:Month ASEC Administered
1947-1955
1956-1975
1976-2000
2001-2003
2004-present
April Basic April x -- -- -- --March Basic March -- x x x x
"Hispanic Oversample"November
MIS 1 Februaryc -- -- x x xMIS 2 Marchc -- -- x x xMIS 3 Marchc -- -- x x xMIS 4 Marchc -- -- x x xMIS 5 Februaryc -- -- x x xMIS 6 Marchc -- -- x x xMIS 7 Marchc -- -- x x xMIS 8 Marchc -- -- x x x
Non-Hispanic a
November (MIS 6,7,8) Marchd -- -- -- x --August (MIS 8) Februaryd -- -- -- -- xSeptember (MIS 8) Februaryd -- -- -- -- xOctober (MIS 8) Aprild -- -- -- xFebruary (MIS 4, 8)b Februarye -- -- -- x xApril (MIS 1, 5) Aprile -- -- -- x x
aIncludes non-Hispanic non-Whites and non-Hispanic Whites with children 18 years or lessbThese cases are identified in November as MIS 1,5cThese dwellings are interviewed a 9th and 10th time which can be considered MIS 9 and MIS 10dThese dwellings are interviewed a 9th time which can be considered MIS 9eThese dwellings are part of the split-path supplement assignment.

Table 3. ASEC-March Basic Matches & Match Validation by Year, 1989-2013.Linking Period
1989-1993Additional Variables for Second Stage Merge: N/A
Sex Race Age1989 137,384 137,384 N/A 0 100.00 0 0 01990 148,730 148,730 N/A 0 100.00 0 0 01991 148,228 148,228 N/A 0 100.00 0 0 01992 145,355 145,355 N/A 0 100.00 0 0 01993 144,618 144,618 N/A 0 100.00 0 0 0
1994-1995a
Sex Race Age1994 140,625 140,079 546 0 100.00 115 95 2121995b 138,872 137,473 448 951 99.32 0 0 0
1996-2000a
Sex Race Age1996b 120,186 120,179 4 3 99.9975 3 3 31997 120,989 120,981 8 0 100.00 0 0 01998 120,507 120,504 3 0 100.00 0 0 01999 120,776 120,760 16 0 100.00 0 0 02000 121,194 121,149 45 0 100.00 0 0 0
2001-2004a
Sex Race Age2001b 116,663 116,585 78 0 100.00 10 213 5732002b 139,660 139,592 68 0 100.00 0 0 1282003b 141,288 141,220 68 0 100.00 0 0 39572004b 138,350 138,277 73 0 100.00 0 154 1832
2005-2013Additional Variables for Second Stage Merge: N/A
Sex Race Age2005 136,315 136,315 N/A 0 100.00 0 0 02006 135,028 135,028 N/A 0 100.00 0 0 02007 133,817 133,817 N/A 0 100.00 0 0 02008 133,155 133,155 N/A 0 100.00 0 0 02009b 134,650 134,650 N/A 0 100.00 0 0 62010 135,478 135,478 N/A 0 100.00 0 0 02011 132,275 132,275 N/A 0 100.00 0 0 02012 131,372 131,372 N/A 0 100.00 0 0 02013 130,534 130,534 N/A 0 100.00 0 0 0
aSee Appendix for details on second-stage merging.bSee Appendix for notes about non-matches.
First Stage Merge Variables: IPUMS (HRHHID, HRHHID2, LINENO) Census (H-IDNUM, H-IDNUM2, A-LINENO)
Unvalidated MatchesYear Persons 1st Stage Matches
2nd Stage Matches Non-Matches Match Rate
(Matches/Persons)
First Stage Merge Variables: IPUMS (HRHHID, HUHHNUM, STATECENSUS, LINENO) Census (H-IDNUM, H-HHNUM, GESTCEN, A-LINENO)Additional Variables for Second Stage Merge: IPUMS (AGE, SEX, RACE, NUMPREC, OCC) Census (PRTAGE, PESEX, PTDTRACE, HRNUMHOU, PEIO1OCD)
Year Persons 1st Stage Matches
2nd Stage Matches Non-Matches Match Rate
(Matches/Persons)Unvalidated Matches
First Stage Merge Variables: IPUMS (HRHHID, HUHHNUM, STATECENSUS, LINENO) Census (H-IDNUM, H-HHNUM, GESTCEN, A-LINENO)Additional Variables for Second Stage Merge: IPUMS (AGE, SEX, RACE, NUMPREC) Census (PRTAGE, PESEX, PTDTRACE, HRNUMHOU)
Year Persons 1st Stage Matches
2nd Stage Matches Non-Matches Match Rate
(Matches/Persons)Unvalidated Matches
First Stage Merge Variables: IPUMS (HRHHID, LINENO, AGE, SEX, RACE) Census (H-IDNUM, A-LINENO, A-AGE, A-SEX, A-RACE)
Year Persons 1st Stage Matches
2nd Stage Matches Non-Matches Match Rate
(Matches/Persons)Unvalidated Matches

Table 4. Linking the Food Security Supplement (December) to the Child Tax Credit (ASEC), 2005-2008.
(1) (2) (3) (4) (5) (6) (7) (8) (9)
# of Persons # Eligible to Link to March
% Eligible to Link to March (Col2/Col1)
% of Persons in December
Basic (Col4/Col1)
% of Persons Linked of
Those Eligible (Col4/Col2)
# of Linked Persons
% Linked of December
Basic(Col7/Col1)
% Linked of Eligible
(Col7/Col2)
December 2005 138,903 34,024 24.49% 29,807 21.46% 87.61% 21,091 15.18% 61.99%
December 2006 136,174 32,851 24.12% 29,407 21.60% 89.52% 20,324 14.93% 61.87%
December 2007 135,275 32,798 24.25% 29,757 22.00% 90.73% 20,455 15.12% 62.37%
December 2008 133,672 32,606 24.39% 28,873 21.60% 88.55% 19,975 14.94% 61.26%
Panel B: Linking Across Years
(10) (11) (12) (13) (14)
# of Persons in December of
year x
# Linked from December of
year x to March of year
x+2
% Linked from December of
year x to March of year
x+2 (Col11/Col10)
Dec MIS 1
Linked Obs / Dec MIS 1 Obs (Col
11/Col 13)
December 2005 138,903 7,213 5.19% 10,755 67.07%
December 2006 136,174 7,143 5.25% 10,398 68.70%
December 2007 135,275 7,081 5.23% 10,350 68.42%
December 2008 133,672 7,068 5.29% 9,948 71.05%1The corresponding linkage between the March Basic and ASEC is perfect. That is, all respondents from the March Basic are identified in the ASEC.2These numbers are conditional on having food security responses in the December Basic Monthly CPS and the Child Tax Credit question in the ASEC.
December to ASEC in year x and December to ASEC in year x+1
Panel A: Linking December to ASECDecember Basic Linked to March Basic1 Linked to ASEC who have FSS and CTC2

Table 5. Linking the ASEC to ORG observations from April, May, and June, 2005 - 2009.
(1) (2) (3) (4) (5) (6) (7)
March MIS
Month of MIS 4 or 8
Number of Cases in March Basic
Number Linked to MIS 4 and 8
Percentage Linked to March
(Col2/Col3)
Number Linked Cases with
Earnings Data
Percentage Linked with
Earnings Data (Col4/Col2)
Number Linked Cases with
Earnings Data
Percentage Linked with
Earnings Data (Col6/Col2)
2005MIS 4, 8 34,521 34,521 100.00% 26,503 76.77% 9,548 27.66%MIS 3, 7 April 34,488 33,090 95.95% 25,430 73.74% 8,818 25.57%MIS 2, 6 May 34,018 31,891 93.75% 24,640 72.43% 8,686 25.53%MIS 1, 5 June 33,288 30,314 91.07% 23,469 70.50% 7,978 23.97%
Total 136,315 129,816 95.23% 100,042 73.39% 35,030 25.70%2006MIS 4, 8 33,875 33,875 100.00% 26,116 77.10% 9,931 29.32%MIS 3, 7 April 33,957 32,760 96.47% 25,315 74.55% 9,546 28.11%MIS 2, 6 May 33,749 31,458 93.21% 24,476 72.52% 9,161 27.14%MIS 1, 5 June 33,447 30,229 90.38% 23,431 70.05% 8,740 26.13%
Total 135,028 128,322 95.03% 99,338 73.57% 37,378 27.68%2007MIS 4, 8 33,443 33,443 100.00% 25,940 77.56% 10,166 30.40%MIS 3, 7 April 33,737 32,603 96.64% 25,214 74.74% 9,579 28.39%MIS 2, 6 May 33,324 31,407 94.25% 24,337 73.03% 9,352 28.06%MIS 1, 5 June 33,313 30,537 91.67% 23,720 71.20% 8,953 26.88%
Total 133,817 127,990 95.65% 99,211 74.14% 38,050 28.43%2008MIS 4, 8 33,520 33,520 100.00% 26,135 77.97% 10,299 30.72%MIS 3, 7 April 33,556 32,446 96.69% 25,305 75.41% 9,897 29.49%MIS 2, 6 May 32,806 30,732 93.68% 24,086 73.42% 9,372 28.57%MIS 1, 5 June 33,273 30,521 91.73% 23,863 71.72% 9,207 27.67%
Total 133,155 127,219 95.54% 99,389 74.64% 38,775 29.12%2009MIS 4, 8 33,250 33,250 100.00% 26,049 78.34% 10,343 7.68%MIS 3, 7 April 34,352 33,189 96.61% 25,887 75.36% 10,020 7.44%MIS 2, 6 May 33,263 31,310 94.13% 24,591 73.93% 9,431 7.00%MIS 1, 5 June 33,785 31,227 92.43% 24,384 72.17% 9,185 6.82%
Total 134,650 128,976 95.79% 100,911 74.94% 38,979 28.95%
Linking Across YearsLinking Within a Year

000,000
050,000
100,000
150,000
200,000
250,000
1989 1991 1993 1995 1997 1999 2001 2003 2005 2007 2009 2011 2013
Num
ber
of R
ecor
ds
Survey Year
Figure 1. Comparing the Size of the March Basic Monthly Survey and the ASEC Oversample, 1989‐2013
ASEC Persons March Basic Persons ASEC Households March Basic Households
SCHIP Expansion

Appendix A - Match Validity
Match rates based on the algorithms we use are extremely high except in 1995 and 1996. We validate
matches from 1994 forward by comparing AGE, SEX, and RACE in the March Basic Monthly CPS to the
ASEC. As is evident in Appendix C, nearly all matches are validated. We document the problems we
encounter in years where we fail to match or match incorrectly. Due to duplicate IDs in the 1989-1993
period, we are required to use AGE, SEX, and RACE as part of our linking algorithm and thus cannot
validate on AGE, SEX, and RACE (but will validate on these variables by construction).
As evident in Table 3, the match rates based on the matching algorithms results in extremely high match
rates, with the exception of 1995 and 1996. The validity of these matches is confirmed with a rather
higher success rate based on age sex and race. This section provides potential explanations for invalid
matches.
1994
115 observations fail to match on sex, 95 on race and 212 on age. We found no documentation to explain
any of these failures. Our analysis shows that no observations fail to match on all three variables while
only 2 observations fail to match on both sex and race.
1995
951 records in the March Basic Monthly CPS cannot be linked to the ASEC. Despite trying to match
using various algorithms, IPUMS-CPS was unable to find links for these records. Furthermore, no Census
Bureau documentation is available on this issue. It is possible that these non-links are a result of the CPS
redesign that occurred in 1994.
1996
3 person records cannot be matched. No explanation has been uncovered.
2001
Several linked records do not match on age, sex, or race. No Census Bureau documentation on this issue
has been located. However, 2001 was a CPS redesign year, which may be an explanation.
2002
The 128 age non-matches are most likely due to age perturbation. In August 2002 "depending on the
demographic characteristics of all members of the household, ages of selected household members were
adjusted to increase confidentiality protection" [16]. Since the ASEC is typically released in September, it
is plausible and likely that these age non-matches are due to this perturbation issue.
2003
The 3,957 cases that do not match on age are a coding issue. That is, the ASEC topcodes at 85 while the
Basic topcodes at 80. Thus, in validating the matches, persons ages 81-85 in the ASEC will be assigned
the value of their actual age while their age in the Basic will be topcoded.
2004
The 1,832 age non-matches are also top code issues. Similarly, the 154 non-match cases on race are also a
coding issue. The Basic Monthly CPS codes "3 or more races" while the ASEC actually lists out the three
races.
2009
The 6 observations that do not match on age are most likely an age perturbation issue.

Appendix B - Details of Merging
The merging of the 1994 March Basic Monthly CPS to ASEC file requires three manual corrections in
order to match correctly. These changes are apparent upon visual inspection. First, a correction is needed
for the HUHHNUM of one three households. In 1994, a unique household in the Basic can be identified
by the HRHHID and HRHHID2 while in the ASEC it can be identified by its H-seq number. As is
apparent in the figure below, there are three distinct households with the same HRHHID. The problem
when it comes to linking is that only HUHHNUM is common to both files and all are equal to 1 (resulting
in duplicate records based on HRHHID and HUHHNUM). Visual inspection makes it clear that the
households from the Basic with HRHHID2 63011 is identical to the ASEC household with HSEQ 12307.
Similarly, HRHHID2 63001 is identical to HSEQ 12306. For matching across the Basic Monthly CPS
and ASEC, we re-assign the HUHHNUM values for these households (2 and 3, respectively).
Another correction that must be made involves the following care. Looking closely at the data, it is
evident that the Basic observation with HRHHID2 63001 should be matched to the ASEC observation
with HSEQ 258.
hrhhid hrhhid2 huhhnum new huhhnum year mis numper pernum age sex raceBasic 880669103209 63021 1 1 1994 2 4 1 34 2 2Basic 880669103209 63021 1 1 1994 2 4 2 15 1 2Basic 880669103209 63021 1 1 1994 2 4 3 11 1 2Basic 880669103209 63021 1 1 1994 2 4 4 10 1 2Basic 880669103209 63011 1 2 1994 2 1 1 72 2 2Basic 880669103209 63001 1 3 1994 2 2 1 34 2 1Basic 880669103209 63001 1 3 1994 2 2 2 21 1 2
hrhhid hseq huhhnum new huhhnum year mis numper pernum age sex raceASEC 880669103209 12308 1 1 1994 2 4 1 34 2 2ASEC 880669103209 12308 1 1 1994 2 4 2 15 1 2ASEC 880669103209 12308 1 1 1994 2 4 3 11 1 2ASEC 880669103209 12308 1 1 1994 2 4 4 10 1 2ASEC 880669103209 12307 1 2 1994 2 1 1 72 2 2ASEC 880669103209 12306 1 3 1994 2 2 1 33 2 1ASEC 880669103209 12306 1 3 1994 2 2 2 33 1 2
hrhhid hrhhid2 huhhnum year mis numper pernum age sex educ race occBasic 160999430499 63021 1 1994 1 1 1 48 2 40 1 -1Basic 160999430499 63001 1 1994 1 1 1 48 2 40 1 20
hrhhid hseq huhhnum year mis numper pernum age sex educ race occASEC 160999430499 258 1 1994 1 1 1 48 2 40 1 20ASEC 160999430499 260 1 1994 1 1 1 48 2 40 1 0

A more complicated duplicate is below in which the records are identical save for HRHHID2. Leveraging
the longitudinal component of the survey to figure out the correct match, we locate the observations in
1995 March Basic Monthly CPS and the 1995 ASEC when both should have been in MIS 6 according to
the CPS rotation pattern. Only HRHHID2 63001 and HSEQ 13308 is in the 1995 March Basic Monthly
CPS and ASEC files, so we match and retain the records which also appear in 1995.
In 2003, we identify two problematic cases in the March Basic Monthly CPS. Consider the two 68 year
olds of the same sex, race, and education level (below). Using HRHHID2 from the March Basic Monthly
CPS, we see that the person who is age 48 is in the same household as the first 68 year old. Thus, we
match the first 68 year old in the ASEC (hseq=62477) to the 68 year old in HRHH ID2=76261 in the
Basic.
The next set of observations that is troublesome contains two people whose age does not match between
the Basic Monthly CPS and the ASEC. In order to match, we change the age for one of the observations.
Note that original values are maintained in the original files.
hrhhid hrhhid2 huhhnum year mis numper pernum age sex educ race occ marstBasic 930479150329 63001 1 1994 2 1 1 71 1 32 1 0 3Basic 930479150329 63011 1 1994 2 1 1 71 1 32 1 0 3
hrhhid h_seq huhhnum year mis numper pernum age sex educ race occ marstASEC 930479150329 13308 1 1994 2 1 1 71 1 32 1 0 3ASEC 930479150329 13309 1 1994 2 1 1 71 1 32 1 0 3
hrhhid hrhhid2 huhhnum year mis numper pernum age sex educ raceBasic 130962064655659 76261 1 2003 4 2 1 48 1 40 1Basic 130962064655659 76001 1 2003 4 2 1 78 1 36 1Basic 130962064655659 76261 1 2003 4 2 2 68 2 39 1Basic 130962064655659 76001 1 2003 4 2 2 68 2 39 1
hrhhid hseq huhhnum year mis numper pernum age sex educ raceASEC 130962064655659 62476 1 2003 4 2 1 78 1 36 1ASEC 130962064655659 62477 1 2003 4 2 1 48 1 40 1ASEC 130962064655659 62476 1 2003 4 2 2 68 2 39 1ASEC 130962064655659 62477 1 2003 4 2 2 68 2 39 1
hrhhid hrhhid2 year mis numper pernum age sex educ raceBasic 67843683692593 76261 2003 3 2 2 66 2 34 1
hrhhid huhhnum year mis numper pernum age sex educ raceASEC 67843683692593 1 2003 3 2 2 67 2 34 1

In 2004, we need only adjust the age of the following observation. Again, the original age values are
retained in the original files.
hrhhid hrhhid2 year mis numper pernum age sex educ raceBasic 263943067909060 76261 2004 6 1 1 80 1 34 1
hrhhid huhhnum year mis numper pernum age sex educ raceASEC 263943067909060 1 2004 6 1 1 85 1 34 1
Appendix C. Actual Number of Basic CPS's that Link to March Basics by MIS
March Basic Year In Basic Link to March Percent In Basic Link to March Percent1989 ---a ---a ---a ---a ---a ---a
1990 18,639 16,542 88.75% 18,389 16,019 87.11%1991 17,982 15,888 88.36% 19,172 16,705 87.13%1992 18,345 16,247 88.56% 18,090 15,909 87.94%1993 17,910 16,073 89.74% 18,227 16,272 89.27%1994 17,622 15,637 88.74% 17,726 15,659 88.34%1995 17,179 15,640 91.04% 17,306 15,951 92.17%1996 15,892 13,052 82.13% 15,632 12,989 83.09%1997 15,180 13,899 91.56% 15,035 13,852 92.13%1998 15,058 13,889 92.24% 14,603 13,488 92.36%1999 15,072 13,753 91.25% 15,056 13,853 92.01%2000 14,163 12,979 91.64% 15,078 13,903 92.21%2001 14,251 12,948 90.86% 14,556 13,419 92.19%2002 17,121 15,569 90.94% 17,575 16,142 91.85%2003 17,809 16,225 91.11% 17,298 15,936 92.13%2004 16,808 15,383 91.52% 17,623 16,194 91.89%2005 16,512 14,848 89.92% 17,512 16,030 91.54%2006 16,373 14,809 90.45% 16,478 14,998 91.02%2007 16,381 14,700 89.74% 16,417 14,707 89.58%2008 16,166 14,693 90.89% 16,440 15,064 91.63%2009 15,481 14,194 91.69% 15,910 14,679 92.26%2010 16,337 14,878 91.07% 16,168 14,963 92.55%2011 16,057 14,575 90.77% 16,754 15,273 91.16%2012 16,200 14,636 90.35% 15,849 14,461 91.24%2013 16,108 14,477 89.87% 15,922 14,428 90.62%
a: No matches are presented here since the March 1989 sample links to the December 1988, which we do not include here.
MIS 1 MIS 5December

Appendix C. Actual Number of Basic CPS's that Link to March Basics by MIS, continued
March Basic Year In Basic Link to March Percent In Basic Link to March Percent In Basic Link to March Percent In Basic Link to March Percent1989 17,086 15,543 90.97% 17,784 16,182 90.99% 16,851 15,013 89.09% 17,725 15,901 89.71%1990 18,080 16,439 90.92% 19,101 17,411 91.15% 18,403 16,521 89.77% 18,718 16,717 89.31%1991 18,505 16,743 90.48% 18,126 16,479 90.91% 18,476 16,423 88.89% 19,234 17,221 89.53%1992 17,492 15,953 91.20% 18,513 16,965 91.64% 18,735 16,751 89.41% 18,282 16,479 90.14%1993 18,020 16,546 91.82% 18,222 16,735 91.84% 17,520 15,877 90.62% 18,330 16,722 91.23%1994 16,863 15,652 92.82% 18,037 16,714 92.67% 17,582 16,378 93.15% 17,885 16,775 93.79%1995 17,560 16,278 92.70% 17,729 16,487 92.99% 17,135 15,846 92.48% 17,767 16,703 94.01%1996 14,517 13,445 92.62% 15,494 14,292 92.24% 14,795 13,806 93.32% 14,831 13,970 94.19%1997 14,975 14,067 93.94% 15,531 14,552 93.70% 14,636 13,731 93.82% 15,294 14,445 94.45%1998 14,918 13,920 93.31% 15,808 14,794 93.59% 14,592 13,734 94.12% 15,190 14,252 93.82%1999 14,941 13,905 93.07% 15,479 14,443 93.31% 14,676 13,737 93.60% 15,480 14,553 94.01%2000 14,807 13,824 93.36% 14,920 13,960 93.57% 15,161 14,086 92.91% 15,610 14,631 93.73%2001 13,882 12,792 92.15% 14,763 13,705 92.83% 14,845 13,716 92.39% 14,838 13,972 94.16%2002 17,552 16,368 93.25% 17,716 16,476 93.00% 16,882 15,758 93.34% 17,846 16,792 94.09%2003 17,128 15,950 93.12% 18,412 17,200 93.42% 17,275 16,250 94.07% 17,691 16,693 94.36%2004 16,647 15,497 93.09% 17,474 16,331 93.46% 16,901 15,785 93.40% 18,129 16,963 93.57%2005 16,710 15,437 92.38% 16,991 15,644 92.07% 17,449 16,120 92.38% 17,843 16,721 93.71%2006 16,747 15,448 92.24% 16,993 15,704 92.41% 16,866 15,469 91.72% 16,842 15,747 93.50%2007 16,657 15,323 91.99% 16,735 15,490 92.56% 16,626 15,307 92.07% 16,528 15,287 92.49%2008 16,407 15,177 92.50% 16,885 15,677 92.85% 16,571 15,506 93.57% 16,815 15,753 93.68%2009 16,942 15,799 93.25% 16,443 15,396 93.63% 16,791 15,702 93.51% 16,537 15,553 94.05%2010 16,375 15,331 93.62% 16,930 15,795 93.30% 17,057 15,975 93.66% 16,514 15,584 94.37%2011 16,494 15,248 92.45% 16,312 15,179 93.05% 16,434 15,258 92.84% 16,932 15,827 93.47%2012 16,139 14,970 92.76% 16,541 15,353 92.82% 16,439 15,121 91.98% 16,150 15,083 93.39%2013 16,290 15,007 92.12% 16,664 15,234 91.42% 16,344 15,117 92.49% 16,335 15,105 92.47%
MIS 6January
MIS 1 MIS 2 MIS 5

Appendix C. Actual Number of Basic CPS's that Link to March Basics by MIS, continued
March Basic Year In Basic Link to March Percent In Basic Link to March Percent In Basic Link to March Percent In Basic Link to March Percent In Basic Link to March Percent In Basic Link to March Percent1989 17,102 15,913 93.05% 17,488 16,287 93.13% 17,712 16,574 93.57% 17,033 15,379 90.29% 16,849 15,542 92.24% 17,758 16,358 92.12%1990 18,363 17,082 93.02% 18,374 17,156 93.37% 19,021 17,798 93.57% 18,238 16,690 91.51% 18,681 17,200 92.07% 18,730 17,133 91.47%1991 18,344 17,132 93.39% 18,834 17,532 93.09% 18,157 16,813 92.60% 18,599 17,066 91.76% 18,715 17,125 91.50% 19,177 17,623 91.90%1992 17,751 16,618 93.62% 17,873 16,761 93.78% 18,590 17,297 93.04% 18,538 17,009 91.75% 18,903 17,310 91.57% 18,258 16,836 92.21%1993 18,076 17,053 94.34% 18,445 17,419 94.44% 18,326 17,184 93.77% 17,692 16,427 92.85% 17,723 16,506 93.13% 18,492 17,239 93.22%1994 16,653 15,878 95.35% 17,417 16,617 95.41% 18,013 17,103 94.95% 17,806 16,879 94.79% 17,711 16,882 95.32% 17,907 17,134 95.68%1995 17,236 16,345 94.83% 17,804 16,988 95.42% 17,682 16,812 95.08% 16,584 15,858 95.62% 17,286 16,421 95.00% 17,704 16,997 96.01%1996 15,065 14,408 95.64% 14,915 14,168 94.99% 15,559 14,779 94.99% 14,765 14,159 95.90% 14,910 14,320 96.04% 14,871 14,336 96.40%1997 14,828 14,288 96.36% 15,262 14,596 95.64% 15,483 14,799 95.58% 14,744 14,209 96.37% 14,786 14,181 95.91% 15,342 14,794 96.43%1998 14,859 14,224 95.73% 15,195 14,475 95.26% 15,717 15,057 95.80% 14,725 14,066 95.52% 14,750 14,194 96.23% 15,175 14,513 95.64%1999 14,598 13,887 95.13% 15,358 14,598 95.05% 15,497 14,815 95.60% 14,755 14,124 95.72% 14,808 14,127 95.40% 15,410 14,780 95.91%2000 14,522 13,789 94.95% 15,199 14,482 95.28% 14,946 14,253 95.36% 14,931 14,215 95.20% 15,335 14,591 95.15% 15,724 15,034 95.61%2001 14,490 13,775 95.07% 14,249 13,494 94.70% 14,829 14,123 95.24% 14,498 13,768 94.96% 15,001 14,269 95.12% 14,893 14,326 96.19%2002 17,258 16,411 95.09% 17,858 17,071 95.59% 17,635 16,850 95.55% 17,137 16,379 95.58% 17,161 16,437 95.78% 17,892 17,213 96.21%2003 17,587 16,737 95.17% 17,522 16,695 95.28% 18,467 17,613 95.38% 17,255 16,519 95.73% 17,464 16,798 96.19% 17,627 16,997 96.43%2004 16,874 16,043 95.08% 17,148 16,345 95.32% 17,497 16,709 95.50% 17,871 16,913 94.64% 17,289 16,485 95.35% 18,282 17,471 95.56%2005 16,426 15,488 94.29% 17,147 16,174 94.33% 16,914 16,022 94.73% 17,240 16,297 94.53% 17,680 16,751 94.75% 17,803 17,100 96.05%2006 16,874 16,020 94.94% 17,127 16,276 95.03% 17,149 16,309 95.10% 16,669 15,669 94.00% 17,183 16,224 94.42% 16,880 16,220 96.09%2007 16,406 15,540 94.72% 17,091 16,110 94.26% 16,711 15,907 95.19% 16,474 15,374 93.32% 16,843 15,954 94.72% 16,657 15,847 95.14%2008 16,050 15,262 95.09% 16,777 15,898 94.76% 16,923 16,131 95.32% 16,425 15,564 94.76% 16,991 16,244 95.60% 16,923 16,238 95.95%2009 16,537 15,740 95.18% 17,623 16,755 95.07% 16,612 15,872 95.55% 16,309 15,617 95.76% 16,961 16,245 95.78% 16,671 16,049 96.27%2010 16,535 15,725 95.10% 16,906 16,128 95.40% 17,251 16,415 95.15% 16,780 15,991 95.30% 17,468 16,658 95.36% 16,689 16,033 96.07%2011 16,367 15,498 94.69% 16,797 15,890 94.60% 16,436 15,600 94.91% 16,095 15,216 94.54% 16,694 15,917 95.35% 16,922 16,172 95.57%2012 16,265 15,348 94.36% 16,749 15,866 94.73% 16,696 15,842 94.89% 16,092 15,278 94.94% 16,679 15,773 94.57% 16,233 15,474 95.32%2013 16,072 15,133 94.16% 16,643 15,729 94.51% 16,493 15,569 94.40% 15,983 15,214 95.19% 16,530 15,693 94.94% 16,217 15,474 95.42%
MIS 5MIS 1 MIS6February
MIS 7MIS 2 MIS 3
Appendix C. Actual Number of Basic CPS's that Link to March Basics by MIS, continued
MIS 1 MIS 2 MIS 3 MIS 4 MIS 5 MIS 6 MIS 7 MIS 8March Basic Year
1989 16,932 17,192 17,279 17,449 17,328 16,966 16,738 17,5001990 18,741 18,622 18,405 19,058 18,294 18,389 18,629 18,5921991 18,157 18,461 18,538 18,055 18,700 18,700 18,577 19,0401992 18,073 17,941 17,730 18,303 17,980 18,487 18,759 18,0821993 18,048 18,340 18,330 18,118 18,036 17,809 17,637 18,3001994 17,305 17,042 17,361 17,703 17,955 17,853 17,650 17,7561995 17,174 17,457 17,556 17,303 17,061 16,726 17,072 17,5721996 14,893 15,469 14,823 15,337 14,729 15,049 15,009 14,8741997 15,237 15,237 15,147 15,319 14,869 15,059 14,805 15,3161998 14,844 15,247 15,120 15,626 14,966 14,900 14,759 15,0451999 15,169 15,002 15,243 15,444 14,612 14,996 14,837 15,4732000 14,720 14,882 15,196 14,884 15,417 15,121 15,264 15,7102001 14,398 14,656 14,108 14,683 14,491 14,578 14,842 14,9072002 17,027 17,641 17,743 17,530 17,337 17,325 17,115 17,9422003 17,715 17,929 17,450 18,210 17,400 17,443 17,480 17,6612004 16,449 17,078 17,026 17,342 17,557 17,845 17,009 18,0442005 16,484 16,703 16,948 16,699 16,804 17,315 17,540 17,8222006 16,887 17,111 17,045 16,966 16,560 16,638 16,912 16,9092007 16,588 16,814 16,970 16,803 16,725 16,510 16,767 16,6402008 16,516 16,326 16,658 16,687 16,757 16,480 16,898 16,8332009 17,098 16,810 17,444 16,532 16,687 16,453 16,908 16,7182010 16,648 16,805 16,828 17,040 17,189 16,861 17,375 16,7322011 16,698 16,613 16,647 16,252 16,462 16,178 16,519 16,9062012 16,568 16,284 16,514 16,547 16,570 16,271 16,443 16,1752013 16,270 16,357 16,558 16,365 16,095 16,266 16,421 16,202
March
Appendix C. Actual Number of Basic CPS's that Link to March Basics by MIS, continued
March Basic Year In Basic Link to March Percent In Basic Link to March Percent In Basic Link to March Percent In Basic Link to March Percent In Basic Link to March Percent In Basic Link to March Percent1989 17,418 15,915 91.37% 17,248 16,142 93.59% 17,432 16,303 93.52% 17,757 15,886 89.46% 17,226 15,673 90.98% 16,965 15,555 91.69%1990 19,065 17,517 91.88% 18,847 17,587 93.31% 18,423 17,173 93.22% 18,593 16,755 90.11% 18,574 17,046 91.77% 18,747 17,237 91.95%1991 18,459 16,880 91.45% 18,481 17,285 93.53% 18,556 17,476 94.18% 19,000 17,172 90.38% 18,768 17,248 91.90% 18,531 17,051 92.01%1992 18,310 16,808 91.80% 17,852 16,709 93.60% 17,494 16,412 93.82% 18,257 16,397 89.81% 18,577 16,992 91.47% 18,719 17,058 91.13%1993 18,509 16,880 91.20% 18,321 17,124 93.47% 18,082 17,002 94.03% 18,301 16,617 90.80% 17,786 16,374 92.06% 17,526 16,281 92.90%1994 17,750 16,557 93.28% 17,146 16,369 95.47% 17,431 16,598 95.22% 18,239 17,239 94.52% 17,927 17,097 95.37% 17,808 17,021 95.58%1995 17,707 16,551 93.47% 17,441 16,710 95.81% 17,624 16,886 95.81% 17,488 16,432 93.96% 16,904 16,081 95.13% 17,185 16,468 95.83%1996 15,354 14,371 93.60% 15,525 14,944 96.26% 14,958 14,295 95.57% 15,165 14,269 94.09% 15,194 14,472 95.25% 15,100 14,533 96.25%1997 15,655 14,739 94.15% 15,337 14,718 95.96% 15,135 14,584 96.36% 15,239 14,413 94.58% 15,161 14,589 96.23% 14,905 14,343 96.23%1998 15,325 14,271 93.12% 15,316 14,580 95.19% 15,141 14,525 95.93% 15,212 14,288 93.93% 15,102 14,386 95.26% 14,838 14,293 96.33%1999 15,536 14,444 92.97% 15,038 14,284 94.99% 15,325 14,594 95.23% 14,865 13,901 93.51% 15,156 14,370 94.81% 14,933 14,243 95.38%2000 15,023 14,006 93.23% 15,043 14,282 94.94% 15,285 14,626 95.69% 15,798 14,905 94.35% 15,356 14,654 95.43% 15,466 14,773 95.52%2001 17,761 13,735 77.33% 17,390 13,983 80.41% 16,981 13,545 79.77% 17,525 13,827 78.90% 17,517 14,006 79.96% 17,812 14,263 80.08%2002 17,796 16,365 91.96% 17,878 16,954 94.83% 17,903 17,179 95.96% 17,809 16,646 93.47% 17,502 16,689 95.35% 17,270 16,561 95.89%2003 18,202 17,063 93.74% 18,187 17,361 95.46% 17,604 16,884 95.91% 17,768 16,861 94.90% 17,615 16,881 95.83% 17,660 16,997 96.25%2004 17,087 15,799 92.46% 17,276 16,351 94.65% 17,130 16,290 95.10% 18,009 16,789 93.23% 18,082 17,167 94.94% 17,210 16,402 95.31%2005 17,158 15,795 92.06% 17,005 15,931 93.68% 17,196 16,259 94.55% 17,412 16,057 92.22% 17,518 16,524 94.33% 17,674 16,831 95.23%2006 17,392 16,200 93.15% 17,228 16,365 94.99% 17,204 16,431 95.51% 16,978 15,808 93.11% 16,777 15,919 94.89% 17,214 16,329 94.86%2007 17,163 15,979 93.10% 16,979 16,112 94.89% 17,234 16,369 94.98% 17,296 16,116 93.18% 16,823 15,867 94.32% 17,097 16,234 94.95%2008 16,950 15,783 93.12% 16,515 15,737 95.29% 16,916 16,083 95.08% 17,144 16,181 94.38% 16,684 15,883 95.20% 17,069 16,363 95.86%2009 17,667 16,466 93.20% 17,048 16,161 94.80% 17,707 16,827 95.03% 17,114 16,053 93.80% 16,572 15,839 95.58% 17,084 16,362 95.77%2010 17,228 16,022 93.00% 17,000 16,060 94.47% 16,999 16,202 95.31% 17,709 16,493 93.13% 17,059 16,193 94.92% 17,684 16,812 95.07%2011 17,139 16,014 93.44% 16,790 15,946 94.97% 16,803 15,972 95.05% 16,775 15,740 93.83% 16,382 15,544 94.88% 16,797 15,946 94.93%2012 16,974 15,909 93.73% 16,362 15,539 94.97% 16,641 15,843 95.20% 16,876 15,850 93.92% 16,320 15,611 95.66% 16,756 15,892 94.84%2013 16,898 15,584 92.22% 16,525 15,597 94.38% 16,609 15,817 95.23% 16,622 15,425 92.80% 16,413 15,644 95.31% 16,642 15,860 95.30%
MIS 6 MIS 7 MIS 8April
MIS 2 MIS 3 MIS 4

Appendix C. Actual Number of Basic CPS's that Link to March Basics by MIS, continued
March Basic Year In Basic Link to March Percent In Basic Link to March Percent In Basic Link to March Percent In Basic Link to March Percent1989 17,303 15,484 89.49% 17,176 15,592 90.78% 17,745 15,565 87.71% 17,190 15,287 88.93%1990 19,031 17,150 90.12% 18,787 17,152 91.30% 18,629 16,412 88.10% 18,557 16,566 89.27%1991 18,342 16,364 89.22% 18,484 16,897 91.41% 18,979 16,707 88.03% 18,608 16,724 89.88%1992 18,361 16,410 89.37% 17,871 16,286 91.13% 18,416 16,143 87.66% 18,576 16,749 90.16%1993 18,402 16,404 89.14% 18,241 16,733 91.73% 18,276 16,227 88.79% 17,664 15,920 90.13%1994 17,790 16,145 90.75% 17,024 15,974 93.83% 18,259 16,877 92.43% 17,797 16,625 93.41%1995 17,751 16,203 91.28% 17,474 16,399 93.85% 17,425 16,050 92.11% 17,070 15,862 92.92%1996 15,261 13,875 90.92% 15,288 14,439 94.45% 15,114 13,830 91.50% 15,157 14,101 93.03%1997 15,658 14,350 91.65% 15,250 14,298 93.76% 15,287 14,042 91.86% 15,295 14,300 93.49%1998 15,411 13,975 90.68% 15,396 14,305 92.91% 15,382 14,021 91.15% 15,235 14,127 92.73%1999 15,598 14,171 90.85% 15,080 13,981 92.71% 14,928 13,612 91.18% 15,160 14,060 92.74%2000 15,076 13,704 90.90% 14,979 13,974 93.29% 15,721 14,519 92.35% 15,410 14,359 93.18%2001 14,878 13,453 90.42% 14,711 13,747 93.45% 14,778 13,557 91.74% 14,846 13,760 92.68%2002 17,868 15,920 89.10% 17,850 16,550 92.72% 17,738 16,168 91.15% 17,590 16,363 93.02%2003 18,339 16,667 90.88% 18,173 16,888 92.93% 17,778 16,417 92.34% 17,688 16,557 93.61%2004 17,174 15,389 89.61% 17,239 15,947 92.51% 18,070 16,406 90.79% 18,074 16,754 92.70%2005 17,240 15,382 89.22% 17,142 15,673 91.43% 17,472 15,716 89.95% 17,604 16,218 92.13%2006 17,350 15,664 90.28% 17,180 15,895 92.52% 16,949 15,347 90.55% 16,809 15,563 92.59%2007 17,280 15,585 90.19% 17,048 15,778 92.55% 17,422 15,766 90.49% 16,931 15,629 92.31%2008 17,059 15,413 90.35% 16,440 15,257 92.80% 17,268 15,830 91.67% 16,636 15,475 93.02%2009 17,821 16,167 90.72% 17,022 15,764 92.61% 17,197 15,708 91.34% 16,733 15,546 92.91%2010 17,191 15,565 90.54% 16,864 15,611 92.57% 17,595 16,084 91.41% 17,041 15,865 93.10%2011 17,202 15,711 91.33% 16,826 15,682 93.20% 16,763 15,454 92.19% 16,495 15,343 93.02%2012 16,904 15,428 91.27% 16,398 15,149 92.38% 16,887 15,480 91.67% 16,428 15,352 93.45%2013 16,970 15,172 89.40% 16,506 15,214 92.17% 16,648 15,046 90.38% 16,556 15,437 93.24%
MIS 3 MIS 4 MIS 7 MIS 8May

Appendix C. Actual Number of Basic CPS's that Link to March Basics by MIS, cont'd
March Basic Year In Basic Link to March Percent In Basic Link to March Percent1989 17,109 14,949 87.38% 17,602 15,127 85.94%1990 18,662 16,314 87.42% 18,398 15,775 85.74%1991 18,250 15,879 87.01% 18,750 16,140 86.08%1992 18,106 15,899 87.81% 18,302 15,565 85.05%1993 18,257 15,904 87.11% 18,090 15,860 87.67%1994 17,609 15,637 88.80% 18,014 16,343 90.72%1995 17,548 ---b ---b 17,329 ---b ---b
1996 15,160 13,486 88.96% 15,158 13,602 89.73%1997 15,616 14,049 89.97% 15,335 13,754 89.69%1998 15,309 13,669 89.29% 15,355 13,779 89.74%1999 15,551 13,863 89.15% 15,026 13,408 89.23%2000 14,933 13,248 88.72% 15,780 14,226 90.15%2001 17,653 12,979 73.52% 17,464 13,178 75.46%2002 17,859 15,566 87.16% 17,758 15,924 89.67%2003 18,209 16,301 89.52% 17,684 16,026 90.62%2004 17,084 14,923 87.35% 18,087 16,116 89.10%2005 17,271 14,993 86.81% 17,573 15,321 87.18%2006 17,303 15,191 87.79% 16,982 15,038 88.55%2007 17,241 15,180 88.05% 17,352 15,357 88.50%2008 16,998 15,021 88.37% 17,250 15,500 89.86%2009 17,745 15,792 88.99% 17,271 15,435 89.37%2010 17,049 15,130 88.74% 17,579 15,764 89.68%2011 16,974 15,138 89.18% 16,689 15,002 89.89%2012 16,933 15,040 88.82% 16,941 15,258 90.07%2013 16,762 14,662 87.47% 16,548 14,697 88.81%
b: Respondents in June, July and August 1995 are only linkable to each other. See User Note 1 (1994) for more information
MIS 8MIS 4June