Embed Size (px)
Citation preview
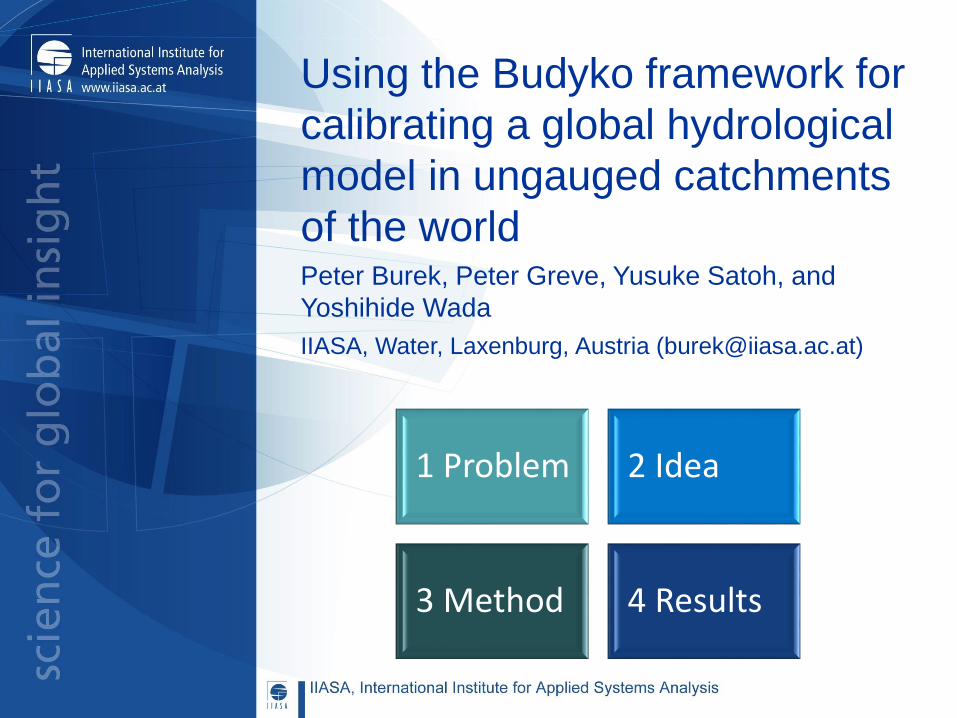
Using the Budyko framework for
calibrating a global hydrological
model in ungauged catchments
of the worldPeter Burek, Peter Greve, Yusuke Satoh, and
Yoshihide Wada
IIASA, Water, Laxenburg, Austria ([email protected])
1 Problem 2 Idea
3 Method 4 Results
2
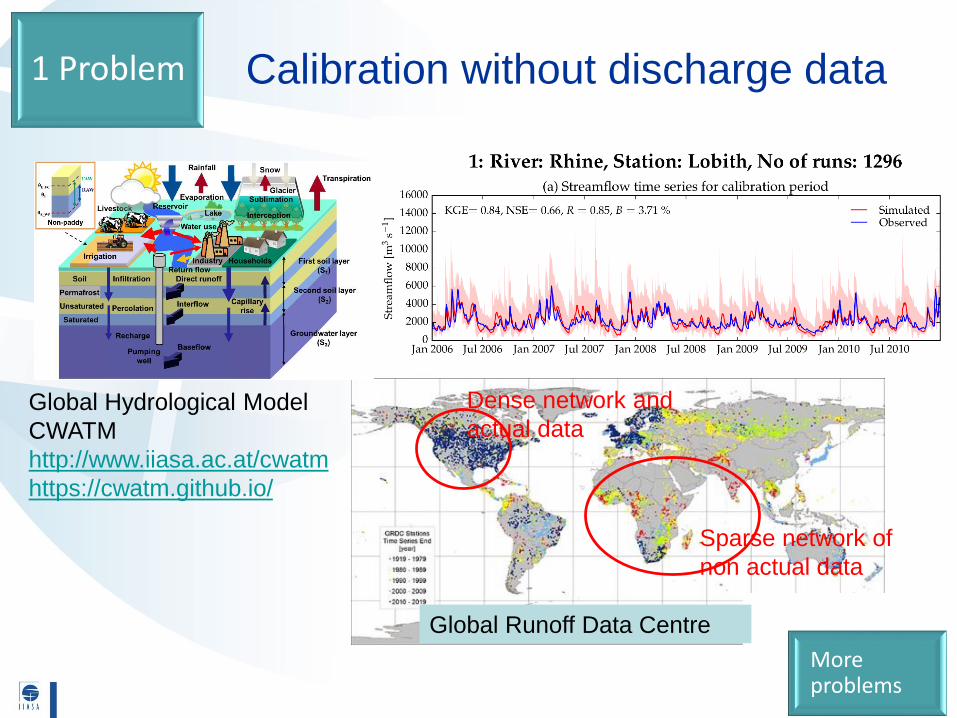
1 Problem Calibration without discharge data
Global Runoff Data Centre
Global Hydrological Model
CWATM
http://www.iiasa.ac.at/cwatm
https://cwatm.github.io/
Dense network and
actual data
Sparse network of
non actual data
More problems
3
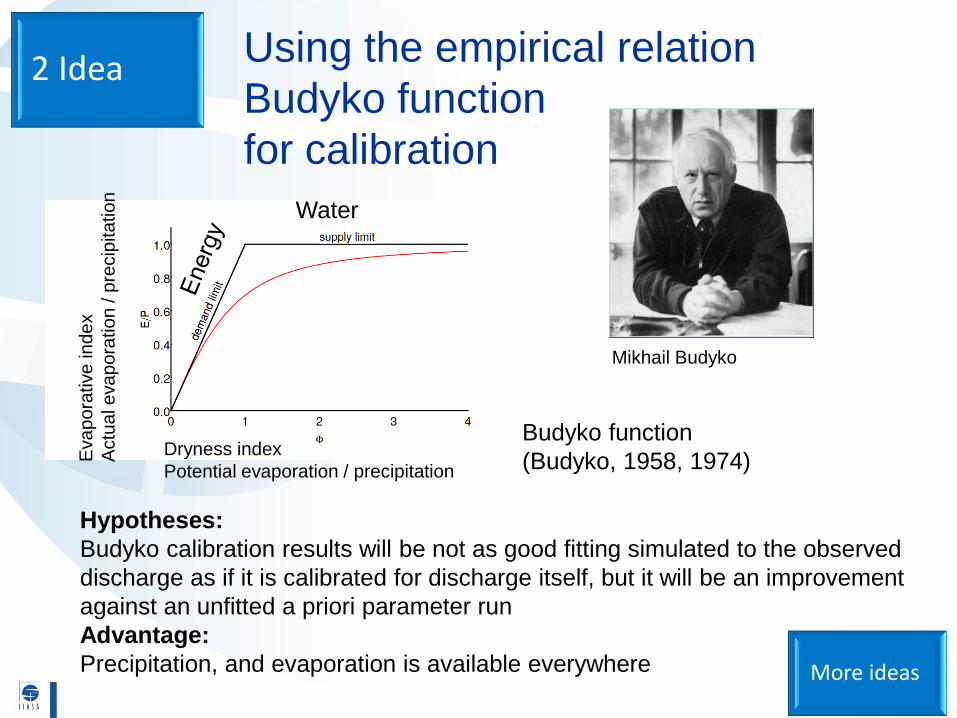
2 Idea
More ideas
Using the empirical relation
Budyko function
for calibration
Water
Dryness index
Potential evaporation / precipitation
Eva
po
rative
in
de
x
Actu
al evapora
tion / p
recip
itation
Hypotheses:
Budyko calibration results will be not as good fitting simulated to the observed
discharge as if it is calibrated for discharge itself, but it will be an improvement
against an unfitted a priori parameter run
Advantage:
Precipitation, and evaporation is available everywhere
Mikhail Budyko
Budyko function
(Budyko, 1958, 1974)
4
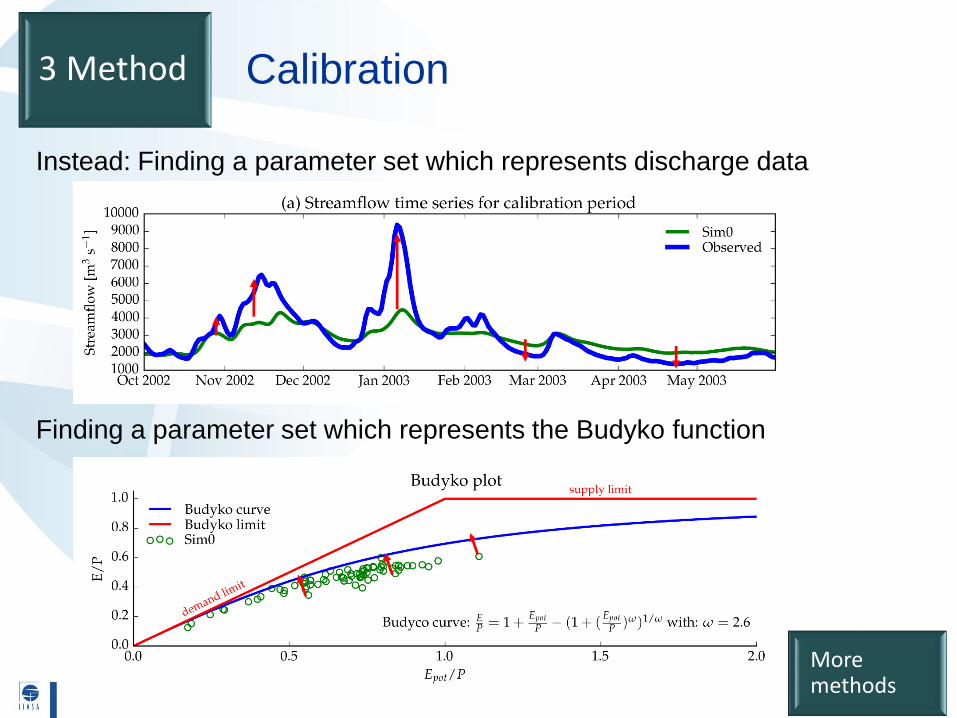
Calibration3 Method
Instead: Finding a parameter set which represents discharge data
Finding a parameter set which represents the Budyko function
More methods
5
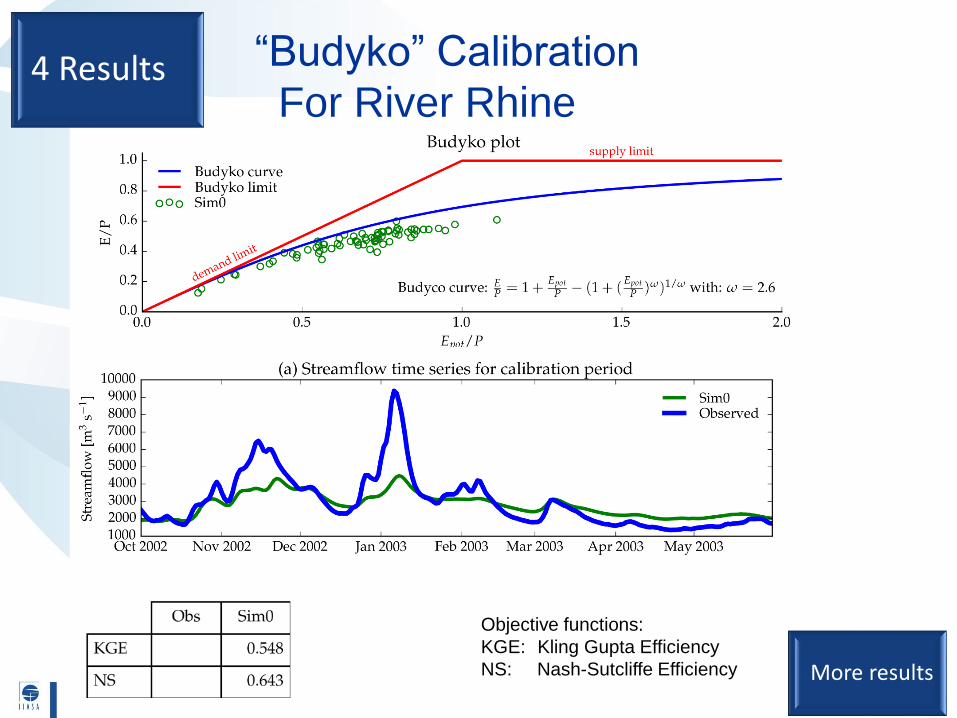
“Budyko” Calibration
For River Rhine4 Results
More results
Objective functions:
KGE: Kling Gupta Efficiency
NS: Nash-Sutcliffe Efficiency
6
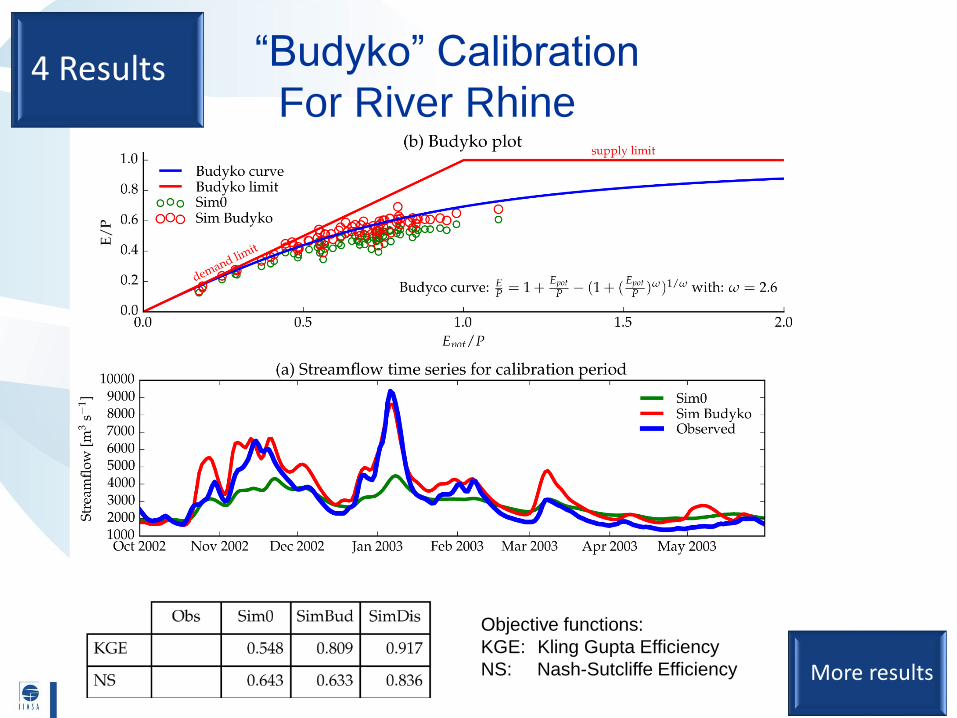
“Budyko” Calibration
For River Rhine4 Results
More results
Objective functions:
KGE: Kling Gupta Efficiency
NS: Nash-Sutcliffe Efficiency
7
Moreproblems
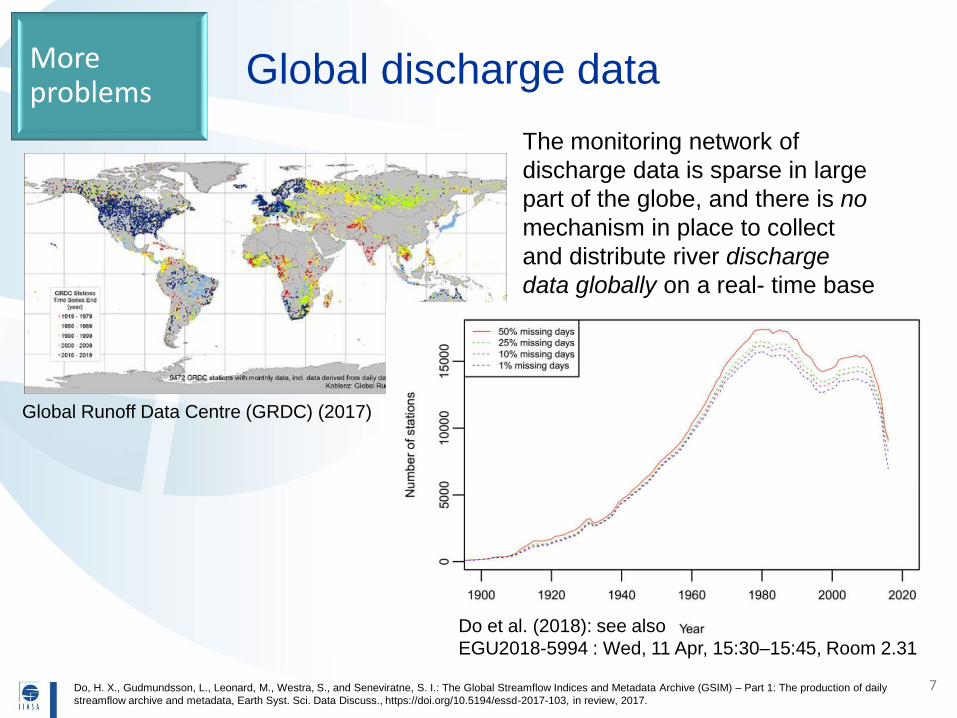
Do, H. X., Gudmundsson, L., Leonard, M., Westra, S., and Seneviratne, S. I.: The Global Streamflow Indices and Metadata Archive (GSIM) – Part 1: The production of daily
streamflow archive and metadata, Earth Syst. Sci. Data Discuss., https://doi.org/10.5194/essd-2017-103, in review, 2017.
Do et al. (2018): see also
EGU2018-5994 : Wed, 11 Apr, 15:30–15:45, Room 2.31
Global Runoff Data Centre (GRDC) (2017)
The monitoring network of
discharge data is sparse in large
part of the globe, and there is no
mechanism in place to collect
and distribute river discharge
data globally on a real- time base
Global discharge data
8
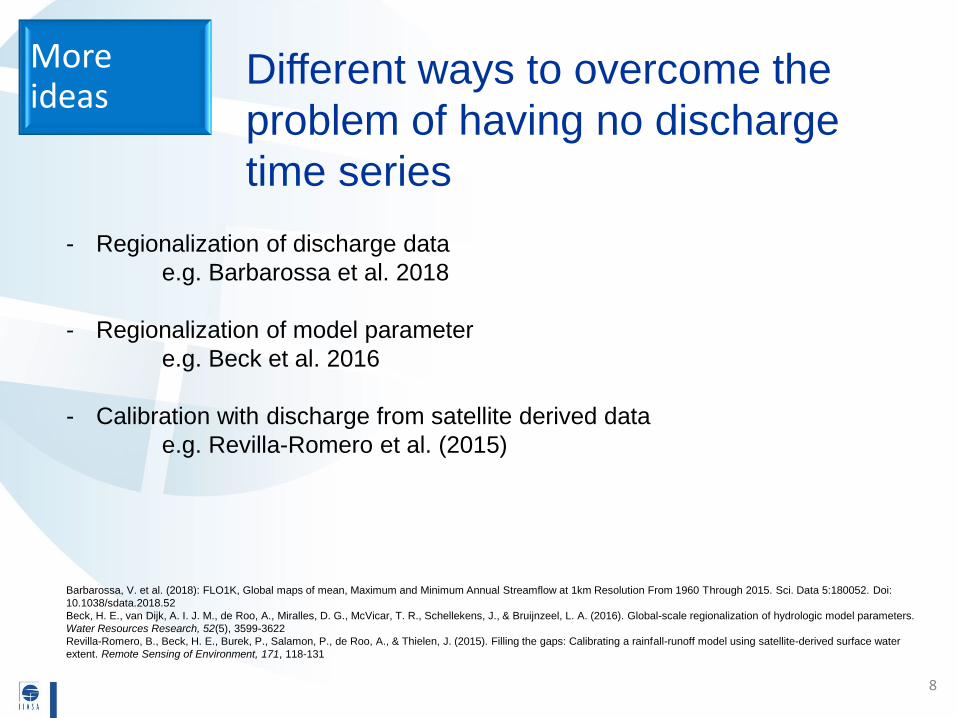
Moreideas
Different ways to overcome the
problem of having no discharge
time series
- Regionalization of discharge data
e.g. Barbarossa et al. 2018
- Regionalization of model parameter
e.g. Beck et al. 2016
- Calibration with discharge from satellite derived data
e.g. Revilla-Romero et al. (2015)
Barbarossa, V. et al. (2018): FLO1K, Global maps of mean, Maximum and Minimum Annual Streamflow at 1km Resolution From 1960 Through 2015. Sci. Data 5:180052. Doi:
10.1038/sdata.2018.52
Beck, H. E., van Dijk, A. I. J. M., de Roo, A., Miralles, D. G., McVicar, T. R., Schellekens, J., & Bruijnzeel, L. A. (2016). Global-scale regionalization of hydrologic model parameters.
Water Resources Research, 52(5), 3599-3622
Revilla-Romero, B., Beck, H. E., Burek, P., Salamon, P., de Roo, A., & Thielen, J. (2015). Filling the gaps: Calibrating a rainfall-runoff model using satellite-derived surface water
extent. Remote Sensing of Environment, 171, 118-131
9
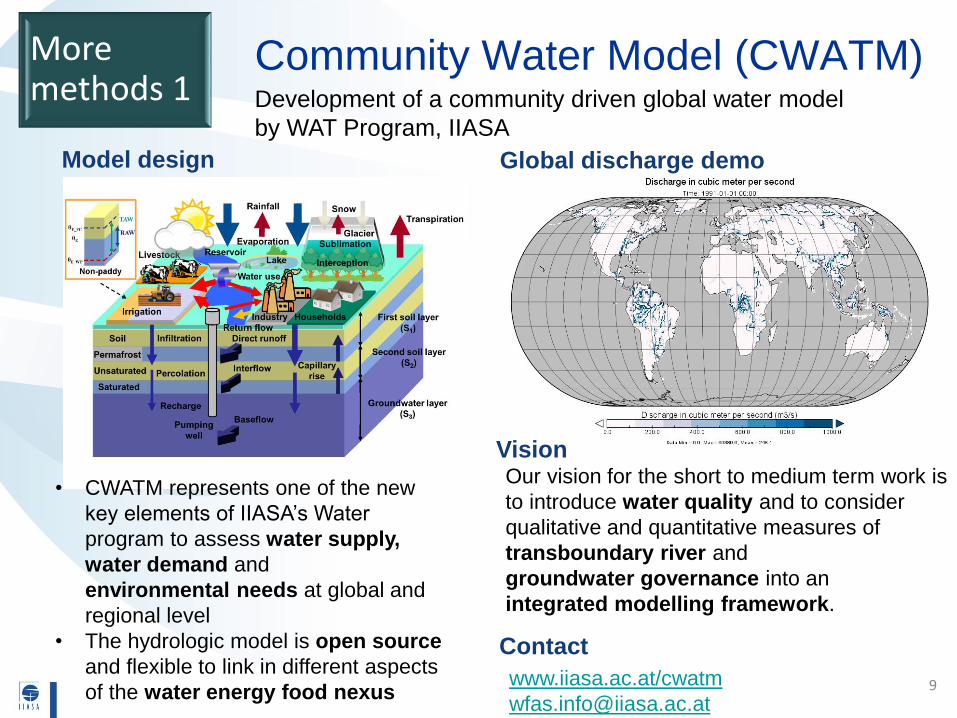
Community Water Model (CWATM)Development of a community driven global water model
by WAT Program, IIASA
• CWATM represents one of the new
key elements of IIASA’s Water
program to assess water supply,
water demand and
environmental needs at global and
regional level
• The hydrologic model is open source
and flexible to link in different aspects
of the water energy food nexus
Global discharge demoModel design
VisionOur vision for the short to medium term work is
to introduce water quality and to consider
qualitative and quantitative measures of
transboundary river and
groundwater governance into an
integrated modelling framework.
Contact
www.iiasa.ac.at/cwatm
Moremethods 1
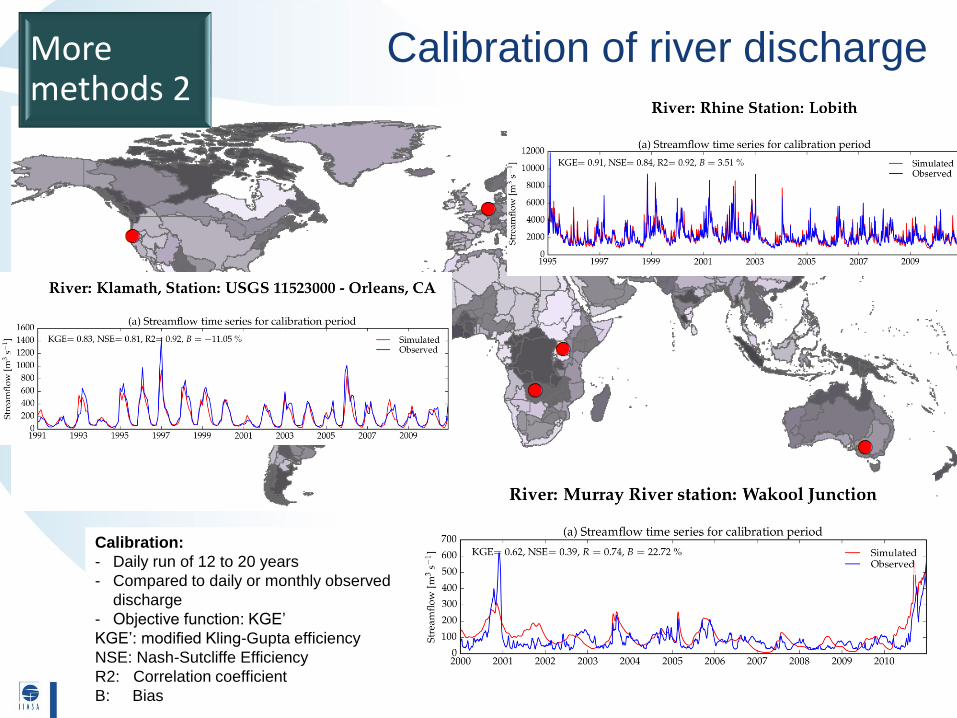
Calibration:
- Daily run of 12 to 20 years
- Compared to daily or monthly observed
discharge
- Objective function: KGE’
KGE’: modified Kling-Gupta efficiency
NSE: Nash-Sutcliffe Efficiency
R2: Correlation coefficient
B: Bias
Calibration of river dischargeMoremethods 2
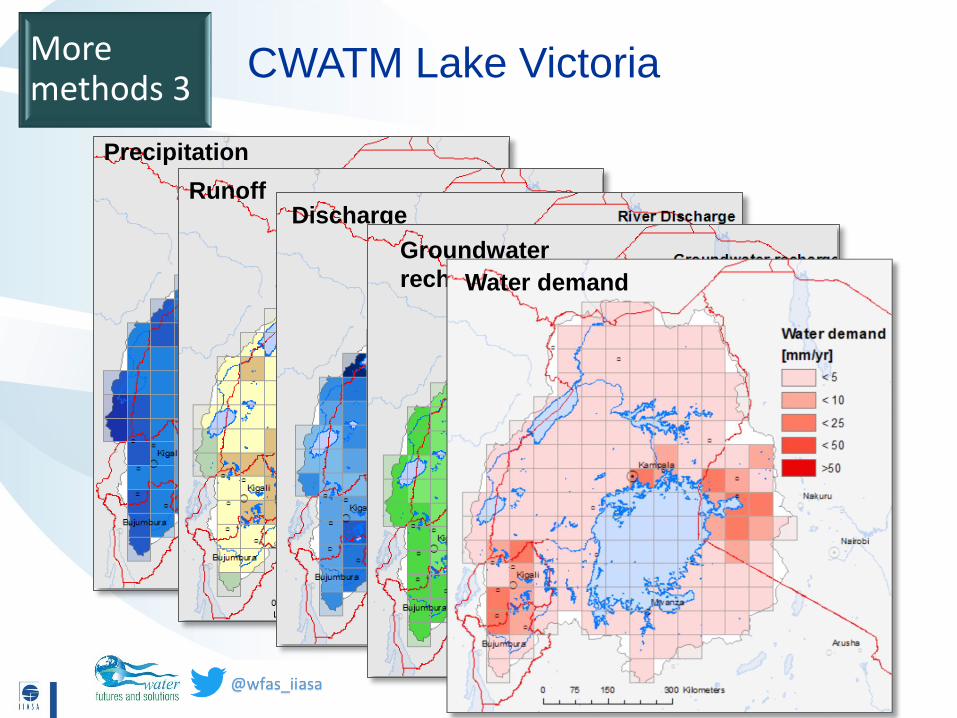
CWATM Lake Victoria
Precipitation
RunoffDischarge
Groundwater
rechargeWater demand
Moremethods 3
12
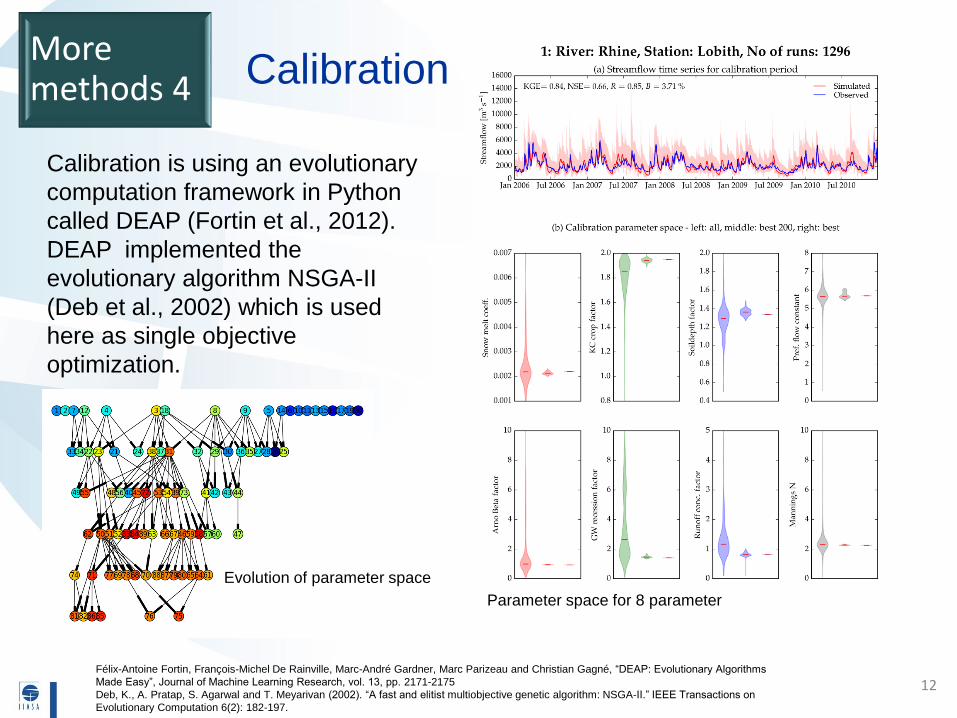
Calibration
Calibration is using an evolutionary
computation framework in Python
called DEAP (Fortin et al., 2012).
DEAP implemented the
evolutionary algorithm NSGA-II
(Deb et al., 2002) which is used
here as single objective
optimization.
Moremethods 4
Félix-Antoine Fortin, François-Michel De Rainville, Marc-André Gardner, Marc Parizeau and Christian Gagné, “DEAP: Evolutionary Algorithms
Made Easy”, Journal of Machine Learning Research, vol. 13, pp. 2171-2175
Deb, K., A. Pratap, S. Agarwal and T. Meyarivan (2002). “A fast and elitist multiobjective genetic algorithm: NSGA-II.” IEEE Transactions on
Evolutionary Computation 6(2): 182-197.
Evolution of parameter space
Parameter space for 8 parameter
13
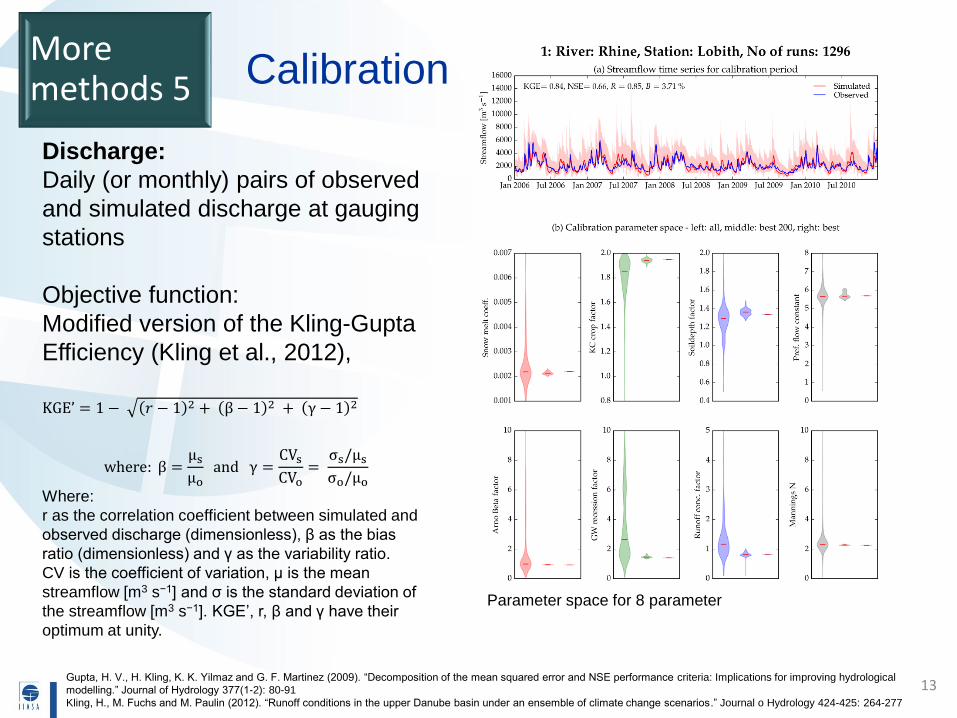
Calibration
Discharge:
Daily (or monthly) pairs of observed
and simulated discharge at gauging
stations
Objective function:
Modified version of the Kling-Gupta
Efficiency (Kling et al., 2012),
KGE’ = 1 − 𝑟 − 1 2 + β − 1 2 + γ − 1 2
where: β =μsμo
and γ =CVsCVo
=σs/μsσo/μo
Where:
r as the correlation coefficient between simulated and
observed discharge (dimensionless), β as the bias
ratio (dimensionless) and γ as the variability ratio.
CV is the coefficient of variation, μ is the mean
streamflow [m3 s−1] and σ is the standard deviation of
the streamflow [m3 s−1]. KGE’, r, β and γ have their
optimum at unity.
Moremethods 5
Gupta, H. V., H. Kling, K. K. Yilmaz and G. F. Martinez (2009). “Decomposition of the mean squared error and NSE performance criteria: Implications for improving hydrological
modelling.” Journal of Hydrology 377(1-2): 80-91
Kling, H., M. Fuchs and M. Paulin (2012). “Runoff conditions in the upper Danube basin under an ensemble of climate change scenarios.” Journal o Hydrology 424-425: 264-277
Parameter space for 8 parameter
14
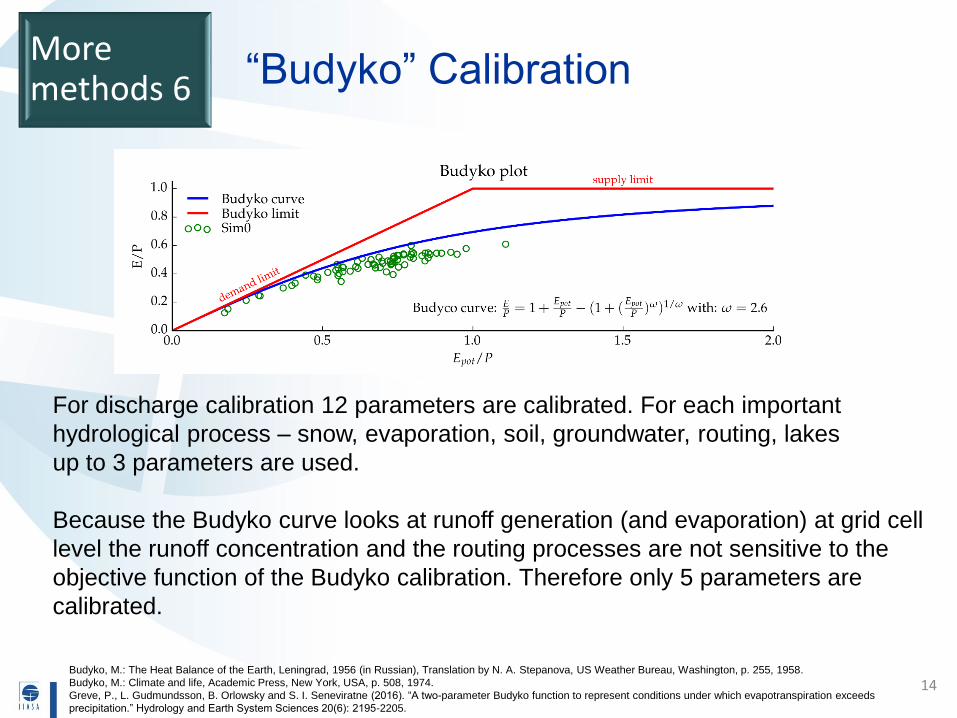
“Budyko” Calibration
For discharge calibration 12 parameters are calibrated. For each important
hydrological process – snow, evaporation, soil, groundwater, routing, lakes
up to 3 parameters are used.
Because the Budyko curve looks at runoff generation (and evaporation) at grid cell
level the runoff concentration and the routing processes are not sensitive to the
objective function of the Budyko calibration. Therefore only 5 parameters are
calibrated.
Moremethods 6
Budyko, M.: The Heat Balance of the Earth, Leningrad, 1956 (in Russian), Translation by N. A. Stepanova, US Weather Bureau, Washington, p. 255, 1958.
Budyko, M.: Climate and life, Academic Press, New York, USA, p. 508, 1974.
Greve, P., L. Gudmundsson, B. Orlowsky and S. I. Seneviratne (2016). “A two-parameter Budyko function to represent conditions under which evapotranspiration exceeds
precipitation.” Hydrology and Earth System Sciences 20(6): 2195-2205.
15
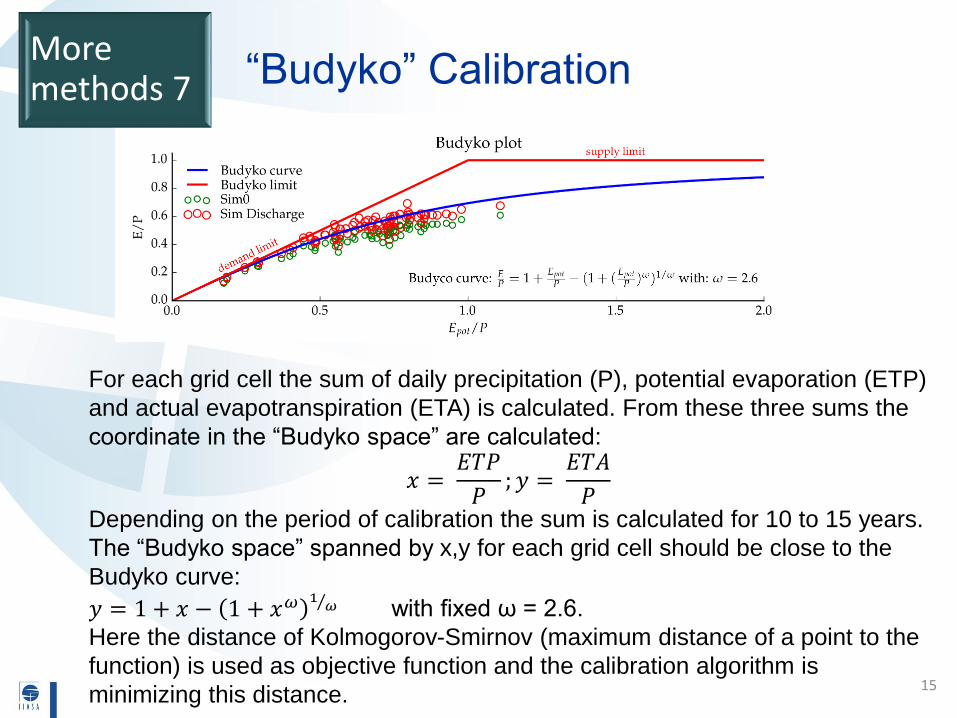
“Budyko” Calibration
For each grid cell the sum of daily precipitation (P), potential evaporation (ETP)
and actual evapotranspiration (ETA) is calculated. From these three sums the
coordinate in the “Budyko space” are calculated:
𝑥 =𝐸𝑇𝑃
𝑃; 𝑦 =
𝐸𝑇𝐴
𝑃Depending on the period of calibration the sum is calculated for 10 to 15 years.
The “Budyko space” spanned by x,y for each grid cell should be close to the
Budyko curve:
𝑦 = 1 + 𝑥 − 1 + 𝑥𝜔 1 𝜔 with fixed ω = 2.6.
Here the distance of Kolmogorov-Smirnov (maximum distance of a point to the
function) is used as objective function and the calibration algorithm is
minimizing this distance.
Moremethods 7
16
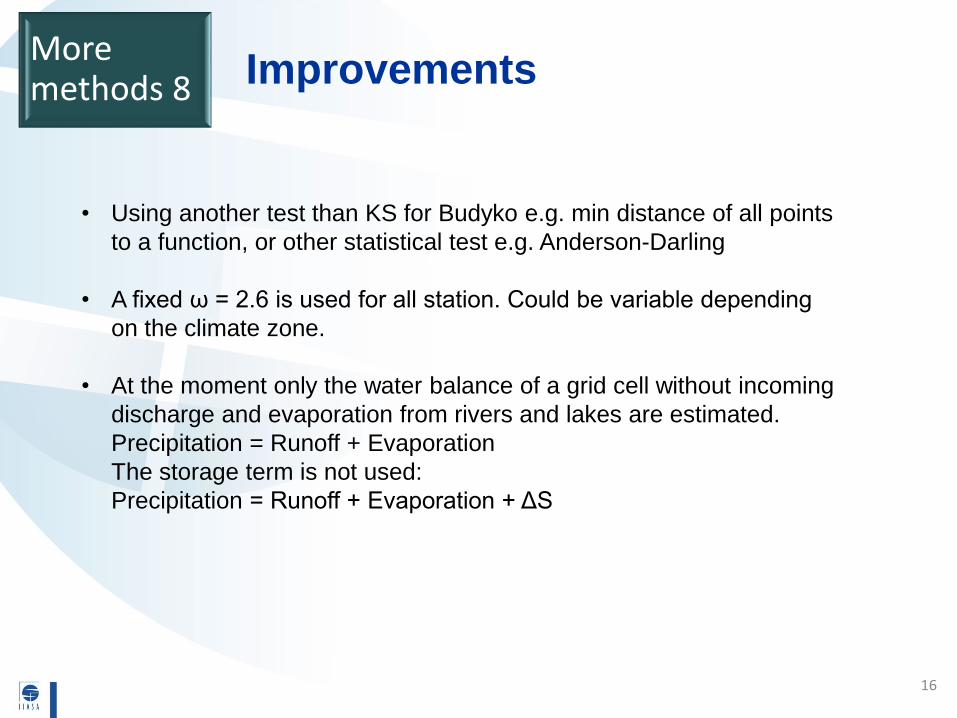
Improvements
• Using another test than KS for Budyko e.g. min distance of all points
to a function, or other statistical test e.g. Anderson-Darling
• A fixed ω = 2.6 is used for all station. Could be variable depending
on the climate zone.
• At the moment only the water balance of a grid cell without incoming
discharge and evaporation from rivers and lakes are estimated.
Precipitation = Runoff + Evaporation
The storage term is not used:
Precipitation = Runoff + Evaporation + ΔS
Moremethods 8
17
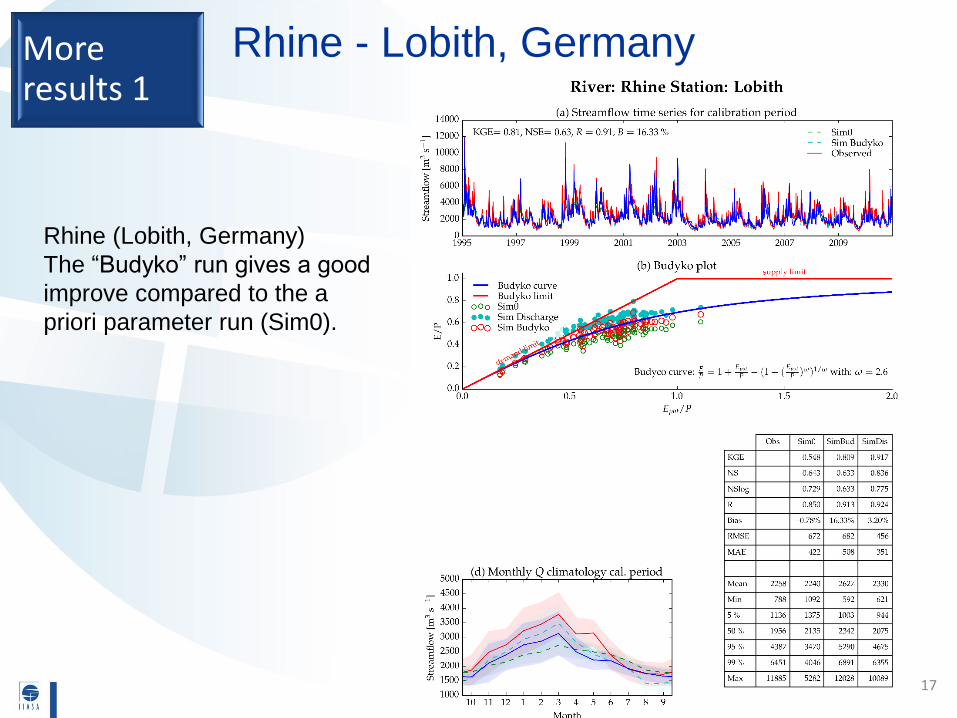
Rhine - Lobith, GermanyMore results 1
Rhine (Lobith, Germany)
The “Budyko” run gives a good
improve compared to the a
priori parameter run (Sim0).
18
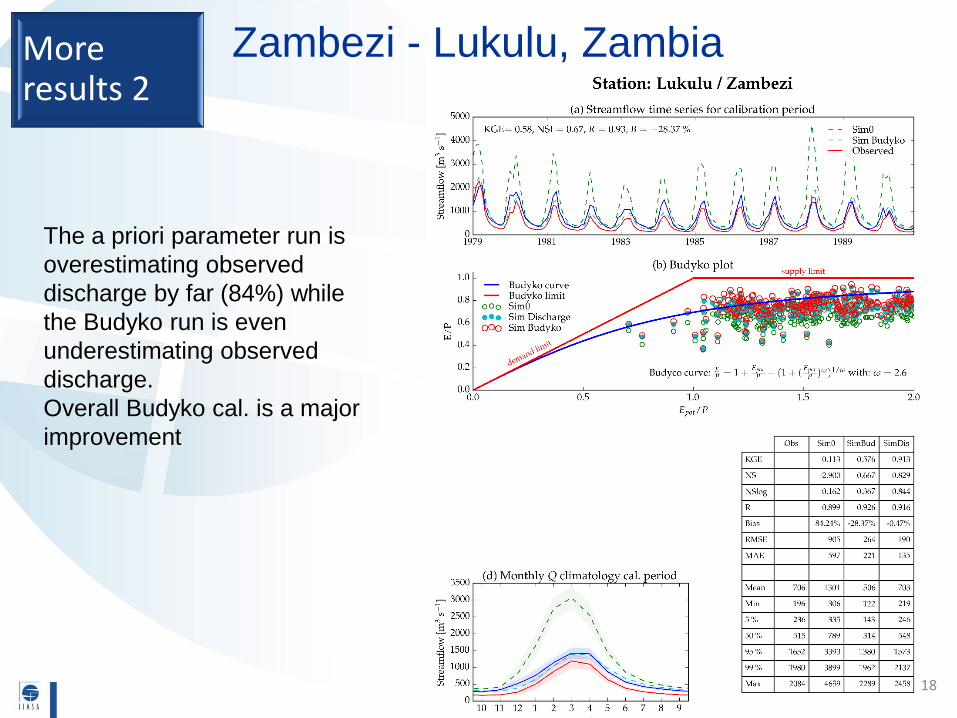
Zambezi - Lukulu, ZambiaMore results 2
The a priori parameter run is
overestimating observed
discharge by far (84%) while
the Budyko run is even
underestimating observed
discharge.
Overall Budyko cal. is a major
improvement
19
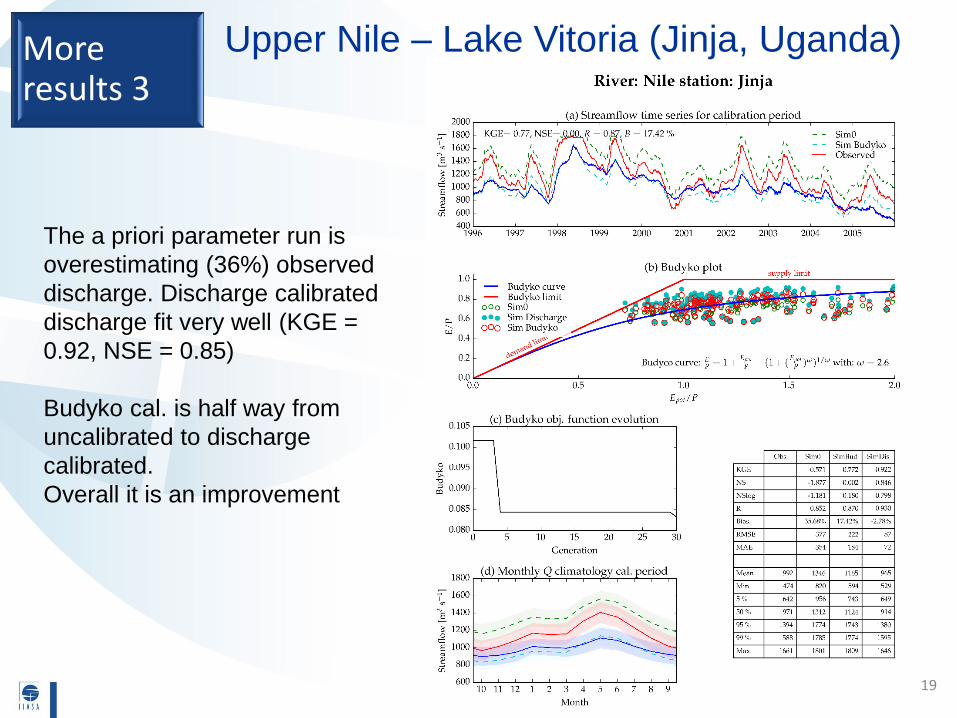
Upper Nile – Lake Vitoria (Jinja, Uganda)More results 3
The a priori parameter run is
overestimating (36%) observed
discharge. Discharge calibrated
discharge fit very well (KGE =
0.92, NSE = 0.85)
Budyko cal. is half way from
uncalibrated to discharge
calibrated.
Overall it is an improvement
20
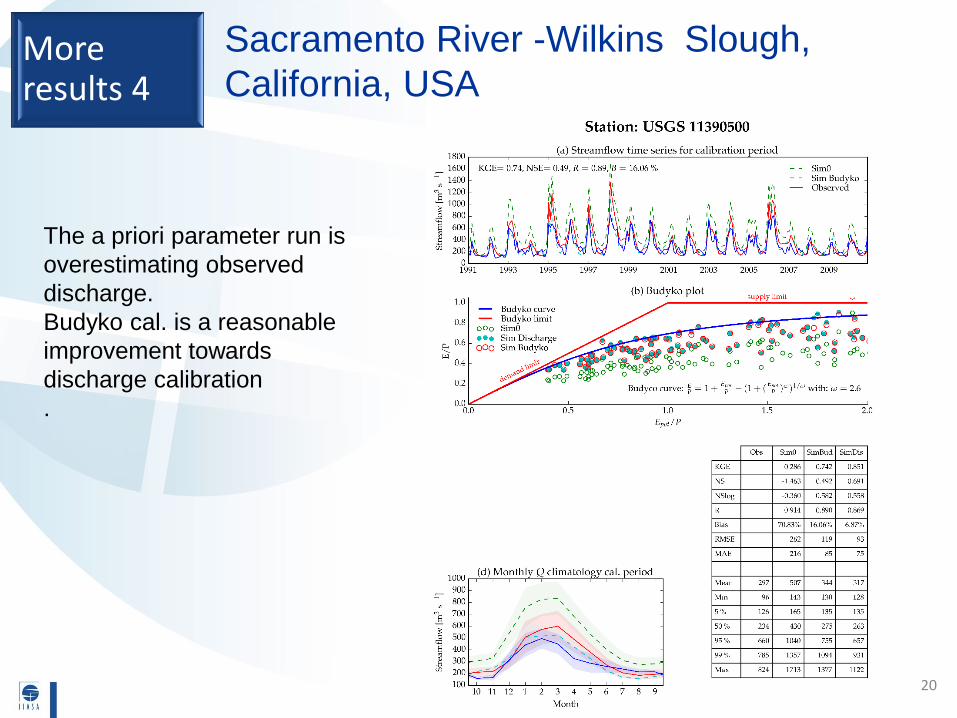
Sacramento River -Wilkins Slough,
California, USAMore results 4
The a priori parameter run is
overestimating observed
discharge.
Budyko cal. is a reasonable
improvement towards
discharge calibration
.
21
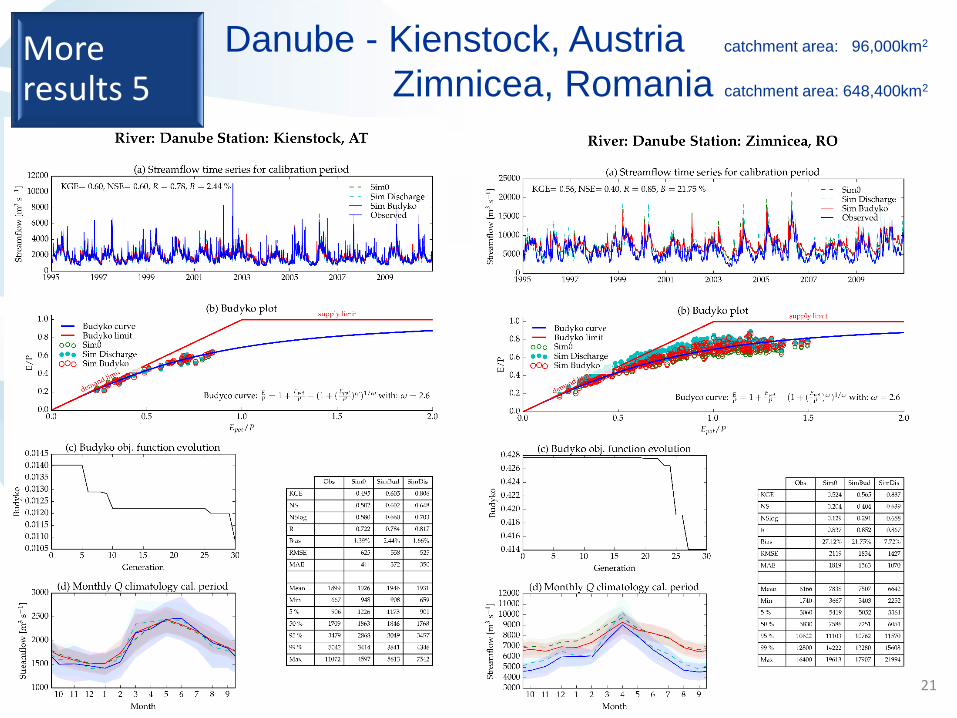
Danube - Kienstock, Austria catchment area: 96,000km2
Zimnicea, Romania catchment area: 648,400km2
More results 5
22
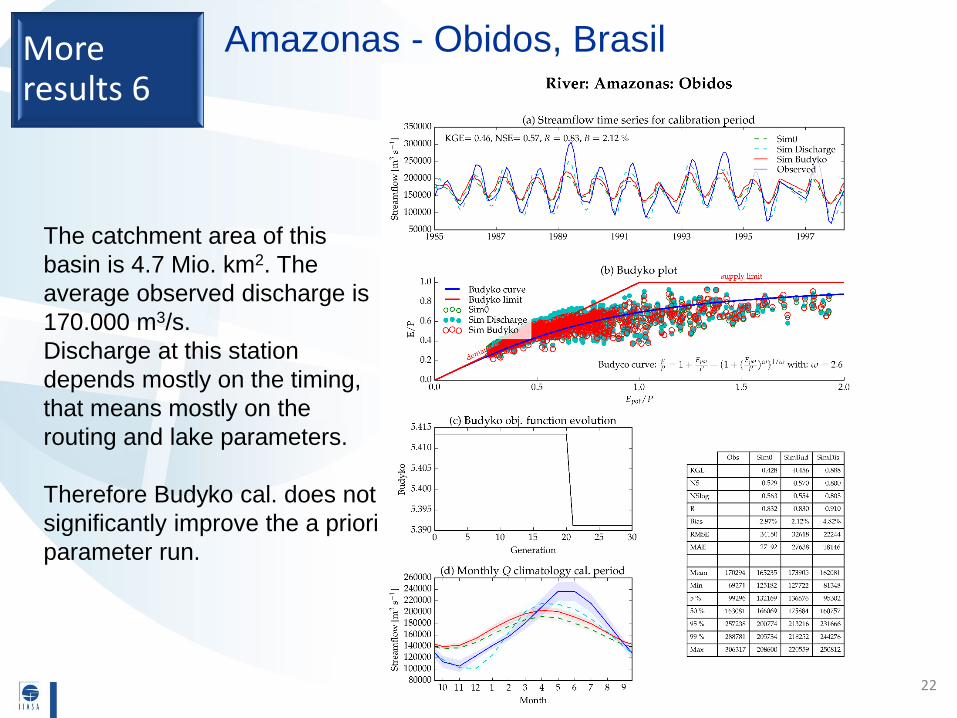
Amazonas - Obidos, BrasilMore results 6
The catchment area of this
basin is 4.7 Mio. km2. The
average observed discharge is
170.000 m3/s.
Discharge at this station
depends mostly on the timing,
that means mostly on the
routing and lake parameters.
Therefore Budyko cal. does not
significantly improve the a priori
parameter run.
23
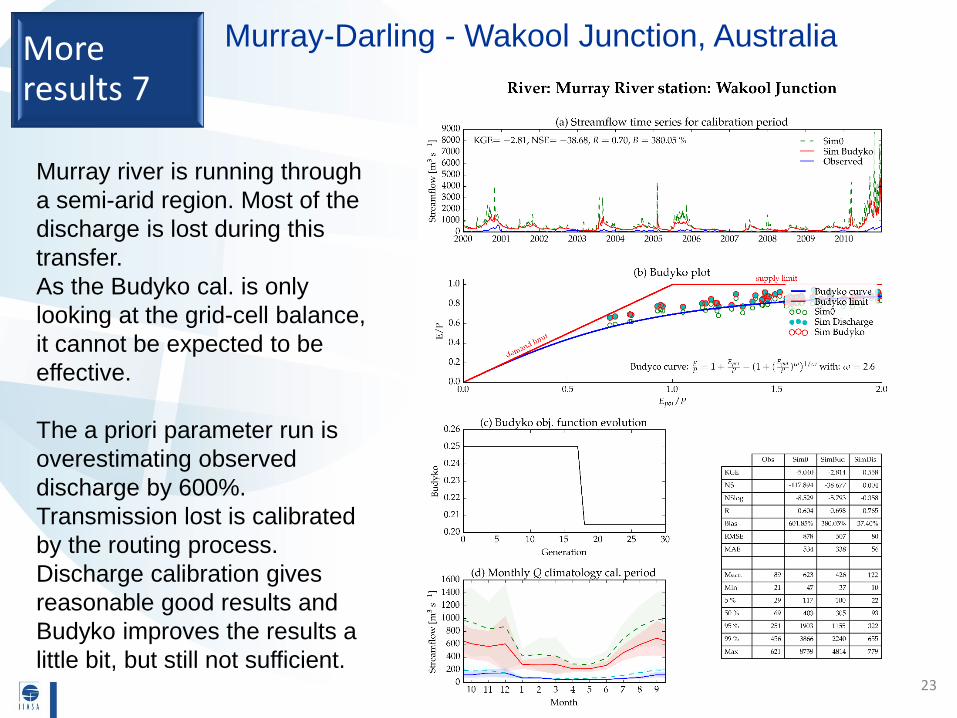
Murray-Darling - Wakool Junction, AustraliaMore results 7
Murray river is running through
a semi-arid region. Most of the
discharge is lost during this
transfer.
As the Budyko cal. is only
looking at the grid-cell balance,
it cannot be expected to be
effective.
The a priori parameter run is
overestimating observed
discharge by 600%.
Transmission lost is calibrated
by the routing process.
Discharge calibration gives
reasonable good results and
Budyko improves the results a
little bit, but still not sufficient.