Embed Size (px)
Citation preview

Using the DataView® PowerPad® III Control Panel
ENGLISH Tutorial
1

Copyright Copyright © Chauvin Arnoux®, Inc. d.b.a. AEMC® Instruments. All rights reserved. No part of this documentation may be reproduced in any form or by any means (including electronic storage and retrieval or translation into any other language) without prior agreement and written consent from Chauvin Arnoux®, Inc., as governed by United States and International copyright laws.
Chauvin Arnoux®, Inc. d.b.a. AEMC® Instruments 15 Faraday Drive, Dover, NH 03820 USA Tel: (800) 945-2362 or (603) 749-6434, Fax: (603) 742-2346
This documentation is provided “as is,” without warranty of any kind, expressed, implied, or otherwise. Chauvin Arnoux®, Inc. has made every reasonable effort to ensure that this documentation is accurate; but does not warrant the accuracy or completeness of the text, graphics, or other information contained in this documentation. Chauvin Arnoux®, Inc. shall not be liable for any damages, special, indirect, incidental, or inconsequential; including (but not limited to) physical, emotional, or monetary damages due to lost revenues or lost profits that may result from the use of this documentation, whether or not the user of the documentation has been advised of the possibility of such damages. Chauvin Arnoux®, Inc., AEMC®, DataView® & PowerPad® are registered trademarks of AEMC® Instruments.
2

Contents Introduction ................................................................................................................................................. 4 Lesson 1: Connecting the Instrument ...................................................................................................... 5
Step 1: Open the PowerPad III Control Panel .......................................................................................... 5 Step 2: Connect the Instrument to the Control Panel ............................................................................... 6
Lesson 2: Setting General Configuration Parameters ............................................................................ 8 Step 1: Set the Instrument Date and Time ................................................................................................ 8 Step 2: Display the Configure Instrument Dialog Box ............................................................................... 9 Step 3: General Setup ............................................................................................................................. 10 Step 4: Sensors and Ratios .................................................................................................................... 12 Step 5: Instrument Display ...................................................................................................................... 13
Lesson 3: Viewing Real-time Data ........................................................................................................... 14 Trend ....................................................................................................................................................... 14 Waveform ................................................................................................................................................ 15 Harmonics ............................................................................................................................................... 15 Power ...................................................................................................................................................... 16 Energy ..................................................................................................................................................... 16
Lesson 4: Configuring and Performing Recording Sessions .............................................................. 17 Step 1: General Setup ............................................................................................................................. 17 Step 2: Select Voltage Ratios ................................................................................................................. 18 Step 3: Define Alarms ............................................................................................................................. 19 Step 4: Select Data to Record ................................................................................................................. 20 Step 5: Recording Transients .................................................................................................................. 21 Step 6: Recording Inrush Events ............................................................................................................ 22 Step 7: Schedule the Recording ............................................................................................................. 22
Lesson 5: Configuring and Performing EN 50160 Monitoring Sessions ............................................ 24 Step 1: General Settings ......................................................................................................................... 25 Step 2: Slow Variations and Thresholds ................................................................................................. 26 Step 3: Rapid Voltage Changes and Interruptions .................................................................................. 27 Step 4: Dips and Swells .......................................................................................................................... 28 Step 5: Transients ................................................................................................................................... 30
Lesson 6: Downloading Data from the Instrument ................................................................................ 31 Downloading Individual Sessions ............................................................................................................ 32 Downloading Sessions by Type .............................................................................................................. 32 Downloading All Sessions ....................................................................................................................... 33 Downloading from the SD Card .............................................................................................................. 33
Lesson 7: Creating Reports and Spreadsheets ..................................................................................... 35 Creating a DataView Report ................................................................................................................... 35 Creating a Microsoft Excel-Compatible Spreadsheet ............................................................................. 37 Exporting Large Amounts of Data ........................................................................................................... 37
Contacting AEMC ...................................................................................................................................... 39
3
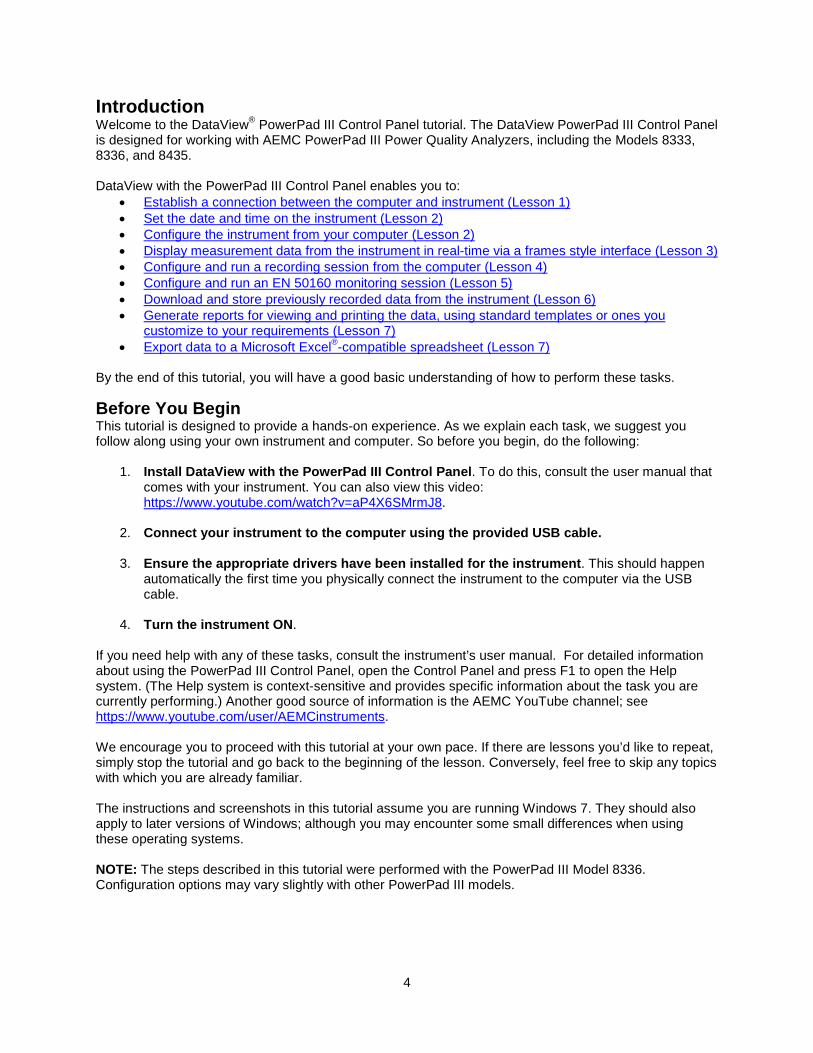
Introduction Welcome to the DataView® PowerPad III Control Panel tutorial. The DataView PowerPad III Control Panel is designed for working with AEMC PowerPad III Power Quality Analyzers, including the Models 8333, 8336, and 8435. DataView with the PowerPad III Control Panel enables you to:
• Establish a connection between the computer and instrument (Lesson 1) • Set the date and time on the instrument (Lesson 2) • Configure the instrument from your computer (Lesson 2) • Display measurement data from the instrument in real-time via a frames style interface (Lesson 3) • Configure and run a recording session from the computer (Lesson 4) • Configure and run an EN 50160 monitoring session (Lesson 5) • Download and store previously recorded data from the instrument (Lesson 6) • Generate reports for viewing and printing the data, using standard templates or ones you
customize to your requirements (Lesson 7) • Export data to a Microsoft Excel®-compatible spreadsheet (Lesson 7)
By the end of this tutorial, you will have a good basic understanding of how to perform these tasks.
Before You Begin This tutorial is designed to provide a hands-on experience. As we explain each task, we suggest you follow along using your own instrument and computer. So before you begin, do the following:
1. Install DataView with the PowerPad III Control Panel. To do this, consult the user manual that comes with your instrument. You can also view this video: https://www.youtube.com/watch?v=aP4X6SMrmJ8.
2. Connect your instrument to the computer using the provided USB cable.
3. Ensure the appropriate drivers have been installed for the instrument. This should happen automatically the first time you physically connect the instrument to the computer via the USB cable.
4. Turn the instrument ON. If you need help with any of these tasks, consult the instrument’s user manual. For detailed information about using the PowerPad III Control Panel, open the Control Panel and press F1 to open the Help system. (The Help system is context-sensitive and provides specific information about the task you are currently performing.) Another good source of information is the AEMC YouTube channel; see https://www.youtube.com/user/AEMCinstruments. We encourage you to proceed with this tutorial at your own pace. If there are lessons you’d like to repeat, simply stop the tutorial and go back to the beginning of the lesson. Conversely, feel free to skip any topics with which you are already familiar. The instructions and screenshots in this tutorial assume you are running Windows 7. They should also apply to later versions of Windows; although you may encounter some small differences when using these operating systems. NOTE: The steps described in this tutorial were performed with the PowerPad III Model 8336. Configuration options may vary slightly with other PowerPad III models.
4

Lesson 1: Connecting the Instrument
Step 1: Open the PowerPad III Control Panel After you install DataView with the PowerPad III Control Panel, two icons appear on your desktop:
DataView
PowerPad III Control Panel
(If you installed other Control Panels during DataView installation, their icons also appear on your desktop.) Although you can open the PowerPad III Control Panel from either icon, the quickest way is to
simply double-click the icon. When opened for the first time, the Control Panel appears as follows:
5

Step 2: Connect the Instrument to the Control Panel To establish a connection with the instrument, ensure it is physically connected to the computer via the USB cable and that it is powered ON. Then proceed as follows:
1. Click Instrument in the Control Panel menu bar and select Connect an instrument. This displays the Connect an Instrument Wizard screen.
If the instrument is physically connected to the computer and the appropriate drivers have been loaded, the instrument name automatically appears in the instrument field. In the preceding example, this is “AEMC 8336.”
2. Click Next. The Control Panel now connects to the instrument. During this process, messages
appear informing you of the progress of the connection.
3. If the connection is successful, the message Instrument has been identified, select Finish to continue appears. Select Finish.
4. The instrument is now listed in the navigation (left) frame of the Control Panel, with a green check mark next to its name to indicate it is actively connected. Click the name to display instrument status information in the data (right) frame of the Control Panel.
6

The instrument’s status also appears in the Status bar at the bottom of the Control Panel screen.
7
Lesson 2: Setting General Configuration Parameters Before you view real-time data from the PowerPad III (Lesson 3) or set up a recording session (Lesson 4), you must set the instrument date and time, as well as general configuration options appropriate for the system under measurement, the sensors and probes connected to the instrument, and the data you want to measure. These settings affect all tasks performed on the instrument. You can also control the operation and appearance of the LCD screen, and define which colors are associated with which data in graphical displays.
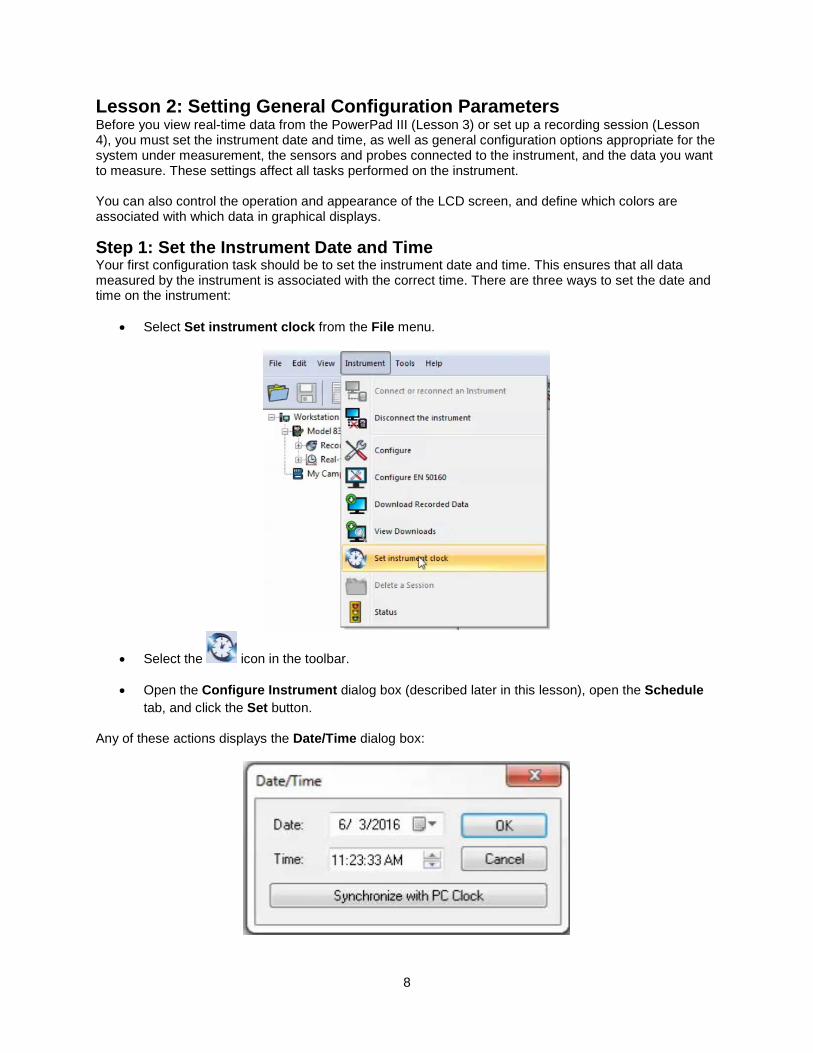
Step 1: Set the Instrument Date and Time Your first configuration task should be to set the instrument date and time. This ensures that all data measured by the instrument is associated with the correct time. There are three ways to set the date and time on the instrument:
• Select Set instrument clock from the File menu.
• Select the icon in the toolbar.
• Open the Configure Instrument dialog box (described later in this lesson), open the Schedule tab, and click the Set button.
Any of these actions displays the Date/Time dialog box:
8

• Date lets you enter a new date for the instrument. Click the downarrow to the right of this field to display a calendar from which you can choose a date.
• Time allows you to set a new time for the instrument. You can type in a new time, or use the uparrow and downarrow to the right of the field to increment the time. To do this, highlight the time value you want to increment (hours, minutes, or seconds) and then click the uparrow to increase the value or downarrow to decrease it.
• Synchronize with PC Clock when clicked results in the instrument clock being "synched up" with the computer’s clock. This feature enables you to ensure that both the instrument and computer have exactly the same time.
Click OK to save your changes to the instrument and exit the Date/Time dialog box.
Step 2: Display the Configure Instrument Dialog Box The primary interface for configuring the PowerPad III is the Configure Instrument dialog box. This allows you to change settings, set up and run a recording, and perform other tasks on the instrument. There are three ways to display the Configure Instrument dialog box:
• Click Instrument in the menu bar and select Configure.
• Click the icon in the toolbar. • Click the button at the top of the data frame.
Any of these actions opens the Configure Instrument dialog box.
NOTE: The Configure Instrument dialog box shown above is for the Model 8336. The Model 8333 does not include the Inrush tab. In addition, not all fields on these tabs appear for all instrument models.
9

Common Buttons The Configure Instrument dialog box consists of several tabs, described later in this tutorial. It also includes a set of buttons common to all tabs:
• Re-Read from Instrument reads the current configuration of the connected PowerPad III.
• Save to File saves the current configuration as a DataView configuration (.dvc) file. This file will reside on the computer’s disk drive. Saving different configuration setups can be useful for future functions and tests. A .dvc file can also save time when configuring multiple instruments in exactly the same way.
• Load from File retrieves a saved .dvc file from the computer’s disk drive to be used to configure the PowerPad III.
• OK writes the current configuration to the instrument, closes the dialog box, and returns to the main Control Panel screen.
• Cancel exits without saving configuration changes.
• Apply sets the configuration changes on the instrument without closing the dialog box.
• Help opens the Help menu.
Step 3: General Setup With the Configure Instrument dialog box open, click the Setup tab (if it is not already open).
10
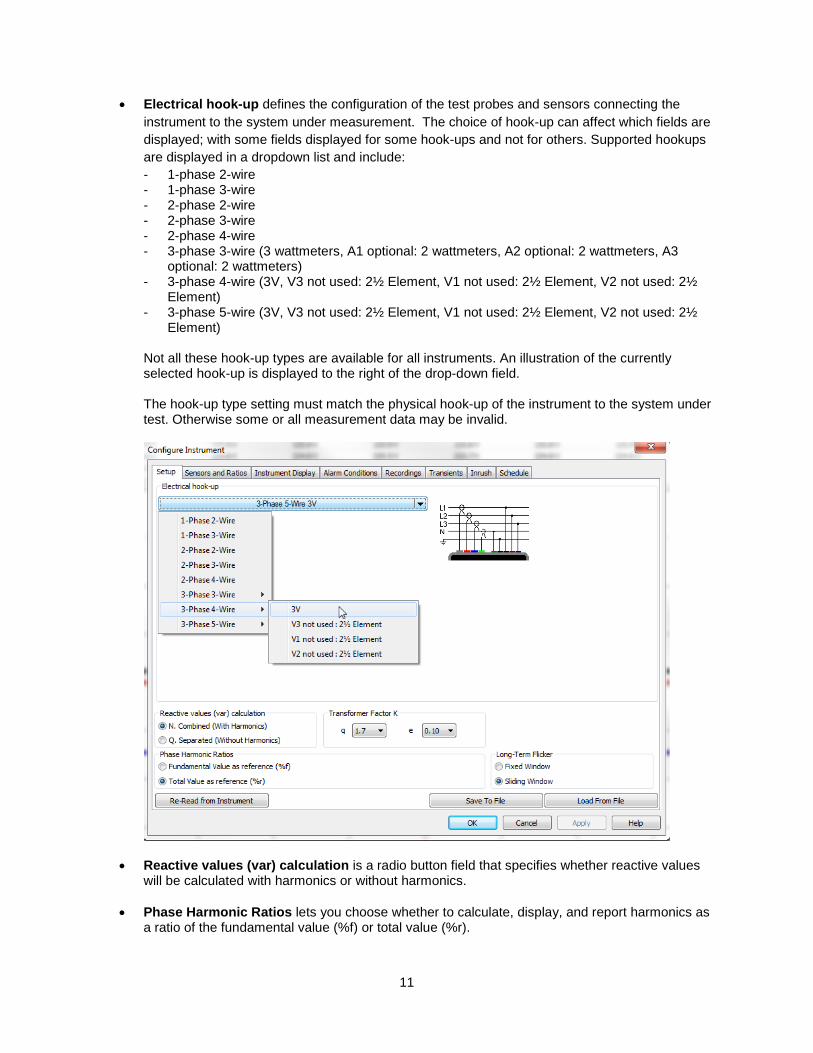
• Electrical hook-up defines the configuration of the test probes and sensors connecting the instrument to the system under measurement. The choice of hook-up can affect which fields are displayed; with some fields displayed for some hook-ups and not for others. Supported hookups are displayed in a dropdown list and include: - 1-phase 2-wire - 1-phase 3-wire - 2-phase 2-wire - 2-phase 3-wire - 2-phase 4-wire - 3-phase 3-wire (3 wattmeters, A1 optional: 2 wattmeters, A2 optional: 2 wattmeters, A3
optional: 2 wattmeters) - 3-phase 4-wire (3V, V3 not used: 2½ Element, V1 not used: 2½ Element, V2 not used: 2½
Element) - 3-phase 5-wire (3V, V3 not used: 2½ Element, V1 not used: 2½ Element, V2 not used: 2½
Element)
Not all these hook-up types are available for all instruments. An illustration of the currently selected hook-up is displayed to the right of the drop-down field. The hook-up type setting must match the physical hook-up of the instrument to the system under test. Otherwise some or all measurement data may be invalid.
• Reactive values (var) calculation is a radio button field that specifies whether reactive values will be calculated with harmonics or without harmonics.
• Phase Harmonic Ratios lets you choose whether to calculate, display, and report harmonics as a ratio of the fundamental value (%f) or total value (%r).
11

• Transformer Factor K defines variables for calculating the transformer Factor K (see below).
• Long-Term Flicker defines whether long-term flicker is measured via a fixed or sliding window of time.
Factor K vs K-Factor The PowerPad III Control Panel supports instruments that calculate Factor K. Users can sometimes be confused by Factor K and K-Factor, two similarly named but different values:
• Factor K is a European calculation method designed to the British Standard BS7821 Part 4. Factor K estimates how much a standard oil-filled transformer should be de-rated so that the total loss on the harmonic load does not exceed the fundamental design loss. For example, the same factors that would produce a K-Factor of 11.6 (see above) would result in a Factor K of 1.27, which equates to the transformer needing to be de-rated to 78.52%.
• K-Factor is a calculation method designed for “dry-type” transformers commonly used in the U.S. The result of this calculation is a number that quantifies the eddy current loss and helps define the K-Rating for a transformer that can accommodate this loss. The standard ranges for K-Rated transformers are 4, 9, 13, 20, 30, 40, and 50. For example, if the calculated K-Factor is 11.6, a K-Rated transformer of 13 (the next highest K-Rating) would be required
Step 4: Sensors and Ratios This tab configures the ratios for sensors/probes used for data measurements.
You can select primary and secondary ratios for voltage and current. You can also choose whether to use the same ratio for every line or assign a unique ratio for each. PowerPad III instruments automatically identify the following probes/sensors: MN93, MN193, SR193, MR193, AmpFlex A193, MiniFlex MA193, J93, or ADA. The ADA (Adapter) is used to accept probes with other ratios or a direct 1A or 5A input.
12

The MN193 probe (when the current range switch is at 5A) and the ADA include a current ratio, which gives a ratio of Primary to Secondary. This is designed for connection to CTs. The PowerPad III uses and stores these ratios. The Voltage Ratios field includes a drop-down field that specifies how voltage ratios (if any) are used, as well as fields for setting the primary and secondary ratio(s).To configure no ratio (1/1), click Voltage Ratios and select 4L 1/1 No ratios. To configure separate voltage ratios for each input, follow these steps:
1. Click Voltage Ratios and select L1+L2+L3+N Separate Ratios 2. Enter the Primary and Secondary ratios in the displayed fields.
The Current Sensors and Ratios field is similar to Voltage Ratios. These fields define the probes’ range and (where possible) the primary and secondary ratios for each sensor currently attached to the instrument. The Current Sensors and Ratios fields are only active when a current probe that allows for programming the current ratio (the MN193 probe in 5A range and the Adapter Box) is connected to the instrument. Other probes have predefined ranges which cannot be changed.
Step 5: Instrument Display This tab enables you to select the format for displaying date/time, adjust the color display for voltage and current channels, change the language of the instrument, adjust the instrument’s LCD display brightness, and change the Energy Units reported by the instrument.
• Instrument Display selects the time format (AM/PM or 24-hour) and date format (DD/MM/YY or MM/DD/YY). You can also set the levels of brightness and contrast on the instrument's display.
• Instrument's Display Trace Colors associates colors with each voltage and current reading. • Energy Units defines the units of measure used by the instrument when displaying energy data.
Options are Wh, Joules, nuclear TOE, non-nuclear TOE and BTUs. • Instrument's Display Language sets the language in which the instruments options and
readouts appear. A total of 26 different languages are available.
13
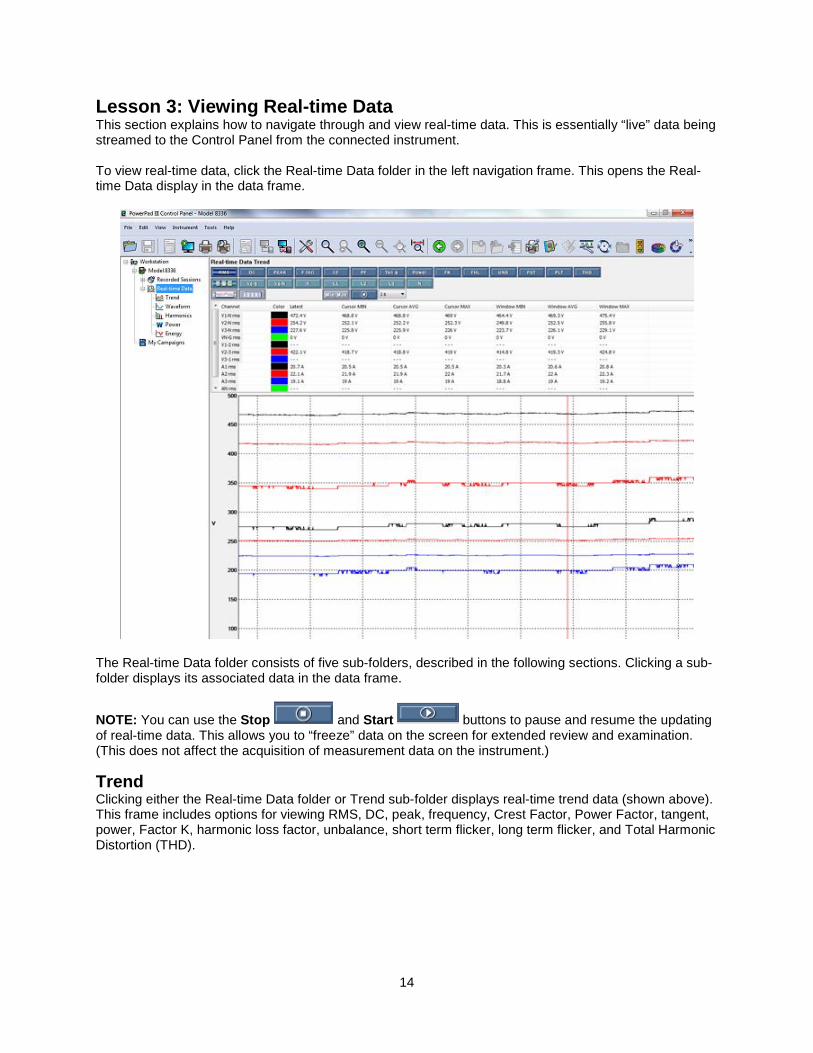
Lesson 3: Viewing Real-time Data This section explains how to navigate through and view real-time data. This is essentially “live” data being streamed to the Control Panel from the connected instrument. To view real-time data, click the Real-time Data folder in the left navigation frame. This opens the Real-time Data display in the data frame.
The Real-time Data folder consists of five sub-folders, described in the following sections. Clicking a sub-folder displays its associated data in the data frame.
NOTE: You can use the Stop and Start buttons to pause and resume the updating of real-time data. This allows you to “freeze” data on the screen for extended review and examination. (This does not affect the acquisition of measurement data on the instrument.)
Trend Clicking either the Real-time Data folder or Trend sub-folder displays real-time trend data (shown above). This frame includes options for viewing RMS, DC, peak, frequency, Crest Factor, Power Factor, tangent, power, Factor K, harmonic loss factor, unbalance, short term flicker, long term flicker, and Total Harmonic Distortion (THD).
14
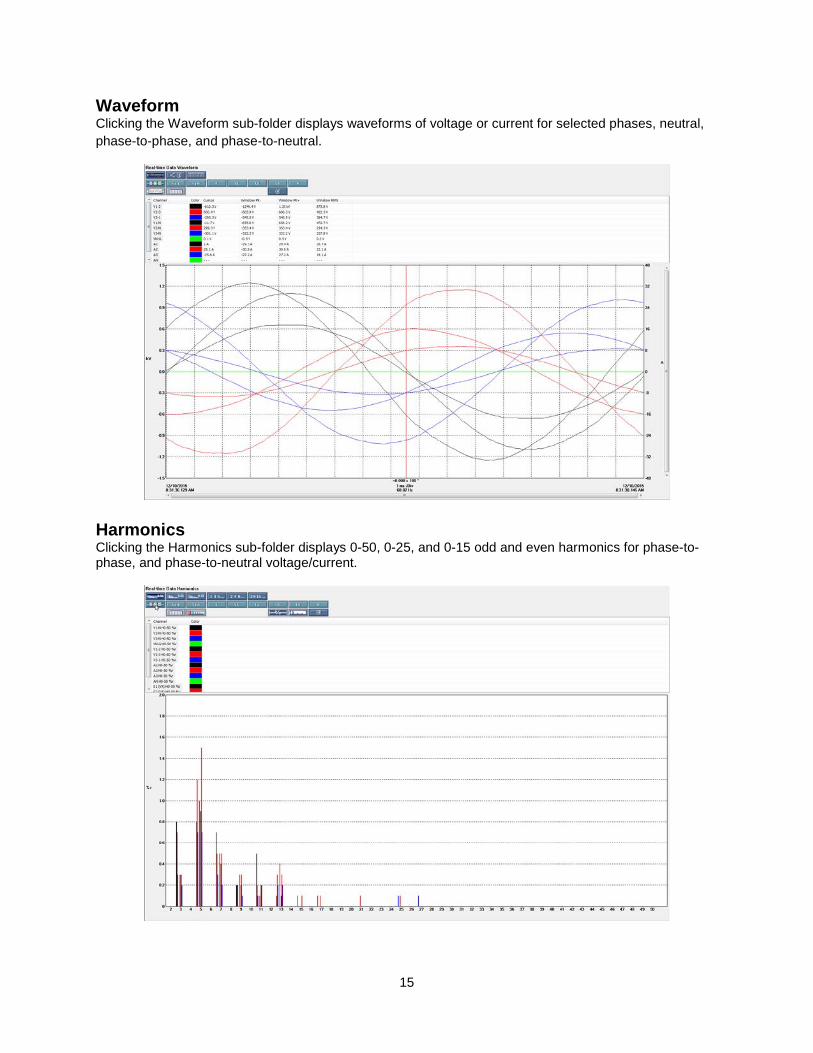
Waveform Clicking the Waveform sub-folder displays waveforms of voltage or current for selected phases, neutral, phase-to-phase, and phase-to-neutral.
Harmonics Clicking the Harmonics sub-folder displays 0-50, 0-25, and 0-15 odd and even harmonics for phase-to-phase, and phase-to-neutral voltage/current.
15

Power Clicking the Power sub-folder displays power relevant values in table format, including min/max data.
Energy This displays source/load/net real-time energy measurements. To do this, highlight the Energy sub-
folder. If the Start button appears in the data frame, click it to begin the accumulation of
energy data on the instrument and populate the values on this screen. (If the Stop button appears instead, accumulation of energy data is already in progress.)
16

Lesson 4: Configuring and Performing Recording Sessions An important feature of the PowerPad III Control Panel is its ability to set up, schedule, and run recording sessions on the instrument. The data recorded during these sessions can then be downloaded to the computer, viewed, and formatted into DataView reports and/or Microsoft Excel-compatible spreadsheets (see Lesson 7). In addition to measurement data, a recording session can also be configured to capture the following:
• Alarms (events in which the instrument records a measurement that meets the criteria defined asan alarm condition)
• Transients (short-lived events in which the instrument records a voltage or current measurementthat meets a pre-defined criterion)
• Inrush (spikes in current associated with power-up events, such as starting a motor)
This data is stored in the instrument in a recording file. This file also stores the following: • “Photographs” of data recorded by pressing the CAMERA button on the instrument.• Monitoring data that determines whether or not the system under measurement is in compliance
with the European standard EN 50160. Monitoring sessions are set up through a separate dialogbox (see Lesson 5).
In this lesson, we explain how to set up and run a typical recording session. We assume the instrument is actively connected to the computer. To follow along with this example demonstration, your instrument does not need to be connected to a distribution system.
Step 1: General Setup
1. Open the Configure Instrument dialog box. In the Setup tab, select the electrical hook-up type.For a real recording session, the hook-up type setting must match the physical hook-up of theinstrument to the system under test. For simple demonstration purposes this isn’t necessary; soselect 3-phase 4-wire from the drop-down list and then choose 3V from the sub-menu.
17
2. If you want reactive values to be calculated with harmonics, click the radio button N. Combined(With Harmonics) in the Reactive values (VAR) calculation field.
3. In the Phase Harmonic Ratios field, select Total Value as reference (%) to calculate, display, and report harmonics as a ratio of the total value.
4. In the Transformer Factor K field, enter the appropriate values in the “q” and “e” fields to definethe variables for calculating the transformer Factor K. (In the preceding illustration, q = 1.7 and e= 0.10.)
5. Select Fixed Window or Sliding Window in the Long-Term Flicker field to specify which type ofwindow of time is used for measuring long-term flicker.
Step 2: Select Voltage Ratios
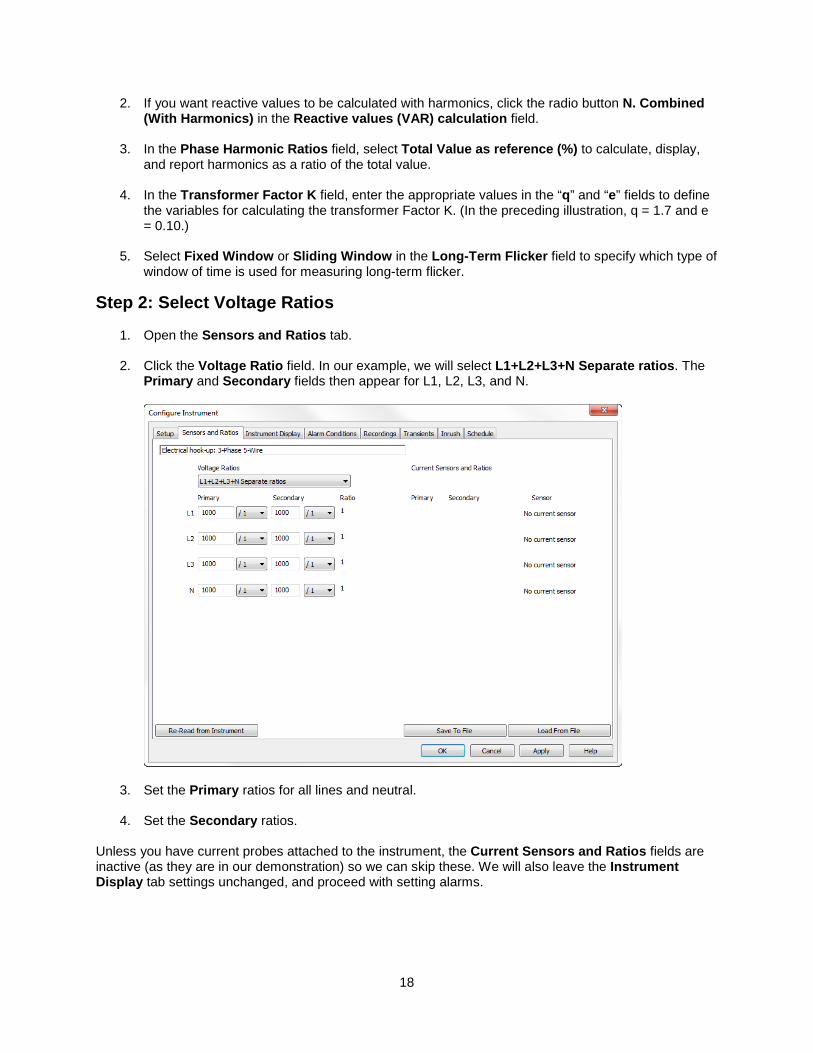
1. Open the Sensors and Ratios tab.
2. Click the Voltage Ratio field. In our example, we will select L1+L2+L3+N Separate ratios. ThePrimary and Secondary fields then appear for L1, L2, L3, and N.
3. Set the Primary ratios for all lines and neutral.
4. Set the Secondary ratios.
Unless you have current probes attached to the instrument, the Current Sensors and Ratios fields are inactive (as they are in our demonstration) so we can skip these. We will also leave the Instrument Display tab settings unchanged, and proceed with setting alarms.
18

Step 3: Define Alarms The Alarm Conditions tab lists all the parameters (measured and calculated) for which alarms can be set. Since we are using the Model 8336 in our example, we are able to configure up to 40 alarms. For each alarm you can set the following (note that not all these fields apply to each type of alarm):
• Data to Capture is a drop-down list of all the choices of quantities (including None) for which an alarm can be set. After you select a quantity, a check box appears to the left of the measurement's name. Check or uncheck this box to enable or disable this alarm. This allows you to define an alarm but choose to include or exclude it depending on the recording.
• Phases specifies the phase to be monitored. Options are 3L, N, and 4L. Note that this field does not appear for some quantity types.
• < or > specifies whether the alarm activates when a quantity exceeds a defined threshold, or activates when it falls below that threshold. This field is inactive for some quantities.
• Threshold defines the limit that activates the alarm. Depending on the quantity being configured, the threshold may be expressed as a percentage, or in terms of units. In the latter case, some quantities offer a choice of units, which you can select from a drop-down list.
• Duration sets the time period the condition must persist before it is recorded as an alarm. This can be expressed in either seconds or minutes, as selected from the accompanying drop-down list.
• Hysteresis selects the hysteresis percentage for the quantity. Options are 1%, 2%, 5% and 10%. For instance, suppose we complete this tab as follows:
In the preceding example, we have set the first alarm for frequency (Hz). The checkmark to the left indicates this alarm is enabled. The setting in the < or > field indicates the alarm will activate if the measured frequency falls below the threshold, which we have set to 50Hz. We have set Duration to 5s; this specifies that the alarm will be included in the recording if it lasts 5 seconds or longer. Finally, we allow 5% of the measurement for hysteresis. We suggest you spend a few minutes navigating through and experimenting with these parameters.
19

Step 4: Select Data to Record The Recordings tab of the Configure Instrument dialog box defines what data should be captured during instrument recording sessions. You can create up to four different recording configurations that you can re-use for future recordings. To configure a recording:
1. In the Configuration Number field, select the radio button labeled 1. This will save our configuration settings as “Configuration 1.”
2. Click None to deselect all check boxes.
3. For demonstration purposes, select all the variables listed in the first column on the left.
4. We will now create a second (blank) configuration. Start by selecting the button labeled 2 in the Configuration Number field. Then click None to de-select all variables.
5. Similarly, click 3 in the Configuration Number field and select all variables listed in the second and third columns from the left.
6. Finally, click 4 in the Configuration Number field and click the All button to select all variables. If you click 1 again in the Configuration Number field, you will see that only the parameters in the far left column are checked. Selecting 2 shows no variables selected, 3 shows the second and third column parameters checked, and 4 has all selected.
20

Step 5: Recording Transients The Transients tab allows you to determine how the instrument will identify and measure transients that may occur during a transient search. You can select the same thresholds for all lines, use the same thresholds for every line except neutral, or assign individual thresholds to each line. You can also select a maximum number of transients to record, and display a status of how many transients are allowed compared to how many are stored on the instrument.
• Threshold of Voltage Difference defines the level of a voltage transient.
• Threshold of Current Difference is similar to the Threshold of Voltage Difference fields; it defines the level of a current transient.
• Maximum number of transients to find defines the maximum number of transients you want to capture.
At the bottom of the screen is a graphic showing the relative threshold limits in red around a waveform and how the defined threshold detects a transient (shown by the delta/REL triangle). This graphic depicts how a transient is defined and triggered.
21
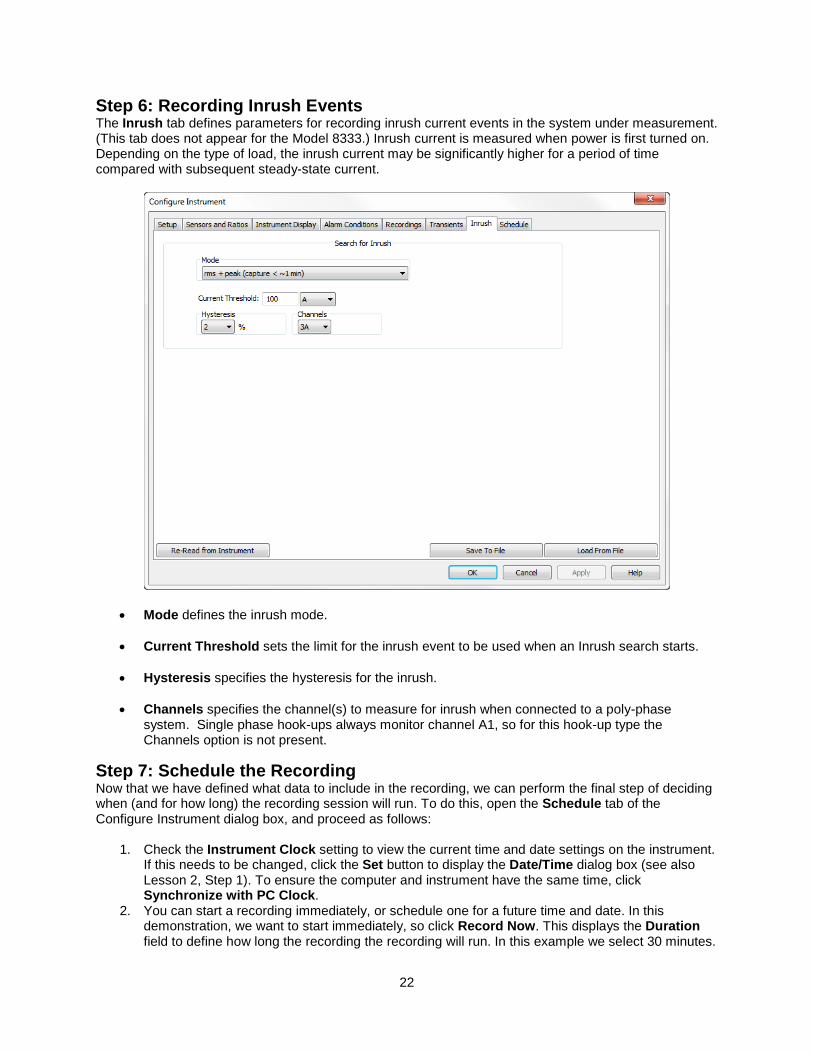
Step 6: Recording Inrush Events The Inrush tab defines parameters for recording inrush current events in the system under measurement. (This tab does not appear for the Model 8333.) Inrush current is measured when power is first turned on. Depending on the type of load, the inrush current may be significantly higher for a period of time compared with subsequent steady-state current.
• Mode defines the inrush mode.
• Current Threshold sets the limit for the inrush event to be used when an Inrush search starts.
• Hysteresis specifies the hysteresis for the inrush.
• Channels specifies the channel(s) to measure for inrush when connected to a poly-phase system. Single phase hook-ups always monitor channel A1, so for this hook-up type the Channels option is not present.
Step 7: Schedule the Recording Now that we have defined what data to include in the recording, we can perform the final step of deciding when (and for how long) the recording session will run. To do this, open the Schedule tab of the Configure Instrument dialog box, and proceed as follows:
1. Check the Instrument Clock setting to view the current time and date settings on the instrument. If this needs to be changed, click the Set button to display the Date/Time dialog box (see also Lesson 2, Step 1). To ensure the computer and instrument have the same time, click Synchronize with PC Clock.
2. You can start a recording immediately, or schedule one for a future time and date. In this demonstration, we want to start immediately, so click Record Now. This displays the Duration field to define how long the recording the recording will run. In this example we select 30 minutes.
22
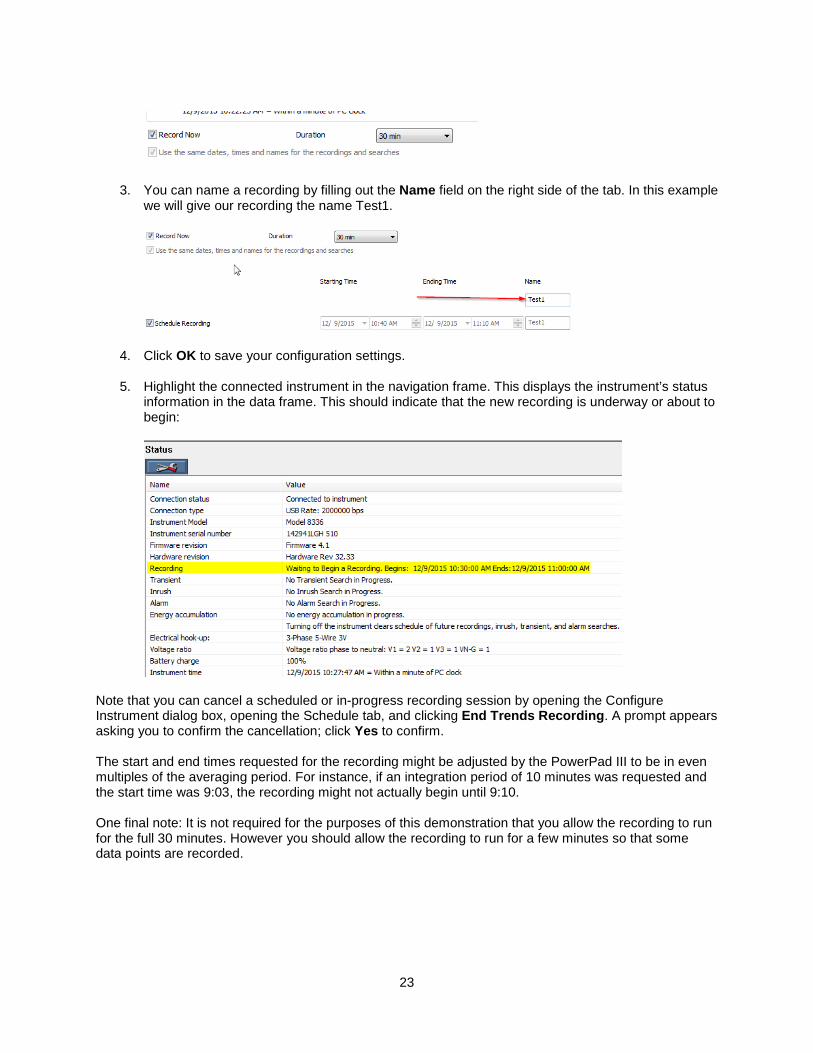
3. You can name a recording by filling out the Name field on the right side of the tab. In this example we will give our recording the name Test1.
4. Click OK to save your configuration settings.
5. Highlight the connected instrument in the navigation frame. This displays the instrument’s status information in the data frame. This should indicate that the new recording is underway or about to begin:
Note that you can cancel a scheduled or in-progress recording session by opening the Configure Instrument dialog box, opening the Schedule tab, and clicking End Trends Recording. A prompt appears asking you to confirm the cancellation; click Yes to confirm. The start and end times requested for the recording might be adjusted by the PowerPad III to be in even multiples of the averaging period. For instance, if an integration period of 10 minutes was requested and the start time was 9:03, the recording might not actually begin until 9:10. One final note: It is not required for the purposes of this demonstration that you allow the recording to run for the full 30 minutes. However you should allow the recording to run for a few minutes so that some data points are recorded.
23

Lesson 5: Configuring and Performing EN 50160 Monitoring Sessions The PowerPad III can be configured to monitor the system under measurement for compliance with EN 50160. This is a European-based standard designed to specify acceptable voltage characteristics of electricity supplied by public distribution systems. EN 50160 provides the limits and tolerances of various phenomena and events that can occur on the mains power, including slow variations, rapid voltage changes, interruptions, dips and swells, and transients. EN 50160 monitoring sessions are configured and scheduled through the Configure EN 50160 dialog box. To display this dialog box, click Instrument in the menu bar and then select the option Configure
EN 50160. You can also display this dialog box by clicking the icon in the toolbar.
The Configure EN 50160 dialog consists of five tabs:
• General displays the electrical hook-up type and other variables associated with the system under measurement. You can also name and schedule an EN 50160 monitoring session.
• Slow Variations thresholds sets parameters for identifying how much a measurement varies from its acceptable value defined by EN 50160.
• Rapid Voltage Changes and Interruptions configures the monitoring session for detecting rapid voltage changes (RVC) and interruptions in the system under measurement.
• Dips and swells defines settings for monitoring dips and swells (overvoltage events). • Transients sets conditions for capturing transients in the system under measurement.
At the bottom of the Configure EN 50160 dialog box are three buttons:
• OK writes the configuration changes to the instrument and exits the Configure EN 50160 dialog box.
• Cancel exits the Configure Instrument dialog; any outstanding configuration changes that haven't been saved to the instrument are lost.
• Help opens the Control Panel Help system, at the topic appropriate to the tab in which the Help button was pressed.
24

Step 1: General Settings The General tab of the Configure EN 50160 dialog box (shown in the preceding illustration) defines general settings for configuring an EN 50160 monitoring session. At the top of the tab is a field that displays the electrical hook-up type. This field is read-only; to change the electrical hook-up you must either do so on the instrument or through the Configure Instrument dialog box. Below this are the following fields:
• A drop-down list displays previously saved configuration files. You can select a file to write the settings it contains into the fields in the Configure EN 50160 dialog box. The default configuration file is named "EN 50160 (default) V < 1000 V." To remove a configuration file from the drop-down list, select it and press the Remove Selected Configuration button in the right side of the General tab. Note that you cannot remove the default configuration file.
• Nominal Voltage defines the nominal or "center" voltage for the electrical hook-up to be monitored. You can set any voltage between 50 and 650,000V.
• Phase-to-Phase and Phase-to-Neutral. These radio buttons specify whether the voltage is defined as phase-to-phase or phase-to-neutral depending on the selected electrical hook-up. Some systems only allow one option. For example the 1-phase 2-wire (single phase) electrical hook-up only supports phase-to-neutral voltages.
• Aggregation period (by default) specifies the default period of time over which the instrument determines the average value for a given measurement parameter. In addition to the average, the 1 second minimum and maximum values (along with time stamps) are also stored. The Aggregation period drop-down box lists the available demand intervals supported by the instrument.
• Consider each phase separately for dips, swells and interruptions when checked instructs the system to monitor each phase for EN 50160 compliance. By default this is unchecked.
• The next field lets you name the monitoring session. The name cannot exceed 20 characters.
• Schedule Test schedules a monitoring session. When this option is checked, the fields for entering a start date/time and end date/time for the monitoring session appear. By default, the start date/time is the current date/time, and the end date/time is the current date/time plus one week.
25

Step 2: Slow Variations and Thresholds One of the parameters included in the EN 50160 standard is variation. This is a measure of how much a measurement varies from the acceptable value defined by EN 50160. Variation can be measured for a number of parameters defined in the Slow Variations thresholds tab of the Configure EN 50160 dialog box.
This tab presents variations settings formatted in the following columns:
• Quantity defines the value to be monitored. Options are Hz, Vϕ-N rms, Vϕ-ϕ rms, Plt, Vϕ-N unb (u2), Vϕ-N THDf, Vϕ-ϕ TDHf, Vϕ-N Hf, Vϕ-ϕ Hf, and None. Several of these values can be selected multiple times; up to 64 in total can be monitored. You can navigate through the list of quantities using the Next Page and Previous Page buttons at the bottom of the screen. Note that some values are not available in some distribution systems and instrument models.
• Harmonic order is available when the selected quantity is Vϕ-N rms, Vϕ-N Hf, or Vϕ-ϕ Hf. The order is a number from 2 through 25.
• L / N defines the line to be monitored when Vϕ-N rms or Vϕ-N Hf is selected in the Quantity field. For other quantities this column is blank. Options are 3L, 2L, L, or Neutral. The choice of options depends on the electrical hook-up and the instrument model.
• Aggregation period specifies a period of time over which the instrument determines the average value for a given measurement parameter. In addition to the average, the 1 second minimum and maximum values (along with time stamps) are also stored. The Aggregation period drop-down box lists the available demand intervals supported by the instrument. Default is the value entered into the Aggregation period (by default) field in the General tab of the Configure EN 50160 dialog box.
• Select Abs / % defines whether to use absolute limits or relative limits. This check box only appears when the quantity is Hz, Vϕ-N rms, or Vϕ-ϕ rms.
• Nominal value displays the nominal or "center" value for the quantity, as defined in the General tab of the Configure EN 50160 dialog box. Nominal values are displayed for the quantities Hz, Vϕ-N rms, or Vϕ-ϕ rms. When the Abs check box is de-selected (see above), a field appears to the right of each displayed nominal value. This is for entering the percentage of variation from the nominal value to monitor. This must be a number between -100 and 100; values can include a positive (+) or negative (-) sign, a decimal separator, and a digit after the decimal separator.
26
• Low (<) limit defines the lowest allowable limit for the quantity. This field only appears for the quantities Hz, Vϕ-N rms, or Vϕ-ϕ rms; and is active when the Abs check box is selected. For Vϕ-N rms and Vϕ-ϕ rms, use the adjacent drop-down list to select ether V or k for the unit. If the Abs check box is de-selected, the value is calculated using the nominal value and the associated percentage (see above). In this case, a field appears to the right of each displayed low limit value for entering the percentage of variation. This must be a number between -100 and 100.
• High (>) limit defines the highest allowable limit for the quantity to be monitored. It is available for all quantities. For quantities Plt, Vϕ-N unb (u2), Vϕ-N THDf, Vϕ-ϕ TDHf, Vϕ-N Hf, and Vϕ-ϕ Hf; this value is expressed in percentage.
• % of aggregation periods. Allowable values are 0 to 100.
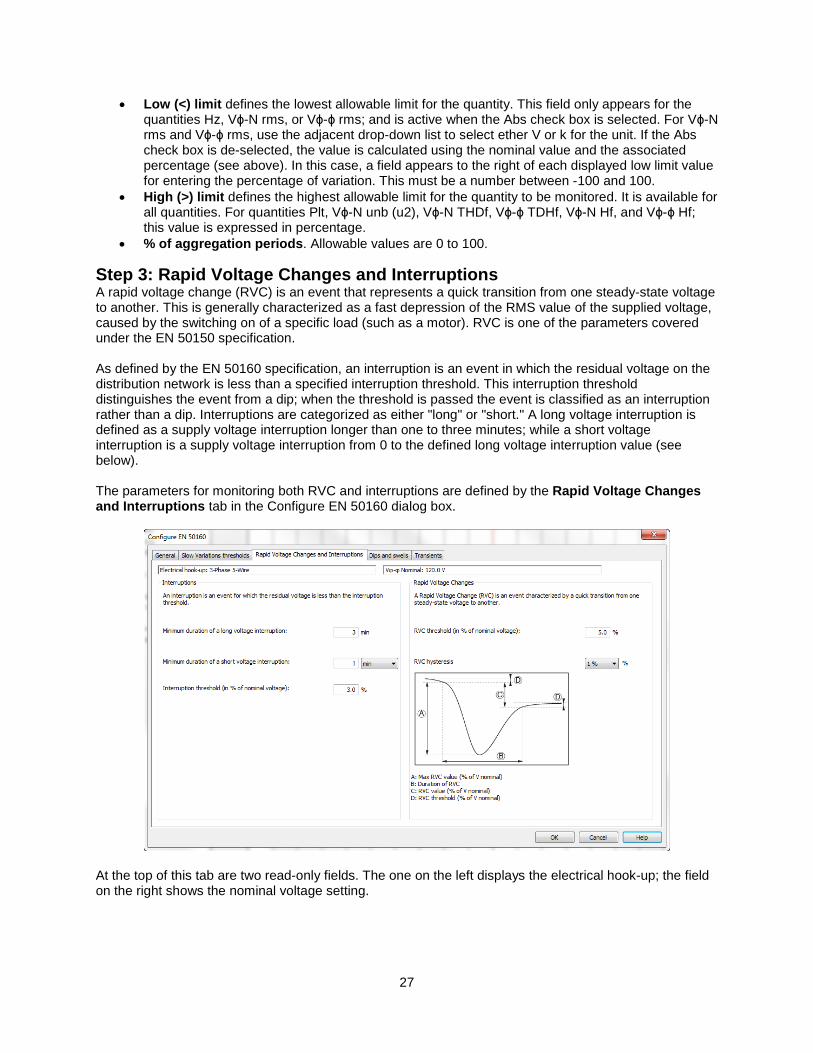
Step 3: Rapid Voltage Changes and Interruptions A rapid voltage change (RVC) is an event that represents a quick transition from one steady-state voltage to another. This is generally characterized as a fast depression of the RMS value of the supplied voltage, caused by the switching on of a specific load (such as a motor). RVC is one of the parameters covered under the EN 50150 specification. As defined by the EN 50160 specification, an interruption is an event in which the residual voltage on the distribution network is less than a specified interruption threshold. This interruption threshold distinguishes the event from a dip; when the threshold is passed the event is classified as an interruption rather than a dip. Interruptions are categorized as either "long" or "short." A long voltage interruption is defined as a supply voltage interruption longer than one to three minutes; while a short voltage interruption is a supply voltage interruption from 0 to the defined long voltage interruption value (see below). The parameters for monitoring both RVC and interruptions are defined by the Rapid Voltage Changes and Interruptions tab in the Configure EN 50160 dialog box.
At the top of this tab are two read-only fields. The one on the left displays the electrical hook-up; the field on the right shows the nominal voltage setting.
27
The remainder of the tab is divided into two sections. On the left side is the Interruptions section, which consists of the following fields:
• Minimum duration of a long voltage interruption sets the period (in minutes) that defines a long interruption. Default is 3 minutes.
• Minimum duration of a short voltage interruption specifies the period that defines a "short" interruption. Default is 1 minute. You can enter this value in minutes, seconds, or 10's of milliseconds; select the unit from the adjacent drop-down box.
• Interruption threshold (in % of nominal voltage) defines the point at which a drop in voltage is classified as an interruption. This is expressed in terms of percentage of nominal voltage. Default is 1%.
On the right side of the RVC and Interruptions tab is the Rapid Voltage Changes section. This consists of the following fields:
• RVC threshold (in % of nominal voltage) defines the point at which a sudden rise or drop in voltage is classified as a rapid voltage change. This is expressed in terms of percentage of nominal voltage. Default is 5%.
• RVC hysteresis sets the hysteresis percentage for the RVC. This is a drop-down list with two options, 1% (default) and 0.5%.
Below these two fields is a graphic display of RVC events (if any) that have been measured by the instrument.
Step 4: Dips and Swells For the purposes of EN 50160 monitoring, a voltage dip is defined as a sudden reduction of the RMS voltage value below 90% of the nominal value, followed by a return to a value higher than 90% of the nominal, within a time period varying from 10ms to 60s. A swell is defined as a temporary overvoltage of the RMS voltage value. Swells mainly occur at the power frequency and can last from several cycles up to hours or days, depending on specific situations. Each voltage dip or swell event is characterized by:
• lowest (dip) or highest (swell) voltage value measured on any channel during the event
• depth (difference between the nominal voltage and the event voltage in percentage of the nominal voltage)
• duration (time difference between the start time and the end time of the voltage event) The Monitoring feature allows you to record and display voltage dips and swells detected by the instrument during an EN 50160 monitoring session. The parameters for monitoring both dips and swells are defined by the Dips and swells tab in the Configure EN 50160 dialog box.
28

At the top of this tab are two read-only fields. The one on the left displays the electrical hook-up; the field on the right shows the nominal voltage setting. The remainder of the tab is divided into two sections. On the left side is the Dips section, which consists of the following fields:
• Dip Level is a section consisting of two fields. The first is Voltage hysteresis in % which sets the hysteresis percentage for the voltage dip. This is a drop-down list with four options, 1%, 2% (default), 5%, and 10%. The second field is Voltage threshold in % which defines the point at which a drop in voltage is classified as a dip. This is expressed in terms of percentage of nominal voltage. You can specify up to seven thresholds for categorizing the severity of the dip. By default, five thresholds are defined: 5%, 40%, 70%, 80%, and 90%. You can change or delete these thresholds, or add up to two more.
• Dip Duration is a section that consists of two fields. Minimum duration defines the length of time a dip must be measured before it is recorded as an event. You can enter this value in minutes, seconds, or 10's of milliseconds; select the unit from the adjacent drop-down box. Default is 10ms. The second field is Maximum duration in ms. This lets you categorize dip events by how long they last. By default, five durations are defined: 2, 500, 1000, 5000, and 60000ms. You can change or delete these thresholds, or add up to two more. Allowable values are 2 through 99999ms.
On the right side of the Dips and swells tab is the Swells section. The fields in this section are similar to the fields in the Dips section:
• Swell Level consists of two fields. Voltage hysteresis in % sets the hysteresis percentage for the voltage swell. Options are 1%, 2% (default), 5%, and 10%. The second field is Voltage threshold in % which defines the point at which an overvoltage is classified as a swell. You can specify up to seven thresholds for categorizing the swell. By default, two thresholds are defined: 110% and 120%.
• Swell duration consists of two fields. Minimum duration defines the length of time a dip must be measured before it is recorded as an event. You can enter this value in minutes, seconds, or 10's of milliseconds; default is 10ms. The second field is Maximum duration in ms. This lets you categorize swell events by how long they last. By default, three durations are defined: 500, 5000, and 60000ms. You can change or delete these thresholds, or add up to four more. Allowable values are 2 through 99999ms.
29

Step 5: Transients Transients are short-term phenomena that occur in the system under measurement. The mechanism for recording transients is as follows: the instrument sampling rate is a constant 256 samples per cycle. When a transient search is started on the instrument, each sample is compared to the sample from the preceding cycle. The preceding cycle defines the mid-point of the trigger envelope and is used as reference. As soon as a sample is outside the envelope, the triggering event occurs; the representation of the transient is then captured by the instrument. The cycle preceding the event and the three following cycles are saved to memory. The Monitoring feature allows you to record and display transient conditions measured by the instrument during an EN 50160 monitoring session. The parameters for monitoring transients are defined in the Transients tab in the Configure EN 50160 dialog box.
At the top of this tab is a read-only field that displays the electrical hook-up, as defined in the General tab. Below this is a drop-down field that specifies whether:
• The same voltage difference threshold applies to all phases and the neutral in the electrical hook-up
• One threshold applies to the phases and one applies to neutral • Each phase and neutral has its own assigned threshold
Depending on the electrical hook-up currently under measurement, not all these options may be available. The selection in these fields determines which of the four fields below it (L1, L2, L3, and N) are active. If you select 4L Same thresholds for all, only the L1 field is active; the value you enter into this field applies to all phases and neutral. If you select 3L+N Same except N has its own threshold, the fields L1 and N are active. If you select L1+L2+L3+N Separate thresholds, all four fields are active. Enter the threshold value, and select units from the drop-down field (V or kV). Default is 23V. At the bottom of the screen is a graph that displays measured transient events, if any.
30

Lesson 6: Downloading Data from the Instrument All data sessions stored on the instrument can be downloaded to the computer. In addition to recorded measurements (see Lesson 4), this data can consist of:
• Photographs. These are "snapshots" taken using the CAMERA button on the instrument. This contains the data being measured by the instrument at the moment the CAMERA button was pressed.
• Alarms. These are events in which the instrument records a measurement that meets the criteria defined as an alarm condition (see Lesson 4, Step 3).
• Transients. Similar to alarms, these are short-lived events in which the instrument records a measurement that meets the criteria defined in the Transients tab of the Configure Instrument dialog box (see Lesson 4, Step 5).
• Inrush. This is data associated with inrush events, such as starting a motor, as defined in the Inrush tab of the Configure Instrument dialog box (see Lesson 4, Step 6). Note that Inrush is not available for the Model 8333.
• Monitoring. This is data recorded to monitor the system under test for compliance with EN 50160, a European-based standard designed to specify acceptable voltage characteristics of electricity supplied by public distribution systems (see Lesson 5).
Downloaded data files are saved on the computer’s hard drive with the file extension .icp. To view a list of data sessions currently stored on the connected instrument, select Recorded Sessions under the instrument’s name in the navigation frame. A list of stored data sessions is displayed in the data frame.
In the preceding example, we have highlighted Test1, the test we configured and ran in Lesson 4 of this tutorial. There are multiple ways to download data sessions from the instrument:
• Download an individual session.
• Download all sessions of a specific type (recordings, alarms, and so on).
• Download all sessions via the Control Panel.
• Download all recorded data directly from the instrument’s SD card (this option is not available for the Model 8435).
31
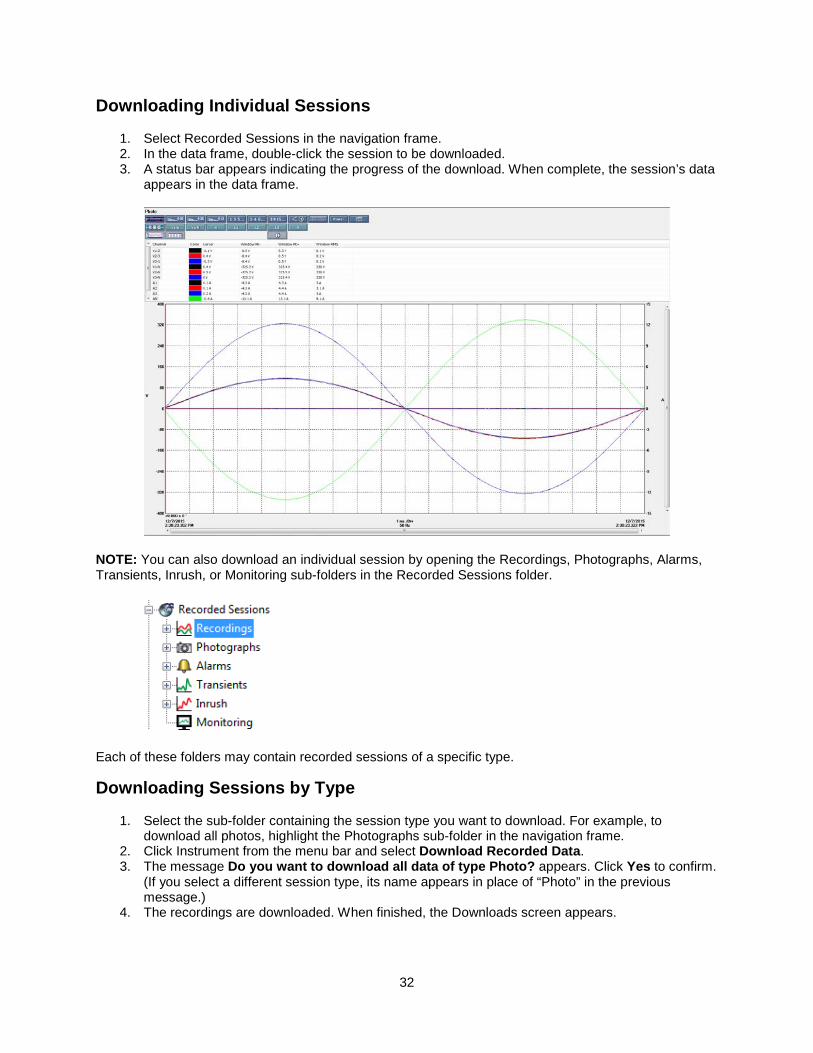
Downloading Individual Sessions
1. Select Recorded Sessions in the navigation frame. 2. In the data frame, double-click the session to be downloaded. 3. A status bar appears indicating the progress of the download. When complete, the session’s data
appears in the data frame.
NOTE: You can also download an individual session by opening the Recordings, Photographs, Alarms, Transients, Inrush, or Monitoring sub-folders in the Recorded Sessions folder.
Each of these folders may contain recorded sessions of a specific type.
Downloading Sessions by Type
1. Select the sub-folder containing the session type you want to download. For example, to download all photos, highlight the Photographs sub-folder in the navigation frame.
2. Click Instrument from the menu bar and select Download Recorded Data. 3. The message Do you want to download all data of type Photo? appears. Click Yes to confirm.
(If you select a different session type, its name appears in place of “Photo” in the previous message.)
4. The recordings are downloaded. When finished, the Downloads screen appears.
32

Downloading All Sessions
1. Select the Recorded Sessions folder in the navigation frame. 2. Click Instrument from the menu bar and select Download Recorded Data. 3. The message Do you want to download all data of type Recorded Sessions? appears. Click
Yes to confirm. 4. The sessions are downloaded. When finished, the Downloads screen appears.
Downloading from the SD Card For PowerPad III instruments (except the Model 8435) running firmware version 4.1 or later, the Read SD Card option in the Control Panel lets you download the contents of the SD card directly into a computer equipped with an SD card reader. This can save a significant amount of time, since downloading via USB cable can require many hours for large amounts of data. NOTE: The SD card contains recorded measurement data only. Snapshot, alarm, transient, inrush, and certain parameters of monitoring data are stored in the instrument’s Flash memory, and must be downloaded via a USB connection. This procedure does not apply to the Model 8435. Removing the SD card from the Model 8435 requires sending the instrument to AEMC or an authorized repair facility.
1. Remove the SD card from the instrument. Detailed instructions for how to do this can be found on Page 10 of this document: http://www.aemc.com/techbulletins/pdfs/Q115_Issue5.pdf. You can also view a video for how to do this here: https://www.youtube.com/watch?v=bWx3NfuGr1A.
2. Set the write protect lock tab of the SD card into the lock position, then insert the card into an available SD card reader slot on your computer. After a few moments, a prompt appears asking whether or not you want to format the SD card. Click Cancel in response to this prompt. If you format the card, you will lose all data stored on it.
33
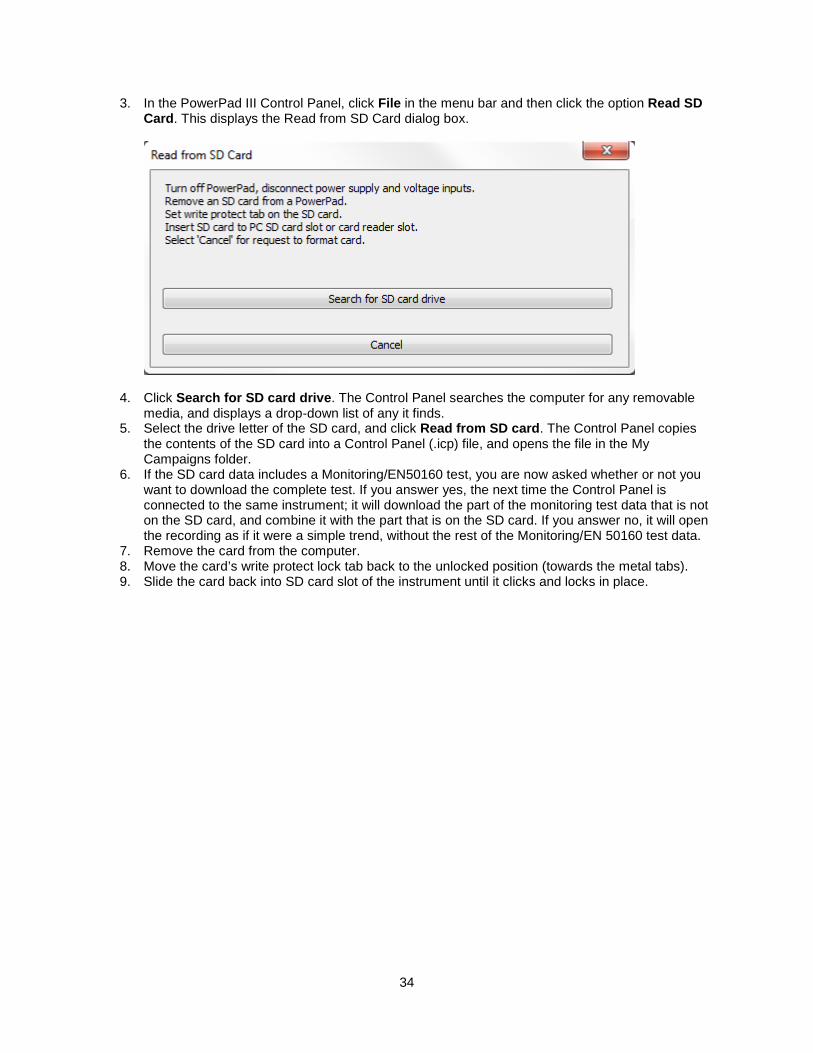
3. In the PowerPad III Control Panel, click File in the menu bar and then click the option Read SD Card. This displays the Read from SD Card dialog box.
4. Click Search for SD card drive. The Control Panel searches the computer for any removable media, and displays a drop-down list of any it finds.
5. Select the drive letter of the SD card, and click Read from SD card. The Control Panel copies the contents of the SD card into a Control Panel (.icp) file, and opens the file in the My Campaigns folder.
6. If the SD card data includes a Monitoring/EN50160 test, you are now asked whether or not you want to download the complete test. If you answer yes, the next time the Control Panel is connected to the same instrument; it will download the part of the monitoring test data that is not on the SD card, and combine it with the part that is on the SD card. If you answer no, it will open the recording as if it were a simple trend, without the rest of the Monitoring/EN 50160 test data.
7. Remove the card from the computer. 8. Move the card’s write protect lock tab back to the unlocked position (towards the metal tabs). 9. Slide the card back into SD card slot of the instrument until it clicks and locks in place.
34

Lesson 7: Creating Reports and Spreadsheets After you download data to the computer, you can use it to create a DataView report or Microsoft Excel-compatible spreadsheet.
Creating a DataView Report DataView reports are the primary tools for displaying and analyzing measurement data that has been recorded on your instrument and downloaded to your computer. Creating a DataView report involves the following general tasks:
1. Record and store measurement data on the instrument (Lessons 4 and 5). 2. Download this data and save it on the computer (Lesson 6). 3. Select the DataView template and data file for generating the report. 4. Generate and save the report.
This section describes how to perform tasks 3 and 4. The steps required to perform these tasks, and the order of these steps, can vary depending on where you are in the DataView software, how much customization you want to do to the report, and other factors. In this lesson, we discuss the simplest and quickest way to generate a report, which involves creating a report from a default template in the PowerPad III Control Panel. To do this, highlight the recording in the My Campaigns folder from which you want to create a report. In our example, we will use Test1. Then proceed as instructed below.
1. By default, the Control Panel comes with both a standard PowerPad III report template and a Monitoring/EN50160 report template. The templates can be viewed by clicking Tools in the menu bar, and then selecting Select Template. This displays the Templates dialog box, which lists all PowerPad III templates including any custom templates you have created.
35

2. The Control Panel automatically highlights the default template appropriate for the currently selected data session. You can change the template via the Select button (see the highlighted section in the preceding illustration). In this example we will leave the template selection as-is, so click OK.
3. We are now ready to create the report. Click File in the menu bar, and select Create DataView
Report. Alternatively, you can click the icon in the toolbar.
4. DataView creates a report using data from the selected session and formatting from the selected template. When finished, the report appears in a separate window:
5. To save the report, click File in the report window and select Save. Then complete the Save As dialog box to specify a file name and location.
NOTE: DataView report files are saved with the file extension .dvw. Be sure to save all reports with this extension, to ensure DataView and the Control Panel recognizes the file as a DataView report.
36

Creating a Microsoft Excel-Compatible Spreadsheet Stored and downloaded data can also be exported to a Microsoft Excel-compatible spreadheet. The steps for doing this are similar to creating a DataView report:
1. In My Campaigns, select the data session from which you want to create the spreadsheet.
2. Select File in the menu bar, and click Export to a Spreadsheet.
3. In the Save As dialog, specify a file name and location for the spreadsheet. (Excel-compatible files are saved with the file extension .xls or .cvs.) When finished, click Save.
4. The new spreadsheet appears in a separate window:
Exporting Large Amounts of Data DataView reports and Excel-compatible spreadsheets have maximum size limits for how much data they can contain. To accommodate larger recordings (a gigabyte or more), the report and spreadsheet creation processes include a few extra steps. Exporting to a Spreadsheet If you attempt to create a spreadsheet from a data session containing 2GB of data, the following dialog box appears after you select Export to a Spreadsheet from the File menu:
37
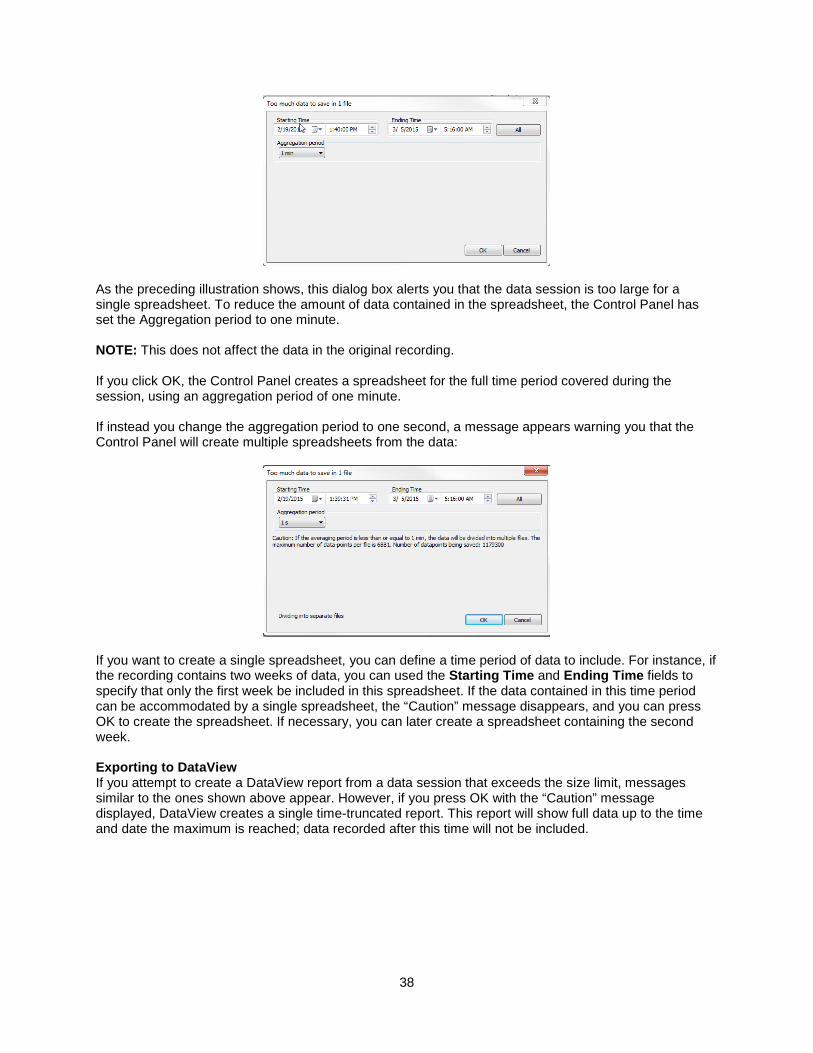
As the preceding illustration shows, this dialog box alerts you that the data session is too large for a single spreadsheet. To reduce the amount of data contained in the spreadsheet, the Control Panel has set the Aggregation period to one minute. NOTE: This does not affect the data in the original recording. If you click OK, the Control Panel creates a spreadsheet for the full time period covered during the session, using an aggregation period of one minute. If instead you change the aggregation period to one second, a message appears warning you that the Control Panel will create multiple spreadsheets from the data:
If you want to create a single spreadsheet, you can define a time period of data to include. For instance, if the recording contains two weeks of data, you can used the Starting Time and Ending Time fields to specify that only the first week be included in this spreadsheet. If the data contained in this time period can be accommodated by a single spreadsheet, the “Caution” message disappears, and you can press OK to create the spreadsheet. If necessary, you can later create a spreadsheet containing the second week. Exporting to DataView If you attempt to create a DataView report from a data session that exceeds the size limit, messages similar to the ones shown above appear. However, if you press OK with the “Caution” message displayed, DataView creates a single time-truncated report. This report will show full data up to the time and date the maximum is reached; data recorded after this time will not be included.
38
Contacting AEMC For instrument repair and calibration:
Chauvin Arnoux®, Inc. d.b.a. AEMC® Instruments 15 Faraday Drive Dover, NH 03820 USA Phone: (800) 945-2362 (Ext. 360) (603) 749-6434 (Ext. 360) Fax: (603) 742-2346 or (603) 749-6309 E-mail: [email protected] (Or contact your authorized distributor.) For Technical and Sales Assistance:
Chauvin Arnoux®, Inc. d.b.a. AEMC® Instruments 200 Foxborough Boulevard Foxborough, MA 02035 USA Phone: (800) 343-1391, (508) 698-2115 Fax: (508) 698-2118 E-mail: [email protected] www.aemc.com
39