Embed Size (px)
Citation preview
Bowling Green State University Bowling Green State University
ScholarWorks@BGSU ScholarWorks@BGSU
Masters of Education in Human Movement, Sport, and Leisure Studies Graduate Projects Human Movement, Sport, and Leisure Studies
2020
Using the Functional Movement Screen® and Y-Balance Test to Using the Functional Movement Screen® and Y-Balance Test to
Predict Injury in Division III Volleyball Players Predict Injury in Division III Volleyball Players
Kaycee Rowe Bowling Green State University, [email protected]
Follow this and additional works at: https://scholarworks.bgsu.edu/hmsls_mastersprojects
Repository Citation Repository Citation Rowe, Kaycee, "Using the Functional Movement Screen® and Y-Balance Test to Predict Injury in Division III Volleyball Players" (2020). Masters of Education in Human Movement, Sport, and Leisure Studies Graduate Projects. 84. https://scholarworks.bgsu.edu/hmsls_mastersprojects/84
This Article is brought to you for free and open access by the Human Movement, Sport, and Leisure Studies at ScholarWorks@BGSU. It has been accepted for inclusion in Masters of Education in Human Movement, Sport, and Leisure Studies Graduate Projects by an authorized administrator of ScholarWorks@BGSU.
Using the Functional Movement Screen® and Y-Balance Test to Predict Injury in
Division III Volleyball Players
Kaycee Rowe
Submitted to the School of Human Movement, Sport, and Leisure Studies
Bowling Green State University
In partial fulfillment of the requirements for the degree of
MASTER OF EDUCATION
In
Kinesiology
May 1, 2020
Project Advisor
Dr. Lynn Darby, Professor, School of HMSLS ________________________________________
Second Reader
Dr. Todd Keylock, Associate Professor, School of HMSLS ______________________________

2
Table of Contents
Abstract …………………………………………………………………………………………...3
Introduction ………………………………………………………………………………….........5
Methods …………………………………………………………………………………….........10
Results …………………………………………………………………………………………...20
Discussion ……………………………………………………………………………………….30
Conclusion ………………………………………………………………………………………35
References ……………………………………………………………………………………….36
Appendices ………………………………………………………………………………………40

3
Abstract
Volleyball participation has increased over the years; therefore, injury rates have also increased
(Agel, Palmieri-Smith, Dick, Wojtys, & Marshall, 2007). An accurate pre-participation screening
tool would be important to help reduce the risk of injury. Purpose: The purpose of this study
was to use the Functional Movement Screen® (FMS®) and Y-Balance Test (YBT) to predict
injury risk of Division III volleyball players during the competitive season. The FMS® and YBT
identify functional movement limitations and imbalances that might predispose an athlete to
injury (Bonazza, Onks, Silvis, & Dhawan, 2016; Cook, 2010; Cook, 2012; Lehr et al., 2013).
Method: Twenty-two female volleyball players (Mean ± S.D. Age: 19.5 ± 0.9 years) were
recruited for this study. Quantitative data were collected from each athlete prior to the beginning
of the competitive season and included administration of the FMS® and the YBT. Throughout
the season, any injuries reported were recorded by the certified athletic trainer at the time of the
injury. A one-way, between measures ANOVA was calculated to determine the significant
differences between the injured (n = 10) and non-injured (n = 12) groups and their FMS® and
YBT scores. To evaluate a composite score threshold for the development of injury, 2 2
contingency tables were created. These tables were also used to determine sensitivity, specificity,
1-specificity, and odds ratio for injury using each composite score, 13 through 18. Results:
There were no significant differences between FMS® scores of those players injured and not
injured (Mean ± S.D.: 15.5 ± 1.4 and 15.7 ± 2.5, respectively; p = .85). A score of 15 maximized
both sensitivity (0.40) and 1 – specificity (0.17). Odds ratio indicated that individuals who had a
composite threshold of 15 had 3.33 greater odds of becoming injured. There were no
significant differences between the injured group and the uninjured group when comparing
dominant and non-dominant YBT composite scores (p = .339, p = .326, respectively) or reach
4
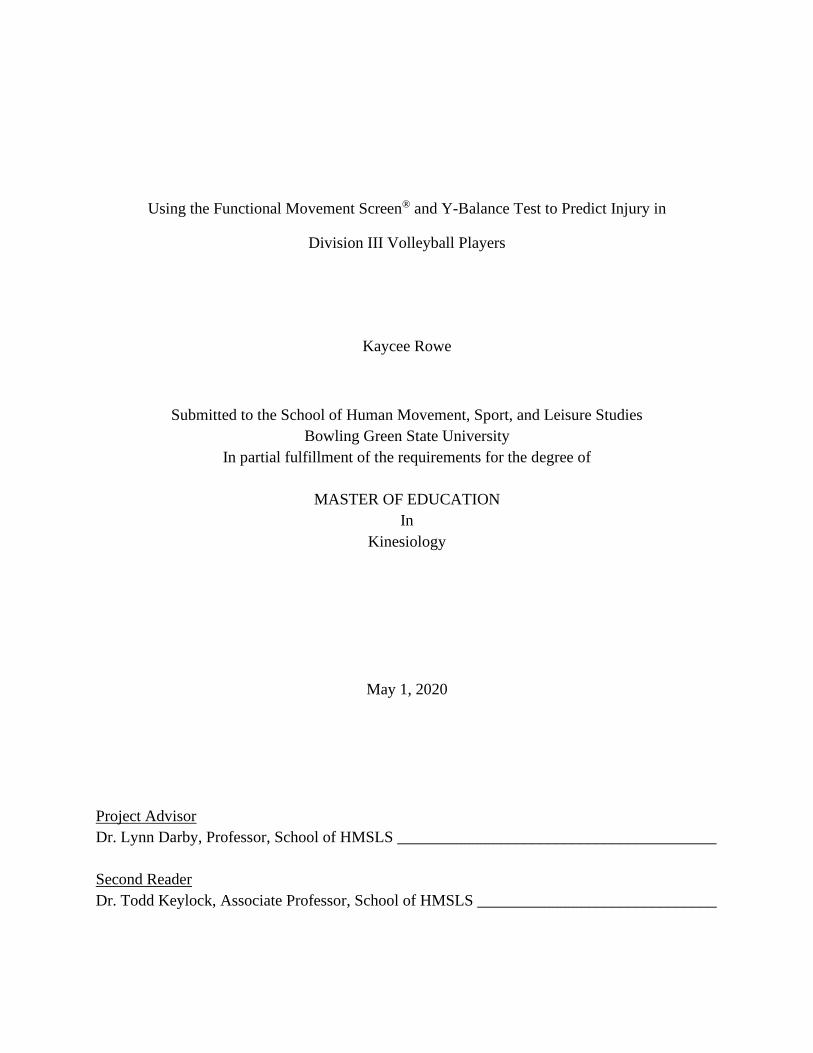
differences in the anterior, posteromedial, and posterolateral directions (p = .384, p = .333, p =
.463, respectively). Athletes with an FMS® composite score of 15 in this small sample had a
higher risk of becoming injured than those with scores > 15.
Keywords: Functional Movement Screen®, Y-Balance Test, injury, volleyball athletes

5
Introduction
Volleyball is a team sport that involves two teams of either six players (indoor volleyball)
or two players (beach volleyball) (NCAA, 2020). Volleyball consists of many sport-specific
skills including passing, setting, spiking, blocking, digging and serving. In indoor volleyball,
positions on the court include front row (left front, middle front, right front), back row (libero,
defensive specialist) and setter. The college indoor volleyball season lasts about four months
from August to November. NCAA Division III volleyball teams play approximately 30 games,
not including post-season tournaments (NCAA, 2020).
Participation in collegiate volleyball has grown over the years and like many sports,
injury rates for volleyball players have also increased (Agel, Palmieri-Smith, Dick, Wojtys, &
Marshall, 2007). Injuries can impact teams’ performances and athletes’ performances.
Approximately 40.6 injuries per 1,000 athlete-exposures have been reported in women’s
collegiate volleyball between all three divisions (Division I, Division II, Division III) (Reeser,
Gregory, Berg, & Comstock, 2015). Over the years of 1988-2004, there were more than 7,000
injuries reported between 50,000 practices and 90,000 games (Agel et al., 2007), with this
number increasing due to increasing participation rates. Those injuries reported included
head/neck, upper extremity, trunk/back, and lower extremity, with over half of these injuries to
the lower extremity (Agel et al., 2007; Lehr et al., 2013; Walbright, Walbright, Ojha &
Davenport, 2017).
Agel et al. (2007) investigated the epidemiology of women’s volleyball injuries from
1988-2004. Agel et al. (2007) researched injury rate by participation, division, and season. In
Division III, 25% of injuries came from no apparent contact and 54% of those injuries occurred
during practice (Agel et al., 2007). Player position also was a significant predictor of injuries,

6
with 67.3% of injuries happening in front row players (Agel et al., 2007). Hootman, Dick and
Agel (2007) found that 50% of those injuries occurred to the lower extremities including ankle
and anterior cruciate ligament (ACL) injuries.
Risk of injury can be measured by the probability of an incident and the consequences.
Risk factors can include extrinsic and intrinsic factors. Extrinsic factors might include weather,
temperature, or altitude. Extrinsic factors are less likely to contribute to injury in volleyball
players compared to intrinsic factors. Intrinsic risk factors include previous injury; low or high
body mass index; core motor control deficits; poor motor patterns; lack of flexibility, strength,
and range of motion; poor balance; and poor functional movements (Frost, Beach, Callaghan, &
McGill, 2012; Gonell, Pina Romera & Soler, 2015; Lehr et al., 2013).
Functional movement is defined as the ability to move the body with proper muscle and
joint function to produce a pain-free movement (Stenger, 2018). Functional movements relative
to volleyball include jumping, short sprints, multi-directional movements, and overhead
movements. Excessive jumping and repetitive overhead movements are two of the main causes
of injury in volleyball players (Eerkes, 2012). Imbalances and poor body mechanisms in these
movements can further contribute to the incidence of injury.
Functional Movement Screen®
The Functional Movement Screen® (FMS®) was designed to identify functional
movement limitations that might predispose an individual to injury (Bonazza, Smuin, Onks,
Silvis & Dhawan, 2016; Cook, Burton, Hoogenboom, & Voight, 2006; Lehr et al., 2013). The
screening includes seven functional tests and three clearing tests to grade whole body movement
quality. The functional tests include deep squat, hurdle step, in-line lunge, shoulder mobility,
active straight leg raise, trunk stability push-up, and rotary stability (Cook, 2010). Tests are
7
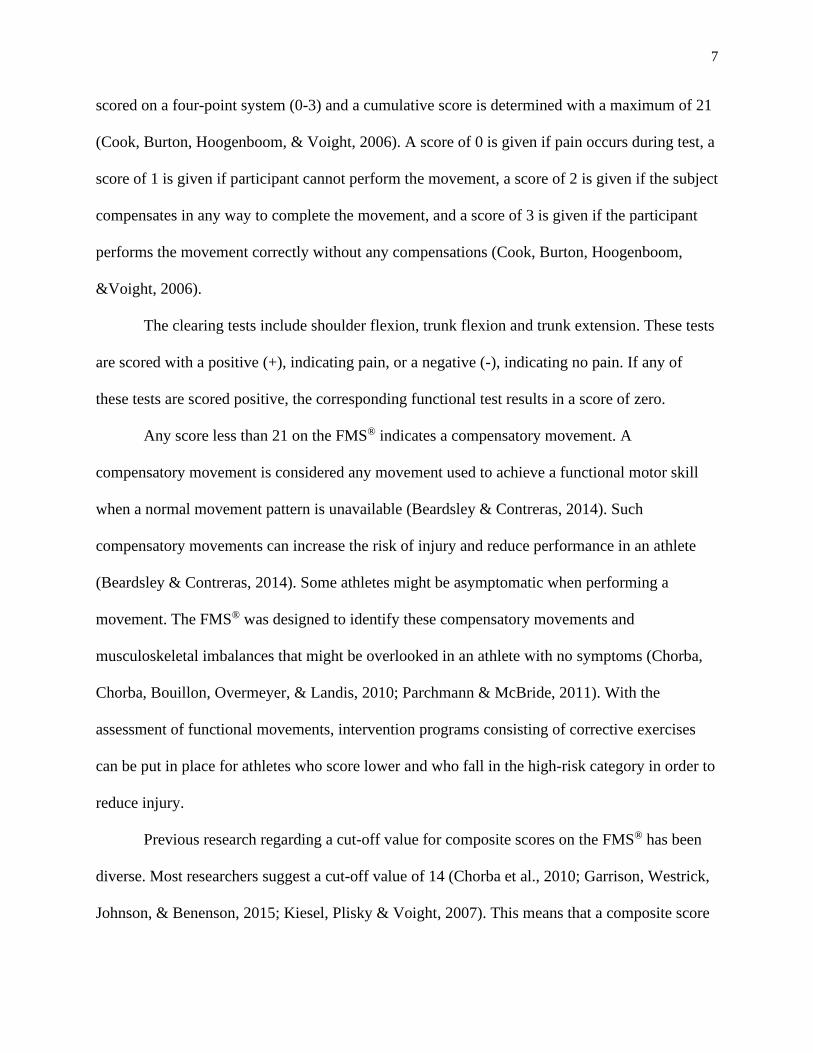
scored on a four-point system (0-3) and a cumulative score is determined with a maximum of 21
(Cook, Burton, Hoogenboom, & Voight, 2006). A score of 0 is given if pain occurs during test, a
score of 1 is given if participant cannot perform the movement, a score of 2 is given if the subject
compensates in any way to complete the movement, and a score of 3 is given if the participant
performs the movement correctly without any compensations (Cook, Burton, Hoogenboom,
&Voight, 2006).
The clearing tests include shoulder flexion, trunk flexion and trunk extension. These tests
are scored with a positive (+), indicating pain, or a negative (-), indicating no pain. If any of
these tests are scored positive, the corresponding functional test results in a score of zero.
Any score less than 21 on the FMS® indicates a compensatory movement. A
compensatory movement is considered any movement used to achieve a functional motor skill
when a normal movement pattern is unavailable (Beardsley & Contreras, 2014). Such
compensatory movements can increase the risk of injury and reduce performance in an athlete
(Beardsley & Contreras, 2014). Some athletes might be asymptomatic when performing a
movement. The FMS® was designed to identify these compensatory movements and
musculoskeletal imbalances that might be overlooked in an athlete with no symptoms (Chorba,
Chorba, Bouillon, Overmeyer, & Landis, 2010; Parchmann & McBride, 2011). With the
assessment of functional movements, intervention programs consisting of corrective exercises
can be put in place for athletes who score lower and who fall in the high-risk category in order to
reduce injury.
Previous research regarding a cut-off value for composite scores on the FMS® has been
diverse. Most researchers suggest a cut-off value of 14 (Chorba et al., 2010; Garrison, Westrick,
Johnson, & Benenson, 2015; Kiesel, Plisky & Voight, 2007). This means that a composite score
8
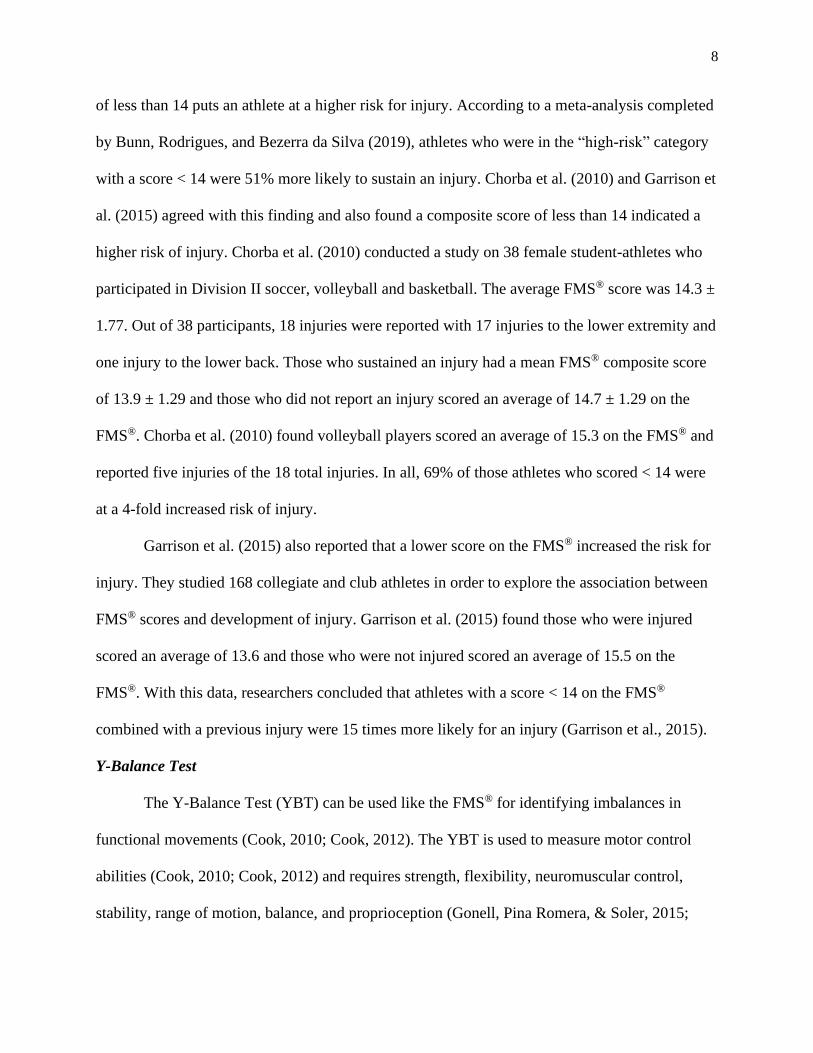
of less than 14 puts an athlete at a higher risk for injury. According to a meta-analysis completed
by Bunn, Rodrigues, and Bezerra da Silva (2019), athletes who were in the “high-risk” category
with a score < 14 were 51% more likely to sustain an injury. Chorba et al. (2010) and Garrison et
al. (2015) agreed with this finding and also found a composite score of less than 14 indicated a
higher risk of injury. Chorba et al. (2010) conducted a study on 38 female student-athletes who
participated in Division II soccer, volleyball and basketball. The average FMS® score was 14.3 ±
1.77. Out of 38 participants, 18 injuries were reported with 17 injuries to the lower extremity and
one injury to the lower back. Those who sustained an injury had a mean FMS® composite score
of 13.9 ± 1.29 and those who did not report an injury scored an average of 14.7 ± 1.29 on the
FMS®. Chorba et al. (2010) found volleyball players scored an average of 15.3 on the FMS® and
reported five injuries of the 18 total injuries. In all, 69% of those athletes who scored < 14 were
at a 4-fold increased risk of injury.
Garrison et al. (2015) also reported that a lower score on the FMS® increased the risk for
injury. They studied 168 collegiate and club athletes in order to explore the association between
FMS® scores and development of injury. Garrison et al. (2015) found those who were injured
scored an average of 13.6 and those who were not injured scored an average of 15.5 on the
FMS®. With this data, researchers concluded that athletes with a score < 14 on the FMS®
combined with a previous injury were 15 times more likely for an injury (Garrison et al., 2015).
Y-Balance Test
The Y-Balance Test (YBT) can be used like the FMS® for identifying imbalances in
functional movements (Cook, 2010; Cook, 2012). The YBT is used to measure motor control
abilities (Cook, 2010; Cook, 2012) and requires strength, flexibility, neuromuscular control,
stability, range of motion, balance, and proprioception (Gonell, Pina Romera, & Soler, 2015;

9
Hudson, Garrison, & Pollard, 2016). Single-leg balance is assessed when completing the YBT
and absolute reach distance is measured in three directions: anterior, posteromedial, and
posterolateral. The test is performed on each leg, and comparisons between leg distances can be
used to assess any asymmetry or balance deficits.
For the YBT, the maximal reach distance is recorded where the most distal part of the
foot (i.e., toe) reaches on the measurement stick. This is measured for all three directions and for
each leg. Failed attempts occur when a person loses balance, places the foot on the top of the
measurement indicator, or kicks the indicator to improve the score. The composite score is
calculated by adding the measured anterior, posteromedial, and posterolateral directions, then
dividing the sum by three times the participant’s limb length, and multiplying that number by
100 in order to calculate a percentage. Limb length is measured from the most noticeable portion
of the greater trochanter and the floor while in a standing position. Reach difference for each
direction can be calculated by subtracting the non-dominant limb from the dominant limb in that
direction (Walker, 2016).
Hudson et al. (2016) studied YBT in Division I collegiate volleyball players to determine
normative values. These researchers studied 90 female collegiate volleyball players from eight
different universities. Of these 90 players, 24 were middle blockers, 18 defensive
specialist/liberos, 26 outside hitters, 7 right side hitters, and 15 setters. The dominant leg
composite score was 94.1% ± 6.6% and non-dominant leg composite score was 93.9% ± 6.2%.
Hudson et al. (2016) also explored mean composite scores for each position. They found right
side hitters to have the highest composite score in both the dominant (95.7%) and non-dominant
(94.9%) legs. Setters had the second highest composite score with 94.7% dominant leg and
94.1% non-dominant leg. Overall, there were no significant mean differences for the reach

10
differences between any positions in this study. However, other researchers have suggested that a
reach difference > 4 cm between dominant and non-dominant legs increases the risk for injury
(Smith, Chimera, & Warren, 2014).
Smith, Chimera, and Warren (2014) conducted a study to examine the association of the
YBT and noncontact season injury with Division I college athletes from a variety of sports. The
study included 200 athletes playing men’s and women’s basketball, men’s and women’s cross-
country, men’s football, women’s golf, men’s and women’s track and field, men’s and women’s
tennis, women’s volleyball, women’s soccer, and women’s swimming/diving. A total of 81
participants reported a noncontact injury. However, composite scores did not significantly differ
from those who were injured (101.3% ± 7.8%) and those not injured (101.2% ± 7.1%). Smith,
Chimera, & Warren (2014) compared all reach directions (anterior, posteromedial,
posterolateral) and found an asymmetry greater than or equal to 4 cm between dominant and
non-dominant legs had greater odds of injury compared to those with less than 4 cm asymmetry.
Injury prevention is important in helping athletes achieve their training goals, as well as
keeping them safe and healthy. Predicting injury risk can aid in injury prevention programs.
Therefore, the purpose of this study was to use the FMS® and YBT to predict injury risk in
Division III volleyball players. The functional movement of female volleyball players and their
risk of injury was assessed during their competitive season.
Methods
Participants
Female collegiate volleyball athletes (N=23) at a small, Midwestern private Division III
university participated in this study. The mean age of the total group was 19.5 ± 0.9 years with
six freshmen, seven sophomores, four juniors and four seniors. The mean height was 67.3 in. ±
3.4 in. and the mean body mass index (BMI) value was 22.9 kg/m2 ± 1.9 kg/m2. Nine athletes
11
were strictly front row players, eight athletes played only back row, two athletes played front and
back row, two athletes played back row and setter and two athletes played setter.
Research Design
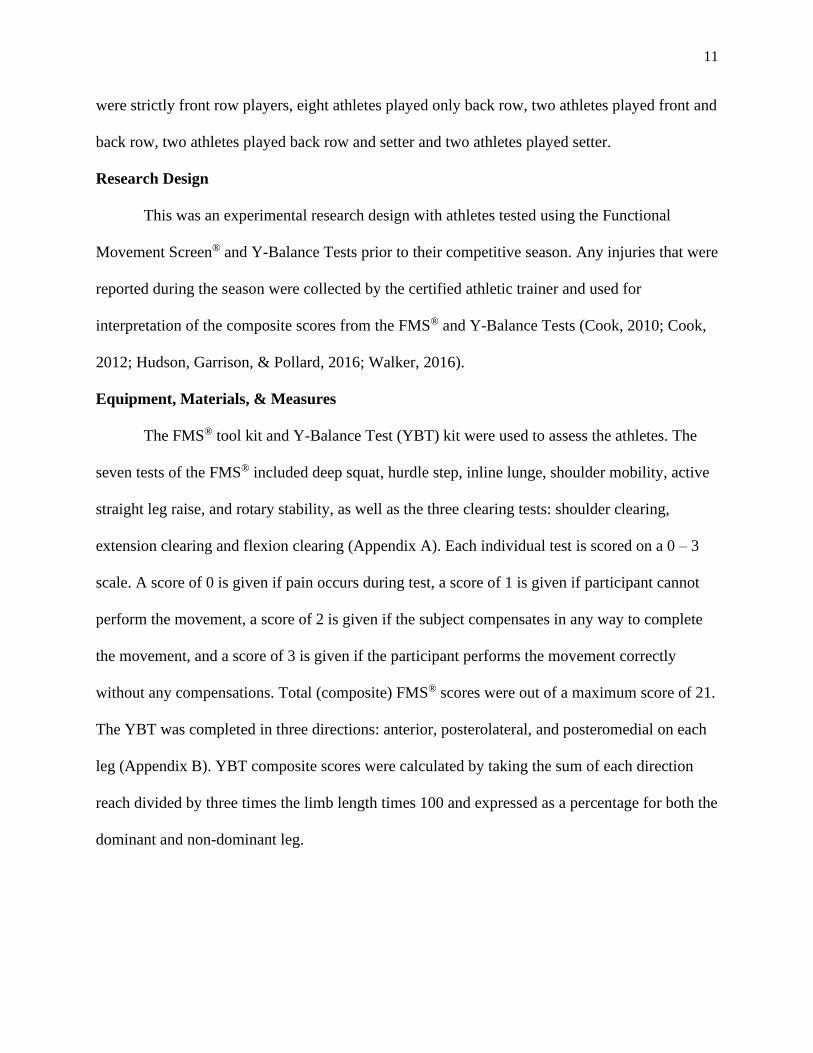
This was an experimental research design with athletes tested using the Functional
Movement Screen® and Y-Balance Tests prior to their competitive season. Any injuries that were
reported during the season were collected by the certified athletic trainer and used for
interpretation of the composite scores from the FMS® and Y-Balance Tests (Cook, 2010; Cook,
2012; Hudson, Garrison, & Pollard, 2016; Walker, 2016).
Equipment, Materials, & Measures
The FMS® tool kit and Y-Balance Test (YBT) kit were used to assess the athletes. The
seven tests of the FMS® included deep squat, hurdle step, inline lunge, shoulder mobility, active
straight leg raise, and rotary stability, as well as the three clearing tests: shoulder clearing,
extension clearing and flexion clearing (Appendix A). Each individual test is scored on a 0 – 3
scale. A score of 0 is given if pain occurs during test, a score of 1 is given if participant cannot
perform the movement, a score of 2 is given if the subject compensates in any way to complete
the movement, and a score of 3 is given if the participant performs the movement correctly
without any compensations. Total (composite) FMS® scores were out of a maximum score of 21.
The YBT was completed in three directions: anterior, posterolateral, and posteromedial on each
leg (Appendix B). YBT composite scores were calculated by taking the sum of each direction
reach divided by three times the limb length times 100 and expressed as a percentage for both the
dominant and non-dominant leg.

12
Interrater Reliability of the FMS and YBT
Interrater reliability has been reported to be acceptable for the FMS®; interclass
correlation coefficients (ICC) have ranged from 0.76 to 0.98. Bonazza, Smuin, Onks, Silvis and
Dhawan (2017) supported this by reporting that nine of 10 studies found the FMS® reliable.
Bonazza, Smuin, Onks, Silvis and Dhawan (2017) also found that the level of experience
administering the FMS® did not consistently affect this reliability. The YBT has also been
reported to have high interrater reliability with ICC of 0.80-0.85 and interrater reliability of 0.99-
1.00 (Walker, 2016).
The FMS® tests were completed in the following order:
Deep Squat Test
The individual stands with feet shoulder-width apart with toes pointing forward. A rod is
in both hands and placed on top of their head with elbows at 90 degrees. The rod is then pressed
straight above head and the individual squats as low as possible, maintaining an upright torso and
keeping heels and toes in position. The individual holds the bottom position for one second and
returns to starting position. The individual’s lateral and anterior views during the movement are
compared to the FMS® pictures with ratings (Cook, 2010).
Hurdle Step Test
The individual stands tall with feet together and toes touching test kit. The rod is in both
hands and placed across the back of the shoulders. While maintaining an upright position, the
individual raises right leg and steps over the hurdle. The individual should attempt to raise the
foot towards the shin and maintain foot alignment with hip, ankle, and knee. The individual will
touch the floor with their heel on opposite side of test kit and return to starting position
maintaining alignment. The test is repeated on the left side. The individual’s lateral and anterior
views during the movement are compared to the FMS® pictures with ratings (Cook, 2010).

13
In-Line Lunge Test
The individual steps onto center of the board with left toes on the zero mark. The right
heel should be placed at tibial height measurement. The rod is placed along spine in contact with
head, upper back, and tailbone. While maintaining an upright posture, the individual will
descend into a lunge position so left knee makes contact with center of board and returns to
starting position. The test is repeated on the opposite side with the individual’s right toes at the
zero mark and their left heel at their tibial height measurement. The individual’s lateral and
anterior views during the movement are compared to the FMS® pictures with ratings (Cook,
2010).
Shoulder Mobility Test
The individual starts standing tall with feet together and arms hanging comfortable at
their side. A fist is made by placing their thumb into their fingers. In one motion, they will reach
their right fist over their head and down their back while their left fist reaches up their back as far
as possible. The individual should make sure not to “creep” their fists together after initial
placement. The test is repeated on the opposite side. The individual’s lateral and anterior views
during the movement are compared to the FMS® pictures with ratings (Cook, 2010).
Shoulder Clearing Test
Individual places one hand on opposite shoulder and lifts elbow while maintaining
contact on shoulder. This test is completed on both sides of the body. If pain occurs, a score of
zero is given for the shoulder mobility test.
Active Straight Leg Raise Test
The individual lies flat on their back with knees against the board, feet together and toes
pointing up. The rod is placed halfway between the anterior superior iliac spine (ASIS) and
14
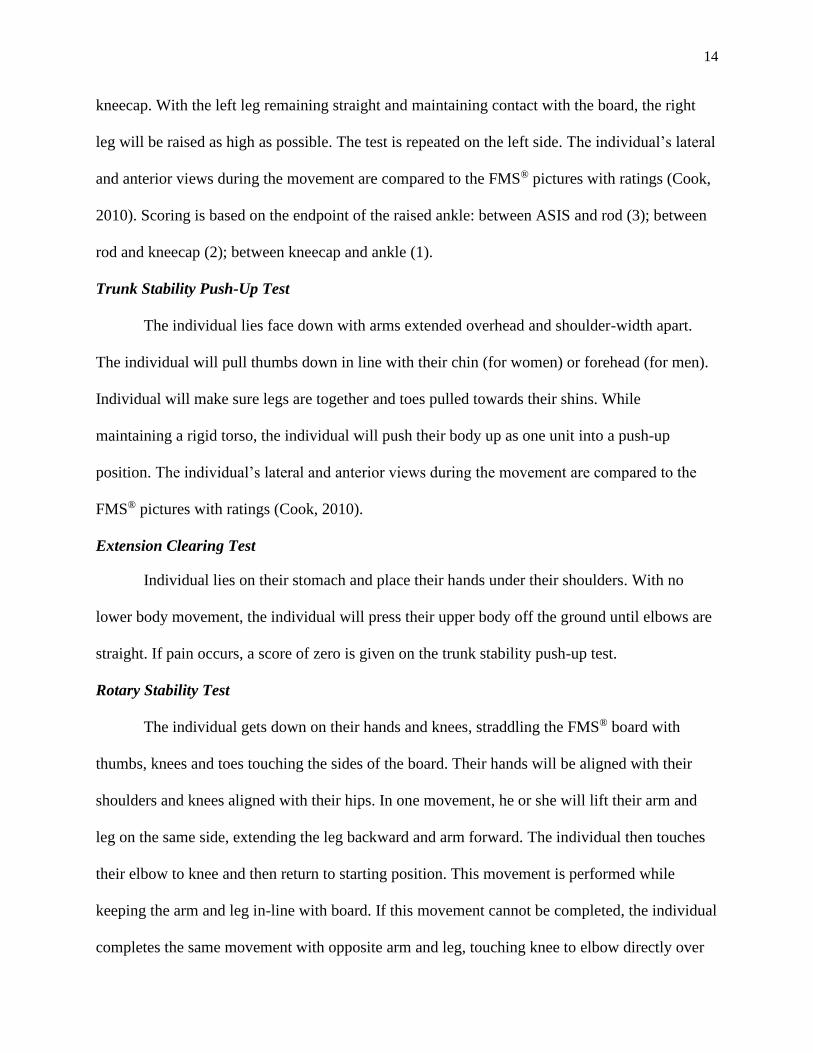
kneecap. With the left leg remaining straight and maintaining contact with the board, the right
leg will be raised as high as possible. The test is repeated on the left side. The individual’s lateral
and anterior views during the movement are compared to the FMS® pictures with ratings (Cook,
2010). Scoring is based on the endpoint of the raised ankle: between ASIS and rod (3); between
rod and kneecap (2); between kneecap and ankle (1).
Trunk Stability Push-Up Test
The individual lies face down with arms extended overhead and shoulder-width apart.
The individual will pull thumbs down in line with their chin (for women) or forehead (for men).
Individual will make sure legs are together and toes pulled towards their shins. While
maintaining a rigid torso, the individual will push their body up as one unit into a push-up
position. The individual’s lateral and anterior views during the movement are compared to the
FMS® pictures with ratings (Cook, 2010).
Extension Clearing Test
Individual lies on their stomach and place their hands under their shoulders. With no
lower body movement, the individual will press their upper body off the ground until elbows are
straight. If pain occurs, a score of zero is given on the trunk stability push-up test.
Rotary Stability Test
The individual gets down on their hands and knees, straddling the FMS® board with
thumbs, knees and toes touching the sides of the board. Their hands will be aligned with their
shoulders and knees aligned with their hips. In one movement, he or she will lift their arm and
leg on the same side, extending the leg backward and arm forward. The individual then touches
their elbow to knee and then return to starting position. This movement is performed while
keeping the arm and leg in-line with board. If this movement cannot be completed, the individual
completes the same movement with opposite arm and leg, touching knee to elbow directly over

15
the board. The test is performed on each side and scored. The individual’s lateral and anterior
views during the movement are compared to the FMS® pictures with ratings (Cook, 2010).
Flexion Clearing Test
In the same starting position as the rotary stability, the individual will rock their hips back
towards their heels. They will lower their chest to their knees and reach their hands out in front
of their body. If pain occurs, a score of zero will be given on the rotary stability test.
Rater Reliability
For the present study, a certified Level I examiner completed all FMS® testing. The rater
reliability of this tester was assessed by comparing the tester’s ratings to two other FMS® Level I
Certified examiners to establish interrater reliability. Twelve subjects were recruited and
evaluated in all seven tests and three clearing tests by all three raters. An Intraclass Correlation
Coefficient (ICC) for the total FMS® scores was calculated to determine interrater reliability
among three raters. The Krippendorff’s alpha (KALPHA) test was used (Hayes & Krippendorff,
2007) to estimate the interrater reliability for each individual FMS® test. A KALPHA score of .8
or above indicates acceptable reliability, where 1.00 indicates perfect reliability and 0.00
indicating no reliability (Hayes and Krippendorff, 2007).
ICC was 0.952 with the lower and upper 95% Confidence Intervals (CI) of .879 and .985,
respectively. This indicates that there was high reliability among the raters. KALPHA was
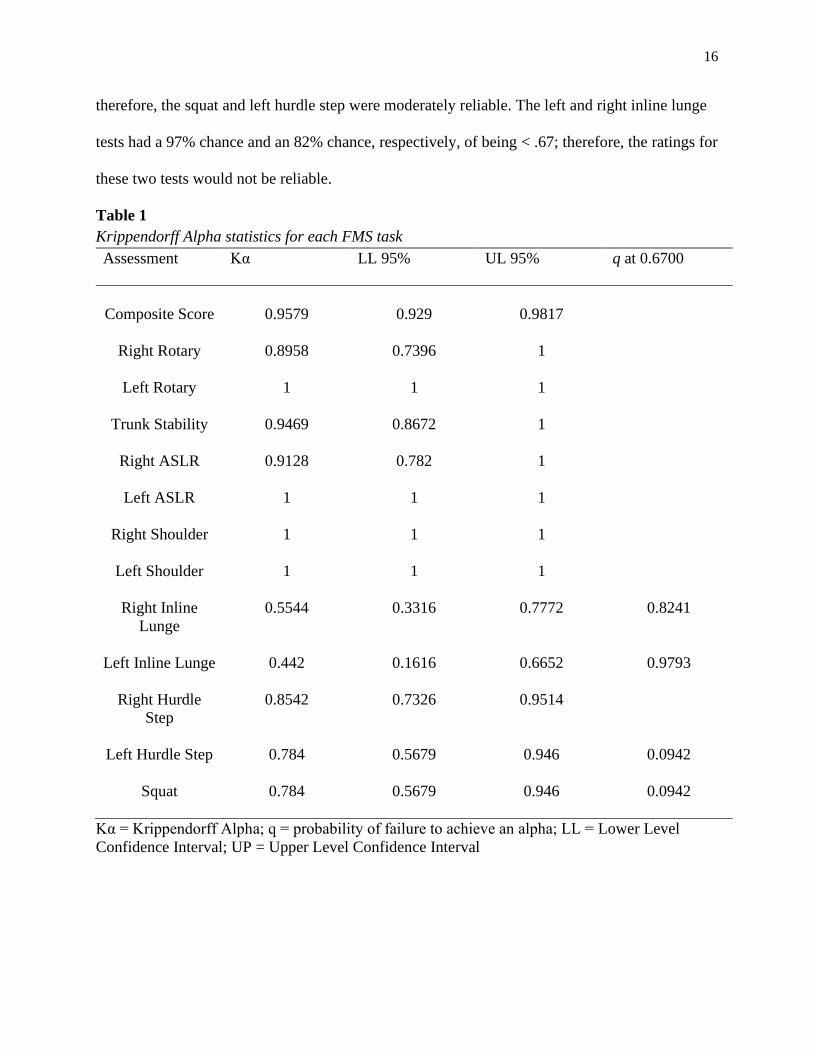
calculated on each of the FMS® test scores. The interrater reliability was high (Kα > .80) for all
single FMS® tasks with the exception of the right inline lunge, left inline lunge, left hurdle step,
and squat (Kα = .55, Kα = .44, Kα = .78, Kα = .78, respectively; see Table 1). The probability
that the Kα would not be acceptable is interpreted from the q values (i.e., < .67 if 10000
participants were tested). Both the squat and left hurdle step have a 9% chance of being < .67;
16
therefore, the squat and left hurdle step were moderately reliable. The left and right inline lunge
tests had a 97% chance and an 82% chance, respectively, of being < .67; therefore, the ratings for
these two tests would not be reliable.
Table 1
Krippendorff Alpha statistics for each FMS task
Assessment Kα LL 95% UL 95% q at 0.6700
Composite Score
0.9579
0.929
0.9817
Right Rotary 0.8958 0.7396 1
Left Rotary 1 1 1
Trunk Stability 0.9469 0.8672 1
Right ASLR 0.9128 0.782 1
Left ASLR 1 1 1
Right Shoulder 1 1 1
Left Shoulder 1 1 1
Right Inline
Lunge
0.5544 0.3316 0.7772 0.8241
Left Inline Lunge 0.442 0.1616 0.6652 0.9793
Right Hurdle
Step
0.8542 0.7326 0.9514
Left Hurdle Step 0.784 0.5679 0.946 0.0942
Squat 0.784 0.5679 0.946 0.0942
Kα = Krippendorff Alpha; q = probability of failure to achieve an alpha; LL = Lower Level
Confidence Interval; UP = Upper Level Confidence Interval

17
Procedures
After approval of the study from the Institutional Review Board at the two midwestern
higher education institutions, participants were recruited from the women’s volleyball team at a
Division III university. An information session was held at a team meeting with all team
members in attendance. A description of the study, research protocol, benefits, and risks were
presented to all team members. All questions were answered and team members had the
opportunity to sign-up to volunteer for the study. Volunteers selected available testing times. The
day prior to testing, individuals were sent a text message with a reminder of their testing times.
Each testing session was done individually to protect the privacy of the participant and
was completed prior to the competitive season. During the testing session, participants completed
the informed consent document (see Appendix C), and a Health Insurance Portability and
Accountability Act (HIPAA) document (see Appendix D). Five participants were asked to fill
out a consent document for pictures to be taken during testing procedures and used in
publications.
Height and weight was self-reported by participants and BMI was calculated by
researcher. Each individual’s hand length, tibia length, and leg length were measured. All
measurements were taken on the individual’s dominant side. The hand length was measured
from the tip of the middle finger to the bottom of the palm. The tibia length was measured from
the individual’s tibial tuberosity to the floor. Leg length was measured from the anterior superior
iliac spine (ASIS) to the floor. Cook (2010) testing protocol for the FMS® was followed and tests
were administered in the order of deep squat, hurdle step, inline lunge, shoulder mobility,
shoulder clearing test, active straight-leg raise, trunk stability push-up, extension clearing test,
rotary stability, and the flexion clearing test. The participant had a maximum of three attempts
for each test.
18
Following the FMS®, the YBT was administered using the recommended protocol
(Walker, 2016). The right foot was used to push the indicator box three times, or until the last
attempt was shorter than the longest attempt and this procedure was repeated for the left foot.
The order of the procedure was completed in the anterior, posteromedial, and posterolateral
directions. Each direction was completed on each foot before moving on to the next direction.
During the competitive season, all injuries were documented by the volleyball team’s
certified athletic trainer using SportsWare software (Computer Sports Medicine; Stoughton,
Massachusetts). After the competitive season, all injuries reported during the season were
collected by the researcher in partnership with the certified athletic trainer. This information
included type of injury, if an athlete received treatment, if an athlete lost participation time, and
if so, for how long. All participants who completed the study had their name placed in a drawing
for a $15 Chipotle gift card and the gift card was awarded.
Statistical Analysis
All data were analyzed using IBM SPSS Statistics 26 software (IBM Corporation;
Armonk, New York). The mean was utilized as a measure of central tendency. To evaluate
differences in composite FMS® scores and YBT scores between the injured and uninjured
groups, a one-way, between measures ANOVA (Injury Status: Injured, Not Injured) was
calculated to determine if there were significant differences between these two groups.
Significance of p ≤ .05 was set a priori for all analyses.
To evaluate a composite score threshold for the development of injury, 2 2 contingency
tables were created. Sensitivity is the probability that the clinical test results, in this study the
FMS® cut-off test score, identifies those people who are positive (i.e., injured; who actually have
the condition; true positive; see Figure 1) (Kuzma, 1998). Specificity is the probability that the
19
clinical test, in this study the FMS® cut-off test score, identifies those people who are negative
(i.e., noninjured; who are in reality without the condition; true negative; see Figure 1) (Kuzma,
1998). For this study, odds ratio quantifies the strength of the association between an exposure
and an outcome, where the exposure is an FMS® score less than the cut-off score and the
outcome is an injury (Kuzma, 1998). If the odds ratio is > 1 there is a significant correlation
between the FMS® score below the cut-off score and the presence of injury. Thus meaning, the
presence of an FMS® score below the cut-off score increases the odds of having an injury. If the
odds ratio is < 1 there would be a negative correlation and the presence of the exposure (i.e.,
FMS® score below the cut-off score) would reduce the odds of having an injury (Kuzma, 1998).
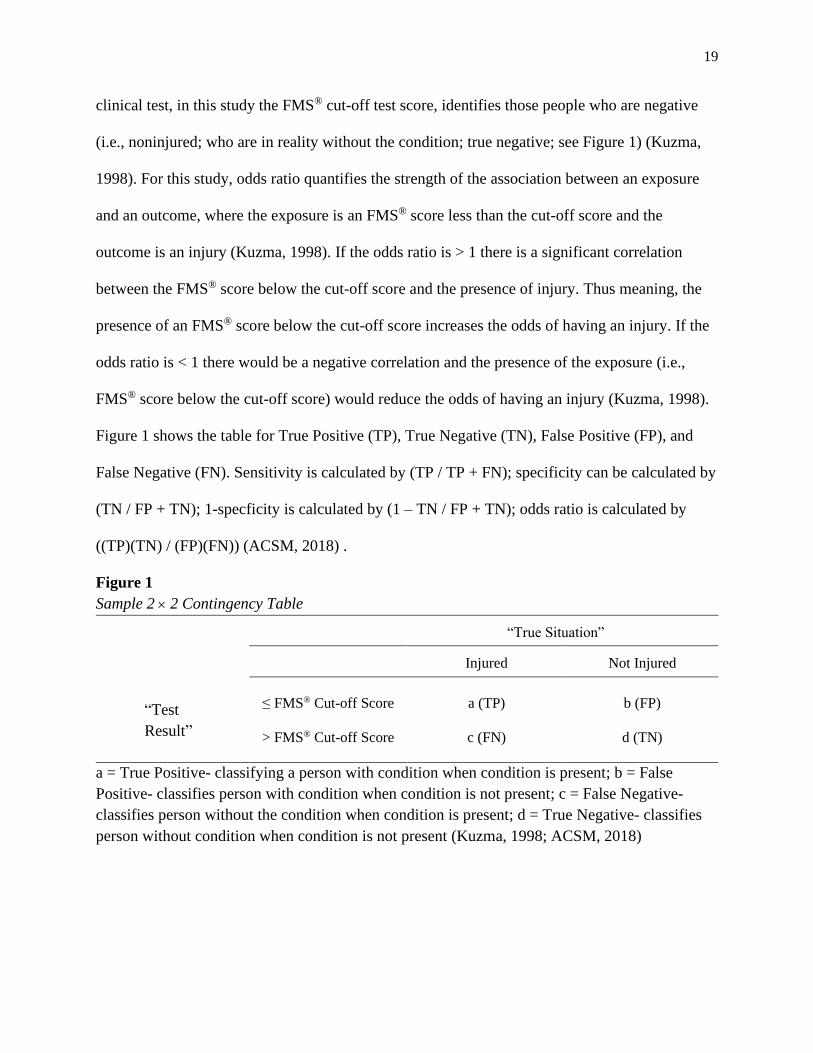
Figure 1 shows the table for True Positive (TP), True Negative (TN), False Positive (FP), and
False Negative (FN). Sensitivity is calculated by (TP / TP + FN); specificity can be calculated by
(TN / FP + TN); 1-specficity is calculated by (1 – TN / FP + TN); odds ratio is calculated by
((TP)(TN) / (FP)(FN)) (ACSM, 2018) .
Figure 1
Sample 2 2 Contingency Table
“True Situation”
Injured Not Injured
≤ FMS® Cut-off Score
a (TP)
b (FP)
> FMS® Cut-off Score
c (FN)
d (TN)
a = True Positive- classifying a person with condition when condition is present; b = False
Positive- classifies person with condition when condition is not present; c = False Negative-
classifies person without the condition when condition is present; d = True Negative- classifies
person without condition when condition is not present (Kuzma, 1998; ACSM, 2018)
“Test
Result”

20
A receiver-operator characteristic (ROC) curve was calculated plotting sensitivity versus
1-specificity to show how sensitivity and specificity varied for each cut-off score. The area under
the curve gives a graphic representation of using the various cut-off scores. A significant cut-off
score will maximize sensitivity (probability of TP) and specificity (probability of TN) as
compared to the other possible cut-off scores.
Results
There were 23 female volleyball players at a Division III university who were tested
using the FMS® and YBT. There was one dropout; therefore, 22 players completed the study.
Demographic data for the athletes are shown in Table 2. A frequency table with the athletes
characteristics is shown in Table 3.
Table 2
Demographics of the Female Volleyball Athletes (N=22)
Variable
Mean ± SD
Age (years)
19.5 ± .9
Height (in) 67.3 ± 3.4
Weight (lbs) 150.5 ± 19.3
Body Mass Index (kg/m2) 23.3 ± 2.3
Dominant Hand Length (cm) 16.0 ± 1.0
Dominant Tibia Length (cm) 43.3 ± 2.1
Dominant Leg Length (cm) 96.8 ± 5.1
S.D. = Standard Deviation
21
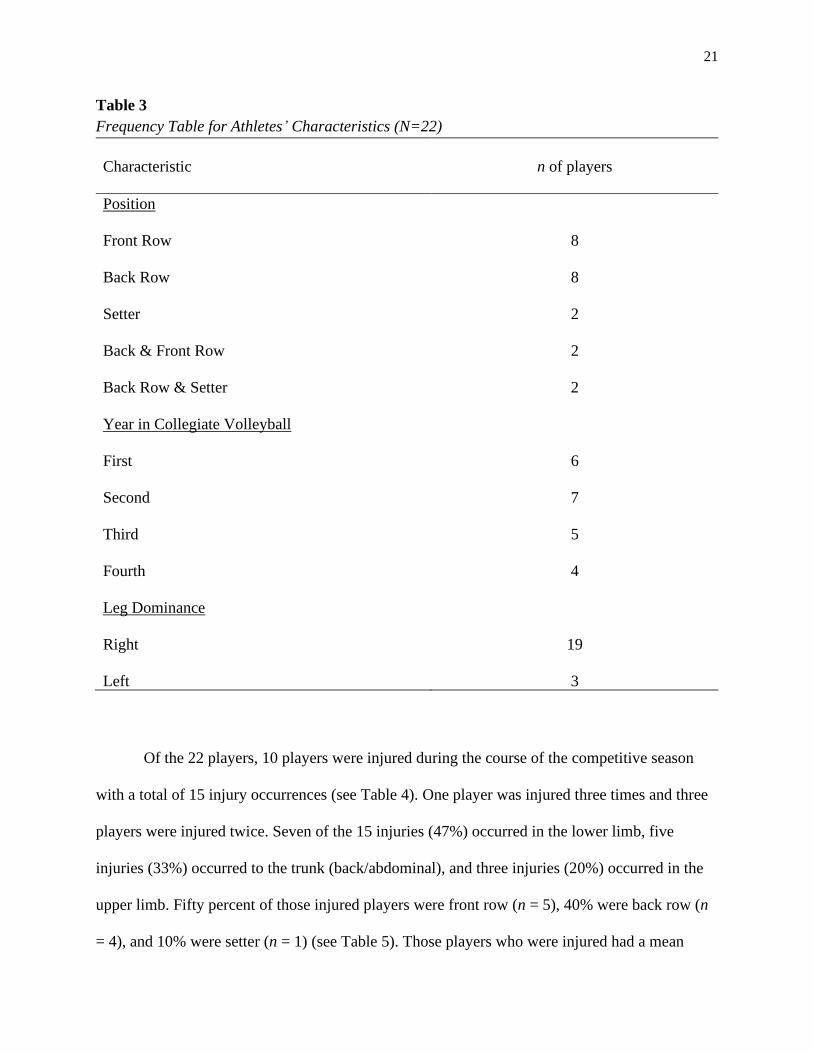
Table 3
Frequency Table for Athletes’ Characteristics (N=22)
Characteristic
n of players
Position
Front Row
Back Row
Setter
Back & Front Row
Back Row & Setter
Year in Collegiate Volleyball
First
Second
Third
Fourth
Leg Dominance
Right
Left
8
8
2
2
2
6
7
5
4
19
3
Of the 22 players, 10 players were injured during the course of the competitive season
with a total of 15 injury occurrences (see Table 4). One player was injured three times and three
players were injured twice. Seven of the 15 injuries (47%) occurred in the lower limb, five
injuries (33%) occurred to the trunk (back/abdominal), and three injuries (20%) occurred in the
upper limb. Fifty percent of those injured players were front row (n = 5), 40% were back row (n
= 4), and 10% were setter (n = 1) (see Table 5). Those players who were injured had a mean
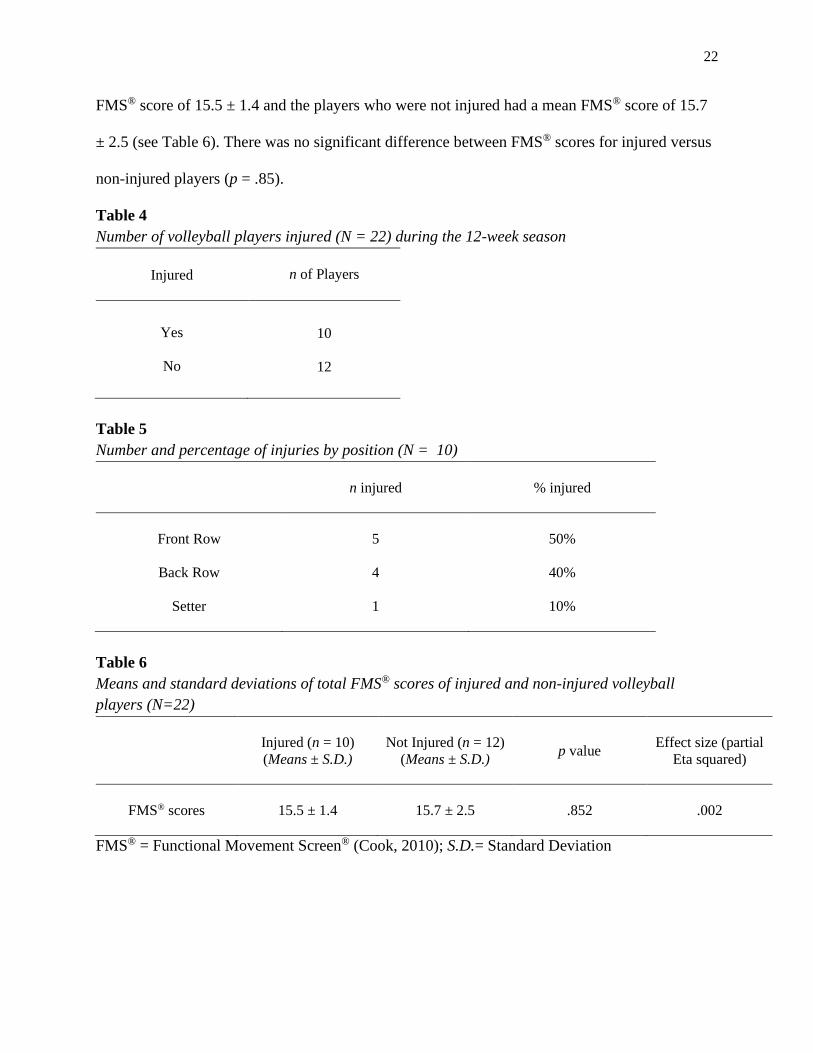
22
FMS® score of 15.5 ± 1.4 and the players who were not injured had a mean FMS® score of 15.7
± 2.5 (see Table 6). There was no significant difference between FMS® scores for injured versus
non-injured players (p = .85).
Table 4
Number of volleyball players injured (N = 22) during the 12-week season
Injured
n of Players
Yes
No
10
12
Table 5
Number and percentage of injuries by position (N = 10)
n injured
% injured
Front Row
5
50%
Back Row
4 40%
Setter
1 10%
Table 6
Means and standard deviations of total FMS® scores of injured and non-injured volleyball
players (N=22)
Injured (n = 10)
(Means ± S.D.)
Not Injured (n = 12)
(Means ± S.D.) p value
Effect size (partial
Eta squared)
FMS® scores
15.5 ± 1.4
15.7 ± 2.5
.852
.002
FMS® = Functional Movement Screen® (Cook, 2010); S.D.= Standard Deviation

23
There were approximately 180 hours of playing time between all practices and the
competitive season of 31 games. About 50 total hours of playing time was missed for those
injured players. Six players missed one to three days of participation, one player missed seven to
nine days and one player missed more than 10 days of participation due to their injuries (see
Table 7). Other injuries resulted in limited repetitions in practice.
Table 7
Number of Days of Participation Missed by Injured Volleyball Players
Number of Days of Participation Missed
Number of Athletes (n = 10)
0 days
2
1 – 3 days
6
4 – 6 days
0
7 – 9 days
1
10+ days 1
Participation = games or practices
Five of the seven individual FMS® tasks can identify asymmetries between the left and
right sides of the body (hurdle step, inline lunge, shoulder mobility, active straight leg raise, and
rotary stability). There were no significant differences found between left and right sides (see
Table 8). The lowest score (scale of 0-3) of the two sides was included in the composite FMS®
score. Athletes (N = 22) scored the highest on the active straight leg raise test with a mean FMS®
task score of 2.9 ± 0.3 (ASLR-left = 3.0 ± 0.2 and ASLR-right = 2.9 ± 0.3; see Table 8). Athletes
who were injured (n = 10) scored the lowest on the trunk stability test with a mean FMS® task
score of 1.1 ± 0.3 (see Table 8). Athletes who were injured (n = 10) had a mean FMS® task score

24
of 3.0 ± 0.0 on the shoulder mobility- right, while those athletes who were not injured (n = 12)
had a lower average FMS® task score of 2.4 ± 0.8 on the shoulder mobility- right (see Table 8).
Table 8
FMS® Individual Test Scores
FMS® Test
FMS® Score (N = 22)
Mean ± S.D.
Range (0-3)
FMS® Score of
Injured (n = 10)
Means ± S.D.
Range (0-3)
FMS® Score of
Non-Injured
(n = 12)
Means ± S.D.
Range (0-3)
Squat 2.5 ± .6 2.6 ± .5 2.3 ± .7
Hurdle Step- Left 2.2 ± .4 2.2 ± .4 2.2 ± .4
Hurdle Step- Right 2.2 ± .43 2.1 ± .3 2.3 ± .5
Inline Lunge- Left 2.7 ± .5 2.7 ± .5 2.7 ± .5
Inline Lunge- Right 2.7 ± .5 2.7 ± .5 2.8 ± .5
Shoulder Mobility-
Left
2.4 ± .7 2.6 ± .5 2.2 ± .8
Shoulder Mobility-
Right
2.8 ± .7 3.0 ± .0 2.4 ± .8
ASLR- Left 3.0 ± .2 2.9 ± .3 3.0 ± .0
ASLR- Right 2.9 ± .3 2.8 ± .4 3.0 ± .0
Trunk Stability 1.5 ± .9 1.1 ± .3 1.9 ± 1.0
Rotary Stability- Left 2.0 ± .3 2.0 ± .0 2.0 ± .4
Rotary Stability- Right 2.0 ± .4 2.1 ± .3 2.0 ± .4
FMS® = Functional Movement Screen® (Cook, 2010); S.D.= standard deviation

25
Two, 2 2 contingency tables for ≤ 14 and ≤ 15 thresholds (see Tables 9 and 10,
respectively) are shown because these scores have been reported to be typical cut-off scores for
injury for athletes (Chorba et al., 2010; Garrison et al., 2015; Kiesel et al., 2007). Composite
score thresholds of 13, 16, 17 and 18 were also calculated, as well as the calculations of
sensitivity, specificity, 1 – specificity, and odds ratio at these thresholds (see Table 11). A
composite FMS® score of 15 or below had the highest probabilities for sensitivity (.40) and
specificity (.83) (see Table 11). This indicates there is a probability that using a cut-off score of ≤
15 will identify 40% of injured athletes and 84% of those not injured. The odds ratio (OR) in
Table 11 indicates that individuals with a composite threshold of 15 had a 3.33 greater odds of
becoming injured than those who had a score > 15.
The predictive values of positive (+) and negative (-) tests were calculated for each FMS®
cut-off score (see Table 11). The predictive value for positive tests indicates the percentage of
positive FMS® tests (i.e., less than the cut-off threshold) that correctly identify a player with an
injury. The predictive value of negative tests indicates the percentage of negative FMS® tests
(greater than cut-off threshold) that correctly identifies players without an injury. A cut-off
threshold of ≤ 15 has a predictive value for positive tests at 67% and a predictive value for
negative tests at 63% (see Table 11; ACSM, 2018).
Table 9
2 2 contingency table for a cut-off FMS® score of ≤ 14 for all
volleyball players (N=22)
Injured
Not Injured
FMS® Score ≤ 14
3
2
FMS® Score > 14
7
10
FMS® = Functional Movement Screen® (Cook, 2010)

26
Table 10
2 2 contingency table for a cut-off FMS score of ≤ 15 for all
volleyball players (N=22)
Injured
Not Injured
FMS® Score ≤15
4
2
FMS® Score > 15
6
10
FMS® = Functional Movement Screen® (Cook, 2010)
Table 11
Sensitivity and specificity of various composite FMS® cut-off scores
FMS®
Score
Sensitivity Specificity 1-Specficity
Predictive
Value
(+ test)
Predictive
Value
(- test)
Odds Ratio
(ad/bc)
≤ 13
.10
.83
.17
33%
53%
.56
≤ 14
.30 .83 .17 60% 59% 2.14
≤ 15
.40 .83 .17 67% 63% 3.33
≤ 16
.70 .33 .67 47% 50% .88
≤ 17
1.00 .17 .83 50% 100% 0
≤ 18
1.00 0.00 1.00 55% 0% 0
FMS® = Functional Movement Screen® (Cook, 2010); Sensitivity- probability that the FMS®
cut-off test score identifies those people who will become injured; Specificity- probability that
the FMS® cut-off test score identifies those people who will not become injured; Odds ratio-
quantifies the strength of the association between the FMS® cut-off score and injury: (ad/bc) =
((TP)(TN)/(FP)(FN)) (Kuzma, 1998); Predictive value (+ test)- the percentage of positive tests
that correctly identify a player with an injury; Predictive value (- test)- the percentage of negative
tests that correctly identify a player without an injury (ACSM, 2018)
27
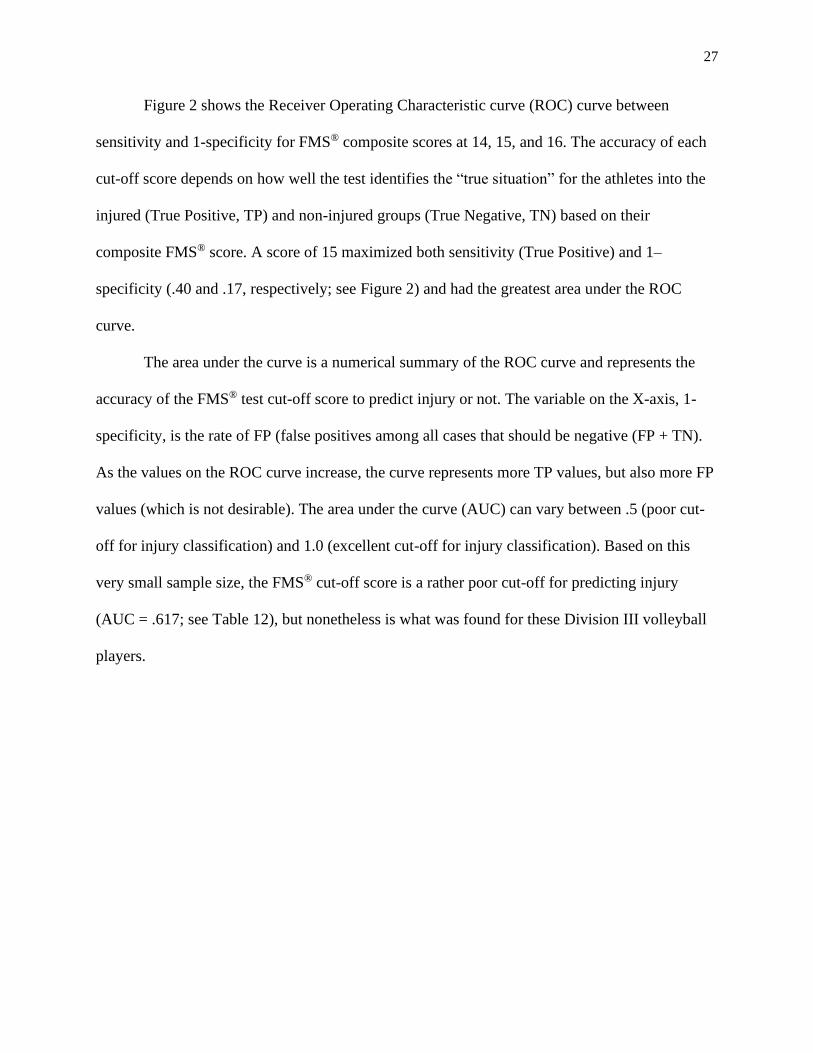
Figure 2 shows the Receiver Operating Characteristic curve (ROC) curve between
sensitivity and 1-specificity for FMS® composite scores at 14, 15, and 16. The accuracy of each
cut-off score depends on how well the test identifies the “true situation” for the athletes into the
injured (True Positive, TP) and non-injured groups (True Negative, TN) based on their
composite FMS® score. A score of 15 maximized both sensitivity (True Positive) and 1–
specificity (.40 and .17, respectively; see Figure 2) and had the greatest area under the ROC
curve.
The area under the curve is a numerical summary of the ROC curve and represents the
accuracy of the FMS® test cut-off score to predict injury or not. The variable on the X-axis, 1-
specificity, is the rate of FP (false positives among all cases that should be negative (FP + TN).
As the values on the ROC curve increase, the curve represents more TP values, but also more FP
values (which is not desirable). The area under the curve (AUC) can vary between .5 (poor cut-
off for injury classification) and 1.0 (excellent cut-off for injury classification). Based on this
very small sample size, the FMS® cut-off score is a rather poor cut-off for predicting injury
(AUC = .617; see Table 12), but nonetheless is what was found for these Division III volleyball
players.

28
Figure 2
ROC Curve (Sensitivity vs. 1-Specificity). A FMS score of 15 maximized both sensitivity (True
Positive) and 1–specificity and accounted for the greatest area under the curve.
An FMS® score of 15 maximized both sensitivity (True Positive) and 1–specificity and
accounted for the greatest area under the curve.
Table 12
Area under the curve and confidence intervals for cut-off composite FMS scores of 14-16
a Under the nonparametric assumption; b Null hypothesis: true area = .05
Y-Balance Test Results
There were no significant differences between the injured group and the non-injured
group when comparing dominant and non-dominant leg YBT composite scores (p = .339, p =
Test Result Variable(s)
Area
Std. Errora
Asymptotic 95% Confidence Interval
Lower Bound Upper Bound
FMS 14 .567 .126 .320 .814
FMS 15 .617 .124 .374 .860
FMS 16 .517 .126 .269 .764
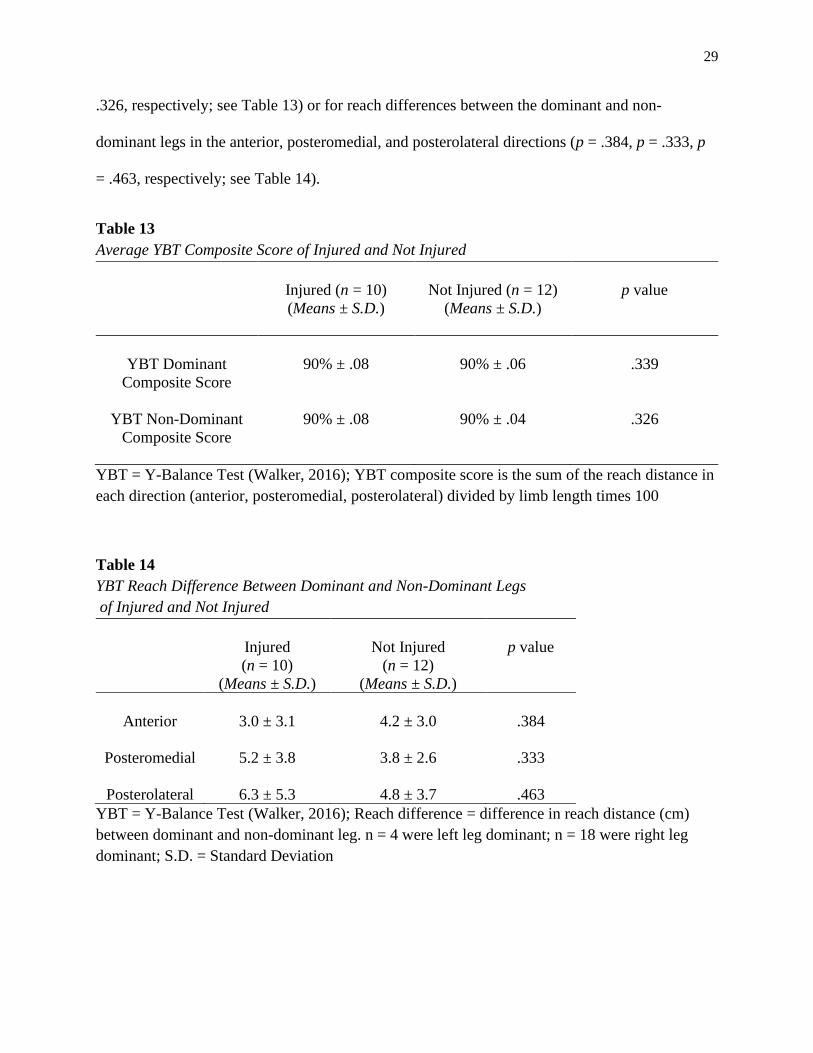
29
.326, respectively; see Table 13) or for reach differences between the dominant and non-
dominant legs in the anterior, posteromedial, and posterolateral directions (p = .384, p = .333, p
= .463, respectively; see Table 14).
Table 13
Average YBT Composite Score of Injured and Not Injured
Injured (n = 10)
(Means ± S.D.)
Not Injured (n = 12)
(Means ± S.D.)
p value
YBT Dominant
Composite Score
90% ± .08
90% ± .06
.339
YBT Non-Dominant
Composite Score
90% ± .08
90% ± .04
.326
YBT = Y-Balance Test (Walker, 2016); YBT composite score is the sum of the reach distance in
each direction (anterior, posteromedial, posterolateral) divided by limb length times 100
Table 14
YBT Reach Difference Between Dominant and Non-Dominant Legs
of Injured and Not Injured
Injured
(n = 10)
(Means ± S.D.)
Not Injured
(n = 12)
(Means ± S.D.)
p value
Anterior
3.0 ± 3.1 4.2 ± 3.0 .384
Posteromedial
5.2 ± 3.8 3.8 ± 2.6 .333
Posterolateral 6.3 ± 5.3 4.8 ± 3.7 .463
YBT = Y-Balance Test (Walker, 2016); Reach difference = difference in reach distance (cm)
between dominant and non-dominant leg. n = 4 were left leg dominant; n = 18 were right leg
dominant; S.D. = Standard Deviation
30
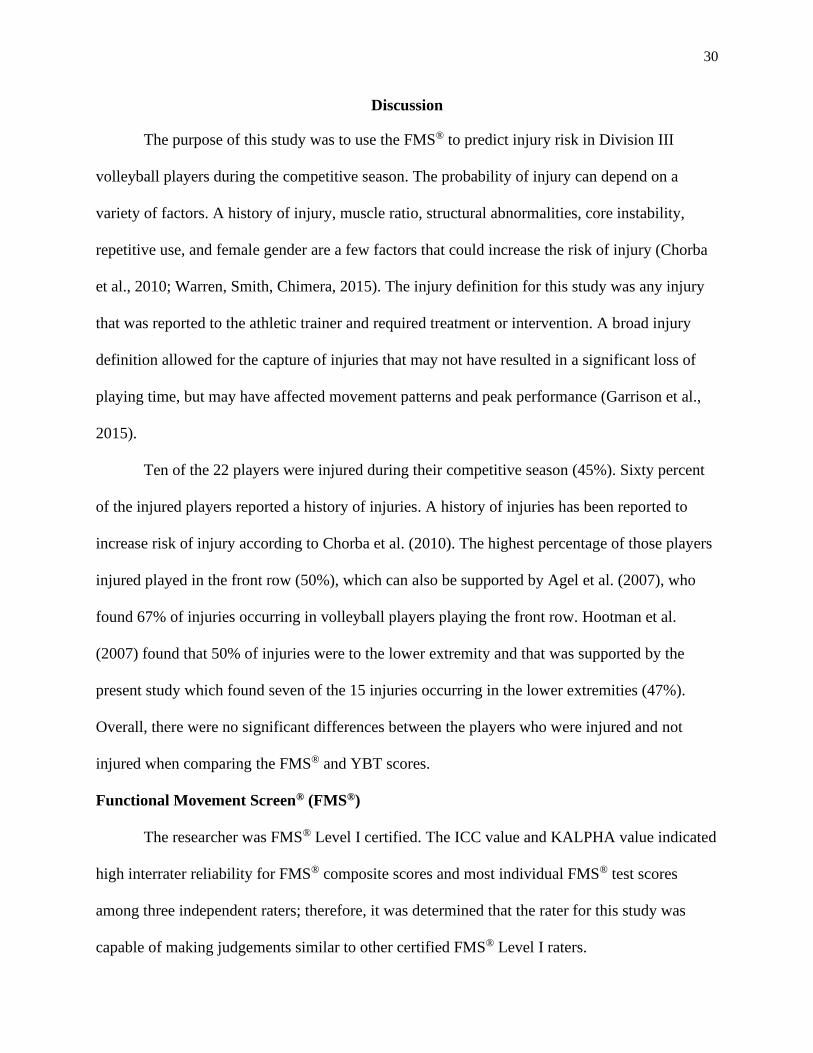
Discussion
The purpose of this study was to use the FMS® to predict injury risk in Division III
volleyball players during the competitive season. The probability of injury can depend on a
variety of factors. A history of injury, muscle ratio, structural abnormalities, core instability,
repetitive use, and female gender are a few factors that could increase the risk of injury (Chorba
et al., 2010; Warren, Smith, Chimera, 2015). The injury definition for this study was any injury
that was reported to the athletic trainer and required treatment or intervention. A broad injury
definition allowed for the capture of injuries that may not have resulted in a significant loss of
playing time, but may have affected movement patterns and peak performance (Garrison et al.,
2015).
Ten of the 22 players were injured during their competitive season (45%). Sixty percent
of the injured players reported a history of injuries. A history of injuries has been reported to
increase risk of injury according to Chorba et al. (2010). The highest percentage of those players
injured played in the front row (50%), which can also be supported by Agel et al. (2007), who
found 67% of injuries occurring in volleyball players playing the front row. Hootman et al.
(2007) found that 50% of injuries were to the lower extremity and that was supported by the
present study which found seven of the 15 injuries occurring in the lower extremities (47%).
Overall, there were no significant differences between the players who were injured and not
injured when comparing the FMS® and YBT scores.
Functional Movement Screen® (FMS®)
The researcher was FMS® Level I certified. The ICC value and KALPHA value indicated
high interrater reliability for FMS® composite scores and most individual FMS® test scores
among three independent raters; therefore, it was determined that the rater for this study was
capable of making judgements similar to other certified FMS® Level I raters.
31
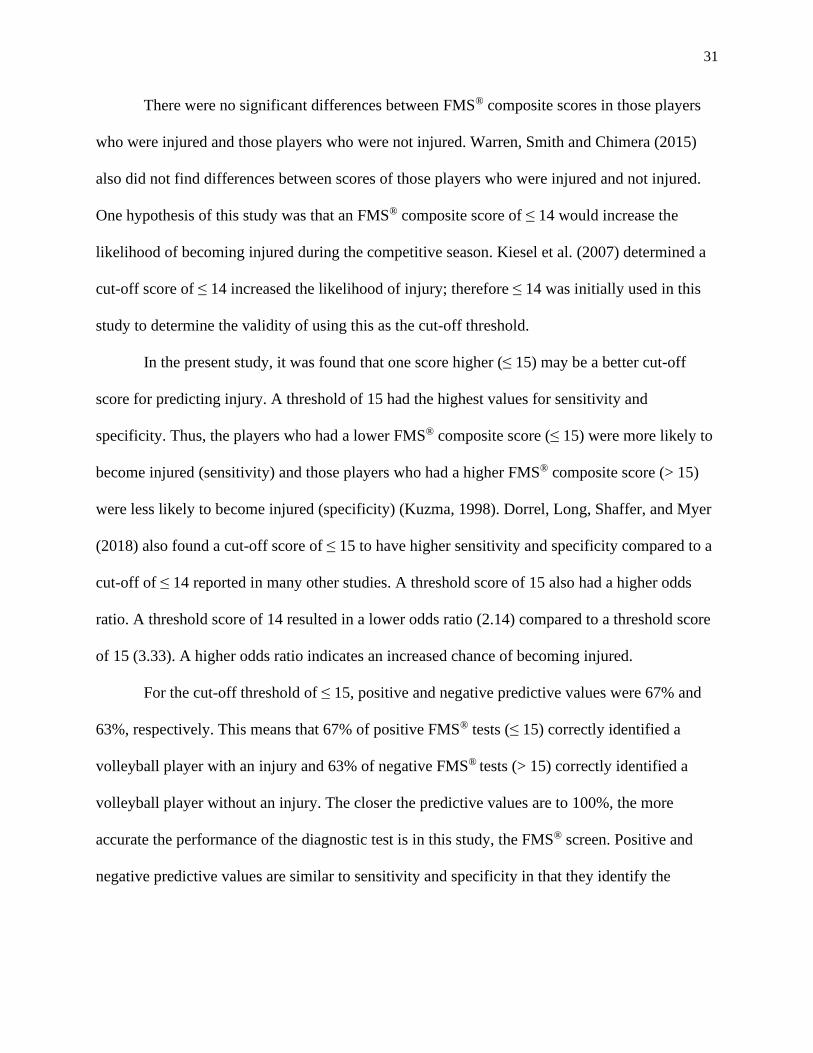
There were no significant differences between FMS® composite scores in those players
who were injured and those players who were not injured. Warren, Smith and Chimera (2015)
also did not find differences between scores of those players who were injured and not injured.
One hypothesis of this study was that an FMS® composite score of ≤ 14 would increase the
likelihood of becoming injured during the competitive season. Kiesel et al. (2007) determined a
cut-off score of ≤ 14 increased the likelihood of injury; therefore ≤ 14 was initially used in this
study to determine the validity of using this as the cut-off threshold.
In the present study, it was found that one score higher (≤ 15) may be a better cut-off
score for predicting injury. A threshold of 15 had the highest values for sensitivity and
specificity. Thus, the players who had a lower FMS® composite score (≤ 15) were more likely to
become injured (sensitivity) and those players who had a higher FMS® composite score (> 15)
were less likely to become injured (specificity) (Kuzma, 1998). Dorrel, Long, Shaffer, and Myer
(2018) also found a cut-off score of ≤ 15 to have higher sensitivity and specificity compared to a
cut-off of ≤ 14 reported in many other studies. A threshold score of 15 also had a higher odds
ratio. A threshold score of 14 resulted in a lower odds ratio (2.14) compared to a threshold score
of 15 (3.33). A higher odds ratio indicates an increased chance of becoming injured.
For the cut-off threshold of ≤ 15, positive and negative predictive values were 67% and
63%, respectively. This means that 67% of positive FMS® tests (≤ 15) correctly identified a
volleyball player with an injury and 63% of negative FMS® tests (> 15) correctly identified a
volleyball player without an injury. The closer the predictive values are to 100%, the more
accurate the performance of the diagnostic test is in this study, the FMS® screen. Positive and
negative predictive values are similar to sensitivity and specificity in that they identify the

32
likelihood of an outcome; however, positive and negative predictive values do not include false
positives or false negatives.
Nine out of 10 players who were injured scored a one for the trunk stability, indicating
poor core stability. Five of the 12 who were not injured scored a three on this test. The average
score on the trunk stability for those athletes who were injured was 1.1, whereas all other FMS®
task scores had an average of 2.0 or higher. Chorba et al. (2010) discussed how females are
likely to have decreased upper body strength and shoulder laxity which may cause a lower score
on trunk stability; however, a majority of their subjects (74%) also scored a 3 on the shoulder
mobility test. Results from the current study also resulted in higher scores on the shoulder
mobility test compared to the trunk stability test. These results can indicate a lower score on
trunk stability being associated with core instability. Chorba et al. (2010) also reported core
instability to increase risk of injury.
Warren et al. (2015) also examined the FMS® movement patterns that assess asymmetry
(i.e., hurdle step, inline lunge, shoulder mobility, active straight leg raise, and rotary stability)
and did not find any significant findings. Asymmetry can be defined as a difference between
patterns of FMS® movements that are scored separately. The results of the current study also
were not significant for movement patterns assessing asymmetry.
The finding of a low FMS® composite score associated with injury risk is somewhat
consistent with other studies. The results of the current study resulted in a cut-off threshold score
of 15 to maximize both sensitivity (True Positive) and 1-specificity and had the greatest area
under the curve of the ROC. The area under the curve represents the accuracy of the FMS® cut-
off score of 15 to predict injury or not. On a scale of 0.5 (poor) to 1.0 (excellent), a cut-off
threshold score of 15 was approximately 0.6 indicating a poor cut-off score for predicting injury.
33
However, the results of this study are not generalizable, as these are only applicable to Division
III female volleyball players.
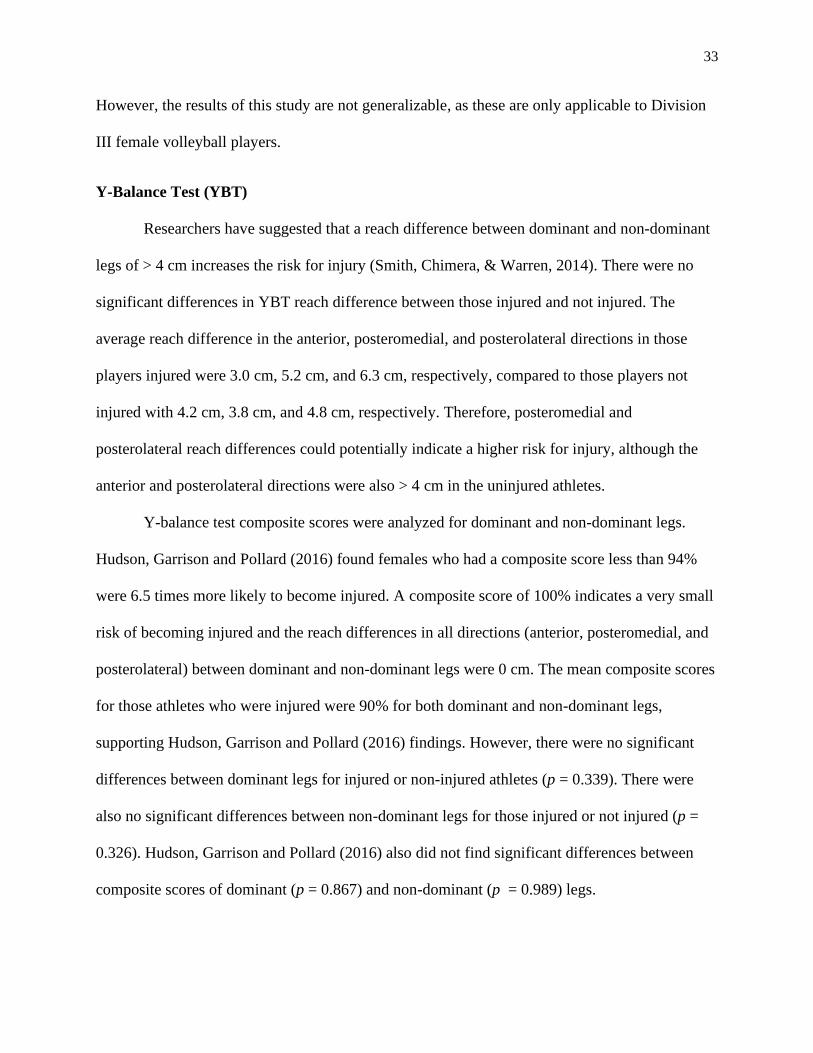
Y-Balance Test (YBT)
Researchers have suggested that a reach difference between dominant and non-dominant
legs of > 4 cm increases the risk for injury (Smith, Chimera, & Warren, 2014). There were no
significant differences in YBT reach difference between those injured and not injured. The
average reach difference in the anterior, posteromedial, and posterolateral directions in those
players injured were 3.0 cm, 5.2 cm, and 6.3 cm, respectively, compared to those players not
injured with 4.2 cm, 3.8 cm, and 4.8 cm, respectively. Therefore, posteromedial and
posterolateral reach differences could potentially indicate a higher risk for injury, although the
anterior and posterolateral directions were also > 4 cm in the uninjured athletes.
Y-balance test composite scores were analyzed for dominant and non-dominant legs.
Hudson, Garrison and Pollard (2016) found females who had a composite score less than 94%
were 6.5 times more likely to become injured. A composite score of 100% indicates a very small
risk of becoming injured and the reach differences in all directions (anterior, posteromedial, and
posterolateral) between dominant and non-dominant legs were 0 cm. The mean composite scores
for those athletes who were injured were 90% for both dominant and non-dominant legs,
supporting Hudson, Garrison and Pollard (2016) findings. However, there were no significant
differences between dominant legs for injured or non-injured athletes (p = 0.339). There were
also no significant differences between non-dominant legs for those injured or not injured (p =
0.326). Hudson, Garrison and Pollard (2016) also did not find significant differences between
composite scores of dominant (p = 0.867) and non-dominant (p = 0.989) legs.

34
Hudson, Garrison and Pollard (2016) researched a larger sample size of female volleyball
players and reported normative data for composite scores. They showed a mean composite score
of 94.1% for the dominant leg and 93.9% for the non-dominant leg. In the present study, mean
composite scores of 90% for both dominant and non-dominant legs were calculated for both
injured and non-injured players. The results indicate a lower mean YBT score and an increased
risk of injury if 94% is used as a cut-off for injury.
It is interesting to note that one player had > 4 cm reach differences in all three directions
(anterior = 7 cm; posteromedial = 12 cm; posterolateral = 17 cm) and she was not injured during
the competitive season. All other injured players had only one or two directions with a reach
difference > 4 cm. With no significant differences found for the YBT in those injured and not-
injured, it is difficult to conclude that the YBT would be a valid assessment in determining injury
risk for this group of athletes.
Future Studies
Future research should explore the idea of corrective exercises and how these might
improve FMS® and YBT scores in the hopes of preventing injury. Although all individuals are
different and may require diverse corrective exercises, it would be beneficial to understand how
corrective exercises might coincide with imbalanced functional movements to prevent injury.
Further research should identify how movement limitations in specific FMS® tests, rather than
the composite FMS® score, may lead to injury.
Limitations
One of the limitations of this study was that it was a small sample size (N = 22). A small
sample size over one season may limit the conclusions, and the results of this study should be
interpreted carefully. Additional work with a larger sample size may be required to further

35
investigate the FMS® and YBT to identify functional movement limitations and imbalances that
might predispose an athlete to injury. Another limitation of the present study was that individual
playing time was not taken into consideration when analyzing the reported injuries. Players who
are exposed to more minutes in games and/or practices may have had an increased risk of
becoming injured.
Conclusion
Functional movement limitations and imbalances can increase the risk for injury in
athletes and can be identified by using the Functional Movement Screen® and Y-Balance Test.
The results of this study do not support the widespread use of an FMS® score of 14 as a cut-off
threshold for injury. However, this study adds to the current research literature and indicated a
cut-off threshold of ≤ 15 as a risk for injury. The YBT mean composite scores were similar
between injured and non-injured players and therefore, were not used as a screen for injuries.
Future research to determine FMS® and YBT normative scores for volleyball players is
necessary.

36
References
Agel, J., Palmieri-Smith, R.M., Dick, R., Wojtys, E.M., & Marshall, S.W. (2007). Descriptive
epidemiology of collegiate women’s volleyball injuries: National collegiate athletic
association injury surveillance system, 1988-1989 through 2003-2004. Journal of Athletic
Training, 42(2), 295-302.
American College of Sports Medicine. (2018). ACSM's guidelines for exercise testing and
prescription. Riebe, D., Ehrman, J. K., Liguori, G., & Magal, M. (Eds.). Philadelphia,
PA: Wolters Kluwer Health.
Beardsley, C., & Contreras, B. (2014). The functional movement screen®: A review. National
Strength and Conditioning Journal, 36(5),72-80.
Bonazza, N.A., Smuin, D., Onks, C.A., Silvis, M.L., & Dhawan, A. (2016). Reliability, validity,
and injury predictive value of the functional movement screen®. The American Journal
of Sports Medicine, 45, 725-732.
Bunn, P.D.S., Rodrigues, A.I., & Bezerra da Silva, E.B. (2018). The association between the
functional movement screen outcome and the incidence of musculoskeletal injuries: A
systematic review with meta-analysis. Physical Therapy in Sport, 35(1), 146-158.
Chorba, R.S., Chorba, D.J., Bouillon, L.E., Overmyer, C.A., & Landis, J.A. (2010). Use of a
functional movement screening tool to determine injury risk in female collegiate athletes.
North American Journal of Sports Physical Therapy, 1(5), 47-54.
Cook, G. (2010). Movement: Functional movement systems: Screening, assessment, and
corrective strategies. Santa Cruz, CA: On Target Publications.

37
Cook, G. (2012). What is our baseline for movement? The clinical need for movement screening
and assessment. The Journal of Orthopedic and Sports Physical Therapy, 42(10), A21-
A24.
Cook, G., Burton, L., Hoogenboom, B., & Voight, M. (2006). Functional movement screening:
The use of fundamental movements as an assessment of function—part 2. International
Journal of Sports Physical Therapy, 9(4), 549-563.
Dorrel, B., Long, T., Shaffer, S., & Myer, G.D. (2018). The functional movement screen® as a
predictor of injury in National Collegiate Athletic Association Division II athletes.
Journal of Athletic Training, 53(1), 29-34.
Eerkes, K. (2012). Volleyball injuries. Current Sports Medicine Reports, 1(5), 251-256.
Frost, D.M., Beach, T.A.C., Callaghan, J.P., & McGill, S.M. (2012). Using the functional
movement screen to evaluate the effectiveness of training. Journal of Strength and
Conditioning Research, 26(6), 1620-1630.
Garrison, M., Westrick, R., Johnson, M.R., & Benenson, J. (2015). Association between the
functional movement screen® and injury development in college athletes. The
International Journal of Sports Physical Therapy, 10(1), 21-28.
Gonell, A.C., Pina Romera, J.A., & Soler, L.M. (2015). Relationship between the Y balance test
scores and soft tissue injury incidence in a soccer team. International Journal of Sports
Physical Therapy, 10(7), 955-966.
Hayes, A.F., & Krippendorff, K. (2007). Answering the call for a standard reliability measure for
coding data. Communication Methods and Measures 1(1), 77-89.
38
Hootman, J.M., Dick, R., & Agel, J. (2007). Epidemiology of collegiate injuries for 15 sports:
Summary and recommendations for injury prevention initiatives. Journal of Athletic
Training, 42 (2), 311-319.
Hudson, C., Garrison, J.C., & Pollard K. (2016). Y-balance normative data for female collegiate
volleyball players. Physical Therapy in Sport, 22(1), 61-65.
Kiesel, K., Plisky, P.J., & Voight, M.L. (2007). Can serious injury in professional football be
predicted by a preseason functional movement screen? North American Journal of
Sports Physical Therapy, 2(3), 147-158.
Kuzma, J.W. (1998). Basic statistics for the health sciences(3rd ed., pp. 137-139; 188-190).
Mountain View, California: Mayfield Publishing Company.
Lehr, M.E., Plisky, P.J., Butler, R.J., Fink, M.L., Kiesel, K.B., & Underwood, F.B. (2013). Field-
expedient screening and injury risk algorithm categories as predictors of noncontact
lower extremity injury. Scandinavian Journal of Medicine & Science in Sports, 23(4),
225-232.
Parchmann, C.J., & McBride, J.M. (2011). Relationship between functional movement screen®
and athletic performance. Journal of Strength and Conditioning Research, 25(12), 3378-
3384.
National Collegiate Athletic Association (NCAA). (2020). Women’s Volleyball.
https://www.ncaa.com/sports/volleyball-women/d.
Reeser, J.C., Gregory, A., Berg, R.L., & Comstock, R.D. (2015). A comparison of women’s
collegiate and girls’ high school volleyball injury data collected prospectively over a 4-
year period. Sports Health, 7(6), 504-510.

39
Smith, C.A., Chimera, N.J., & Warren, M. (2014). Association of Y balance test reach
asymmetry and injury in Division I athletes. Medicine and Science in Sports and
Exercise, 47(1), 136-141.
Stenger, L. (2018). What is functional/neuromotor fitness? ACSM’s Health and Fitness Journal,
22 (6), 35-43.
Walbright, P.D., Walbright, N., Ojha, H., & Davenport, T. (2017). Validity of functional
screening tests to predict lost-time lower quarter injury in a cohort of female collegiate
athletes. The International Journal of Sports Physical Therapy, 12(6), 948-959.
Walker, O. (2016). Y-Balance test. Science for Sport. https://www.scienceforsport.com/y-
balance-test/
Warren, M., Smith, C.A., & Chimera, N.J. (2015). Association of the functional movement
screen with injuries in Division I athletes. Journal of Sport Rehabilitation, 24(2), 163-
170.

40
Appendix A
Images are from data collection for the Functional Movement Screen for Deep Squat, Hurdle
Step, Inline Lunge, Active Straight Leg Raise, Trunk Stability, Rotary Stability, and Shoulder
Mobility. All of the seven tests and clearing tests with scoring criteria and the scoring sheet can
be retrieved from Cook (2010) or online from http://www.functionalmovement.com.
41
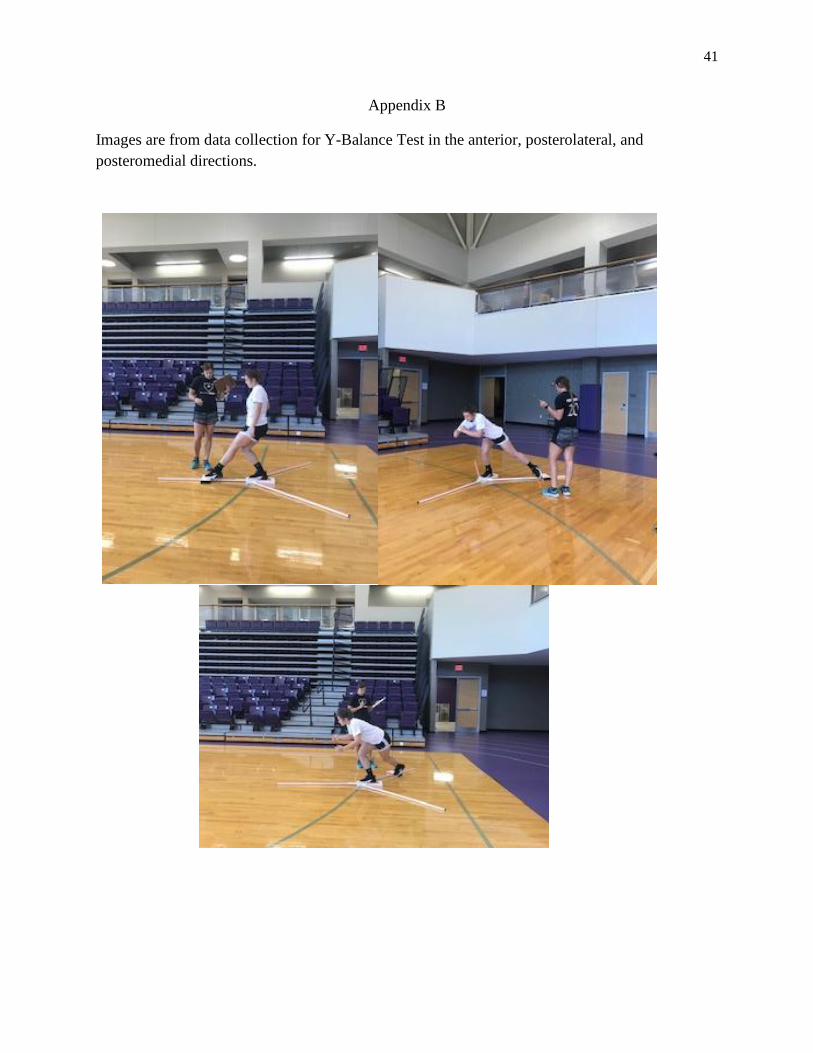
Appendix B
Images are from data collection for Y-Balance Test in the anterior, posterolateral, and
posteromedial directions.

42
Appendix C

43
Appendix C (cont.)
44
Appendix C (cont.)

45
Appendix C (cont.)

46
Appendix C (cont.)
47
Appendix D
HIPPA Authorization to Use and Disclose Protected Health Information for Research
Purposes
Title of Study: Using the functional movement screen and Y-balance test to predict injury in
Division III volleyball players
Principal Investigator: Kaycee Rowe
Investigator’s Contact Information: Phone: 419-953-3212 Email: [email protected]
HIPPA is the Health Insurance Portability and Accountability Act of 1996, a federal law related
to privacy of health information.
What is the purpose of this form? You have been asked to take part in a research study. The
consent form for this study describes your participation and all that information still applies. The
purpose of this form is to obtain your permission to use health information about you that is
created by or used in conjunction with this research.
What if I don’t want my personal health information (PHI) to be used in a research study?
You do not have to give this permission. Your decision to sign this form will not change your
ability to get health care outside of this research study. However, if you do not sign this form you
will not be allowed to participate in the study.
What PHI am I allowing to be used for this research? PHI used for this study will be any
injury acquired during the competitive season. This includes what the injury was, if the athlete
received treatment for injury, if athlete had a loss in playing time and how long.
Where will the researchers go to find my PHI? We will ask for specific details regarding any
injury during the season, including type of injury, any treatment received for injury and if any
playing time was lost and how long. PHI will be released by the athletic trainer through the
SportsWare software.
Who will be allowed to see my PHI? The researcher named above and staff members of this
research team will be allowed to see and use your health information for the research study. Your
records may also be viewed by representatives of Bowling Green State University’s Institutional
Review Board.
Will my information be used in any other way? Your information will only be used in this
research study. Data in this research study may be published, but your personal information will
be unidentifiable. All information and data will be deleted upon completion of this study.
48
Appendix D (cont.)
What if I change my mind after I give this permission? You can change your mind and
withdraw this permission at any time by informing the Principal Investigator. If you withdraw
this permission, the researcher will not use your information already collected. No other
additional health information about you will be collected by or given to the researcher for the
purposes of this study.
What are the privacy protections for my PHI used in this research study? HIPPA
regulations apply to personal health information in the records of health care providers and other
groups that share such information. Unique number codes will be given to participants so PHI
cannot be traced back to individuals.
How long does this permission allow my PHI to be used? If you decide to be in this research
study, your permission to access and use your health information will only last the duration of
the study. No other health information will be accessed except for new health information
acquired during the competitive volleyball season. Following the season, we will not be able to
access any of your health information.
I am the research participant. By signing this form, I am giving permission for my personal
health information to be used in research as described above.
________________________ _________________________ ___________
Name of Research Participant Signature Date
________________________ _________________________ ___________
Name of Researcher Signature Date
YOU WILL BE GIVEN A SIGNED COPY OF THIS CONSENT FORM TO KEEP