Embed Size (px)
Citation preview

Using the IDEAL model with Flexstorm Filters
The creators of the Ideal model have made it very simple to input the characteristics of a Stormwater
Manufactured Treatment Devices. Flexstorm Inlet filters qualify as a MTD Type 3 inlet filter. To use a
Flexstorm filter with the IDEAL model:
1. Using the product configurator http://inletfilters.com/product-configurator find the appropriate
FLEXSTORM filter for your inlet. If you cannot find your exact inlet filter pick a filter using
http://inletfilters.com/product-configurator/structure that is the closest to your inlet’s shape, B, & D
dimensions. Write down your FLEXSTORM PART NUMBER (e.g. P-HD4-280-280-240-240-PC)
2. Submit a formal request in order to receive your spec sheet with your specific inlet’s FLEXSTORM
ratings.
3. Fill out the General Characteristics field of the User Defined BMP input. Find your FLEXSTORM
part number’s FLEXSTORM Ratings on your spec sheet PDF. Fill in the “Maximim flow rate before
going into bypass mode (cfs)” and the “Maximum total volume of sediment the device can contain
before going into bypass mode (ft^3) fields with their corresponding values.
asdfa
Flexstorm P-HD4-238-238-220-220-PC
Flexstorm 62MHDPC
1.3
2.4

4. Fill out the Trapping Efficiency Characteristics fields of the User Defined BMP field. There are two
types of Flexstorm bags that affect these fields:
- FX bag, Flexstorm's standard woven bag for temporary or permanent applications. For high flow
rate and low maintenance applications. The FX bag has a TSS Trapping Efficiency (%) of 82%
(See “Large-Scale Sediment Retention Device Testing of Flexstorm FX Filters”)
-PC bag, ‘Post Construction’ bag lined with Adsorb-it Filter fabric to specifically target small
particle and hydrocarbon removal. The PC bag has a TSS Trapping Efficiency (%) of 99.01%
(See “TSS Removal for OK-110 Silica Sand”)
Depending on your desired bag style input the Trapping Efficiency Characteristics into their specific
trapping efficiency fields.
Trapping Efficiency FX BAG PC BAG
Gross TSS Removal 82% 99.01%
Clay (%) 1.2 2
Silt (%) 82 90
Sand (%) 99 100
Small Aggregates (%) 98 100
Large Aggregates (%) 100 100
5. Click the OK button. The Flexstorm filter should now be integrated into your IDEAL model
Simulation.

9063 Bee Caves Road ▪ Austin, TX 78733-6201 ▪ (512) 263-2101 ▪ FAX 263-2558 ▪ 1-800-880-TEST
Large-Scale Sediment Retention Device Testing
(ASTM D 7351)
of
FLEXSTORM Inlet Filter
February 2009
Submitted to:
Inlet & Pipe Protection, Inc. 24137 W. 111th St., Unit A
Naperville, IL 60564
Attn: Mr. Jamie Ringenbach
Submitted by:
TRI/Environmental, Inc. 9063 Bee Caves Road
Austin, TX 78733
C. Joel Sprague
Project Manager

9063 Bee Caves Road ▪ Austin, TX 78733-6201 ▪ (512) 263-2101 ▪ FAX 263-2558 ▪ 1-800-880-TEST
February 24, 2009 Mr. Jamie Ringenbach Inlet & Pipe Protection, Inc. 24137 W. 111th St., Unit A Naperville, IL 60564 E-mail: [email protected] Subject: Sediment Retention Device Testing of the FLEXSTORM Inlet Filter
(# 2278-01-36) Dear Mr. Ringenbach: This letter report presents the results for large-scale sediment retention device tests performed on the FLEXSTORM Inlet Filter. Included are data developed for simulated sediment-laden runoff from a 100-ft long, 3:1 slope exposed to a 4 inch storm event. All testing work was performed in general accordance with the ASTM D 7351, Standard Test Method For Determination Of Sediment Retention Device Effectiveness In Sheet Flow Application, though the protocol was modified to present the flow toan inlet and to stop the test upon the inlet bag ceasing to continue passing flow. Generated results were used to develop the following effectiveness percentages for the tested material:
Property Woven 200
Retention Effectiveness (Filtration Efficiency) 82% Soil Captured During Rain Event (@ 80 lf/ft3) 1.24 ft3
Tested Bag Capacity 2.14 ft3 Capacity Utilization Rate 58%
% of Storm Event Handled 40% Bag Volume Req’d for Storm Event 5.4 ft3
TRI is pleased to present this final report. The data presented herein appears to be consistent with commonly reported values. Please feel free to call if we can answer any questions or provide any additional information. Sincerely,
C. Joel Sprague, P.E. Senior Engineer Geosynthetics Services Division Cc: Sam Allen, Jarrett Nelson - TRI
FLEXSTORM - Inlet Filter Testing February 24, 2009
Page 1
SEDIMENT RETENTION DEVICE (SRD) TESTING REPORT
Inlet Filter Bags
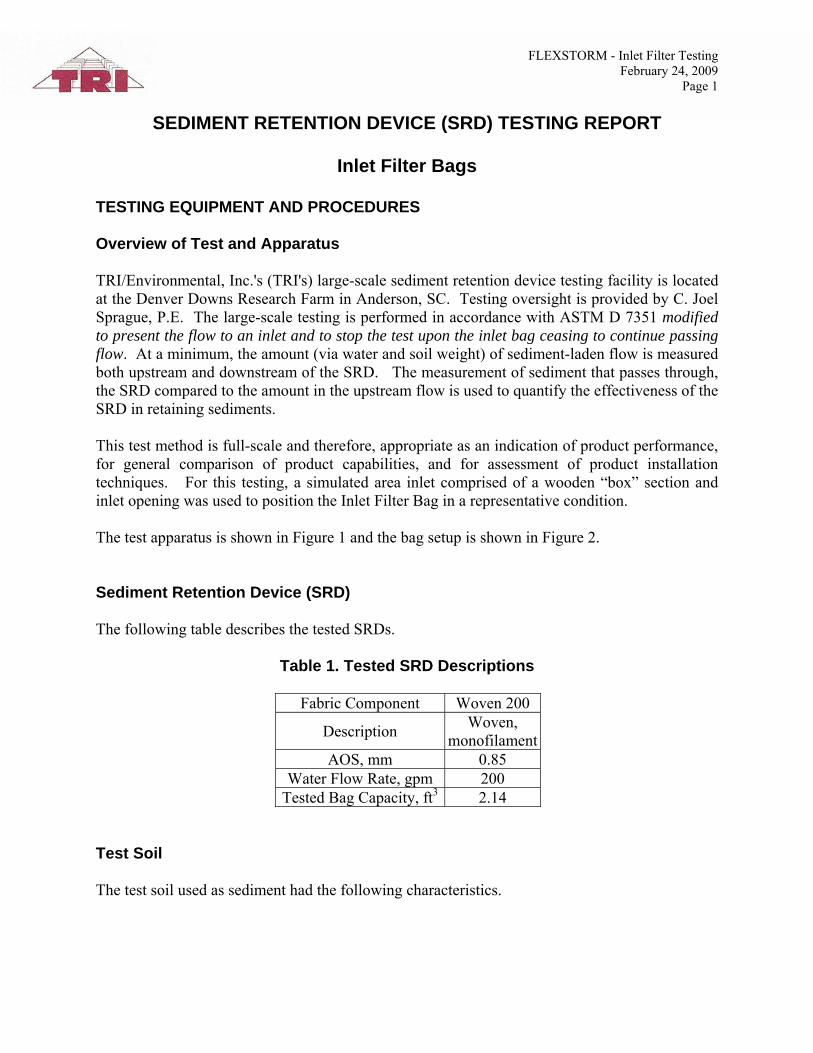
TESTING EQUIPMENT AND PROCEDURES Overview of Test and Apparatus TRI/Environmental, Inc.'s (TRI's) large-scale sediment retention device testing facility is located at the Denver Downs Research Farm in Anderson, SC. Testing oversight is provided by C. Joel Sprague, P.E. The large-scale testing is performed in accordance with ASTM D 7351 modified to present the flow to an inlet and to stop the test upon the inlet bag ceasing to continue passing flow. At a minimum, the amount (via water and soil weight) of sediment-laden flow is measured both upstream and downstream of the SRD. The measurement of sediment that passes through, the SRD compared to the amount in the upstream flow is used to quantify the effectiveness of the SRD in retaining sediments. This test method is full-scale and therefore, appropriate as an indication of product performance, for general comparison of product capabilities, and for assessment of product installation techniques. For this testing, a simulated area inlet comprised of a wooden “box” section and inlet opening was used to position the Inlet Filter Bag in a representative condition. The test apparatus is shown in Figure 1 and the bag setup is shown in Figure 2. Sediment Retention Device (SRD) The following table describes the tested SRDs.
Table 1. Tested SRD Descriptions
Fabric Component Woven 200
Description Woven, monofilament
AOS, mm 0.85 Water Flow Rate, gpm 200
Tested Bag Capacity, ft3 2.14 Test Soil The test soil used as sediment had the following characteristics.

FLEXSTORM - Inlet Filter Testing February 24, 2009
Page 2
Table 2. TRI-Loam Characteristics
Soil Characteristic Test Method Value
% Gravel 2 % Sand 60 % Silt 24 % Clay
ASTM D 422
14 Liquid Limit, % 34
Plasticity Index, % ASTM D 4318 9 Soil Classification USDA Sandy Loam Soil Classification USCS Silty Sand (SM)
Test Setup SRD Installation – The Sediment Retention Device (SRD) installation used a simulated area inlet comprised of a wooden “box” section and inlet opening to position the Inlet Filter Bag in a representative condition. Mixing Sediment-Laden Runoff - Sediment-laden runoff was created by combining water and soil in the mixing tank and agitated during the test. 4000 lb of water and 240 lb of soil were combined to create the sediment-laden runoff. This amount of water and sediment simulates sheet flow from a slope measuring 16 ft (4.8 m) wide by 100 ft (30 m) long during the peak 30 minutes of a 4 in (100 mm) per hour rainfall hydrograph as outlined in the following calculation (which is outlined in the standard). . . “For this testing, a standard 10-year, 6-hour storm event (mid-Atlantic region of US) was selected. This return frequency is commonly used for sizing sediment control ponds and, thus, was deemed appropriate for the testing of other SRDs. Using this criterion, a 100 mm (4 in) rainfall was selected. It was also assumed that approximately 25% of the storm would occur during the peak 30 minutes, and that 50% of the rainfall would infiltrate into the ground. A theoretical contributory area of 30 m (100 ft) slope length by 6 m (20 ft) wide was selected to limit runoff to sheet flow conditions. Runoff and associated sediment were calculated using the Modified Universal Soil Loss Equation (MUSLE) which allows for calculating a storm-specific quantity of sediment. Following is the MUSLE (SI formula):
T = 89.6 (V x Qp)0.56 K LS C P Where: T = sediment yield (tonnes); V = runoff (m3) = (Rainfall – Infiltration) x Area;
Qp = peak flow (m3/s); and K, LS, C, P are from RUSLE charts The following calculations provided the runoff and sediment load used in the testing:
V = (0.5)* x (0.1 m) x (180 m2) = 9 m3 Qp = (0.1m) x (0.25)* x (0.5)** x (180m2) = 2.25 m3/ 30min = 0.00125 m3/s (* = 25% of storm during 30-min peak; ** = 50% infiltration)

FLEXSTORM - Inlet Filter Testing February 24, 2009
Page 3 K, sandy-silt = 0.041; LS, 2-10%/30m = 0.46 (approx); C, P = 1.0
T = 89.6 (9 x 0.00125)0.56 (0.041) (0.46) (1.0) (1.0) = 0.136 Tonnes = 136 kg of soil
(assume most sediment is generated during the peak flow period) Std. Test Quantities: 30-Minute Runoff: 2.25 m3 x 1000 kg/m3 = 2250 kg (approx. 5000 lb) Sediment Load: 136 kg (approx. 300 lb)” Actual Test Quantities adjusted for 16 ft wide slope: 30-Minute Runoff: 5000 lb x (16 ft / 20 ft) = 4000 lb Sediment Load: 300 lb x (16 ft / 20 ft) = 240 lb Installation of Sediment Retention Device As noted, the submitted SRD installation used a simulated area inlet comprised of a wooden “box” section and inlet opening to position the Inlet Filter Bags in a representative condition. This facilitated multiple test repetitions. Sediment laden flow was introduced through a pipe from the mixing tank as shown in Figure 1.
Figure 1. Test set-up, including mixing tank and wooden box with simulated area inlet
inside collection tank. (typical grab sampling shown)
Test Procedure Releasing, and Collecting Sediment-Laden Runoff - The sediment-laden water was discharged evenly for a maximum of 30 minutes. The flow was stopped when seepage through the inlet bag ceased. The quantity of released runoff was measured at 1-minute intervals by noting the reduction in weight in the mixing tank, adjusting the valve on the tank outlet to increase/decrease flow to stay as close as possible to the target (4240 lb / 30 min = 140 lb / min). The discharge flow introduced to the inlet area through a 6-inch diameter pipe. Retention observations and associated times, are recorded during the test.

FLEXSTORM - Inlet Filter Testing February 24, 2009
Page 4 As runoff passing the SRD enters the collection tank, the weight of the collection tank is recorded and grab samples are taken, at intervals. Cutoff time is when there is minimal discharge. Collecting and Measuring Sediments - Grab samples are evaluated in a lab to determine turbidity using a Hach 2100 AN Turbidimeter and to determine percent dry solids content. Drying of collected sediments is accomplished in a forced air oven at 110°C for a minimum of 24 hours or until all moisture is driven off, whichever is greater. All weighing of sediments is done with laboratory scales accurate to ± 0.01 lbs.
Figure 2. Woven 200 Bag Test
TEST RESULTS Total sediment and associated runoff measured during the testing are the principle data used to determine the performance of the product tested. This data is entered into a spreadsheet (see appendix) that transforms the sediment concentration and collected runoff into the retention effectiveness and percent of storm event values shown in Table 3. Additionally, turbidity samples were taken to determine if any change in turbidity resulted from the measured short-term Inlet Filter Bags performance. No significant difference in upstream (runoff) and downstream (short-term seepage) turbidity was found. This is likely the result of the inadequate time afforded for settlement of fine-grained suspended soil particles during the test.
Table 3. Measures of Effectiveness
Property Woven 200
Retention Effectiveness (Filtration Efficiency) 82% Soil Captured During Rain Event (@ 80 lf/ft3) 1.24 ft3
Tested Bag Capacity 2.14 ft3 Capacity Utilization Rate 58%
% of Storm Event Handled 40% Bag Volume Req’d for Storm Event 5.4 ft3

FLEXSTORM - Inlet Filter Testing February 24, 2009
Appendix
APPENDIX A – RECORDED DATA
Test Record Sheets

ASTM D 7351 (Modified) - SEDIMENT RETENTION DEVICE (SRD) TESTING
TEST I.D.: FlexStorm Inlet Protection Bag A DATE: 01/13/09 SRD Device & Installation Details, including Product Description:
Inlet Protection Bag A is comprised of Propex 117F Geotextile on a 22” x 22” frame.
Bag Volume:
Bag Surface Area:
Soil Subgrade Type: Loam Sediment Type: Loam
Sediment Weight: 240 lbs Runoff Weight: 4000 lbs
Runoff Discharge- Start Time: 9:25 am Finish Time: 9:37 am
Upstream Runoff Downstream Runoff SRD
Time Sample #
Reservior Weight
(lbs) Time Sample
#
Collected Weight
(lbs)
Collected Height
(in) Time
Ponding Height
(in)
Observation#
0 4240 0 0 5 A1 3500 5 A1L 724 5 10 A2 2800 10 A2L 1488 10 12 2560 12 1680 12 1
Time Sample # Turbidity Time Sample
# Turbidity
0 0 5 A1 7257 5 A1L 7825 10 A2 7433 10 A2L 7683 12 12
OBSERVATIONS:
# 1. Bag completely filled and minimally draining at 12 minutes, so test stopped.
# 2.
# 3.

FLEXSTORM - Inlet Filter Testing February 24, 2009
Appendix
APPENDIX B – CALCULATIONS
Effectiveness Calculation Spreadsheets

Sample Number
Test Time,
minutesTurbidity
Total Weight,
g
Decanted Weight, g
Dry Weight,
g
Bottle Weight,
g
Dry Sediment Weight,
mg
Total Collected
Water Wt., g
Total Collected Volume of Water, l
Sediment Conc., mg/l
% Solids
Reservoir Weight, lb
Assoc. Discharge,
gal
Cumm Discharge,
gal
Coll. Tank
Depth, in
plot time
% Soil Retaine
d
Cumm Soil
Loss, lbs
Assoc. Solids Loss, lbs
Soil Retention
Effectiveness, %
Upstream 0 0 0
0 77626 7.76% 4240 40 0 2.5 26.1 26.1A1 5 7257 286.3 62.5 45.4 26.7 18700 240.90 0.24 77626 7.76% 3516 83 81 7.5 79.5 53.4A2 10 7433 279.1 61.5 44.6 26.7 17900 234.50 0.23 76333 7.63% 2752 53 166 11.0 113.5 34.0
12 76333 7.63% 2560 11 187 12.0 120.3 6.8
4000 240 AVGS: 76979 7.70% TOTALS: 187 120 120.30 0 0
0 13420 1.34% 0 43 0 2.5 81.6% 4.8 4.8A1L 5 7825 291 41.9 30.2 26.7 3500 260.80 0.26 13420 1.34% 724 88 86 7.5 81.6% 14.7 9.9A2L 10 7683 288.6 42.9 29.5 26.7 2800 259.10 0.26 10807 1.08% 1488 57 176 11.0 82.0% 20.4 5.7
12 10807 1.08% 1680 11 199 12.0 82.2% 21.4 1.0
12113 1.21% 1680 199 21.498.9 (avg) (avg) (total) (total) (approx.) 98.91
Downstream
Retention Effectiveness Calculations
1/13/2009
Soil Added To Mixer (lbs):Water Added To Mixer (lbs):
Run A: FlexStorm Inlet Protection Bag A
Soil Collected from Bag (lbs):
82.21%

FLEXSTORM - Inlet Filter Testing February 24, 2009
Appendix
APPENDIX C – TEST SOIL
Test Soil Grain Size Distribution Curve


FLEXSTORM - Inlet Filter Testing February 24, 2009
Appendix
APPENDIX D – LABORATORY QUALIFICATIONS

FLEXSTORM - Inlet Filter Testing February 24, 2009
Appendix
Testing Expertise TRI/Environmental (TRI) is a leading, accredited geosynthetic, plastic pipe, and erosion and sediment control product testing laboratory. TRI’s large-scale erosion and sediment control testing facility in the upstate of South Carolina at the Denver Downs Research Farm (DDRF) is initially focused on the following full-scale erosion and sediment control performance tests: • ASTM D 6459: Determination of Rolled Erosion Control Product (RECP) Performance in
Protecting Hillslopes from Rainfall-Induced Erosion; • ASTM D 6460: Determination of Rolled Erosion Control Product (RECP) Performance in
Protecting Earthen Channels from Stormwater-Induced Erosion; • ASTM D 7208: Determination of Temporary Ditch Check Performance in Protecting Earthen
Channels from Stormwater-Induced Erosion. • ASTM D 7351: Determination of Sediment Retention Device Effectiveness In Sheet Flow
Applications. Technical Oversight Joel Sprague, P.E., TRI’s Senior Engineer provides technical oversight of all of TRI’s erosion and sediment control testing and can be contacted at:
Mr. C. Joel Sprague, Senior Engineer PO Box 9192, Greenville, SC 29604
Ph: 864/242-2220; Fax 864/242-3107; [email protected] Mr. Sprague has been involved with the design of erosion and sediment control systems and the research, development, and application of erosion and sediment control products/materials for many years. He was the lead consultant in the development of bench-scale testing procedures for the Erosion Control Technology Council. Mr. Sprague has authored numerous technical papers on his research and is readily available to assist clients with their research and testing needs. Operations Management Sam Allen, TRI’s Division Vice President provides operational management of all TRI laboratories and can be contacted at:
Mr. Sam Allen, Vice President & Program Manager 9063 Bee Caves Road
Austin, TX 78733 Ph: 512/263-2101; Fax: 512/263-2558; [email protected]
Mr. Allen pioneered the laboratory index testing of rolled erosion control products (RECPs) and has been actively involved in the development and standardization of testing protocol and apparatus for more than 10 years. He set up and oversees TRI’s erosion and sediment control testing laboratories. His oversight responsibilities include test coordination, reporting, and failure resolution associated with the National Transportation Product Evaluation Program (NTPEP) for RECPs.

9063 Bee Caves Road ▪ Austin, TX 78733-6201 ▪ (512) 263-2101 ▪ FAX 263-2558 ▪ 1-800-880-TEST
Large-Scale Sediment Retention Device Testing
Representing Exposure
to “Post-Construction” Sediment Load
of
FLEXSTORM PC Inlet Filters
November 2009
Submitted to:
Inlet & Pipe Protection, Inc.
24137 W. 111th St., Unit A
Naperville, IL 60564
Attn: Mr. Jamie Ringenbach
Submitted by:
TRI/Environmental, Inc.
9063 Bee Caves Road
Austin, TX 78733
C. Joel Sprague
Project Manager

9063 Bee Caves Road ▪ Austin, TX 78733-6201 ▪ (512) 263-2101 ▪ FAX 263-2558 ▪ 1-800-880-TEST
November 24, 2009
Mr. Jamie Ringenbach
Inlet & Pipe Protection, Inc.
24137 W. 111th
St., Unit A
Naperville, IL 60564
E-mail: [email protected]
Subject: Sediment Retention Device Testing of FLEXSTORM PC Inlet Filter
Representing “Post-Construction” Sediment Load (Log #2278-01-46)
Dear Mr. Ringenbach:
This letter report presents large-scale sediment retention device tests performed on the
FLEXSTORM PC sediment bag, a 2-ply geotextile with a nonwoven inner liner and woven outer
layer. Sediment retention effectiveness and removal rate based on total suspended solids (TSS)
testing of effluent grab samples and captured sediment measurements are reported. The data
were developed for sediment-laden runoff from a simulated 100-ft long, 3:1 slope exposed to
varying flow rates into an area inlet. A “post-construction” sediment concentration condition
was simulated using OK-110 silica sand in clean water. Generated results were used to develop
the following effectiveness percentages:
Product Tested Sediment Load Ave Flow Rate
GPM TSS Removal
Soil Retention
Efficiency
FLEXSTORM PC
Sediment Bag
1750 mg/L
using OK-110 Silica Sand
and Clean Water
23 99.28% 98.96%
48 99.32% 99.25%
70 98.89% 98.80%
TRI is pleased to present this final report. The data presented herein appears to be consistent
with commonly reported values. Please feel free to call if we can answer any questions or
provide any additional information.
Sincerely,
C. Joel Sprague, P.E.
Senior Engineer
Geosynthetics Services Division
Cc: Sam Allen, Jarrett Nelson - TRI

FlexStorm PC Inlet Filter Testing
November, 2009
Page 1
LARGE-SCALE SEDIMENT RETENTION DEVICE (SRD) TSS TESTING REPORT
FLEXSTORM PC Inlet Filter
TESTING EQUIPMENT AND PROCEDURES
Overview of Test and Apparatus
TRI/Environmental, Inc.'s (TRI's) large-scale sediment retention device (SRD) testing facility is
located at the Denver Downs Research Farm in Anderson, SC. Testing oversight is provided by
C. Joel Sprague, P.E. Large-scale testing was performed to simulate “post-construction”
sediment-laden runoff flowing to an area inlet at varying flow rates. Effluent grab samples were
taken at intervals for laboratory total suspended solids (TSS) testing. Additionally, the sediment
collected in the SRD was measured. The results were compared to the calculated amount of
sediment in the upstream flow over time to quantify the effectiveness of the SRD in retaining
those sediments and confirm sediment retention rates.
This test method is full-scale and therefore, appropriate as an indication of product performance,
for general comparison of product capabilities, and for assessment of product installation
techniques. For this testing, a simulated area inlet comprised of a lined wooden “box” section
and 24” diameter inlet opening was used to position the SRD in a representative condition. This
facilitates multiple test repetitions during a single day of testing. The test apparatus is shown in
Figure 1.
Sediment Retention Device (SRD)
The following table describes the tested SRD.
Table 1. Tested FLEXSTORM PC Sediment Bag
Fabric Component
Description Inner Liner
NonWoven
Outer Layer
Woven Polypropylene
AOS, sieve 170 35
Water Flow Rate, gpm/ft2 81 336
Tested Bag Capacity, ft3 ~ 2.1

FlexStorm PC Inlet Filter Testing
November, 2009
Page 2
Test Soil
The test soil used is OK-110 Silica Sand by US Silica - See Appendix A for Product Data.
Test Preparation
SRD Installation – The Sediment Retention Device (SRD) installation used a simulated area inlet
comprised of a wooden “box” section and inlet opening to position the Inlet Filter Bags in a
representative condition.
Mixing Sediment-Laden Runoff - Sediment-laden runoff was created by combining water and
soil in the mixing tank and agitating during the test. 8009 lb of water and 14 lbs of sand were
combined to create the sediment-laden runoff at a sediment concentration of 1750 mg/L. This
concentration was determined to be consistent with “post-construction” conditions.
Controlling Flow - Flow was controlled by opening a valve to release water through an outlet
pipe leading to the area inlet. Weight change in water leaving the hopper over time was used to
confirm average flow rates. Three tests were performed at low, medium, and high flow rates. A
new bag was used at the start of each test.
TEST SETUP
As noted, the submitted SRD installation used a simulated area inlet comprised of a wooden
“box” section and 24” diameter inlet opening to position the FLEXSTORM PC in a
representative field condition. Sediment laden flow was introduced through a pipe from the
mixing tank as shown in Figure 1.
Figure 1. Test set-up, including mixing tank and wooden box with simulated area inlet.
Inside View of
Hopper Agitator Hopper With Outlet Pipe
Leading To Area Inlet
Area Inlet Simulated Showing
Influent Discharge From Pipe

FlexStorm PC Inlet Filter Testing
November, 2009
Page 3
Test Procedure
Releasing and Collecting Sediment-Laden Runoff - The sediment-laden water was discharged at
average flow rates of 23, 48, and 70 gallons per minute, respectively, over the three tests.
effluent grab samples were collected throughout the tests and weight of water and sediment
discharged was recorded at regular intervals. Retention observations and associated times were
recorded during the test.
Figure 2. Collection of Sediments and Test Sampling.
CAPTURED SEDIMENT
GRAB SAMPLE CONTAINERS EFFLUENT GRAB SAMPLES TAKEN HERE

FlexStorm PC Inlet Filter Testing
November, 2009
Page 4 TEST RESULTS Laboratory TSS analysis results of the effluent grab samples are shown in Table 2 below along
with the percent removal rates. Total sediment and associated runoff measured during the
testing are the supporting data used to confirm the performance of the product tested in addition
to the measured TSS in the effluent grab samples. The sediment captured was compared to the
calculated sediment discharged to quantify the soil retention effectiveness and the removal rate
of the SRD.
Table 2. Measures of Effectiveness
*TSS Removal was measured in accordance with SM 2540D
Run: A B C
Sediment Load: 14 lbs sand + 8009 lbs water
Calculated Sediment Concentration (mg/L):
1750
Flow Rate (lb/min): 194 401 585
Flow Rate (gal/min): 23 48 70
Product Tested: FlexStorm PC FlexStorm PC FlexStorm PC
No. Time, min mg/L
% Removal No.
Time, min mg/L
% Removal No.
Time, min mg/L
% Removal
Samples (downstream): A1E 0 22 98.74% B1E 0 28 98.40% C1E 0 30 98.29%
A2E 1 12 99.31% B2E 1 10 99.43% C2E 1 24 98.63%
A3E 2 9.5 99.46% B3E 2 10 99.43% C3E 2 14 99.20%
A4E 3 12 99.31% B4E 3 10 99.43% C4E 3 10 99.43%
A5E 4 13 99.26% B5E 4 7 99.60% 3.25
A6E 5 7.4 99.58% B6E 5 6.9 99.61%
5.67 5.67
*Average TSS Removal Rate (%):
99.28% 99.32% 98.89%
Calculated Water In (lbs): 1100 2274 1901
Calculated Soil In (lbs): 1.92 3.98 3.33
Soil Captured + Bag (lbs): 2.8 4.89 4.23
Estimated Bag Wt. (lbs): 0.94 0.94 0.94
Net Sediment Captured (lbs): 1.90 3.95 3.29
Soil Retention Effectiveness (%):
98.70% 99.27% 98.88%
Total Estimated Soil In (lbs): 9.23
Tot Sediment Captured (lbs): 9.14
Total Soil Retention Effectiveness (%):
99.01%

FlexStorm PC Inlet Filter Testing
November, 2009
Appendix
APPENDIX A: OK-110 Silica Sand – Product Data

FlexStorm PC Inlet Filter Testing
November, 2009
Appendix

FlexStorm PC Inlet Filter Testing
November, 2009
Appendix
APPENDIX B – LABORATORY QUALIFICATIONS

FlexStorm PC Inlet Filter Testing
November, 2009
Appendix
Testing Expertise
TRI/Environmental (TRI) is a leading, accredited geosynthetic, plastic pipe, and erosion and
sediment control product testing laboratory. TRI’s large-scale erosion and sediment control
testing facility in the upstate of South Carolina at the Denver Downs Research Farm (DDRF) is
focused on full-scale erosion and sediment control performance tests.
Technical Oversight
Joel Sprague, P.E., TRI’s Senior Engineer provides technical oversight of all of TRI’s erosion
and sediment control testing and can be contacted at:
Mr. C. Joel Sprague, Senior Engineer
PO Box 9192, Greenville, SC 29604
Ph: 864/242-2220; Fax 864/242-3107; [email protected]
Mr. Sprague has been involved with the design of erosion and sediment control systems and the
research, development, and application of erosion and sediment control products/materials for
many years. He was the lead consultant in the development of bench-scale testing procedures for
the Erosion Control Technology Council. Mr. Sprague has authored numerous technical papers
on his research and is readily available to assist clients with their research and testing needs.
Operations Management
Sam Allen, TRI’s Division Vice President provides operational management of all TRI
laboratories and can be contacted at:
Mr. Sam Allen, Vice President & Program Manager
9063 Bee Caves Road
Austin, TX 78733
Ph: 512/263-2101; Fax: 512/263-2558; [email protected]
Mr. Allen pioneered the laboratory index testing of rolled erosion control products (RECPs) and
has been actively involved in the development and standardization of testing protocol and
apparatus for more than 10 years. He set up and oversees TRI’s erosion and sediment control
testing laboratories. His oversight responsibilities include test coordination, reporting, and
failure resolution associated with the National Transportation Product Evaluation Program
(NTPEP) for RECPs.
Subcontract Laboratory Sample Testing
TRI/Environmental (TRI) subcontracts with leading, accredited analytical laboratories for some
sample testing. Total Suspended Solids (TSS) testing and Oil and Grease (TPH/HEM) testing
are performed by:
Shealy Environmental Services, Inc.
106 Vantage Point Drive
West Columbia, SC 29172
Ph: 803/791-9700; Fax: 803/791-9111