Embed Size (px)
Citation preview
RSTI - ISI – 15/2010. La qualité des systèmes d’information, pages 105 to 124
Using the QBox platform to assess quality in data integration systems Fernando Lemos — Mohamed Reda Bouadjenek Mokrane Bouzeghoub — Zoubida Kedad Laboratoire PRiSM, Université de Versailles 45, avenue des Etats-unis, F-78035, Versailles cedex {fernando.lemos, reda.bouadjenek, mokrane.bouzeghoub, zoubida.kedad} @prism.uvsq.fr ABSTRACT. The data quality market is characterized by a sparse offer of tools, providing specific functions that have their own interest but are not sufficient to deal with broader user’s requirements. Interoperating among these tools remains a technical challenge because of the heterogeneity of their models and access patterns. On the other side, quality analysts require more and more integration facilities that allow them to consolidate and aggregate multiple quality measures acquired from different observations, using different tools. The QBox platform aims at filling this gap by supplying (i) a generic meta-model that supports the definition of quality goals and metrics, (ii) a service-based infrastructure that allows interoperability among several quality tools and (iii) an OLAP-based quality model to support multidimensional analysis and visualization. This paper describes these three components whose usage is illustrated using a data integration scenario. RÉSUMÉ. Une large collection d’outils commerciaux et open source disponibles sur le marché est proposée pour gérer les problèmes de qualité des données dans les systèmes d’information. Chacun de ces outils fournit des fonctionnalités spécifiques, et a sa propre vision de la qualité des données, mais ne suffit pas à répondre aux besoins vastes des utilisateurs. D’un côté, faire interagir ces outils entre eux demeure un défi technique en raison de l’hétérogénéité de leurs modèles et méthodes d'accès. D’un autre côté, les analystes de la qualité exigent de plus en plus de facilité d’intégration, leur permettant de consolider et de regrouper plusieurs mesures de qualité acquises et provenant de différentes observations. La QBox est une plateforme qui vise à répondre aux besoins cités ci-dessus en fournissant (i) un métamodèle générique qui permet de définir des objectifs et des métriques de qualité (ii) une infrastructure d’intégration à base de services qui permet l’interopérabilité de plusieurs outils de qualité (iii) une analyse et une visualisation multidimensionnelle des mesures effectuées basées sur OLAP. Cet article décrit ces trois composants, dont l’usage est démontré à travers un scénario d’intégration de données. KEYWORDS: data and information quality, goal-question-metric approach, service-oriented architecture, OLAP design and visualization. MOTS-CLÉS : qualité des données, approche GQM, architecture orientée services, visualisation et analyse multidimensionnelle.
DOI:10.3166/ISI.15.6.105-124 © 2010 Lavoisier, Paris

106 RSTI - ISI – 15/2010. La qualité des systèmes d’information
1. Introduction
Data integration systems are now well established in many organizations. Many integration infrastructures and tools are supplied in the market place to build business applications and to provide support to decision support systems, data warehousing, EII, CRM, MDM, etc. The success of these applications and the explosion of data sources were accompanied by new requirements imposed on data quality: the more the number of data sources increases, the more data quality becomes a challenge for their users. Indeed, gathering data from many distributed and heterogeneous data sources, and integrating this data, pose a number of problems related to the coherence, completeness, redundancy, freshness, accuracy, and so on. Therefore, handling data quality issues is a necessary complement to data integration systems without which no integrated/aggregated data can be trusted and used for any strategic business decision.
Several quality tools have been proposed in the last years to measure and improve data quality. Many of them provide either low-level profiling functionalities (e.g., number of tuples, number of null-values) or quality-oriented functionalities (e.g., rule validation, duplicate search). Among these tools, we have studied (González et al., 2009; Peralta, 2006) some focusing on their interesting functionalities: DataCleaner1 allows profiling, validating and analyzing data through the identification of string patterns, dictionary lookup, JavaScript validation rules and regular expression validation. Talend Open Profiler2 generates statistics of many types. Oracle Data Profiling3 allows monitoring quality metrics and discovering rules. Joppelganger4 allows similarity checking in addresses lists. Other tools also allow data cleaning, standardization and duplicate elimination: DQguru5 allows cleaning and eliminating duplicates in addresses. Aggregate Profiler6 allows enriching data after profiling, filtering, checking for similarities and processing real-time alerts. Open Data Quality7 manages data from multiple sources allowing the matching, standardization and cleaning of this data. Some other tools provide graphical environments to design data transformations and to manage their execution and coordination: Talend Open Studio8 generates code for executing the graphically-defined operations. Pentaho DI (Kettle)9, Microsoft Integration Services10 and Oracle Data Quality also allows invoking executable files.
1. http://datacleaner.eobjects.org 2. http://www.talend.com/products-data-quality/talend-open-profiler.php 3. http://www.oracle.com/technology/products/oracle-data-quality 4. http://sourceforge.net/projects/joppelganger 5. http://www.sqlpower.ca/page/dqguru 6. http://sourceforge.net/projects/dataquality 7. https://open-dm-dq.dev.java.net 8. http://www.talend.com/products-data-integration/talend-open-studio.php 9. http://kettle.pentaho.org 10. http://www.microsoft.com/sqlserver/2008/en/us/integration.aspx
Using QBox to assess quality in DIS 107
In spite of their process-oriented approaches based on transformation workflows and fancy graphical interfaces, these tools are standalone applications having their own quality models, terminology and access patterns. Thus, combining them to achieve a complex quality goal that consolidates and aggregates multiple quality measures acquired from different observations necessitates a manual “glue”, which often discourages quality analysts. These limitations generate an important gap between users’ quality needs (generally, complex goals combining several quality factors) and the quality measures that can be computed from isolated tools. Many organizations have expressed their needs to interoperate between several quality tools in order to aggregate several quality measures or to study correlations between different quality factors. This highlights the importance of developing a quality management platform that handles a unified quality model and allows interoperation between a wide spectrum of existing or newly defined tools.
In previous works (González et al., 2009), we have presented a general architecture of a service-based platform for quality evaluation, called QBox-Services, and we have sketched the main components of this platform. Following this work, the contributions presented in this paper are: (i) definition of the service-oriented infrastructure for QBox that facilitates invocation of independent quality services, particularly the definition, discovery and execution of these services, (ii) definition of a unified quality model that can be customized and adapted to each quality project, (iii) definition of a multidimensional view of quality measures facilitating OLAP navigation through measures and visual correlations between quality factors. A motivating example taken from a real data integration process will illustrate, all along the paper, the main features of our approach. These contributions are composed into a unique product architecture.
The QBox development has been initiated to fulfill user requirements gathered and synthesized during the first phase of the Quadris Project11 (2005-2009), supported by the French ANR program on Data Masses and the STIC-AMSUD Program12 on distributed data integration. Besides the need of advanced quality models and quality assessment methods, both projects emphasized the need for multi-tools quality environment and for more flexibility in quality tools integration.
The remaining of the paper is organized as follows: Section 2 presents the motivating example. Section 3 defines the quality meta-model. Section 4 describes the service-oriented approach architecture and mechanism. Section 5 illustrates the use of the proposed system. Section 6 talks about the process of improving data quality. Finally, Section 7 presents our conclusions and future works.
11. http://deptinfo.cnam.fr/xwiki/bin/view/QUADRIS 12. http://www.sticamsud.org/
108 RSTI - ISI – 15/2010. La qualité des systèmes d’information
2. Motivating example
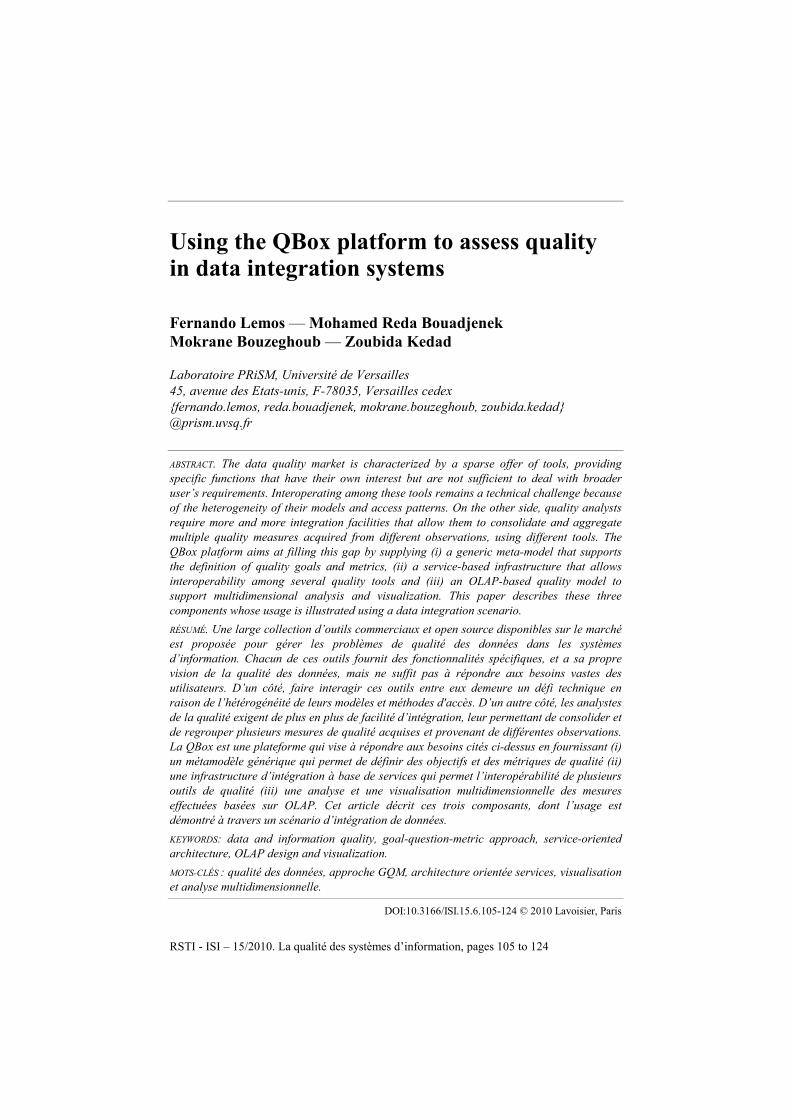
In this section, we present a scenario to motivate the use of QBox in the improvement of a data integration process. This scenario is extracted from a real data integration application. Consider a cloth factory that has three branches: NORTH, EAST and SOUTH. The database schema of each branch is presented in Figure 1. This database describes clients and sales. Each tuple in the CLIENT table is either a branch of the considered company or another company. Each tuple in the DOCUMENT table corresponds to several lines, each line concerning one specific article. A tuple in the DOCUMENT table is either a sale of articles to another company, or the transfer of articles from a branch to another. This is indicated by the value of the DOC TYPE attribute, which can indicate a sale, a transfer to a branch or a transfer from a branch.
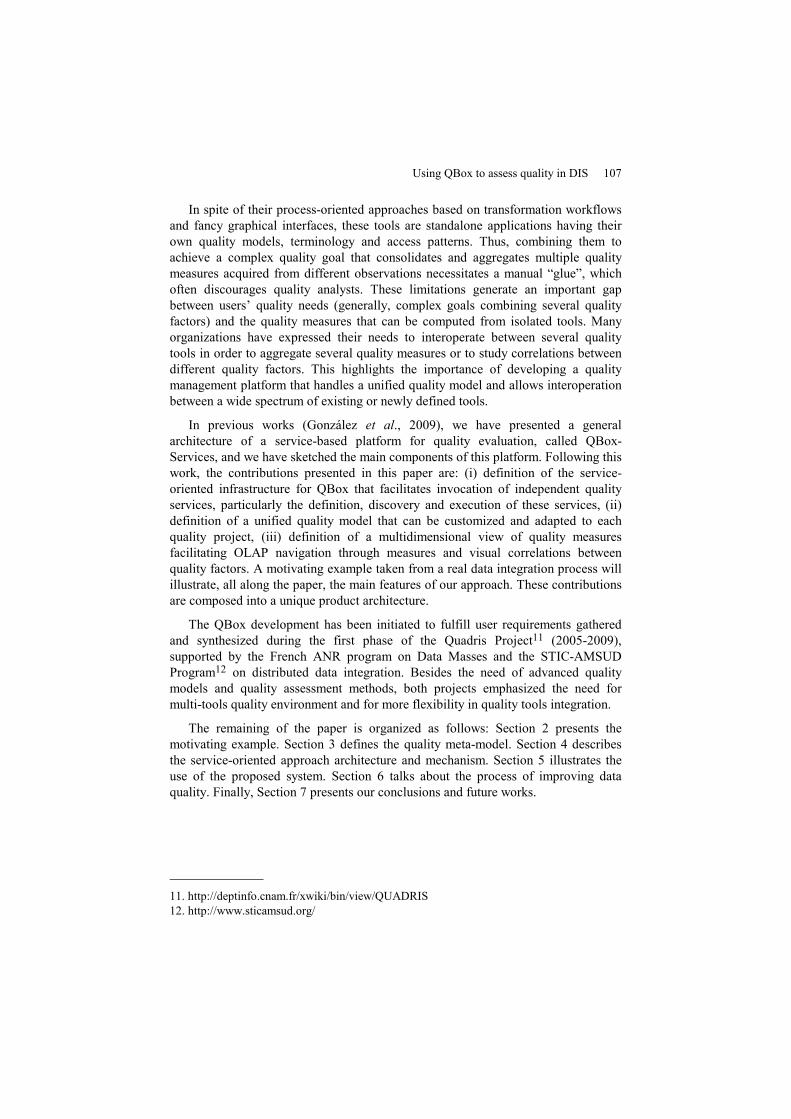
In order to provide to the factory managers an analytical scenario over the sales, a global database is generated from the integration of the three branches databases, which is guided by a data integration scenario (ETL scenario), roughly described in the central layer of Figure 2. The global database has the same structure as the local databases. We omit the details of the integration operations. The whole integration process is represented in Figure 2 by a single transformation operation called “Data Integration”. This scenario has been defined using the Kettle Pentaho ETL tool.
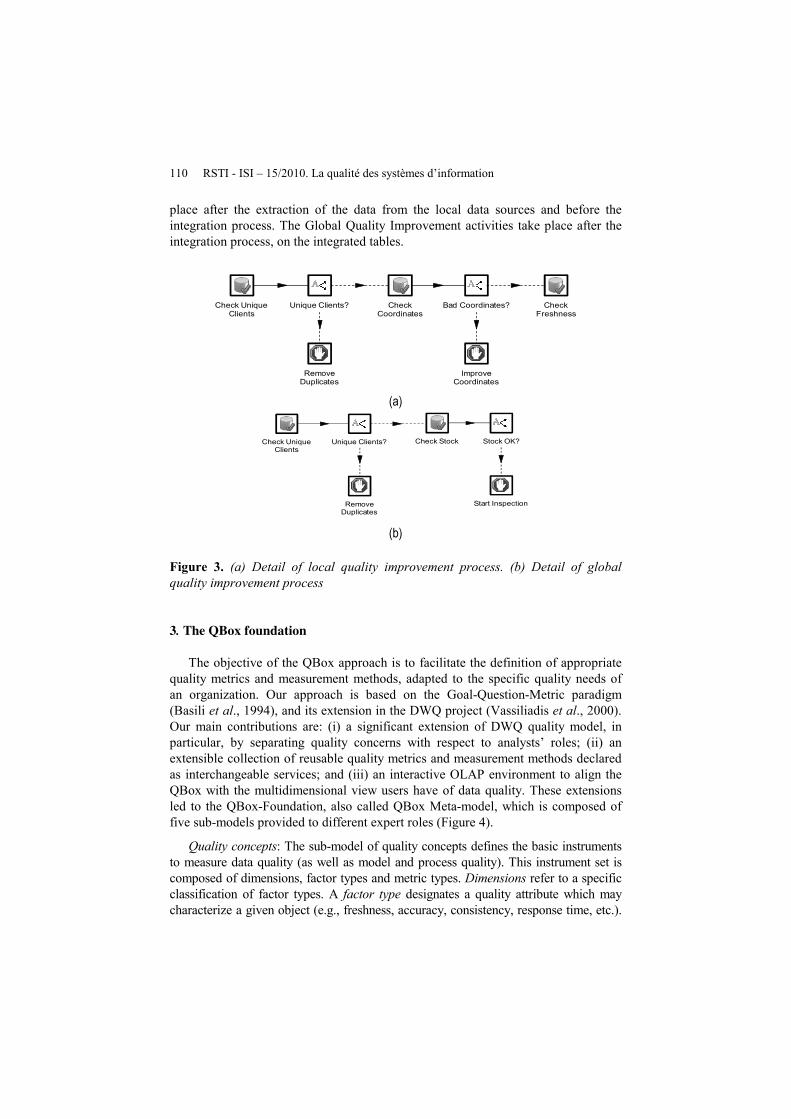
To improve the quality of the data managed during the integration process, a data quality scenario is defined (see the upper layer of Figure 2). This scenario is defined according to the quality requirements of the application, which are the following: (i) control and improve the quality of the data related to clients for each local data source, (ii) control the quality of the integrated database regarding both the consistency of the information related to the exchanges between branches, and the data related to the clients. The quality scenario is thus composed of two main phases: Local Quality Assessment and Global Quality Assessment. The local assessment phase covers aspects related to the uniqueness of the clients, their freshness and the quality of their coordinates in each of the local data sources, while the global assessment phase deals with the consistency of the stock and the uniqueness of the clients in the integrated database. Figure 3a depicts the main steps of the local improvement phase for a local data source. Figure 3b depicts the global assessment phase that controls the existence of duplicate clients introduced by the integration process and inspects the factory documents to verify if all the product exchanges between branches have been correctly registered in the database, i.e., it checks whether, for each outgoing document of one branch, there is the correspondent incoming document in the other branch for the same product exchange.
To improve the data integration process, another quality scenario (Data Production Improvement) is also defined (see Figure 2). This scenario measures, analyses and improves the integration operations (joins, unions, etc.) of the data integration process. The aspects related to the quality of the integration process are beyond the scope of this paper.
Using QBox to assess quality in DIS 109
CLIENTSCLI_CODE
CLI_NAMECLI_STREETCLI_ZIPCLI_CITYCLI_TELCLI_FAXCLI_EMAILCLI_URL
DOCUMENTSDOC_NUMBER
DOC_SERIAL_CODEDOC_TYPEDOC_STYPEDOC_DATEDOC_VALUECLIENT (FK)
ARTICLESART_CODE
ART_CBARART_TYPEART_LABELART_PRICE
LINESDOCUMENT (FK)LIN_NUMBER
ARTICLE (FK)LIN_QUANTITY
Figure 1. Relational schemas of the local branches and the global database
Data Quality Scenario
Data Integration Scenario
Data Integration Scenario
Process Quality Scenario
Local Quality Improvement Global Quality Improvement
DB_NORTH (Extract)
Data Integration (Transform) DB_GLOBAL (Load)DB_EAST (Extract)
DB_SOUTH (Extract)
Data Production Improvement
Figure 2. Data quality scenario, data integration scenario and process quality scenario
It is important to point out that the data quality scenario is independent from the data integration scenario. This logical separation provides many interesting features: (i) the ability to build a quality process over an existing data integration system; (ii) the capacity given to the quality analyst to use any quality tool he/she desires; and (iii) the possibility to connect and disconnect the quality process without impacting the data integration process (in particular, its performances). In Figure 2, the dotted arrows represent the way the activities of the data quality scenario and the data integration scenario are interleaved. The Local Quality Improvement activities take
110 RSTI - ISI – 15/2010. La qualité des systèmes d’information
place after the extraction of the data from the local data sources and before the integration process. The Global Quality Improvement activities take place after the integration process, on the integrated tables.
Check UniqueClients
Unique Clients?
RemoveDuplicates
CheckCoordinates
Bad Coordinates?
ImproveCoordinates
CheckFreshness
(a)
Check Stock Stock OK?
Start Inspection
Check UniqueClients
Unique Clients?
RemoveDuplicates
(b)
Figure 3. (a) Detail of local quality improvement process. (b) Detail of global quality improvement process
3. The QBox foundation
The objective of the QBox approach is to facilitate the definition of appropriate quality metrics and measurement methods, adapted to the specific quality needs of an organization. Our approach is based on the Goal-Question-Metric paradigm (Basili et al., 1994), and its extension in the DWQ project (Vassiliadis et al., 2000). Our main contributions are: (i) a significant extension of DWQ quality model, in particular, by separating quality concerns with respect to analysts’ roles; (ii) an extensible collection of reusable quality metrics and measurement methods declared as interchangeable services; and (iii) an interactive OLAP environment to align the QBox with the multidimensional view users have of data quality. These extensions led to the QBox-Foundation, also called QBox Meta-model, which is composed of five sub-models provided to different expert roles (Figure 4).
Quality concepts: The sub-model of quality concepts defines the basic instruments to measure data quality (as well as model and process quality). This instrument set is composed of dimensions, factor types and metric types. Dimensions refer to a specific classification of factor types. A factor type designates a quality attribute which may characterize a given object (e.g., freshness, accuracy, consistency, response time, etc.).

Using QBox to assess quality in DIS 111
A metric type designates a measurement instrument used to evaluate a factor type. The same factor type may be measured using different metrics. For example, table accuracy (a given factor type) can be measured using either syntactic correctness or semantic correctness. Similarly, table completeness can be measured as a ratio between null values and all values or as a ratio between present tuples and expected tuples. A first instantiation of these quality concepts provides a catalog of instruments that can be exploited by quality goals. It can be extended or modified by quality experts, depending on the context where the QBox is used.
Quality services: One of the main goals of the QBox is to help quality experts defining and searching quality services as well as their binding to specific quality goals and questions. The sub-model describing quality services represents the service catalog provided to measure quality factors for given quality metrics. These services are either provided as Web services or declared as local services. Among them, one can find quality evaluation services or quality improvement services. Quality evaluation services are devoted to the measurement of quality factors on given objects. Quality improvement services are devoted to all aspects that contribute to increase data quality as perceived by a specific stakeholder authoring a data quality goal. The next section will develop how quality services are defined in the QBox foundation.
SUB-MODEL 2QUALITY SERVICES
SUB-MODEL 1QUALITY CONCEPTS
Factor Type
Metric Type
AggregationService
ElementaryService
Dimension
SUBMODEL 3QUALITY GOALS
Quality Goal
Quality Question
AppliedFactor
AppliedMetric
AppliedService
SUB-MODEL 4MEASURED OBJECTS
Model Element
Process Model
SUB-MODEL 5QUALITY MEASURES
ObservationPeriod
Other GroupingDimensions
Data Instance
ImprovementProcess
Data Restr.Service
Process ReconfigService
ImprovementService
EvaluationService
MeasurementValue
MeasurableObject
11
0..*
1
1
0..*
0..*
0..*
0..*
1
1
1
1
10..*
0..*
0..*
1..*
0..*
0..*
0..*
1
1..*
1..*
1..*1
1
Figure 4. The QBox meta model
112 RSTI - ISI – 15/2010. La qualité des systèmes d’information
Quality goals and questions: The quality goals sub-model represents high-level quality needs, which are refined and decomposed into a set of quality questions. The answer to a quality question is defined by choosing and refining (i) a quality factor that best characterizes the question, (ii) a set of quality metrics that are appropriate to measure this factor and (iii) a set of methods of measurement of this metric. Quality factors and metrics are chosen from a library of generic quality concepts; measurement methods are chosen from a library of available quality services. If necessary, applied factors and metrics can be redefined by the quality expert.
Measured objects: The sub-model of measured objects defines the three kinds of objects that are subject to quality measurement and improvement: (i) model elements refer to data types defining the target information system (i.e., entity types of sources schemas or virtual schema of a data integration system). It may be of different granularity levels (attribute, table, integrity constraint, etc.). (ii) Data instances refer either to the data contained in local sources or to the data integrated from these local sources. It may also be of different granularity: cell, tuple, table, data source, etc. (iii) processes refer either to the integration process itself or to any business process that transforms data subject to quality analysis. Its granularity levels can be: query, activity, or the whole process.
Quality measures: The quality measures sub-model represents the result of executing a measurement service (for evaluating a quality goal), for a measurable object, at a given instant or during a period of time. Results of successive quality measurements serve to analyze behaviors and trends of the measured objects. Measurement values are organized in a multidimensional space which may include, besides time dimension, other dimensions such as location of a given data or process. Generally, improvement actions are taken based on this multidimensional analysis which allows making visual correlations between quality factors.
We can distinguish between different roles using the QBox platform, corresponding to the different sub-models in Figure 4. The quality management experts are responsible for the definition and maintenance of the library of quality concepts (sub-model 1). They define the quality dimensions, factor types and metrics types of the library independently from a specific context. The business managers are responsible for the definition of quality goals for a considered application context and the decomposition of the goals into a set of quality questions (sub-model 3), setting the concerned IS objects and the associated quality factors, which are selected from the library of factor types. The information system administrator is responsible for ensuring access to IS objects (sub-model 4). The quality analyst is responsible for the specialization of the metrics and services (sub-model 3), the execution of the services and the analysis of the results (sub-model 5). He is also responsible for the registration of both the improvement and the evaluation services.
We now illustrate the instantiation and the use of this meta-model for our application scenario. The quality requirements in our scenario lead to the following quality goals: (i) control and improve the local data related to clients (goal G1), and
Using QBox to assess quality in DIS 113
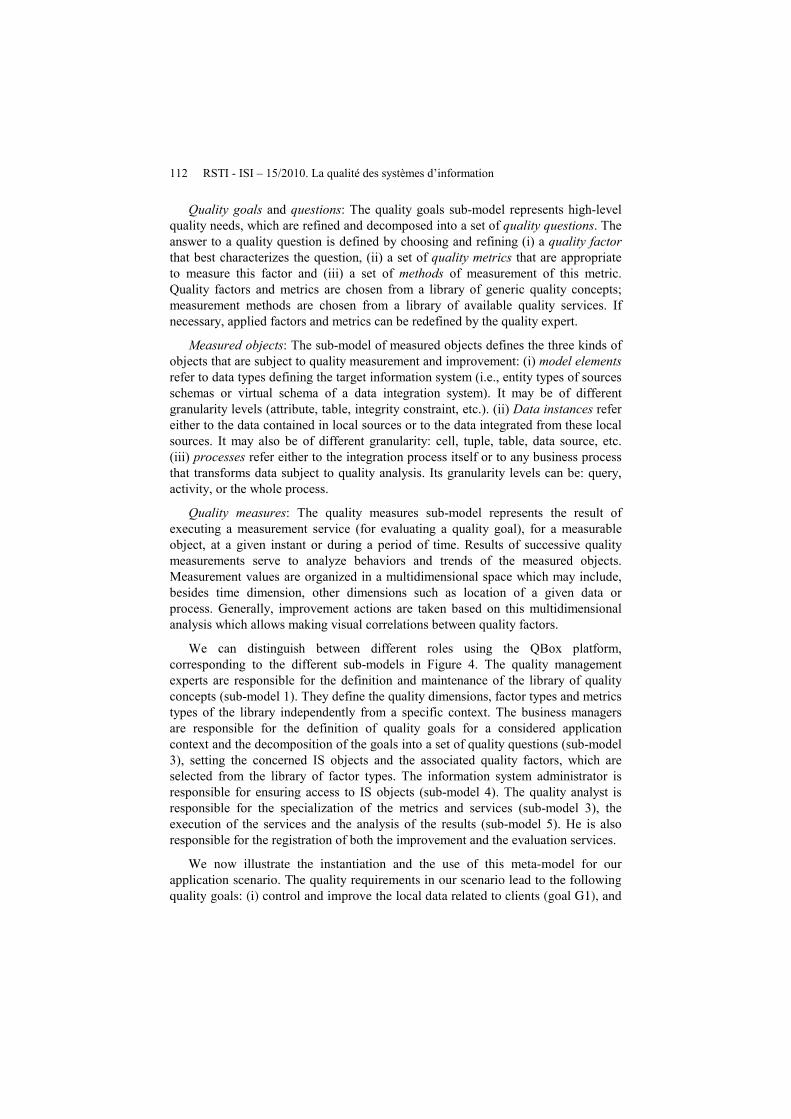
(ii) control the consistency of the integrated database regarding the exchanges between branches and the quality of the data related to clients (goal G2). The quality goal G1 is decomposed into three questions, as shown in Table 1. Question Q1 which aims at checking the presence of duplicate clients in a local database, question Q2 which aims at checking the quality of the clients’ coordinates and question Q3, which aims at checking the freshness of the clients data. Each question is then associated to a quality factor and a set of quality metrics that are appropriate to measure this factor. Question Q1 is associated to the uniqueness quality factor, applied to both the clients’ names and the clients’ emails, which correspond respectively to the CLI_NAME and CLI_EMAIL attributes in the CLIENTS table. Among all the metrics associated to this factor, the quality expert has chosen to use duplica ratio metric.
Question Q2 is associated to the syntactic correctness factor, applied to the ZIP code, telephone number, URL, fax and city of the clients, corresponding respectively to attributes CLI_ZIP, CLI_TEL, CLI_URL, CLI_FAX and CLI_CITY in the CLIENT table. The syntactic correctness factor expresses the degree to which data is free of syntactic errors such as misspellings and format discordances. The selected metric to evaluate this factor is syntactic correctness ratio.
Question Q3 is associated to the currency factor, expressing how stale is data related to the resources. The selected metric is freshness ratio, applied on the CLIENT table, and representing the percentage of tuples that are not up to date.
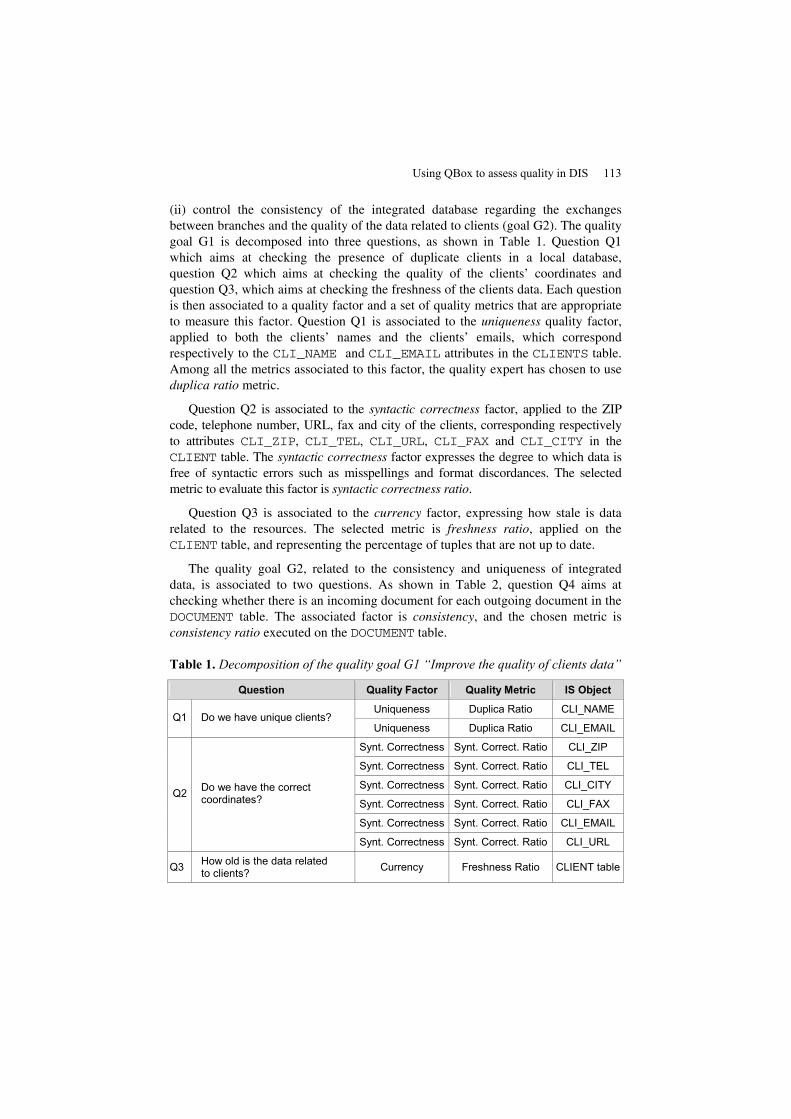
The quality goal G2, related to the consistency and uniqueness of integrated data, is associated to two questions. As shown in Table 2, question Q4 aims at checking whether there is an incoming document for each outgoing document in the DOCUMENT table. The associated factor is consistency, and the chosen metric is consistency ratio executed on the DOCUMENT table.
Table 1. Decomposition of the quality goal G1 “Improve the quality of clients data”
Question Quality Factor Quality Metric IS Object
Uniqueness Duplica Ratio CLI_NAME Q1 Do we have unique clients?
Uniqueness Duplica Ratio CLI_EMAIL
Synt. Correctness Synt. Correct. Ratio CLI_ZIP
Synt. Correctness Synt. Correct. Ratio CLI_TEL
Synt. Correctness Synt. Correct. Ratio CLI_CITY
Synt. Correctness Synt. Correct. Ratio CLI_FAX
Synt. Correctness Synt. Correct. Ratio CLI_EMAIL
Q2 Do we have the correct coordinates?
Synt. Correctness Synt. Correct. Ratio CLI_URL
Q3 How old is the data related to clients? Currency Freshness Ratio CLIENT table
114 RSTI - ISI – 15/2010. La qualité des systèmes d’information
Table 2. Decomposition of the quality goal G2 “Checking consistency of exchanges and quality of client’s data in integrated database”
Question Quality Factor Quality Metric IS Object
Q4 Do we have an incoming document for each outgoing document?
Consistency Consistency Ratio DOCUMENT table
Uniqueness Duplica Ratio CLI_NAME Q5 Do we have unique clients?
Uniqueness Duplica Ratio CLI_EMAIL
Figure 5. Refining goals into factors, questions and metrics using QBox
Question Q5 aims at checking if the integration process has introduced some duplicate clients in the integrated CLIENT table. Similarly to what has been defined for the local tables, the uniqueness of clients’ names and emails will be checked.
Using QBox to assess quality in DIS 115
The corresponding factor is uniqueness and the associated metric is duplica ratio applied to the CLI_NAME and CLI_EMAIL attributes in the CLIENTS integrated table.
The definition of the goals and questions is done using the goal edition interface of the QBox platform, as shown in Figure 5. The goal and questions names and descriptions are inserted by the user. For each question, the related factors and metrics are selected from the QBox catalog.
4. The QBox services
This section describes the way services are added to the QBox Foundation. A service is either a Web service, which is provided within a service catalog (e.g., UDDI), a user defined service, which should be published into a catalog, or an abstract service, which allows integrating existing quality tools as services in order to use them in the same way as the other services.
4.1. A SOA-based view of the QBox
Nowadays, a large collection of commercial and open source tools are proposed for dealing with data quality problems in information systems. However, each quality tool has its particular view of data quality. On the one side, the interoperability among these tools remains a technical challenge because of the heterogeneity of both their models and their access interfaces. On the other side, quality analysts require more and more integration facilities that allow them to consolidate and aggregate multiple quality measures acquired from different observations.
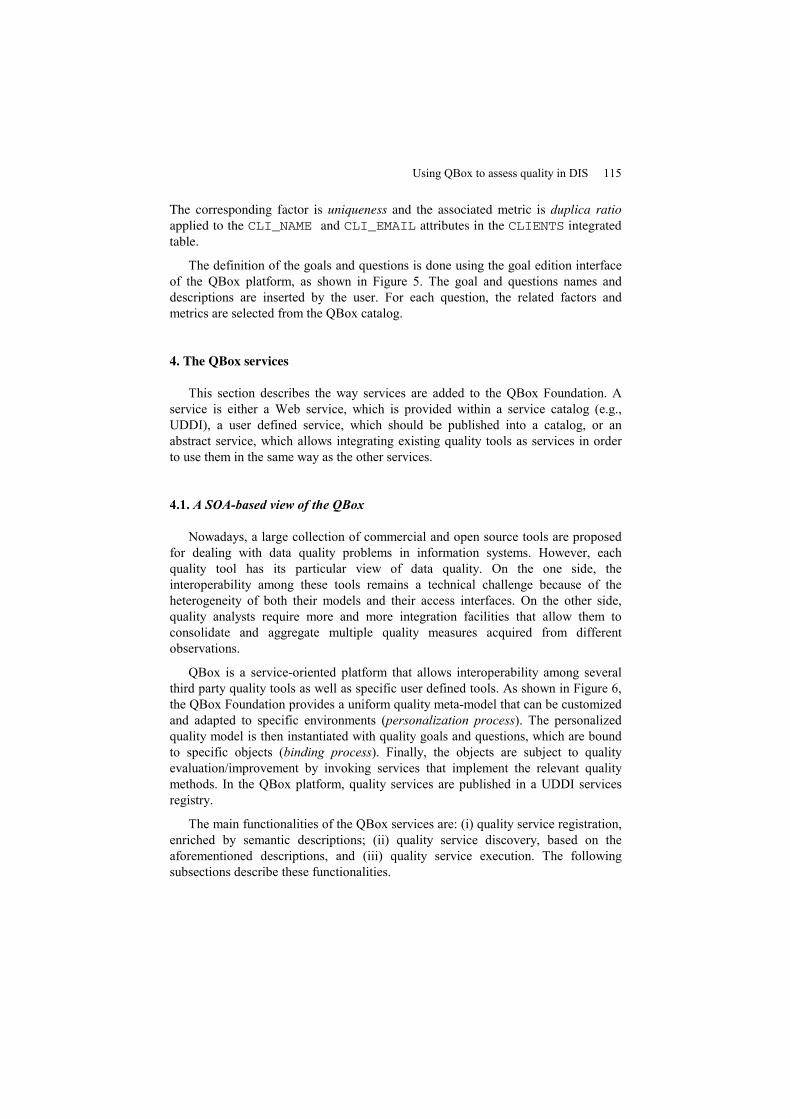
QBox is a service-oriented platform that allows interoperability among several third party quality tools as well as specific user defined tools. As shown in Figure 6, the QBox Foundation provides a uniform quality meta-model that can be customized and adapted to specific environments (personalization process). The personalized quality model is then instantiated with quality goals and questions, which are bound to specific objects (binding process). Finally, the objects are subject to quality evaluation/improvement by invoking services that implement the relevant quality methods. In the QBox platform, quality services are published in a UDDI services registry.
The main functionalities of the QBox services are: (i) quality service registration, enriched by semantic descriptions; (ii) quality service discovery, based on the aforementioned descriptions, and (iii) quality service execution. The following subsections describe these functionalities.
116 RSTI - ISI – 15/2010. La qualité des systèmes d’information
QualityService 1
QualityService n
…
Service Registry(UDDI)
ServiceDescription
references
ServiceDescription
…
Delegate
QManagement
QMediator
Information Systems
Meta-Model
General Quality
Meta-Model
Personalized Quality Model (PQM)
personalizationbinding
QFoundationPQM
Quality Requirements
Store
Get
Figure 6. The SOA-based architecture of the QBox
4.2. Defining quality services
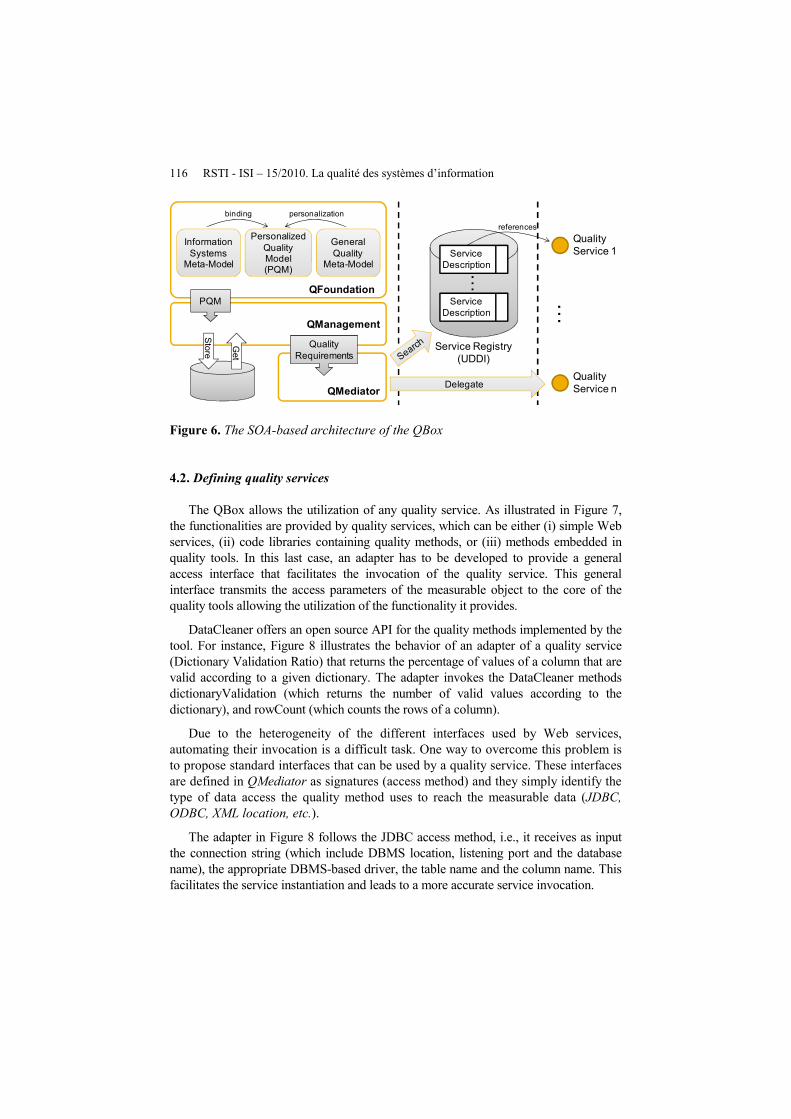
The QBox allows the utilization of any quality service. As illustrated in Figure 7, the functionalities are provided by quality services, which can be either (i) simple Web services, (ii) code libraries containing quality methods, or (iii) methods embedded in quality tools. In this last case, an adapter has to be developed to provide a general access interface that facilitates the invocation of the quality service. This general interface transmits the access parameters of the measurable object to the core of the quality tools allowing the utilization of the functionality it provides.
DataCleaner offers an open source API for the quality methods implemented by the tool. For instance, Figure 8 illustrates the behavior of an adapter of a quality service (Dictionary Validation Ratio) that returns the percentage of values of a column that are valid according to a given dictionary. The adapter invokes the DataCleaner methods dictionaryValidation (which returns the number of valid values according to the dictionary), and rowCount (which counts the rows of a column).
Due to the heterogeneity of the different interfaces used by Web services, automating their invocation is a difficult task. One way to overcome this problem is to propose standard interfaces that can be used by a quality service. These interfaces are defined in QMediator as signatures (access method) and they simply identify the type of data access the quality method uses to reach the measurable data (JDBC, ODBC, XML location, etc.).
The adapter in Figure 8 follows the JDBC access method, i.e., it receives as input the connection string (which include DBMS location, listening port and the database name), the appropriate DBMS-based driver, the table name and the column name. This facilitates the service instantiation and leads to a more accurate service invocation.
Using QBox to assess quality in DIS 117
As mentioned, the service registration is enriched by semantic descriptions. We take advantage of the categorization feature of the UDDI model to differentiate quality services and provide an accurate service discovery. The classification system we use is composed of five taxonomies: (i) qbox-org:quality:operation, which represents quality operations (calculus, improvement or analysis); (ii) qbox-org:quality:indicator, which represents quality indicators (quality factors and quality metrics); (iii) qbox-org:object:type, which represents categories of IS objects (column, table, XML File, process, etc.); (iv) qbox-org:object:datatype, which represents datatypes of IS objects (string, numeric, well-formed XML, etc.); and (v) qbox-org:object:access-pattern, which represents the types of access pattern.
Quality Tool
API
Core
Quality Library
public class{
…}
Web Service Web Service Web Service
Adapter
Adapter DataCleaner
dictionaryValidation()
getRowCount()
getRatio()
Figure 7. Web services definition Figure 8. Behavior of a sample adapter
Table 3. Sample of service registry in the Qbox
Name Type Quality Indicator IS Category IS Datatype
Access Method
DictionaryValidation Ratio
calculus Synt. Correctness Ratio column string, numeric JDBC
DuplicaRatio calculus Duplica Ratio column String, numeric JDBC
To register a quality service via QBox, the user must indicate: (i) name and description of the service; (ii) the URL of the WDSL description corresponding to the quality service; and (iii) the values for the five taxonomies. For example, Table 3 shows the values for registering the service Dictionary Validation Ratio and Duplica Ratio.
118 RSTI - ISI – 15/2010. La qualité des systèmes d’information
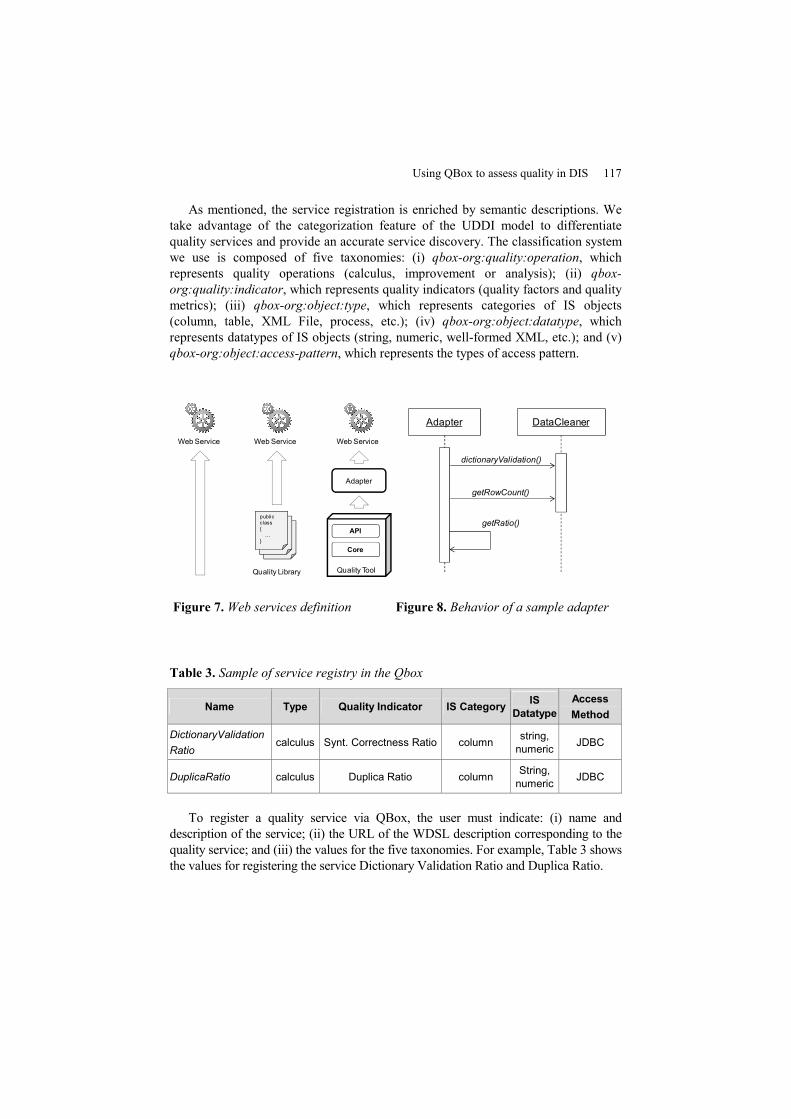
4.3. Discovering quality services
Figure 9 presents the quality service discovery process. The QMediator module implements the access methods for querying the service registry. Based on the quality requirements defined in the goal, QMediator searches and executes the quality services that best match these requirements. When queried, the service registry returns a set of quality services that potentially meet the needs. These services are returned as a set of abstract quality services, each of them being the description of the quality functionality provided. This description includes the involved quality concepts (dimension, factor and metric), the type of provided functionality (calculus, analysis or improvement) and the targeted IS object. This latter includes object category (tables, XML files, etc.), object datatype (string, date, numeric, etc.) and access methods (JDBC, ODBC, etc.). If the discovery process returns more than one service, the current version of QMediator selects the most frequently used one, but it is also possible to explicitly choose another service.
For example, the service discovery for the IS object CLI_NAME for goal G1 of Section 3 takes into account a service of calculus that implements the quality indicator duplica ratio over a column of type string. The service Duplica Ratio matches all these requirements and is a potential result of the discovery process.
UDDI Services Registry
QMediator Quality Service
Discover Publish
Consume
Figure 9. Quality service publishing, discovery and consuming
4.4. Executing quality services
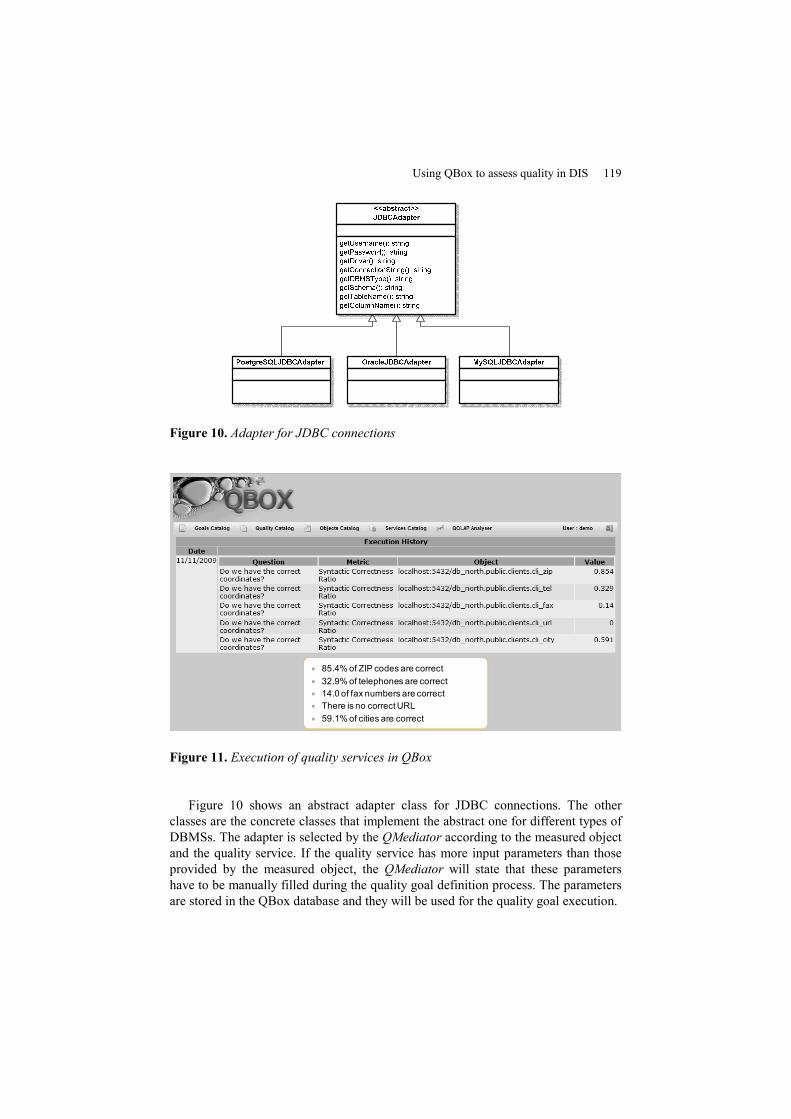
Once the quality service has been bound to the goal, the QMediator is ready to invoke it. The invocation of a service is done in two phases: (i) first, the QMediator analyzes the access method of the service and chooses the apropriate object adapter to retrieve the parameters’ values. The object adapter encapsulates the IS object such that the QMediator can access object metadata regardless the way the object is stored. Then, (ii) the service is executed and the result is stored in a multidimensional structure. Quality services may be periodically executed or may be punctually invoked by a user executing a quality goal.
Using QBox to assess quality in DIS 119
Figure 10. Adapter for JDBC connections
85.4% of ZIP codes are correct32.9% of telephones are correct14.0 of fax numbers are correctThere is no correct URL59.1% of cities are correct
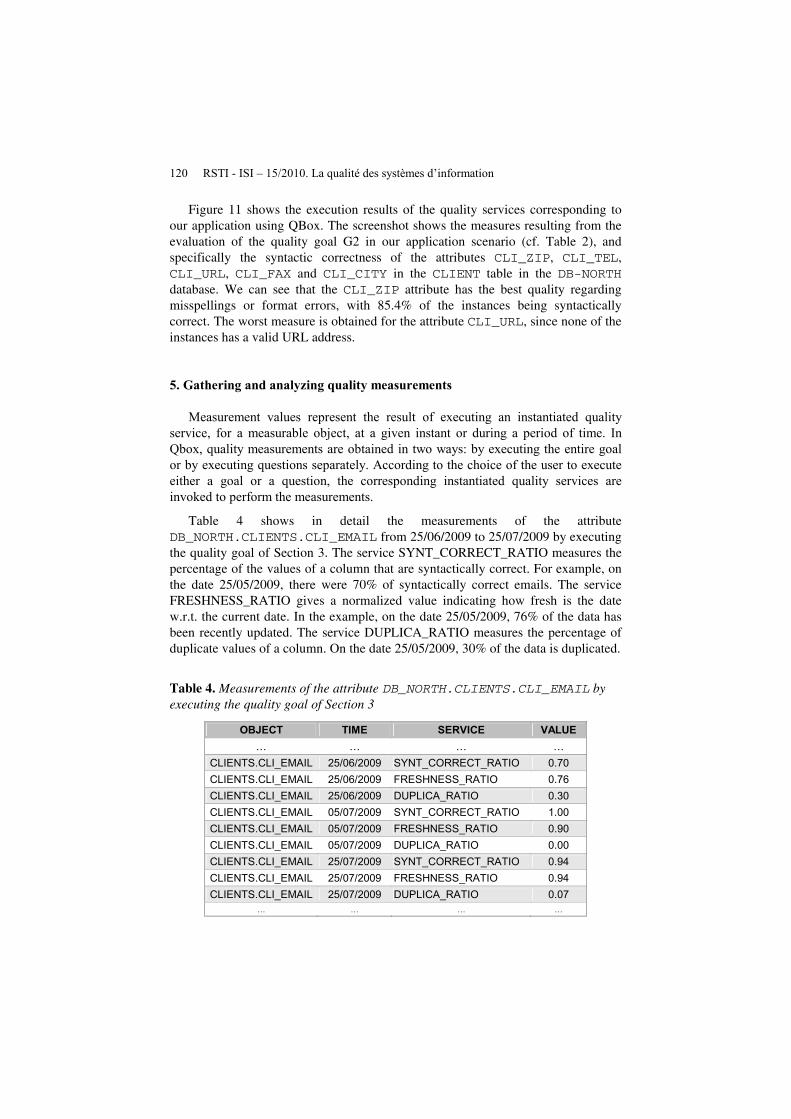
Figure 11. Execution of quality services in QBox
Figure 10 shows an abstract adapter class for JDBC connections. The other classes are the concrete classes that implement the abstract one for different types of DBMSs. The adapter is selected by the QMediator according to the measured object and the quality service. If the quality service has more input parameters than those provided by the measured object, the QMediator will state that these parameters have to be manually filled during the quality goal definition process. The parameters are stored in the QBox database and they will be used for the quality goal execution.
120 RSTI - ISI – 15/2010. La qualité des systèmes d’information
Figure 11 shows the execution results of the quality services corresponding to our application using QBox. The screenshot shows the measures resulting from the evaluation of the quality goal G2 in our application scenario (cf. Table 2), and specifically the syntactic correctness of the attributes CLI_ZIP, CLI_TEL, CLI_URL, CLI_FAX and CLI_CITY in the CLIENT table in the DB-NORTH database. We can see that the CLI_ZIP attribute has the best quality regarding misspellings or format errors, with 85.4% of the instances being syntactically correct. The worst measure is obtained for the attribute CLI_URL, since none of the instances has a valid URL address.
5. Gathering and analyzing quality measurements
Measurement values represent the result of executing an instantiated quality service, for a measurable object, at a given instant or during a period of time. In Qbox, quality measurements are obtained in two ways: by executing the entire goal or by executing questions separately. According to the choice of the user to execute either a goal or a question, the corresponding instantiated quality services are invoked to perform the measurements.
Table 4 shows in detail the measurements of the attribute DB_NORTH.CLIENTS.CLI_EMAIL from 25/06/2009 to 25/07/2009 by executing the quality goal of Section 3. The service SYNT_CORRECT_RATIO measures the percentage of the values of a column that are syntactically correct. For example, on the date 25/05/2009, there were 70% of syntactically correct emails. The service FRESHNESS_RATIO gives a normalized value indicating how fresh is the date w.r.t. the current date. In the example, on the date 25/05/2009, 76% of the data has been recently updated. The service DUPLICA_RATIO measures the percentage of duplicate values of a column. On the date 25/05/2009, 30% of the data is duplicated.
Table 4. Measurements of the attribute DB_NORTH.CLIENTS.CLI_EMAIL by executing the quality goal of Section 3
OBJECT TIME SERVICE VALUE … … … …
CLIENTS.CLI_EMAIL 25/06/2009 SYNT_CORRECT_RATIO 0.70 CLIENTS.CLI_EMAIL 25/06/2009 FRESHNESS_RATIO 0.76 CLIENTS.CLI_EMAIL 25/06/2009 DUPLICA_RATIO 0.30 CLIENTS.CLI_EMAIL 05/07/2009 SYNT_CORRECT_RATIO 1.00 CLIENTS.CLI_EMAIL 05/07/2009 FRESHNESS_RATIO 0.90 CLIENTS.CLI_EMAIL 05/07/2009 DUPLICA_RATIO 0.00 CLIENTS.CLI_EMAIL 25/07/2009 SYNT_CORRECT_RATIO 0.94 CLIENTS.CLI_EMAIL 25/07/2009 FRESHNESS_RATIO 0.94 CLIENTS.CLI_EMAIL 25/07/2009 DUPLICA_RATIO 0.07
… … … …
Using QBox to assess quality in DIS 121
Results of successive quality measurements serve to analyze behaviors and trends of the measured objects. As a consequence, improvement actions can be specified and implemented based on this analysis. However, dealing with such important amount of values can be complex and time consuming. In this case, the use of OLAP concepts and technology can provide an effective support.
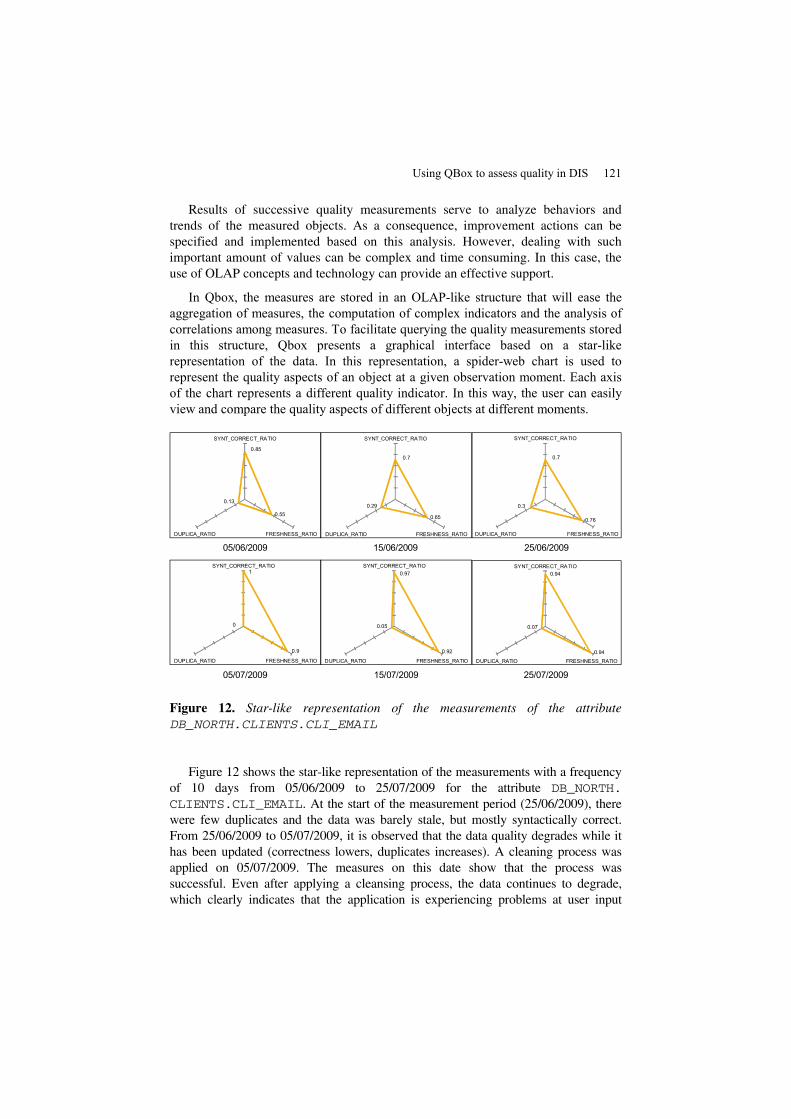
In Qbox, the measures are stored in an OLAP-like structure that will ease the aggregation of measures, the computation of complex indicators and the analysis of correlations among measures. To facilitate querying the quality measurements stored in this structure, Qbox presents a graphical interface based on a star-like representation of the data. In this representation, a spider-web chart is used to represent the quality aspects of an object at a given observation moment. Each axis of the chart represents a different quality indicator. In this way, the user can easily view and compare the quality aspects of different objects at different moments.
0.85
0.55
0.13
SYNT_CORRECT_RATIO
FRESHNESS_RATIODUPLICA_RATIO
0.7
0.65
0.29
SYNT_CORRECT_RATIO
FRESHNESS_RATIODUPLICA_RATIO
1
0.9
0
SYNT_CORRECT_RATIO
FRESHNESS_RATIODUPLICA_RATIO
0.97
0.92
0.05
SYNT_CORRECT_RATIO
FRESHNESS_RATIODUPLICA_RATIO
0.94
0.94
0.07
SYNT_CORRECT_RATIO
FRESHNESS_RATIODUPLICA_RATIO
05/06/2009 15/06/2009
05/07/2009 15/07/2009 25/07/2009
0.7
0.76
0.3
SYNT_CORRECT_RATIO
FRESHNESS_RATIODUPLICA_RATIO
25/06/2009
Figure 12. Star-like representation of the measurements of the attribute DB_NORTH.CLIENTS.CLI_EMAIL
Figure 12 shows the star-like representation of the measurements with a frequency of 10 days from 05/06/2009 to 25/07/2009 for the attribute DB_NORTH. CLIENTS.CLI_EMAIL. At the start of the measurement period (25/06/2009), there were few duplicates and the data was barely stale, but mostly syntactically correct. From 25/06/2009 to 05/07/2009, it is observed that the data quality degrades while it has been updated (correctness lowers, duplicates increases). A cleaning process was applied on 05/07/2009. The measures on this date show that the process was successful. Even after applying a cleansing process, the data continues to degrade, which clearly indicates that the application is experiencing problems at user input
122 RSTI - ISI – 15/2010. La qualité des systèmes d’information
level. Note that the existing data visualization tools generally focus on the data itself. The facilities provided by QBox focus on the visualization of the quality measures, independently from the visualization of the data.
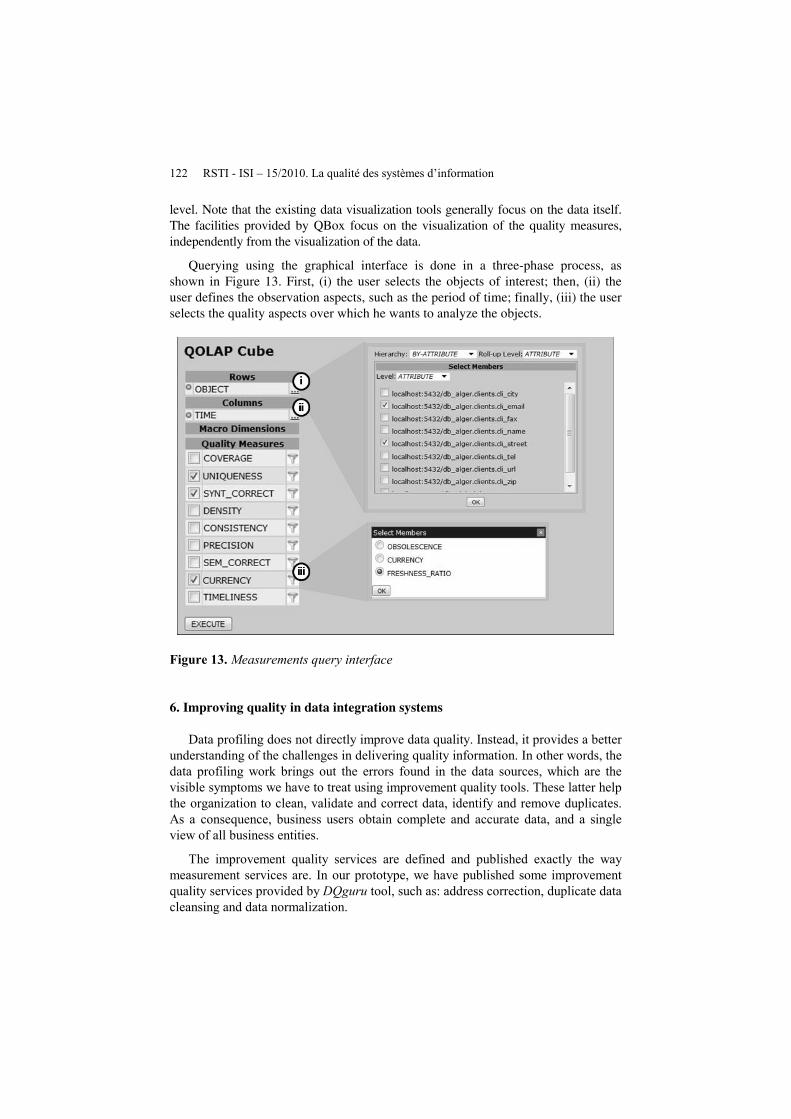
Querying using the graphical interface is done in a three-phase process, as shown in Figure 13. First, (i) the user selects the objects of interest; then, (ii) the user defines the observation aspects, such as the period of time; finally, (iii) the user selects the quality aspects over which he wants to analyze the objects.
Figure 13. Measurements query interface
6. Improving quality in data integration systems
Data profiling does not directly improve data quality. Instead, it provides a better understanding of the challenges in delivering quality information. In other words, the data profiling work brings out the errors found in the data sources, which are the visible symptoms we have to treat using improvement quality tools. These latter help the organization to clean, validate and correct data, identify and remove duplicates. As a consequence, business users obtain complete and accurate data, and a single view of all business entities.
The improvement quality services are defined and published exactly the way measurement services are. In our prototype, we have published some improvement quality services provided by DQguru tool, such as: address correction, duplicate data cleansing and data normalization.
Using QBox to assess quality in DIS 123
The quality analyst has to build his own process quality scenarios over the data integration process he manages. After each data profiling activity, the analyst should define the necessary improvement actions to deal with the possible data errors.
7. Conclusions
In this paper, we presented the QBox infrastructure, which allows integration of several independent quality tools. This integration is done through a service-oriented architecture. Rather than a new quality evaluation tool, our goal is to propose and open and extensible platform, able to make use of existing services as well as specifically designed ones. The general architecture of this platform has been introduced in previous work (González et al., 2009). In this paper, we present the definition of the service-oriented infrastructure for QBox, supporting the definition, discovery and execution of quality services. We also present the definition of a multidimensional view of quality measures facilitating OLAP navigation through measures and visual correlations between quality factors. The QBox platform provides an OLAP-like navigation language and interface that allows quality experts to browse and analyze quality measures obtained by the execution of quality services.
The QBox infrastructure has been used in many application scenarios, ranging from CRM to data warehousing and medical data applications (Etcheverry, Peralta, et al., 2008; Martirena, 2008; Etcheverry, Graña, et al., 2008; Sastre et al., 2008; Akoka et al., 2008). These experiments have enriched the successive versions of the QBox.
The multidimensional view of the quality measures described in this paper is an initial step towards quality analysis. One perspective to this work is to extend QBox to include statistical analysis functionalities as well as data mining functionalities to enable the discovery of dependencies and correlations between the quality factors.
8. References
Akoka J., Berti-Equille L., Boucelma O., Bouzeghoub M., Comyn-Wattiau I., Cosquer M., Goasdoué-Thion V., Kedad Z., Nugier S., Peralta V., Quafafou M., Sisaid-Cherfi S., “Evaluation de la qualité des systèmes multisources. Une approche par les patterns”, 4th Data and Knowledge Quality Workshop (DKQ’2008), 2008, France.
Basili V., Caldiera G., Rombach H. D., “The Goal Question Metric Approach”, Encyclopedia of Software Engineering, 1994, p. 528-532.
Etcheverry L., Graña M., Marotta A., Naya H., Raggio V., Ruggia R., “Enabling GWAS Meta-Analysis through data quality management”, Microsoft eScience Workshop, Indianápolis, USA, 2008.
124 RSTI - ISI – 15/2010. La qualité des systèmes d’information
Etcheverry L., Peralta V., Bouzeghoub M., “QBox-Foundation: a Metadata Platform for Quality Measurement”, 4e Atelier Qualité des données et des Connaisances (QDC’2008), 2008, Nice, France.
González L., Peralta V., Bouzeghoub M., Ruggia R., “QBox-Services: Towards a Service-Oriented Quality Platform”, QoIS 2009 - The Fourth International Workshop on Quality of Information System, in cunjonction with 28th International Conference on Conceptual Modeling (ER’2009), 2009, p. 232-242.
Martirena E., Medición de la calidad de datos: un enfoque parametrizable, Master Thesis, Universidad de la República, Uruguay, 2008.
Peralta V., Data Quality Evaluation in Data Integration Systems, PhD Thesis, Université de Versailles, 2006, France.
Sastre D., Peralta V., Ruggia R., “Evaluación de Calidad en una Aplicación de Data Warehousing: de la Definición de Metas a la Especificación de Métricas”, 6th Chilean Workshop on Databases (WBD’2008), Chili, 2008.
Vassiliadis P., Bouzeghoub M., Quix C., “Towards Quality-oriented Data Warehouse Usage and Evolution”, IADIS Information Systems Conference (IS’2000), 2000, p. 89-115.


![STAG-4 QBOX,QNEXT,STAG-300 QMAX - Instrukcja_ver1_7_4[07-01-2016]_PL](https://img.pdfslide.net/doc/110x75/56d6be221a28ab301690c4fe/stag-4-qboxqnextstag-300-qmax-instrukcjaver17407-01-2016pl.jpg)