Embed Size (px)
Citation preview

USING THE SIS TO ASSESS INDIVIDUAL NEEDS AND TO DEVELOPNEEDS AND TO DEVELOP
PERSON‐CENTERED FUNDING MODELS:
NATIONAL TRENDS, CROSS STATE RESULTS AND CASE STUDIES
24th National Annual Waiver Conference, Boston October 1, 2008,
Jon Fortune & John AgostaJon Fortune & John AgostaH S i R h I tit tH S i R h I tit tHuman Services Research InstituteHuman Services Research Institute7420 SW Bridgeport Road (#210)7420 SW Bridgeport Road (#210)
Portland, OR 97224Portland, OR 97224503503--924924--37833783
[email protected]@hsri.org [email protected]@hsri.org

Today’s Topics…
The national context and trends affecting service deliveryFocus on developing more equitableand individually tailored resource allocation models• The strategic planning process we use• The Supports Intensity Scale (SIS) and how it is being used
• Case studies and analysis from various statesYour questionsYour questions
2
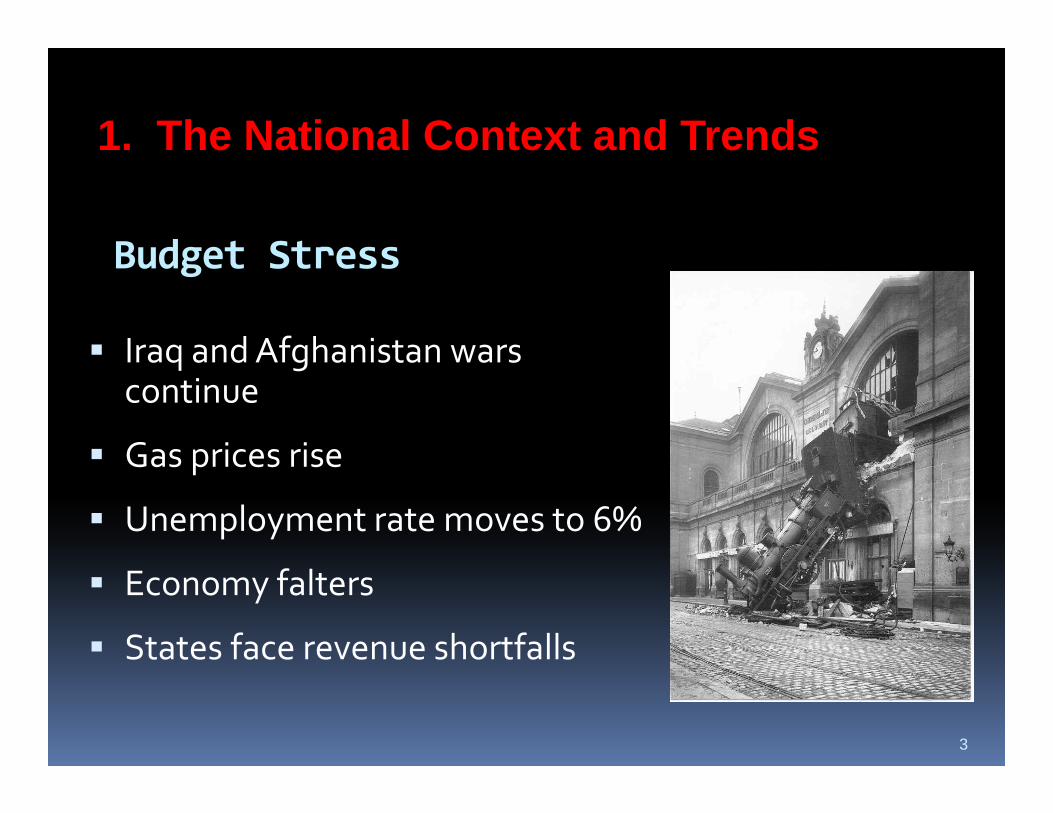
1. The National Context and Trends
Budget Stress
e at o a Co te t a d e ds
Budget Stress
Iraq and Afghanistan wars Iraq and Afghanistan wars continue
Gas prices riseGas prices rise
Unemployment rate moves to 6%
Economy falters
States face revenue shortfalls
3

30 States Report Budget GapsSIZE OF FY2009 BUDGET GAPS
State Amount
% FY08 General
Fund State Amount
% FY08 General
FundAlabama $784 million 9.20% Michigan1 $472 million 4.90%Arizona $1 9 billion 17 80% Minnesota $935 million 5 50%
Three other states — Missouri, Texas, andArizona $1.9 billion 17.80% Minnesota $935 million 5.50%
Arkansas $107 million 2.50% Mississippi $90 million 1.80%California1 2 $22.2 billion 21.30% Nevada $898 million 13.50%
Connecticut $150 million 0.90% New Hampshire
$200 million 6.40%
Texas, and Washington —project budget gaps in FY2010
Delaware $217 million 6.40% New Jersey$2.5 - $3.5
billion 7.6 - 10.6%
DC $96 million 1.50% New York $4.9 billion 9.10%
Florida $3.4 billion 11.00% Ohio$733 million -
$1.3 billion 2.7 - 4.7%
Georgia $245 million 1.20% Oklahoma $114 million 1.60%Illinois $1.8 billion 6.6% Rhode Island $430 million 12.60%
Iowa $350 million 6.00% South Carolina $250 million 3.70%Total
ShortfallKentucky $266 million 2.90% Tennessee
$468 million -$585 million 4.2 - 5.2%
Maine $124 million 4.00% Vermont $59 million 5.10%Maryland $808 million 5.50% Virginia $1.2 billion 6.90%
Shortfall$47.6 –
$49 2 billion
4
Massachusetts $1.2 billion 4.20% Wisconsin $652 million 4.80%
McNichol & Lav, Center on Budget and Policy Priorities, August 2008
$49.2 billion
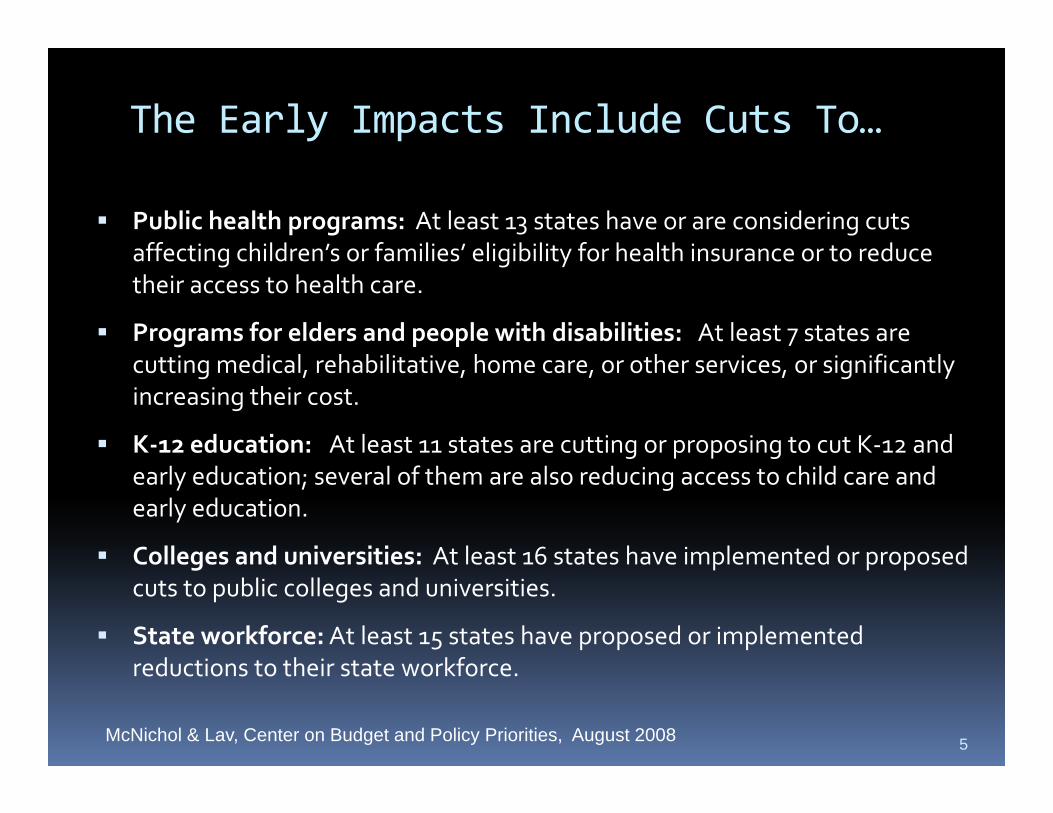
The Early Impacts Include Cuts To…
Public health programs: At least 13 states have or are considering cuts affecting children’s or families’ eligibility for health insurance or to reduce affecting children s or families eligibility for health insurance or to reduce their access to health care.
Programs for elders and people with disabilities: At least 7 states are i di l h bili i h h i i ifi l cutting medical, rehabilitative, home care, or other services, or significantly
increasing their cost.
K‐12 education: At least 11 states are cutting or proposing to cut K‐12 and g p p gearly education; several of them are also reducing access to child care and early education.
Colleges and universities: At least 16 states have implemented or proposed Colleges and universities: At least 16 states have implemented or proposed cuts to public colleges and universities.
State workforce:At least 15 states have proposed or implemented d ti t th i t t kfreductions to their state workforce.
5McNichol & Lav, Center on Budget and Policy Priorities, August 2008

Service Demand Is Going Up!Service Demand Is Going Up!
Demand for publicly‐funded developmentaldisabilities services is growing nationwide
I i i i h l i h l It is increasing at a rate greater than population growth alone
This increase in service demand is driven by:
People living longer or surviving traumaPeople living longer … or surviving trauma
Aging baby boomers
Turnover among individuals receiving services is reduced so that Turnover among individuals receiving services is reduced so that there is less capacity to absorb new demand
There is a growing number of individuals who live in households with i i h th l iprimary caregivers who are themselves aging
6

Waiting for Residential Services
People WaitingResidentialServices
% of Growth People Waiting Services
RecipientsNeeded
88,349 437,707 20%
People with ID/DD on a waiting List for, but not receiving, residential services on June 30, 2007
7
Prouty, R., Smith, G. and Lakin, K.C. (eds.) (2008). Residential Services for People with Developmental Disabilities: Status and Trends Though 2007
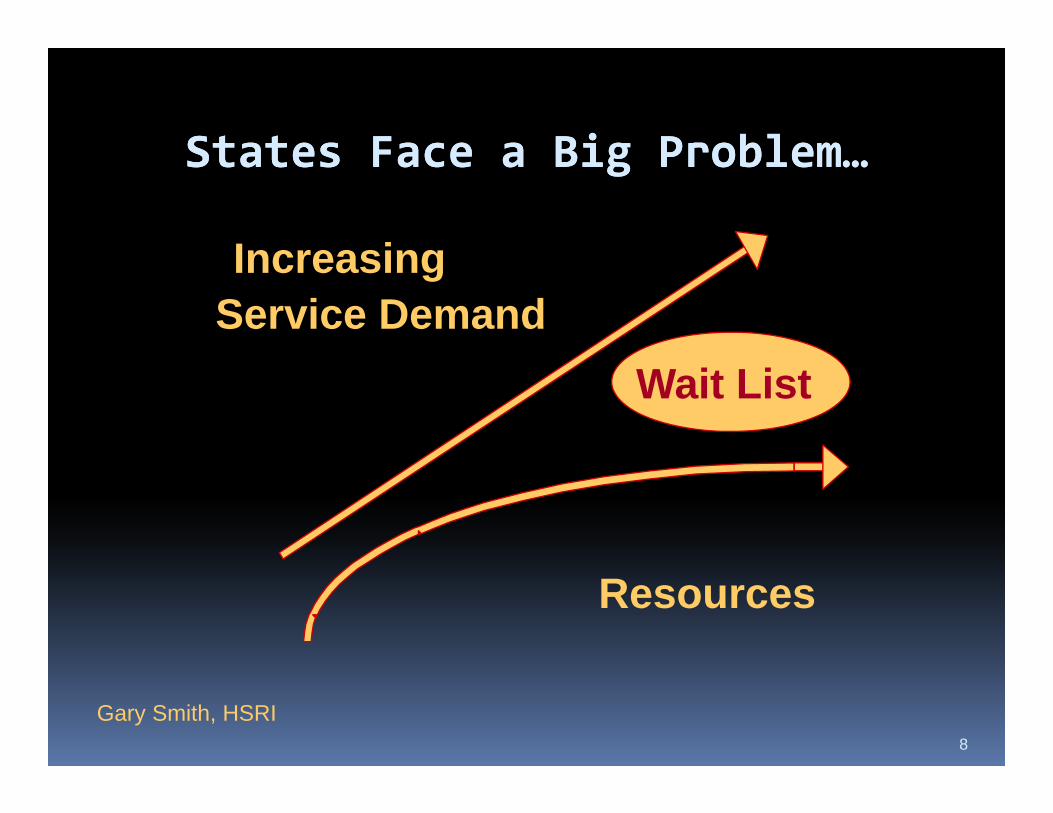
States Face a Big ProblemStates Face a Big ProblemStates Face a Big Problem…States Face a Big Problem…
IncreasingIncreasingService Demand
Wait List
Resources
8
Gary Smith, HSRI
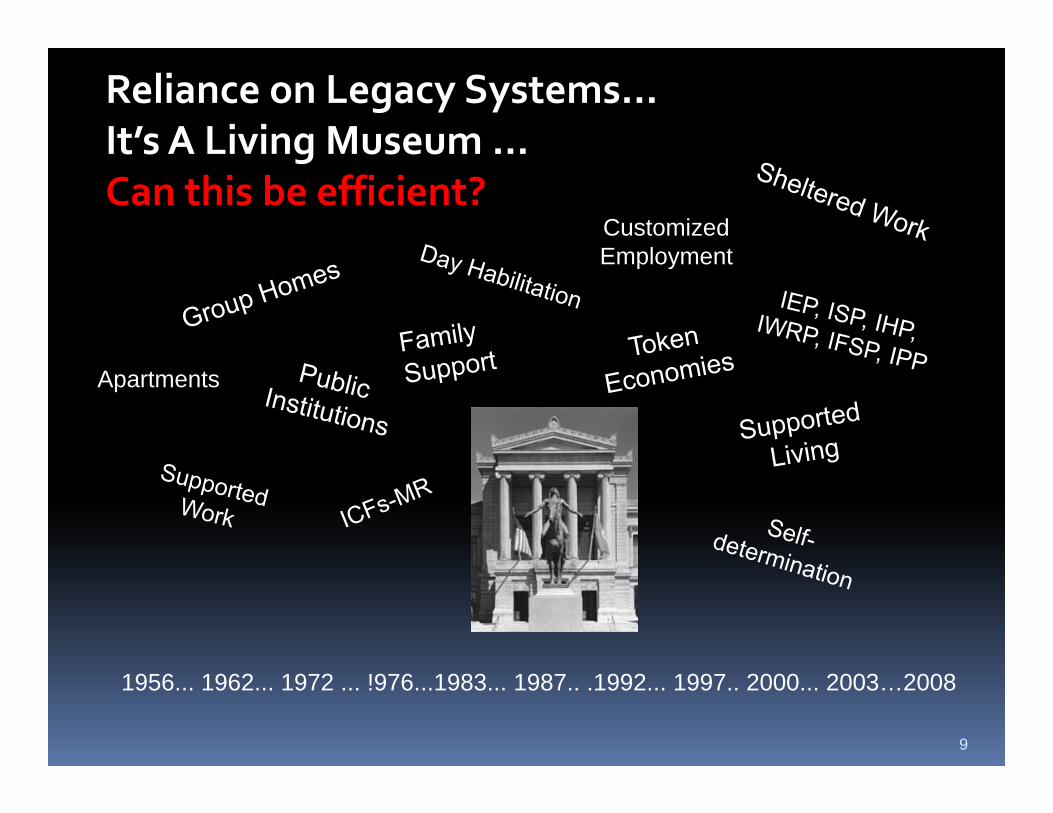
Reliance on Legacy Systems…It’s A Living Museum ...It s A Living Museum ...Can this be efficient?
Customized EmploymentEmployment
Apartments
9
1956... 1962... 1972 ... !976...1983... 1987.. .1992... 1997.. 2000... 2003…2008

Heading for a crash!Heading for a crash!Weighty Legacy Services & Structures
Budget Shortfalls
Services & Structures
Rising Unmet Demand Shortfalls
Workforce
Demand
Shortages
Fragmentation
Quality Problems
Antiquated
10
Antiquated Technologies
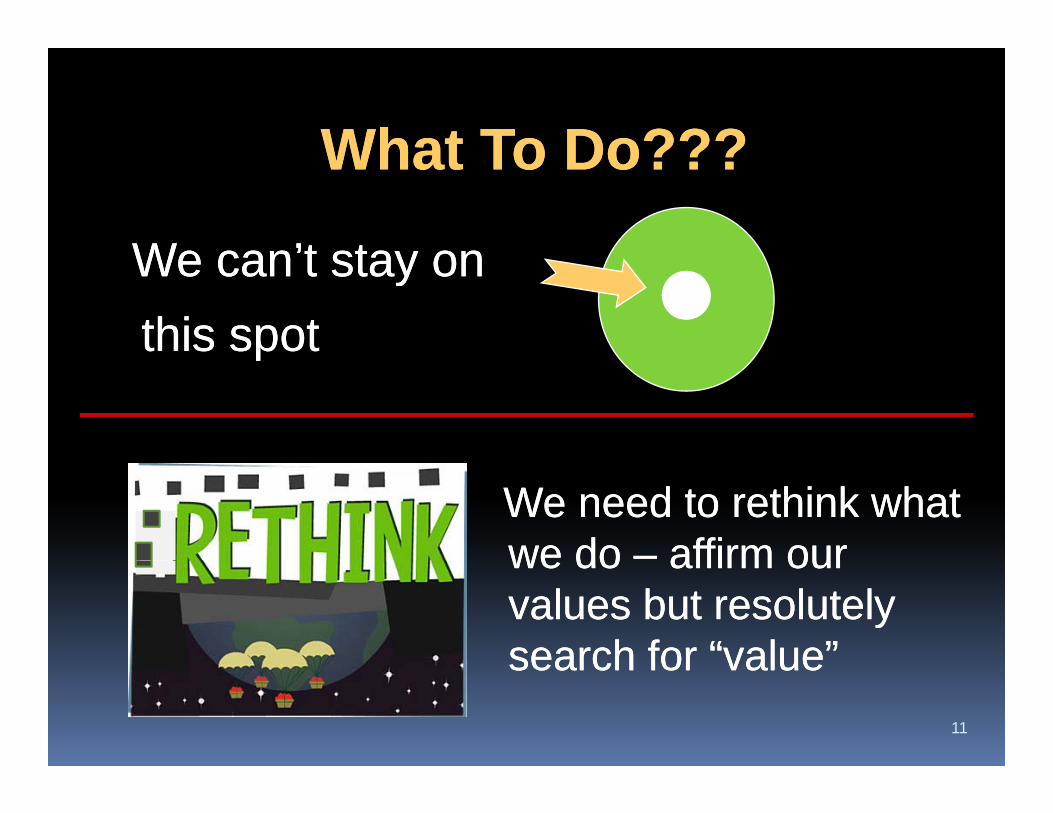
What To Do???What To Do???What To Do???What To Do???
We can’t stay onWe can’t stay onWe can t stay on We can t stay on this spotthis spotpp
We need to rethink what We need to rethink what we dowe do –– affirm ouraffirm ourwe do we do affirm our affirm our values but resolutely values but resolutely search for “value”search for “value”
11
search for value search for value

iWe Must Make Our ServiceSystems More Efficient
Reform our person centered system architectureReform our person‐centered system architecture
Disinvest from low value/high cost services
l d d ff lUtilize Medicaid Efficiently!New business models… Open markets
“Non‐traditional” providers/direct purchase of supports
12

Big House State Op ICF-MRs
Highest C
CommunityICF-MRs
HCBS W iCost HCBS WaiversComprehensive & Specialty Waivers
Supports ppWaivers
State Funded ServicesAn Overall
Lowest Cost
Services
About 4% more
Look at Things
People with Developmental Disabilities
DEMANDAbout 4% more per year
at Things
p p(1% of the population)
13
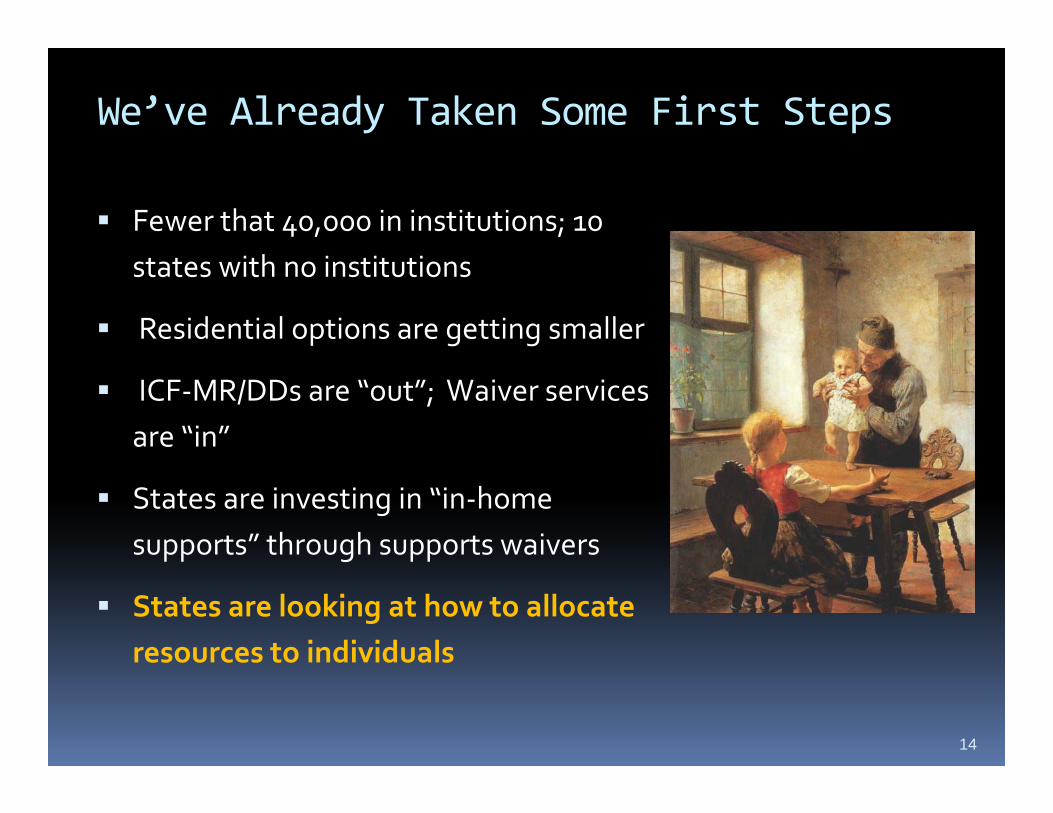
We’ve Already Taken Some First Steps
Fewer that 40,000 in institutions; 10 states with no institutions
Residential options are getting smaller
ICF‐MR/DDs are “out”; Waiver services are “in”
States are investing in “in‐home supports” through supports waiverspp g pp
States are looking at how to allocate resources to individuals
14

People with Developmental DisabilitiesPeople with Developmental Disabilities Receiving Medicaid Long-Term Services
60 0%
70.0%
80.0%
90.0%
350,000
400,000
450,000
500,000
30 0%
40.0%
50.0%
60.0%
200,000
250,000
300,000
0.0%
10.0%
20.0%
30.0%
0
50,000
100,000
150,000
1994 2000 2006
ICF/MR HCBS % HCBS
Prouty, S,mith and Lakin Residential Services and Trends
15

States With Comprehensive and Supports Waivers p ppEnrollment Trends 2000-2006
180,000
120,000
150,000
60,000
90,000
0
30,000
2000 2001 2002 2003 2004 2005 2006
Total People 102,791 115,841 126,737 131,573 138,945 148,807 166,673
% Supports 5.7% 7.8% 9.8% 13.1% 15.0% 22.5% 27.6%
Supports Waiver 5 837 8 991 12 455 17 198 20 842 33 452 46 008
2000 2001 2002 2003 2004 2005 2006
16
Supports Waiver 5,837 8,991 12,455 17,198 20,842 33,452 46,008
Comprehensive 96,954 106,850 114,282 114,375 118,103 115,355 120,665

HCBS Waivers HCBS Waivers HCBS Waivers HCBS Waivers Working TogetherWorking Together
Comprehensive Waiver or other state service options
Most Expensive
Supports Waiver ServicesSupports Waiver Services including capped allocations and defined service array
Base level of state funded service options that do not Least
17
pinclude Medicaid Expensive

Working To Get Personal Allocations Right
Do we really know what it costs to ?serve a person?
Why are some people allocated more that others even though they have that others, even though they have similar needs?
Is the way we allocate funds fair? Is yit based on support needs?
Is this efficient? Person-Centered Several states are working to assess needs systematically and allocate accordingly
Budget Allocations
Adjusted Service accordingly
18
Reimbursement Rates

Focus on Developing
SIX Assumptions:
Resource Allocation Models SIX Assumptions:
1. Individual people have needs.2. Individuals with greater needs should have
access to more resources.3. No two people have the same needs, supports
and priorities. 4. Individuals and their teams know best.5. People should choose providers.6. It is possible to make it happen.
19

Overview of the Strategic Planning ProcessDeveloping Individual Budgets In Relation to Service Payment Rates
Set Levels ImplementP Collect
Developing Individual Budgets In Relation to Service Payment Rates
& IBAs ImplementPrepare
Data
Collect f i
Assign Indi iduals to
Review Findings in Relation to Set Policy
Information on Individuals
Individuals to Assessment
Levels
Policy Goals
Consider
Goals
Engage
Compile the Collected Set Individual
Implementation Issues
Choose
g gStakeholders
Information Budget Allocations in
Relation to R
Assessment Measure
Plan for Implementation
Rates
20
Implement New Practices
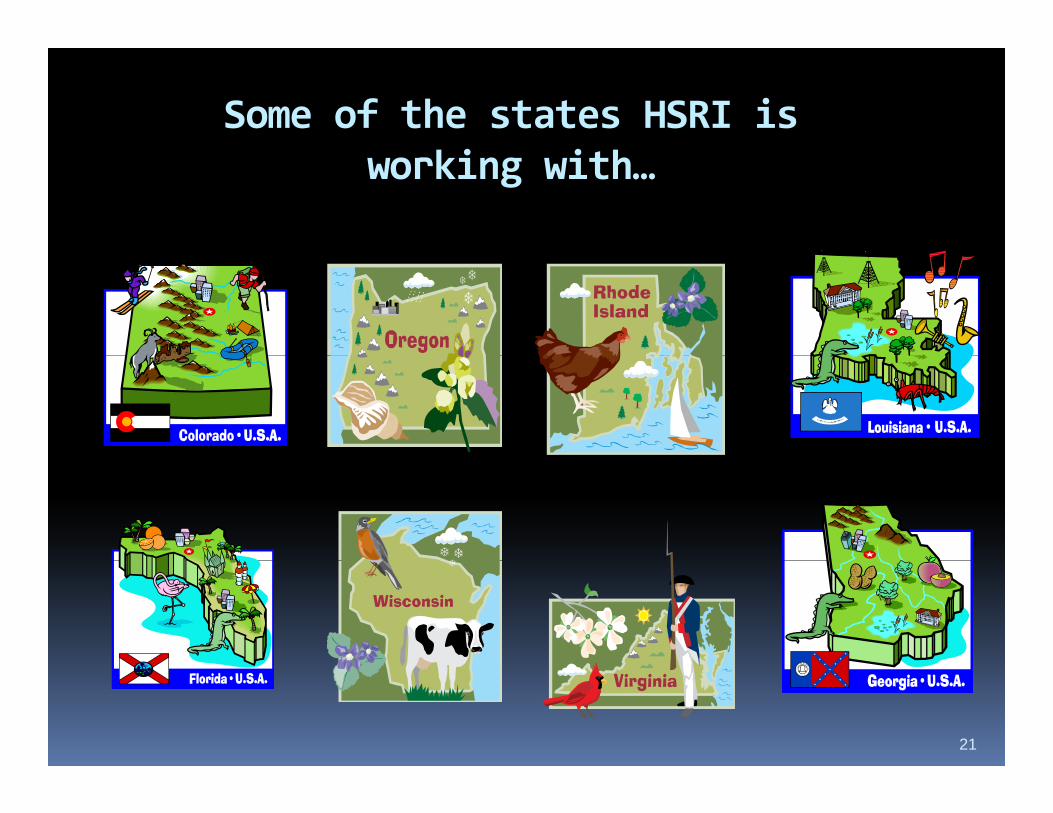
Some of the states HSRI is ki i hworking with…
21

HCBS waiver HCBS waiver reimbursement i t k t is not rocket science. It is a lot harder.
Gary Smith
22

23

The ETERNAL QUESTION:The ETERNAL QUESTION:
How do we deliver h t h twhat we have to the people who
d it t ?need it most ?
Robert T. Clabby, II Oregon
24

“It’s impossible to “It’s impossible to
individualize service until you’ve individualized the funding.”
Russ Pittsley
25

S PStep 1. Prepare
Potential Policy GoalsFairness, equitability, explicabilityMatching resources and individual needsAbility to handle exceptional careIn a time of limited resources ‐ focus on those with greatest needInject self‐directed approachesIncrease efficiency to address increasing demand
26

Step 1. PrepareStakeholder Involvement
A stakeholder group should be formed:To help advise the processTo help advise the process
To assure that people know what the process is finding and what decisions are process is finding and what decisions are being made.
The stakeholder group should meet regularly and The stakeholder group should meet regularly and be composed of self‐advocates, parents, providers, and others.providers, and others.
27

Step 1. Prepare
Choose an Assessment ToolChoose an Assessment Tool
Assessment tools provide Assessment tools provide information about support needs
States use various tools to tie States use various tools to tie funding to support needs
Each tool has its pros and consEach tool has its pros and cons
28

Step 2. Collect & Compile Information
Data Data DataA good database is invaluable…
M f l i iMany factors explain variance
All the predictors work together as a team
The techniques are often powerful enough to be able to overcome minor error and work well
Allocations and plans are based on the “FOUR Ps”… Personal, portable, prioritized,
di t blpredictable
29

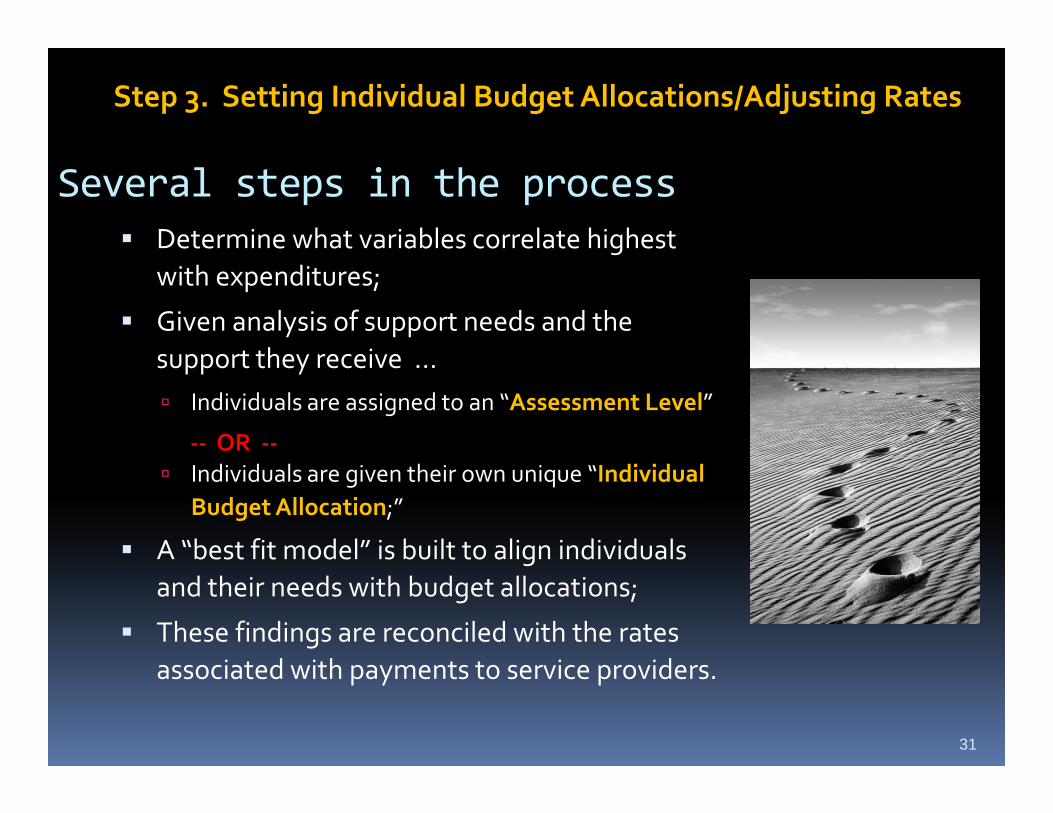
Step 3. Setting Individual Budget All ti d Adj ti R tAllocations and Adjusting Rates
30
Step 3. Setting Individual Budget Allocations/Adjusting Rates
Determine what variables correlate highest
Several steps in the processg
with expenditures;
Given analysis of support needs and the support they receive support they receive …
Individuals are assigned to an “Assessment Level”
‐‐ OR ‐‐Individuals are given their own unique “Individual Budget Allocation;”
A “best fit model” is built to align individuals gand their needs with budget allocations;
These findings are reconciled with the rates i t d ith t t i id associated with payments to service providers.
31

Step 3. Setting Individual Budget Allocations/Adjusting Rates
SIS Results
L l &
SIS Results
Levels IBAs
Budget Allocations
Levels & Assignments Individual
Budgets
Per Level
ReconcileBudgets & Rates
ReconcileB d t & R tAlignmentBudgets & Rates
Proposed New
Budgets & Rates
Proposed New
g
pRate Structure
Cost Reviews Per P d S i
Rate Structure
Cost Reviews Per P d S i
32
Person and Service Person and Service

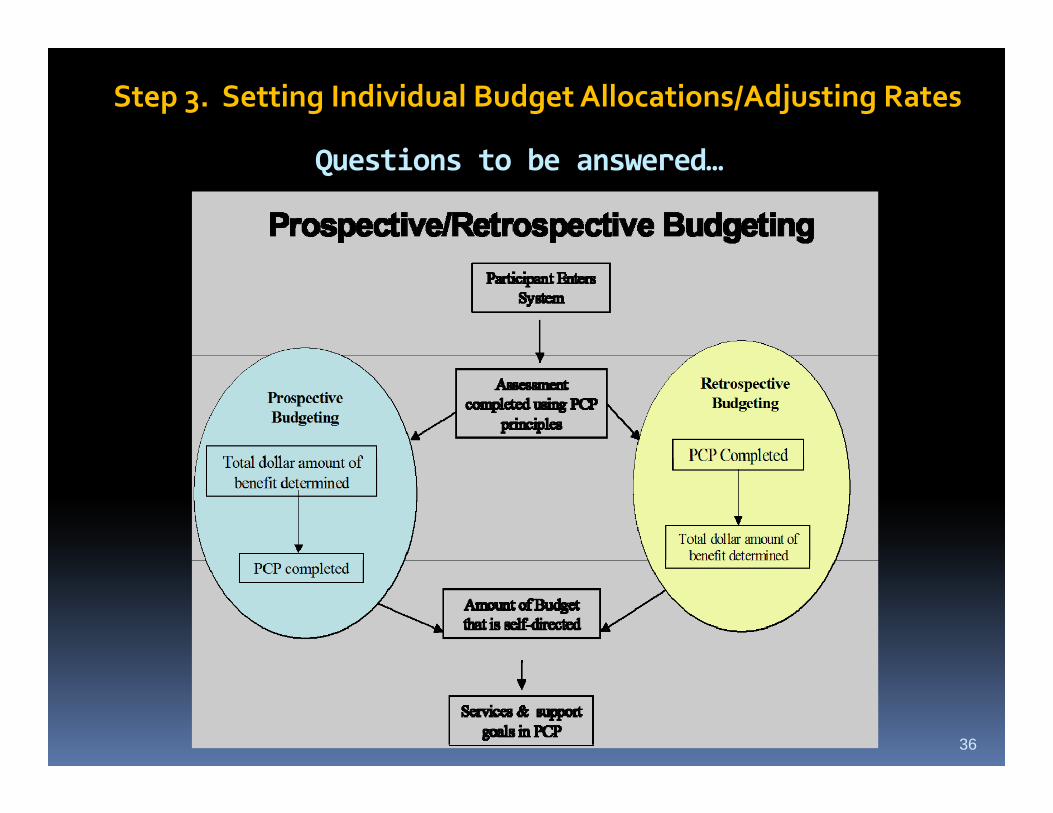
Step 3. Setting Individual Budget Allocations/Adjusting Rates
Questions to be answered…
Most states have moved to the
Retrospective versus prospective budgeting?
Most states have moved to the prospective method where the team and individual knows their individual budget
h d d l lprior to the individual service plan development.
Some form individual budgets after the Some form individual budgets after the individual service plan is developed.
33

Step 3. Setting Individual Budget Allocations/Adjusting Rates
The HSRI approach to setting Individual The HSRI approach to setting Individual Budget AllocationsBudget AllocationsBudget AllocationsBudget Allocations
Spread people out based on their support needs and resource consumption patterns.
Each person will have his or her own unique personal budget or level.
In observing the spread their should be:In observing the spread their should be:
Face validityA logical progression from least to most needs
Account for all those assessed.
34

Step 3. Setting Individual Budget Allocations/Adjusting Rates
The HSRI approach to assigning individuals to The HSRI approach to assigning individuals to habilitation levels:habilitation levels:
Identify people with similar characteristics.
Group these individuals based on resource consumption patterns.p
Develop levels in ways to :
Establish face validityH l i l i f l dHave a logical progression from least to most needs
Check the progression in the number of people per category… ideally the most people populate the levels indicating less needindicating less need.
Account for all those assessed
Establish separation between levels (hours and/or costs)
35
p ( / )
We are looking for a “Best Fit Solution”We are looking for a “Best Fit Solution”
Q ti t b d
Step 3. Setting Individual Budget Allocations/Adjusting Rates
Questions to be answered…
36

Questions to be answered
Step 3. Setting Individual Budget Allocations/Adjusting Rates
Questions to be answered…
What does CMS require of individual budgets?What does CMS require of individual budgets?
States must describe the method for calculating individual budgets based on reliable costs or services utilization.
By 2007 ten states have recently engaged in waiver cost t di t d t i t b d i b t f i studies to determine cost‐based reimbursement for waivers (i.e., IL, WY, OR, FL, MA, OH, FL, MT, WA).
(Reinhard, Crisp, Bemis, and Huhtala, 2005)
37
Step 3. Setting Individual Budget Allocations/Adjusting Rates
Questions to be answered…
What does CMS require of individual budgets?
Cost and utilization data form the vital underpinnings of good individual budget development.
Consistent methodology for all involved participants and Consistent methodology for all involved participants, and should review and monitor the individual budgets regularly.
38

Step 3. Setting Individual Budget Allocations/Adjusting Rates
Questions to be answered
What does CMS require if individual budgets? F th ti f d d t i bl
Questions to be answered…
From the perspective of consumers and advocates, a viable methodology should: • be open to public inspection, p p p ,• allow the participant to move money around, and • define a process for making adjustments in the individual
b d d f f fbudgets and for informing participants of amount authorized or changes to those authorizations.
From the perspective of the state, the methodology should: From the perspective of the state, the methodology should: • permit the state to evaluate over and under expenditures• project system‐wide expenditures through the fiscal year.
39
• provide prompt mechanisms to adjust funding in response to individual situations.

Step 3. Setting Individual Budget Allocations/Adjusting Rates
Questions to be answered
What liability does the state face if it cannot fund the individual budgets?
Questions to be answered…
the individual budgets?
In the United States the range of funding of DD services varies greatly. se ces a es g eat y
States generally change the individual budgets to meet their legislatively approved budget.
Rates for services, though benchmarked for national costs, may be a percentage of the national cost For example last year Colorado national cost. For example, last year Colorado was paying about 75% of costs in a rate study completed by Navigant Consulting.
40

Step 3. Setting Individual Budget Allocations/Adjusting Rates
i b d
Do these individual budget allocations or
Questions to be answered…
individual budget levels ever need adjustment?
Any reimbursement method requires some way to adjust to changing j g gcircumstances and sometimes unfortunate new challenges presented by the individuals we serve.by the individuals we serve.
Some of the best, highly tuned individual budget systems allow adjustments for
41
exceptional cost and care for 7% of the population served.

Step 3. Setting Individual Budget Allocations/Adjusting Rates
Questions to be answered…
Is there a more objective and rational way to support the Is there a more objective and rational way to support the service needs of the individuals we serve in communities?
What is the best way (in a technical sense) (in a technical sense) to make it work?
42

Step 4. ImplementationBefore a new model is implemented… Several steps must be completed…
The findings and proposed models must be considered in relation to initial policy goals.
Impacts on individuals, providers and the system must be considered.
An “exceptions protocol” must be developed.
Potential dislocation in the system must be considered.
Needs for improved infrastructure must be considered.
A detailed implementation plan must be compiled, and h d then enacted.
43

44
Early models have simple rules but revolutionary concepts

Solar system for the classroom
45
London teaching aide from 1850’s

46
Rittenhouse Orrery’s mechanical model of the solar system built in 1771solar system built in 1771

HSRI is designing the financial architecture for state DD/ID
comprehensive waiver service systems
47

The Supports Intensity Scale (SIS)d h it i b i dand how it is being used
What is the SIS?
Developed and released by AAMR in 2004 Developed and released by AAMR in 2004
Originally designed to support person‐centered planning, not funding
Only adult version available – child version is under development
Currently 14 states and 14 countries using SISCurrently 14 states and 14 countries using SIS
Perceived as strength‐based
Must be purchased/licensed from AAIDDMust be purchased/licensed from AAIDD
48
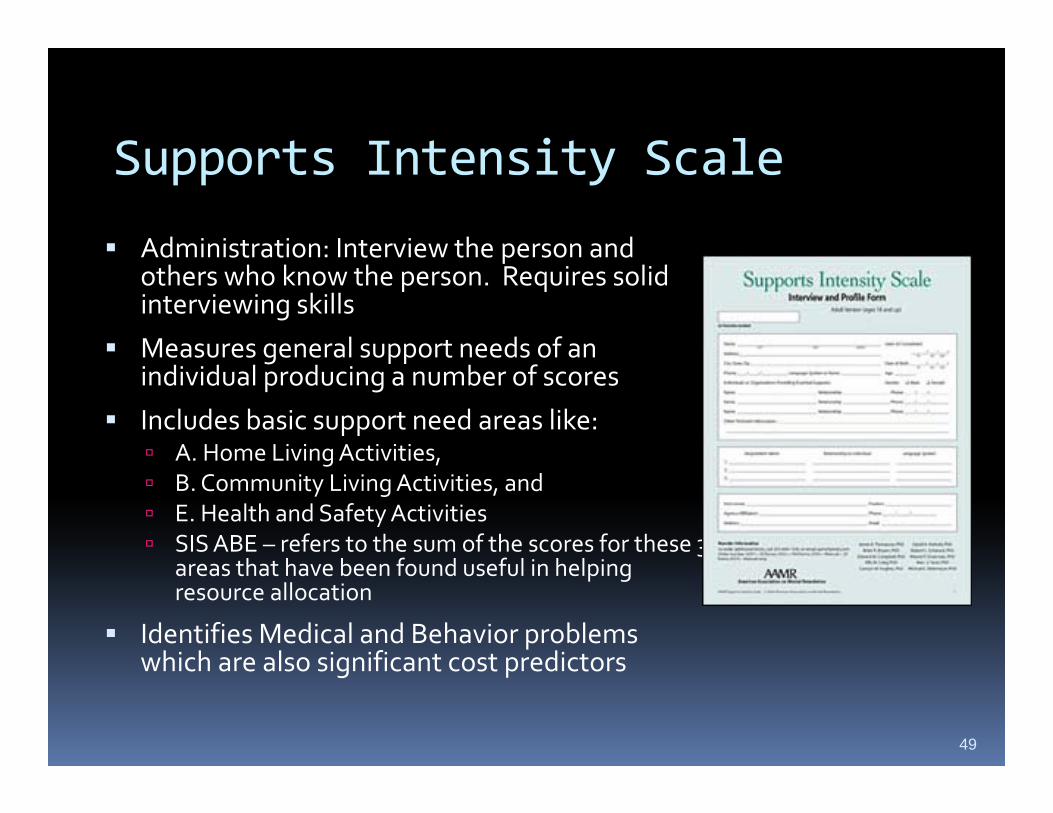
Supports Intensity ScaleSupports Intensity Scale
Administration: Interview the person and Administration: Interview the person and others who know the person. Requires solid interviewing skills
Measures general support needs of an Measures general support needs of an individual producing a number of scores
Includes basic support need areas like: A Home Living Activities, A. Home Living Activities, B. Community Living Activities, and E. Health and Safety Activities SIS ABE – refers to the sum of the scores for these 3
h h b f d f l i h l i areas that have been found useful in helping resource allocation
Identifies Medical and Behavior problems which are also significant cost predictorswhich are also significant cost predictors
49

SIS and Funding Models
Georgia ‐ using the SIS to develop individualbudget allocations for 10,022 people inOctober 2008 for their new support and comprehensive waivers
Washington: Linking SIS and other information to levels of payments and amounts of support servicesp y pp
Louisiana: using a SIS‐informed funding system with 2,025 new NOW waiver applicants beginning in October 2008
Rh d I l d N h C li d U h l i SIS Rhode Island, North Carolina, and Utah are exploring SIS applications
Oregon and Colorado are using SIS to inform the development of funding reimbursement models
Florida is exploring use of a local state tool, the QSI, to determine support needs and establish levels of funding for 38,000 people in a pp g 3 , p pnew four tiered‐waivers system designed to contain expanding cost
50

Why do states pick the Supports Intensity Scale?
National norms – buying the bell shaped curve
Writing waiver service plans with individuals families and providersindividuals, families, and providers
Captures support needs hence some of the natural supports used by individuals
Considers both behavioral and medical challengesmedical challenges
Has potential for helping to shape waiver individual budgets and/or
51
reimbursement levels

“Buying the Bell Shaped Curve”Buying the Bell Shaped Curve
60
50
quen
cy
40
30
Freq 30
20
10
52
TotalNeededIndex1401201008060
0

State SIS Comprehensive Adult Waiver ResultsAdult Waiver Results
Total Support MedicalSupport
BehavioralS t
State People Needs IndexScore
(Range 38 143)
SupportNeeds
(Range 0-32)
SupportNeeds
(Range 0-26)(Range 38-143) g
SIS Norms
1,306 100.00 2.47 4.99NormsOR 401 101.00 3.27 4.98NE 288 100.42 3.23 4.81NE 288 100.42 3.23 4.81CO 3,631 99.88 2.83 6.13VA 521 101.74 2.43 4.77GA 5,140 98.18 1.95 3.80
53

C h i HCBS W i Comprehensive HCBS Waiver SIS Results – Similar Shapes
Colorado Oregon Georgia Virginia75
50
60 80 100 120 140 0 80 100 12060.00 80.00 100.00 120.00 140.00
0
25
SIS Support Needs Index Scores
54
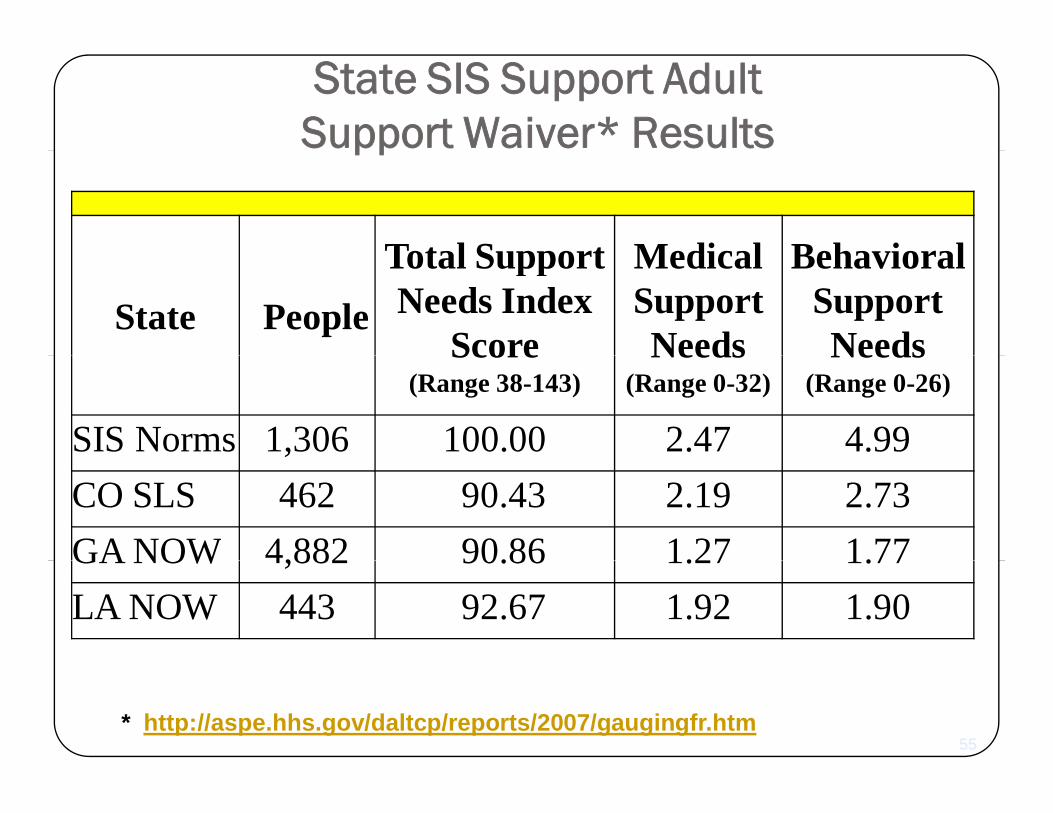
State SIS Support Adult Support Waiver* Resultspp
Total Support Medical BehavioralState People
Total SupportNeeds Index
Score
MedicalSupportNeeds
BehavioralSupportNeedsScore
(Range 38-143)Needs
(Range 0-32)Needs
(Range 0-26)
SIS Norms 1,306 100.00 2.47 4.99CO SLS 462 90.43 2.19 2.73GA NOW 4,882 90.86 1.27 1.77GA NOW 4,882 90.86 1.27 1.77LA NOW 443 92.67 1.92 1.90
* http://aspe.hhs.gov/daltcp/reports/2007/gaugingfr.htm55

HCBS W i S t W iHCBS Waiver Support WaiversSIS Results – Similar Shapes
Colorado SLS Georgia NOW Louisiana NOW
SIS Support Needs Index Scores
56

57
2008 Model of the Solar System
N 8 l t 66 d d f l tNow 8 planets, 166 moons, and 3 dwarf planets

58
Such models lead to the possibility of a bigger picture

Case Studies Working with StatesCase Studies -- Working with States
If I am only for myselfGeorgia
Colorado
If I am only for myself, who is for me?
And if I am only for ColoradoOregon
ymyself, what am I?
And if not now, when?
VirginiaLouisiana Rabbi Hillel
59

G i SISt O t b 2008
Uses SIS results to provide
Georgia SIStem October 2008
Uses SIS results to provide individual budgets for 10,027 individuals on the state’s new
h dcomprehensive and support waivers.
Thi i di id l b d t d l This individual budget model explains over 75% of the variance and is phased in over 5 years to reduce impacts.
60

Colorado and Oregon
Colorado
Colorado and Oregon
Colorado Level Model
Fits Individual SISresults from results from
Oregon
61

In Colorado
Support Needs In Si L lSix Levels structured by 4 main 6 Levels and 42
fy
groups of Section 1 ABE
subgroups of Support Needs with Medical and
Community Safety Risk
ABE Results Behavioral
62
Community Safety Risk Two Levels

For CO 6 Levels of Funding Were Used
6 levels of funding were identified to better match individual support needs with funding based on:based on:
4 groups of SIS general adaptive scores
b f SIS M di l SIS B h i l 42 subgroups of SIS Medical, SIS Behavioral and SIS adaptive scores (ABE ) and a community safety risk factory y
In the community, as the levels increase from 1 to 6 the overall support needs of the individuals
6363
increase as do dollars

We Used the Solution in CO to support OR
CO’s 6 Levels Offered a Better Fit Solution
We thought that a SIS configuration used in Colorado may offer a better fit solution.
Work involving the CO Comprehensive Waiver was completed using “full population SIS results” (n=3,631)
The SIS configuration applied there uses six levels composed of 42 detailed subgroups.
We tested for differences between the OR sample and CO full We tested for differences between the OR sample and CO full population. We found that the two are comparable.
Applying it to the Oregon sample provides opportunity for pp y g g p p pp y“fine tuning” assignments to levels
6464

Six Assessment Levels6Levels Adult People Type of Need
6Residential in
Sample
1 70 Milder Support Needs0 de Suppo t eeds2 49 Moderate Support Needs3 51 Severe Support Needs (SN)4 30 Severe SN with Moderate
Behavior & Medical5 63 Severe SN with More Serious Behavior
& Moderate Medical with Community Safety 30%
6 56 Severe SN Extraordinary Medical and
6565
6 56 Severe SN Extraordinary Medical and Behavioral with Community Safety 50%
65

6 Levels for “DD50” Adult Residential Services6 Levels for “DD50” Adult Residential Services6 Levels for DD50 Adult Residential Services6 Levels for DD50 Adult Residential Services
Levels ABE Medical Behavioral Risk DD50Levels ABE MedicalProblems
BehavioralProblems
Risk DD50 Staff Direct Hours
1 24 1 2 0 62 29 2 4 0 73 32 3 5 0 74 34 4 6 0 105 34 5 6 30% 126 35 7 9 50% 12
66

6 Levels Offers a Better Fit Solution because of…
Adding another level improves managing g p g gof the “spread” in the sample pertaining to the relationship between assessed needs and dollars or service hours
Separation between levels in dollars and service hours is improved
Exceptional care and cost cases are better accounted for
Overall, it allows for improved assignment to levels for individuals, and improved ability to assign budget p o ed ab ty to ass g budgetallocations
67

Exceptional Care Exceptional Care Exceptional Care Exceptional Care & Cost Red Flags& Cost Red Flags
Oregon Predictors of Exceptional Care and cost Membership include:
2 Questions from the SIS pertaining to physical disability (on Feeding Assistance / Tube Feeding and Skin Careand Skin Care
2 Questions from the ReBAR Supplemental Questions pertaining to behavior (on Type of p g ( ypBehavioral Support and Safety)
These questions can be used to help identify individuals with exceptional needs and costs.
686868
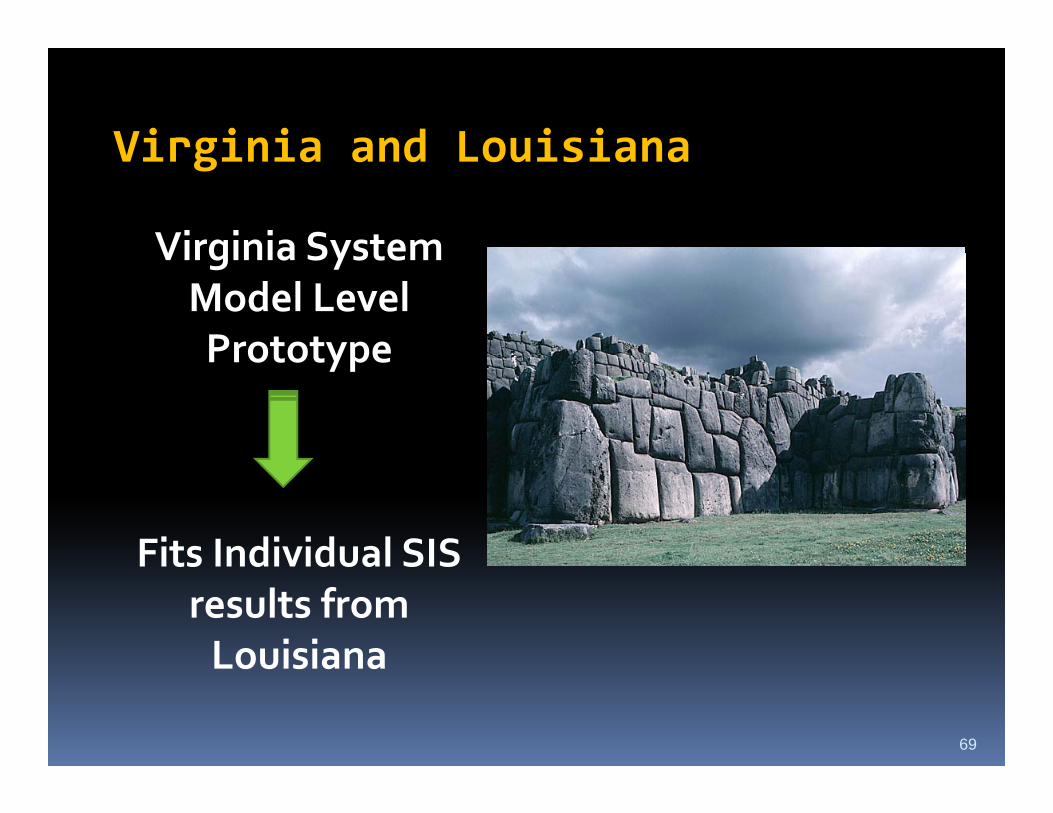
Virginia and Louisiana
Virginia System
Virginia and Louisiana
Virginia System Model Level Prototype Prototype
Fits Individual SISFits Individual SISresults from Louisiana
69
Louisiana

6 Levels of Funding First gUsed in Virginia6 levels of funding were identified to 6 levels of funding were identified to better match individual support needs with funding based on:
6 levels of SIS Medical, SIS Behavioral and SIS adaptive scores (ABE )
In the community, as the levels increase from 1 to 6 the overall support needs of the individuals support needs of the individuals increase as do dollars
70
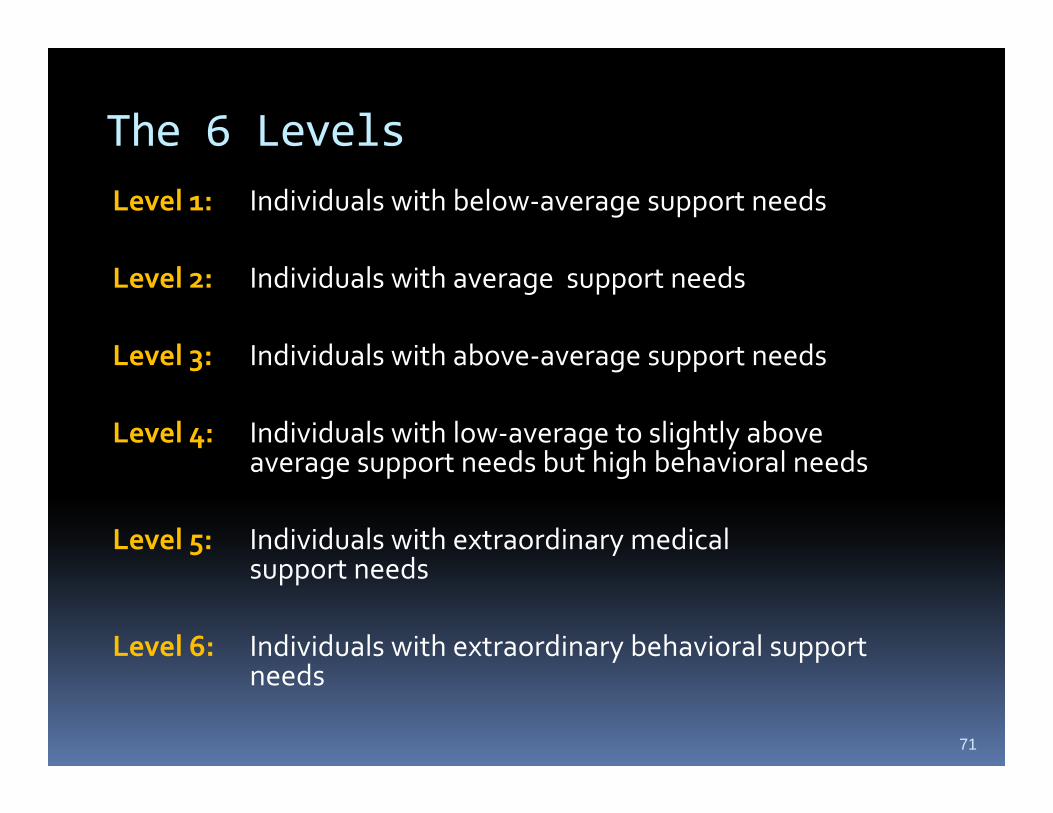
The 6 LevelsLevel 1: Individuals with below‐average support needs
Level 2: Individuals with average support needs
Level 3: Individuals with above average support needsLevel 3: Individuals with above‐average support needs
Level 4: Individuals with low‐average to slightly above average support needs but high behavioral needsaverage support needs but high behavioral needs
Level 5: Individuals with extraordinary medical t dsupport needs
Level 6: Individuals with extraordinary behavioral support needs
71
VA Going ForwardVA Going Forward
C l t SIS d i i t ti f ll i di id l Complete SIS administration for all individuals on
the waivers by 2012
Assuring consistency of SIS administrationAssuring consistency of SIS administration
Constructing a community safety risk factor for
supplemental questionspp q
Supplementing questions in the SIS by adding
natural support measures
Handling individuals with extraordinary needs
Use existing night time supervision hoursUse existing night time supervision hours
72
Focus on LouisianaFocus on LouisianaObjectives
Using standardized assessment, develop guidelines for authorization of NOW waiver IFS and ACS servicesservicesIFS – Individual and Family Support – kind of a catch all to include attendant care and habilitationall to include attendant care and habilitationACS –Attendant Care Services – which is really a payment to the provider agency to manage the clients IFS services.Develop a model to allow implementation of
d l d d dguidelines in a standardized way
73
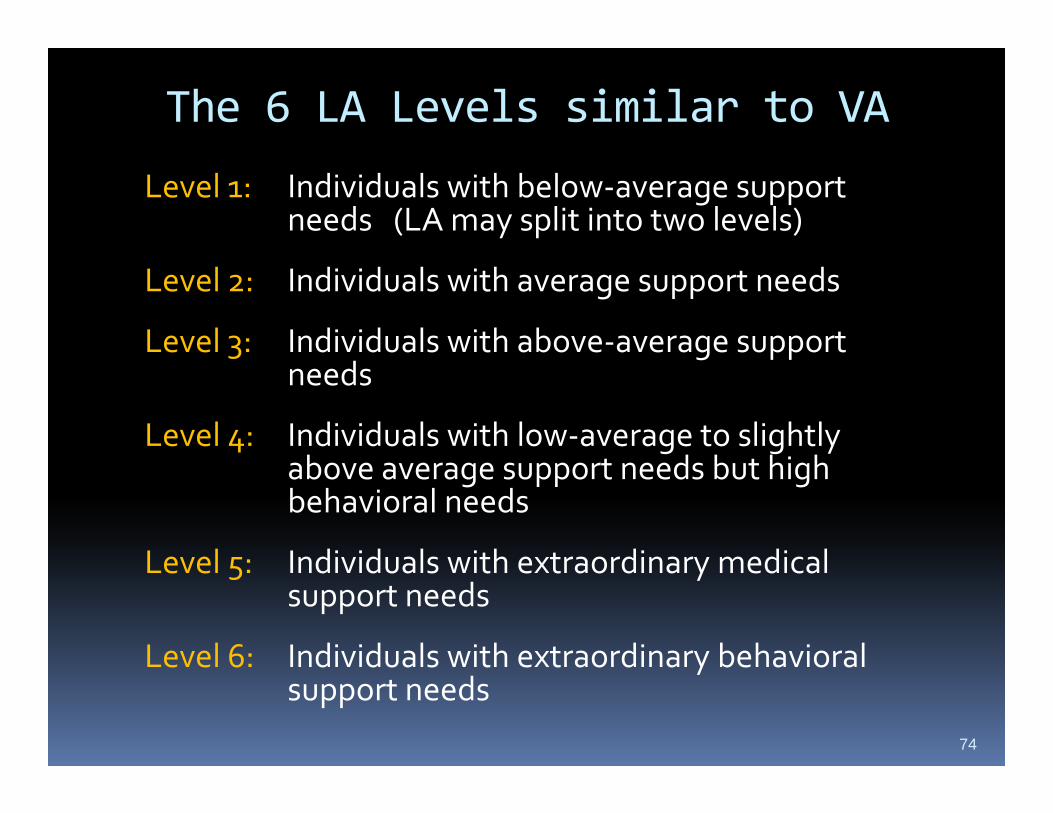
The 6 LA Levels similar to VA
Level 1: Individuals with below‐average support needs (LA may split into two levels)
Level 2: Individuals with average support needs
Level 3: Individuals with above‐average support 3 g ppneeds
Level 4: Individuals with low‐average to slightly b d b hi h above average support needs but high
behavioral needs
Level 5: Individuals with extraordinary medical Level 5: Individuals with extraordinary medical support needs
Level 6: Individuals with extraordinary behavioral Level 6: Individuals with extraordinary behavioral support needs
74

LA Objectives ‐ Draft Model
2 models: Living Arrangement XLiving with family
Living Arrangement X
SIS LevelBase Rate(Units/$)
Independent living
( $)
Age + Units/$
Natural Supports + Units/$
Day Activities - Units/$y $Recommended
IFS/ACS Units/$
75

LA Obj ti D ft M d lLA Objectives ‐ Draft Model
Produces a guideline amount Produces a guideline amount to set the basis for planning
Not all of the recommended amount has to be usedIf it /$ i d If more units/$ are required, additional authorization can be sought for individuals with gspecial circumstances
76

LA Objectives ‐ Process LA Objectives Process
Administer SIS assessment to Administer SIS assessment to sample populationReview portion of SIS sampleModel Development for People Waiting for WaiverModel Implementation for People Model Implementation for People Waiting for WaiverFuture Model Development, Review, p , ,and Implementation with full NOW waiver population SIS results and studies of clinical review and studies of clinical review and financial impact
77

LA Data Results:LA Data Results:Analysis of Living & SIS Level
Living With Family By SIS Level
$120000
$140,000
Living Independently By SIS Level
$120 000
$140,000
$40000
$60,000
$80,000
$100,000
$120,000
an E
xpen
ditu
re
$40 000
$60,000
$80,000
$100,000
$120,000
an E
xpen
ditu
res
$0
$20,000
$40,000
Level1a
Level1b
Level 2 Level 3 Level 4 Level 5 Level 6M
ea
$0
$20,000
$40,000
Level1a
Level1b
Level 2 Level 3 Level 4 Level 5 Level 6
Mea
SIS LevelSIS Level
78

LA Case Reviews
127 cases being reviewedItems reviewed
Overall CaseAmount of Natural SupportsAmount of Natural SupportsExisting and possible revised authorizations forIFS – Individual and Family Support – includes IFS Individual and Family Support includes attendant care and habilitationACS –Attendant Care Services – payment to the
id h li IFS iprovider agency to manage the clients IFS servicesDay Programs
79

Overview of the Strategic Planning ProcessDeveloping Individual Budgets In Relation to Service Payment Rates
Set Levels ImplementP Collect
Developing Individual Budgets In Relation to Service Payment Rates
& IBAs ImplementPrepare
Data
Collect f i
Assign Indi iduals to
Review Findings in Relation to Set Policy
Information on Individuals
Individuals to Assessment
Levels
Policy Goals
Consider
Goals
Engage
Compile the Collected Set Individual
Implementation Issues
Choose
g gStakeholders
Information Budget Allocations in
Relation to R
Assessment Measure
Plan for Implementation
Rates
80
Implement New PracticesAny Questions?

Need and OpportunityA service system for [people with disabilities] and others in need of
Need and Opportunity
disabilities] and others in need of support will have to be a system in constant change. It has to be gcontinuously developed, if the 'customers' are not to be left behind
d b h fand to become hostages of an outdated way of doing things."
Alfred Dam (undated)Denmark
81


![Toto the Best of Toto Full Band Score[1]](https://img.pdfslide.net/doc/110x75/54580b1fb1af9fbd038b46a4/toto-the-best-of-toto-full-band-score1.jpg)