Embed Size (px)
Citation preview

Using the Voice of the Multiple Using the Voice of the Multiple Customers to Drive the Quality of Customers to Drive the Quality of The Customer Experience The Customer Experience
John Goodman, Vice Chairman, TARP
ASQ 0511 August, 2012
Quest Diagnostics

2
AgendaAgenda
• Customer Experience is THE key initiative of the decade– Top priority for 86% of execs (Forrester)– Service is only sustainable differentiator
• CE if best guided by an effective Voice of the Customer• CE is in Quality’s sweet spot
– Create an alliance – use QA’s analytical expertise coupled with Service data– Jointly test solutions and implementation
• Understand context of Service, VOC and Quality within CE• Estimating the economic impact of improvement• Integrated approach for enhancing the CE by gathering,
analyzing and reporting feedback from multiple customers• Grade your approach to managing the customer experience

3
About TARPAbout TARP
• Founded in 1971—41 years of customer experience leadership– White House Complaint Studies 1970s-80s (instigated 800#s and GE
Answer Center)
– Assisted 6 Baldrige Winners and 43 Fortune 100 Companies
– Initiated concept of “word of mouth” (TARP/Coca-Cola 1978 Study) and “word of mouse” (eCare and Click & Mortar studies 1999)
• Offices in Wash., D.C. and London • Credited with developing the approach
for quantifying the impact of quality on revenue, cost & WOM for companies like Neiman Marcus, Toyota/Lexus, USAA, Cisco Systems, Xerox, 3M, Moen, Mayo Health System, U Penn Hospital, Apple, Neustar, Kraft, AAA, Allstate, Hyundai, Marriott, AARP and Chick-Fil-A.

4
Customers, will:
Use again
Use or donate more
Tell others to use
Try your other products & services
+ =DOING
THE RIGHT JOBRIGHT THE FIRST
TIME
MAXIMUM CUSTOMER
SATISFACTION, LOYALTY &
WOM
ImprovedProduct & Service
Quality
Respond toIndividual Customers
Identify Sourcesof Dissatisfaction
Conduct RootCause Analysis
Feedback onPrevention
EFFECTIVECUSTOMERCONTACT
MANAGEMENT
Formula For Maximizing Customer ExperienceFormula For Maximizing Customer Experience

5
Firefighting ModeFirefighting Mode

Driving the Customer Experience Management: Six Big Ideas From Strategic Customer Service
1. Staff doesn’t cause most customer dissatisfaction – sales, products, processes and customers do
2. It is cheaper to give great service than just good service, the revenue payoff is 10-20X the cost
3. People are still paramount – make the front line successful with flexibility and clear explanations
4. Deliver technology that customers will enjoy – delivering psychic pizza via any channel
5. Sensibly create remarkable delight6. An effective Voice of the Customer managed by a
Chief Customer Officer has many kinds of data
7
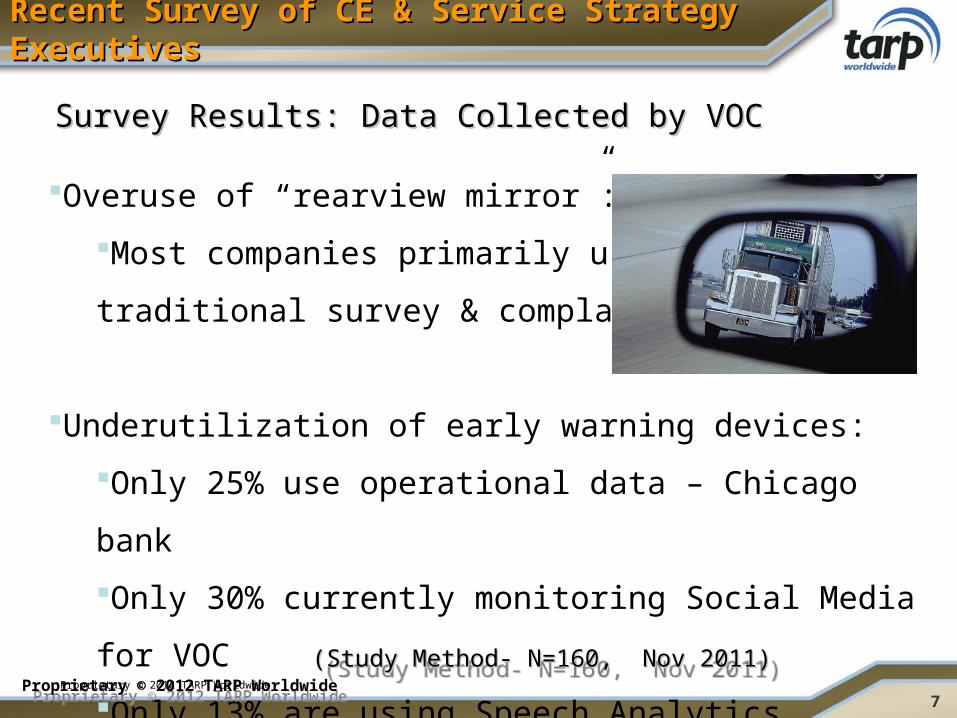
Recent Survey of CE & Service Strategy ExecutivesRecent Survey of CE & Service Strategy Executives
Overuse of “rearview mirror”:
Most companies primarily use
traditional survey & complaint data
Underutilization of early warning devices:
Only 25% use operational data – Chicago bank
Only 30% currently monitoring Social Media for VOC
Only 13% are using Speech Analytics
Proprietary © 2012 TARP Worldwide
Survey Results: Data Collected by VOC Survey Results: Data Collected by VOC
(Study Method- N=160, Nov 2011)(Study Method- N=160, Nov 2011)(Study Method- N=160, Nov 2011)(Study Method- N=160, Nov 2011)
Proprietary © 2012 TARP WorldwideProprietary © 2012 TARP Worldwide

8
Recent Survey of CE & Service Strategy ExecutivesRecent Survey of CE & Service Strategy Executives
About 33% produce an end-to-end view of the Customer
Experience using data that is integrated into a single picture
These 33% of companies were more than twice as likely
to have significant improvements in customer satisfaction
than those who didn’t integrate multiple types of data
Over 50%: 3 or more FTE Customer Experience Analysts
However, the size of the analytical staff had no
correlation with the impact of the VOC!
Proprietary © 2012 TARP Worldwide
Survey Results: Analysis & ReportingSurvey Results: Analysis & Reporting
Proprietary © 2012 TARP WorldwideProprietary © 2012 TARP Worldwide

9
Recent Survey of CE & Service Strategy ExecutivesRecent Survey of CE & Service Strategy Executives
CFO buy in to business case is criticalWhere buy-in existed, 40% of VOC processes were very effective in getting things fixed and 55% had significant increases in customer satisfaction
Where buy-in did not exist, only 8% of companies were very effective and only 23% had significant increases.
Business cases can include four dimensions:LoyaltyMargin – great experience and innovationWord of mouthRisk reduction (Liability, warranty, regulatory and PR)
25% of companies now have Chief Customer OfficerProprietary © 2012 TARP Worldwide
Survey Results: Business CaseSurvey Results: Business Case
Proprietary © 2012 TARP WorldwideProprietary © 2012 TARP Worldwide

Cost of Poor Procurement Service?Cost of Poor Procurement Service?
Cost of poor service includes:
• Increased cost within purchasing – fire drills, rework
• Increased cost for internal customers of purchasing
• Increased dissatisfaction of external customers causing additional internal service cost
• Higher prices to your organization

Customer BehaviorCustomer Behavior

12
Employees Do Not Cause Most Customer DissatisfactionEmployees Do Not Cause Most Customer Dissatisfaction
- Fails to follow policy
The majority of customer dissatisfaction is NOT caused by employee error or attitude but by products that cause disappointment and broken processes*
Customer20%-30%
Employee 20%
- Wrong expectations- Customer error
-Fails to follow policy-Attitude
Company 40%-60%- Products and services don’t meet expectations- Marketing miscommunication- Broken processes
Poorly designed products,Processes, and marketingcreate most unmet expectations.
Customer expectationsmust be set to avoid problems and surprises.
*Finding based upon TARP analysis problem cause data in over 200 consumer and B2B environments.
At least 30% of
contacts are preventable

1%-5% Complain tomanagement or HQ
Most that complain (5-25%) go to front line person
75%-95% Encounter a problem but don’t complain
The Tip of the Iceberg Phenomenon The Tip of the Iceberg Phenomenon
Proprietary © 2012 TARP Worldwide
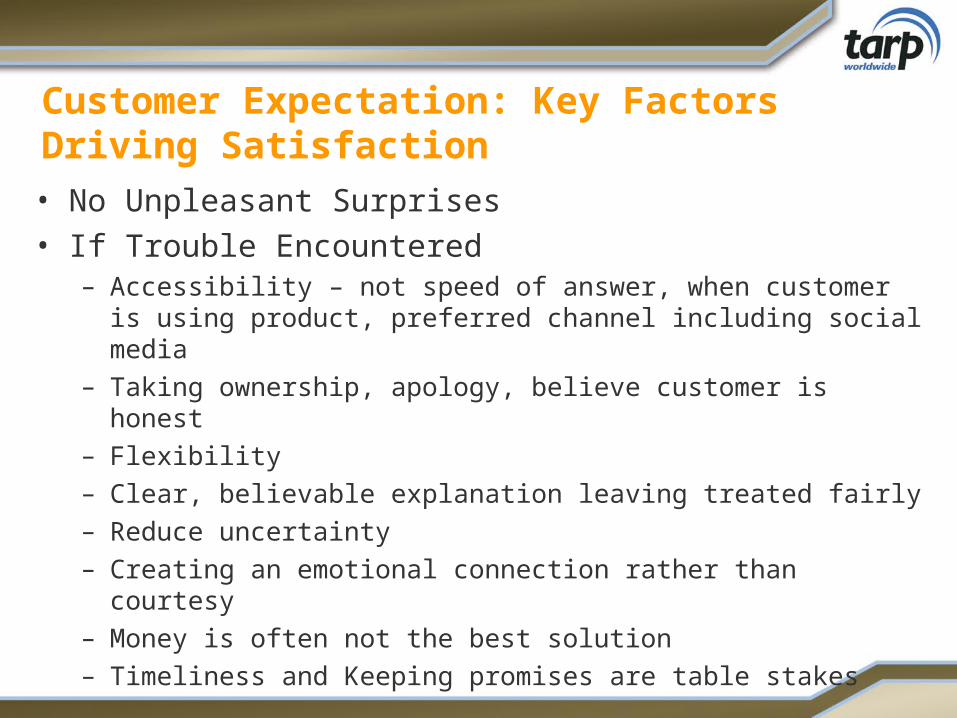
Customer Expectation: Key Factors Driving Satisfaction• No Unpleasant Surprises• If Trouble Encountered
– Accessibility – not speed of answer, when customer is using product, preferred channel including social media
– Taking ownership, apology, believe customer is honest– Flexibility– Clear, believable explanation leaving treated fairly– Reduce uncertainty– Creating an emotional connection rather than courtesy– Money is often not the best solution– Timeliness and Keeping promises are table stakes

15
Problems Raise Sensitivity to Price, Problems Raise Sensitivity to Price, Hindering High MarginsHindering High Margins
10%
22%
46%
74%
0%
10%
20%
30%
40%
50%
60%
70%
80%
90%
No problems 1 problem 2 to 5 problems 6 problems ormore
% D
i ss
ati s
fied
wit
h p
r ice
or
f ees
Percent of customers dissatisfied with fees rises with number of problems.

Using the VOC to Drive the Quality Using the VOC to Drive the Quality of the Customer Experienceof the Customer Experience
1. Produce a unified picture of quality
2. Quantify the implications to create economic imperative
3. Suggest innovative solutions
17
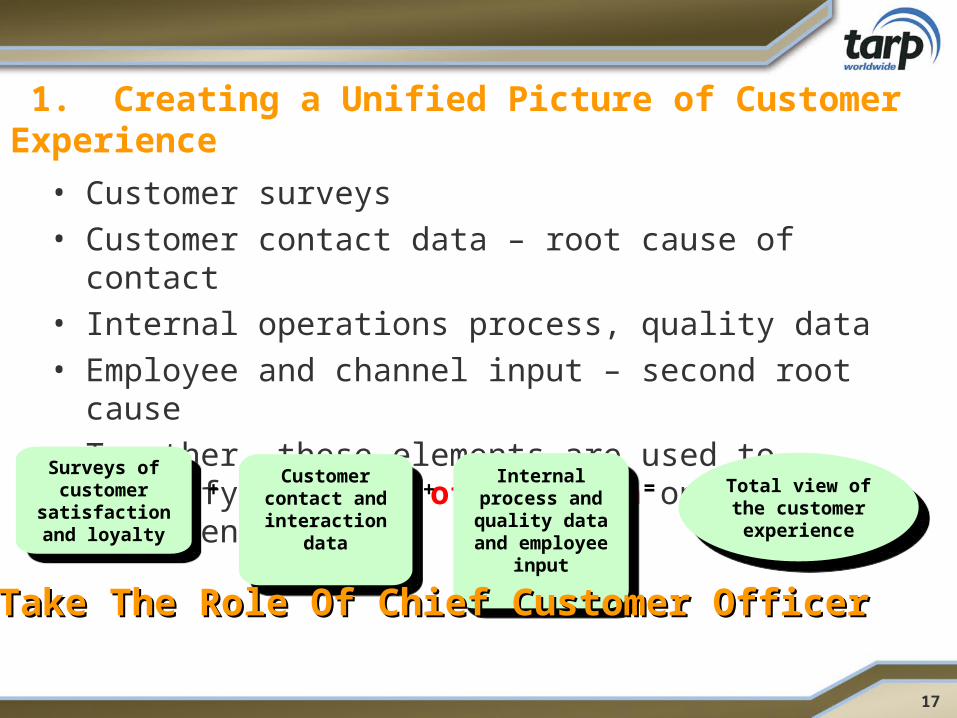
1. Creating a Unified Picture of Customer Experience
• Customer surveys• Customer contact data – root cause of contact• Internal operations process, quality data• Employee and channel input – second root cause • Together, these elements are used to quantify the cost of
inaction on customer experience issues
+ = Total view of the customer
experience
Total view of the customer
experience
Internal process and
quality data and employee input
Internal process and
quality data and employee input
+ Customer contact and
interaction data
Customer contact and
interaction data
Surveys of customer
satisfaction and loyalty
Surveys of customer
satisfaction and loyalty
Take The Role Of Chief Customer OfficerTake The Role Of Chief Customer Officer

Estimating Number of Customers and Market Impact From Contacts to Different Touch Points
** For these channels, the consumer may have first complained elsewhere and then escalated their complaint to this channel.
90% Don’t Complain
100 Airline customers
encountering delayed baggage
3% to baggage agent
0.8% to consumer affairs/ customers relations**
2% to supervisor on site**
2% to social media**
0.2% to executive by e-mail**
1% to frequent flyer 800#**
4% to reservations 800#
1% airline web site
1.5% Other
10% Complain
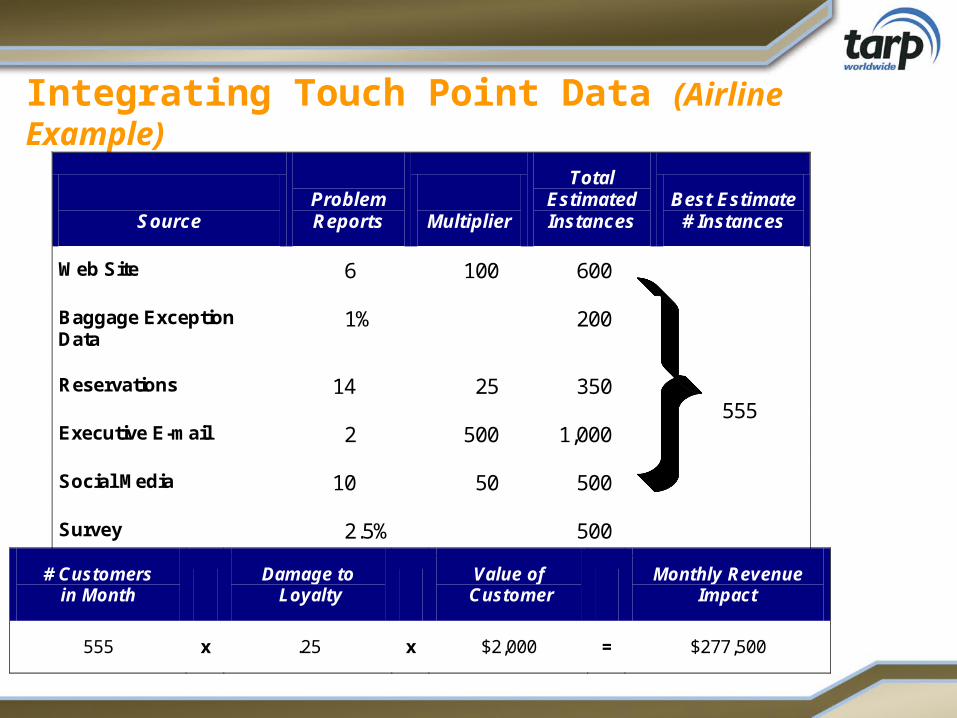
Integrating Touch Point Data (Airline Example)
Source
Problem Reports
Multiplier
Total Estimated Instances
Best Estimate # Instances
Web Site 6 100 600
Baggage Exception Data
1% 200
Reservations 14 25 350 555
Executive E-mail 2 500 1,000
Social Media 10 50 500
Survey 2.5% 500
# Customers
in Month Damage to
Loyalty Value of
Customer Monthly Revenue
Impact
555 x .25 x $2,000 = $277,500

• Journey, not an event• Began as Quality Improvement Group
• Dashboards, Scorecards “Reactive Process”• Multiple reports required prior to action
• Transformed into Customer Experience Quality Group• One complaint can result in action “Proactive Process”
•First step was to centralize information flow
ABC’s Voice of the Customer ProcessABC’s Voice of the Customer Process
Prior State
Voice 1
Department1
Current State
Voice 1 Voice 2 Voice 3
Function for Resolution
Customer Quality
Voice 2 Voice 3
Department2
Department3
Function for Resolution
Function for Resolution
Clear ownershipClear CommunicationBetter Scope of issue

Strategic Warranty Management
Research Issue [knowledge base]
Common
Customer Experience Quality
CQI Issue Generation
Form, Fit Function Investigations
Containment/Rework
Wrong/Missing Parts
Documentation Issue(MF37, Instruction Sheets)
Service KitAvailability
Marketing(Product Specifications)
DESIGN SUPPLIER MANUFACTURING ASSEMBLY MARKETING
RBU
WBU
CommercialCSI
Sanford
Pine Grove
New Bern
MGFC
RBU
WBU
CommercialCSI
Home Owner Plumber VIP Plumber BuilderWarranty grp
SpecifierInstaller Architect
CSCC-Core
RBU Sales
Retailr Wholesalr
Wholesale Sales Reps
Field Service
SalesCSCC-Pro
Int’lCenters
Modular
Platform
CommercialCSI
Investigation
Warranty $ Defective $ Claims Managt
VO
C
IMPR
OV
EM
EN
TC
ON
TA
CT
MA
NA
GEM
EN
TSW
MEnd U
sers
Cust
om
ers
Inside Sales Canada
China
India
Root Cause Analysis
Mexico
Warrant Statements
Warrant Policy
Warrant EntitlementService Kit Mgt

22
2. Get CFO Support by Quantifying Problem Impact 2. Get CFO Support by Quantifying Problem Impact
IQuestion/problem
experience
II Contactbehavior
IIIContact handling
CustomersCustomers
No Question/problem
experience70%
No Question/problem
experience70%
Question/problem
experience*
30%
Question/problem
experience*
30%
IVMarketimpact
Non-contactors
75%
Non-contactors
75%
Satisfied1
50%
Satisfied1
50%
Mollified2
30%
Mollified2
30%
% Definitely Will
Recommend
69%
39%
74%
42%
32%Dissatisfied3
20%
Dissatisfied3
20%
Word of
Mouth**
---
2.9
1.7
4.4
5.5
% Definitely Will Keep
Purchasing
82%
42%
86%
42%
22%
% Very Satisfied with
ABC
81%
40%
82%
52%
35%
Contactors25%
Contactors25%
* In the past 6 months** Average number of friends/colleagues told about the experience with ABC

23
=
=
=
=
x xx
=
2,000
6,000
9,000
37,500
54,500Total Customers At Risk
200,000Customers
withProblems
20%Dissatisfied
Many NotRepurchasing
Some NotRepurchasing
50%Satisfied
MostRepurchasing
75% Do NotComplain
25%Complain
30%Mollified
Some NotRepurchasing
Estimate Customers and Revenue At RiskEstimate Customers and Revenue At RiskDemonstrating financial impact with the CFO, CMO and the General Counsel
Three strategies: Prevention, Solicitation of Complaints and Improved Response
At $1000 one year value per customer, $54.500,000 at risk

Quantify The Consumer Experience: Health CareQuantify The Consumer Experience: Health Care
Mollified2
30%
Mollified2
30%
IQuestion/Problem
Experience
II ContactBehavior
IIIContact Handling
PatientsPatients Complainers5-30%
Complainers5-30%
No problem
experience60%
No problem
experience60%
Problemexperience
40%
Problemexperience
40%
Experience suggests three strategies:Prevention, Solicitation of Complaints, and Response
IVMarketImpact
% Definitely/Probably
Recommend/repurchasefrom same organization
Dissatisfied3
20%
Dissatisfied3
20%
Satisfied1
50%
Satisfied1
50%
90%
93%
30%
60%
50%
Non-Complainers
95-70%
Non-Complainers
95-70%
24Proprietary © 2012 TARP Worldwide
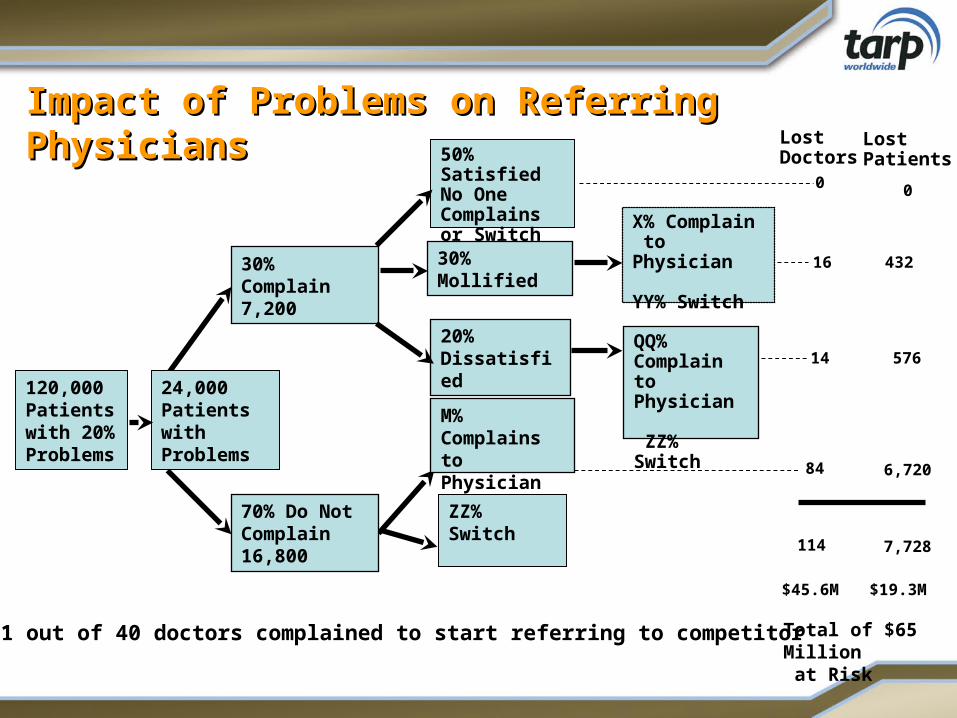
Lost Doctors
0
1 out of 40 doctors complained to start referring to competitor
M% Complains to Physician
QQ% Complain to Physician
ZZ% Switch
30%Mollified
X% Complain to Physician
YY% Switch
70% Do NotComplain 16,800
30%Complain 7,200
20% Dissatisfied
Impact of Problems on Referring PhysiciansImpact of Problems on Referring Physicians
120,000Patientswith 20%Problems
ZZ% Switch
24,000 Patients with Problems
50% Satisfied No One Complains or Switch
Lost Patients
16
84
14 576
432
0
$45.6M
114 7,728
6,720
$19.3M
Total of $65 Million at Risk
2626
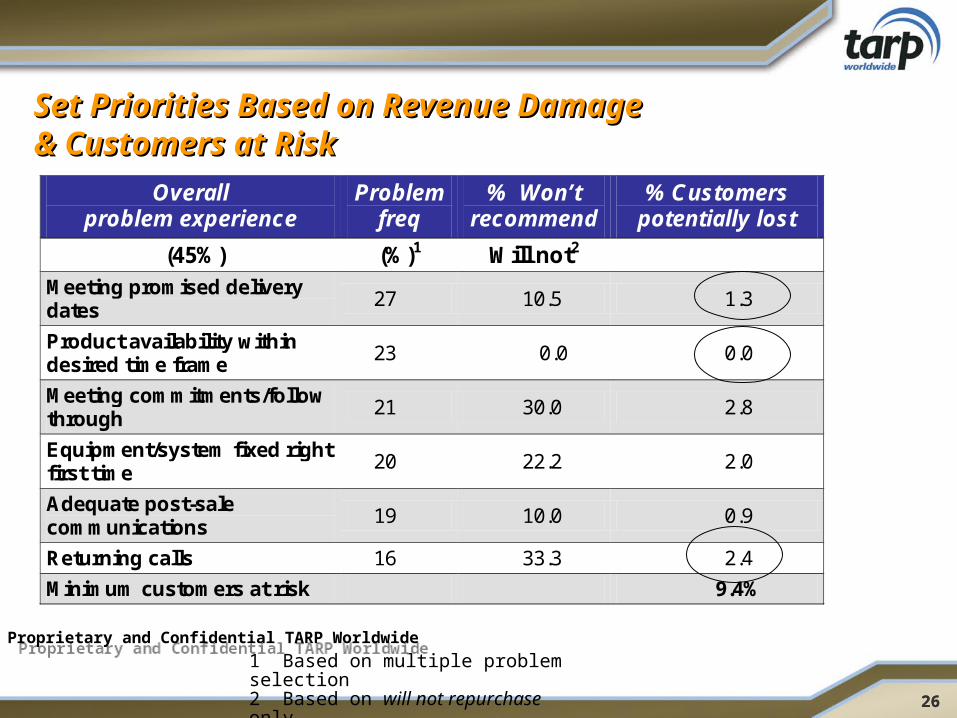
1 Based on multiple problem selection2 Based on will not repurchase only
Set Priorities Based on Revenue Damage Set Priorities Based on Revenue Damage & Customers at Risk& Customers at Risk
Overall problem experience
Problem freq
% Won’t recommend
% Customers potentially lost
(45%) (%)1 Will not2 Meeting promised delivery dates
27 10.5 1.3
Product availability within desired time frame
23 0.0 0.0
Meeting commitments/follow through
21 30.0 2.8
Equipment/system fixed right first time
20 22.2 2.0
Adequate post-sale communications
19 10.0 0.9
Returning calls 16 33.3 2.4
Minimum customers at risk 9.4%
Proprietary and Confidential TARP WorldwideProprietary and Confidential TARP Worldwide

$ 33,000
$ 72,000
$ 80,000
$250,000
=
=
=
=
x xx
$453,000=Total Cost of Unnecessary Service
20,000 EmployeeProblems
10%3+Contacts
$ 80 Cost to Handle
$25 Work-
around
66%1 Contact
$ 5 Cost to Handle
50% Do Not Seek
Assistance
50%Complain
24%2 Contacts
$ 30 Cost to Handle
Quantify the Cost of Poor Internal ServiceQuantify the Cost of Poor Internal ServiceHelp Desk EnvironmentHelp Desk Environment

28
Show The CMO That Negative Word Of Mouth Show The CMO That Negative Word Of Mouth Can Trump MarketingCan Trump Marketing
10%delighted
70%satisfied
Telltwo
Tell one
=
=
2,000
7,000
-3,000
10,000customers
Example calculation of potential impact
20%dissatisfied
Tell six
= -12,000
20% dissatisfaction can counter 80% satisfaction

29
Great Service Is A Word of MouthGreat Service Is A Word of Mouth Management Mechanism Management Mechanism
10%delighted
80%satisfied
Telltwo
Tell one
=
=
2,000
8,000
4,000
10,000customers
Example calculation of potential impact
10%dissatisfied
Tell six
= -6,000
10% decrease in dissatisfaction results in net positive WOM

3. Suggest Innovative Solutions3. Suggest Innovative Solutions• Welcome packages
– Best defense is a good offence– is this your first time with this product? – new user portal
• Education to prevent next call - Guardian• Note standard mistakes on forms • Enhanced home page (living list of questions) and
web site map (Index to products and issues)• Encourage calls before getting into trouble• Aggressively solicit complaints• Lead horse to self service water - give first sip - HP• Psychic Pizza - Confirm both before and after action
– NJ NG– Dominos

Proactive EducationProactive Education

3. Suggest Innovative Solutions3. Suggest Innovative Solutions• Welcome packages
– Best defense is a good offence– is this your first time with this product? – new user portal
• Education to prevent next call - Guardian• Note standard mistakes on forms • Enhanced home page (living list of questions) and
web site map (Index to products and issues)• Encourage calls before getting into trouble• Aggressively solicit complaints• Lead horse to self service water - give first sip - HP• Psychic Pizza - Confirm both before and after action
– NJ NG– Dominos

33
Real Psychic PizzaReal Psychic Pizza

Departments with Interest in a Great CE
1. Marketing – retention, word of mouth and “word of mouse”
2. Finance – margin and cost reduction
3. Brand – brand-aligned service stories
4. Quality – reduced customer error and innovative fixes
5. Channel partner management – less channel hassles
6. Risk, Warranty and Insurance – reduced claims and lawsuits
7. Legal and Regulatory – better service reduces visibility
8. HR – less problems leads to happier front line and lower turnover
9. Product development/market research – ideas and panels

35
Ten Myths About ServiceTen Myths About Service
1. Always exceed customer expectations
2. Answering the phone really fast is the key to success
3. People always prefer talking to people
4. The customer is always right
5. Complaints are down, things are getting better
6. Employees are the cause of most dissatisfaction
7. Price and cost cutting is the key to success
8. We’re better than the average in our industry – that’s great!
9. We’re at 90% satisfaction – let’s declare victory!
10. We measure Net Promoter so we’re done!
36
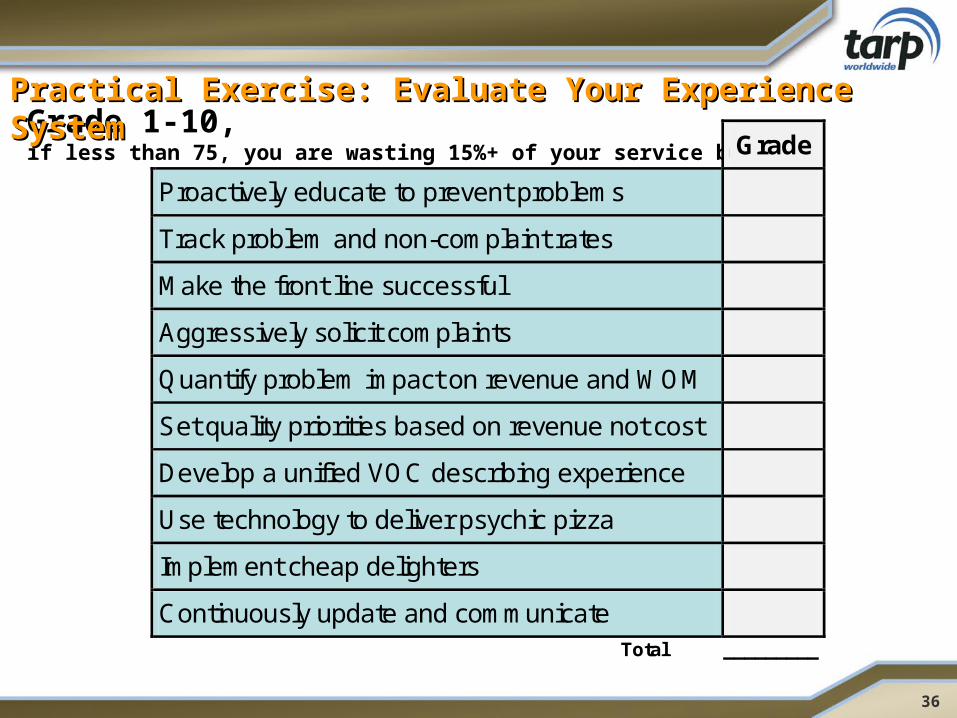
Grade 1-10, if less than 75, you are wasting 15%+ of your service budget
Practical Exercise: Evaluate Your Experience SystemPractical Exercise: Evaluate Your Experience System
Grade
Proactively educate to prevent problems
Track problem and non-complaint rates
Make the front line successful
Aggressively solicit complaints
Quantify problem impact on revenue and WOM
Set quality priorities based on revenue not cost
Develop a unified VOC describing experience
Use technology to deliver psychic pizza
Implement cheap delighters
Continuously update and communicate Total _________

Summary• CE is a huge opportunity for Quality• Create a unified VOC to identify the full range of
opportunities with payoff and sell to other departments• Understand the full range of root causes and prevent
unpleasant surprises• Quantify the revenue and word of mouth impact overall and
by granular issue to create the economic imperative• Prevent workload by proactively educating, connect,
explain and deliver psychic pizza • Take control of the VOC and then become the Chief
Customer Officer• Outlined in detail in Strategic Customer Service published by
AMACOM• For care package of articles: [email protected] or 703-284-9253