Embed Size (px)
Citation preview
Enterprise Architect Series:
Using UML – Behavioral Modeling Diagrams UML 2 Case Tool by Sparx Systems http://www.sparxsystems.com
© Sparx Systems 2007 Page 1
UML Tutorials
Using UML
Part Two –
Behavioral
Modeling
Diagrams
by Sparx Systems
All material © Sparx Systems 2007
http://www.sparxsystems.com
Enterprise Architect Series:
Using UML – Behavioral Modeling Diagrams UML 2 Case Tool by Sparx Systems http://www.sparxsystems.com
© Sparx Systems 2007 Page 2
Trademarks
Object Management Group, OMG, Unified Modeling Language, UML, are registered trademarks or
trademarks of the Object Management Group, Inc.
All other product and / or company names mentioned within this document are used for identification
purposes only, and may be trademarks or registered trademarks of their respective owners.
Enterprise Architect Series:
Using UML – Behavioral Modeling Diagrams UML 2 Case Tool by Sparx Systems http://www.sparxsystems.com
© Sparx Systems 2007 Page 3
Table of Contents
INTRODUCTION ..................................................................................................................................5
USE CASE MODEL...............................................................................................................................6
Actors...............................................................................................................................................6 Use Cases ........................................................................................................................................6 Use Case Definition.........................................................................................................................7 Name and Description .....................................................................................................................7 Requirements ...................................................................................................................................7 Constraints.......................................................................................................................................7 Scenarios .........................................................................................................................................8 Including Use Cases ........................................................................................................................8 Extending Use Cases .......................................................................................................................8 Extension Points ..............................................................................................................................8 System Boundary .............................................................................................................................9
ACTIVITY DIAGRAMS..................................................................................................................... 10
Activities ........................................................................................................................................ 10 Actions ........................................................................................................................................... 10 Action Constraints ......................................................................................................................... 11 Control Flow.................................................................................................................................. 11 Initial Node .................................................................................................................................... 11 Final Node ..................................................................................................................................... 11 Objects and Object Flows.............................................................................................................. 12 Decision and Merge Nodes............................................................................................................ 12 Fork and Join Nodes...................................................................................................................... 13 Expansion Region .......................................................................................................................... 13 Exception Handlers ....................................................................................................................... 14 Interruptible Activity Region ......................................................................................................... 14 Partition......................................................................................................................................... 14
STATE MACHINE DIAGRAMS ....................................................................................................... 16
States.............................................................................................................................................. 16 Initial and Final States .................................................................................................................. 16 Transitions ..................................................................................................................................... 17 State Actions .................................................................................................................................. 17 Self-Transitions.............................................................................................................................. 17 Compound States ........................................................................................................................... 18 Entry Point..................................................................................................................................... 19 Exit Point ....................................................................................................................................... 20 Choice Pseudo-State ...................................................................................................................... 20 Junction Pseudo-State ................................................................................................................... 21 Terminate Pseudo-State................................................................................................................. 21 History States................................................................................................................................. 22 Concurrent Regions ....................................................................................................................... 22
COMMUNICATION DIAGRAMS .................................................................................................... 24
SEQUENCE DIAGRAMS................................................................................................................... 26
Lifelines ......................................................................................................................................... 26 Messages........................................................................................................................................ 26 Execution Occurrence.................................................................................................................... 27 Self Message .................................................................................................................................. 27 Lost and Found Messages.............................................................................................................. 27 Lifeline Start and End .................................................................................................................... 28 Duration and Time Constraints ..................................................................................................... 28
Enterprise Architect Series:
Using UML – Behavioral Modeling Diagrams UML 2 Case Tool by Sparx Systems http://www.sparxsystems.com
© Sparx Systems 2007 Page 4
Combined Fragments..................................................................................................................... 29 Gate ............................................................................................................................................... 30 Part Decomposition ....................................................................................................................... 31 State Invariant / Continuations...................................................................................................... 32
TIMING DIAGRAMS ......................................................................................................................... 33
State Lifeline .................................................................................................................................. 33 Value Lifeline................................................................................................................................. 33 Putting it all together..................................................................................................................... 33
INTERACTION OVERVIEW DIAGRAMS..................................................................................... 35
Interaction Occurrence.................................................................................................................. 35 Interaction Element ....................................................................................................................... 35 Putting it all together..................................................................................................................... 35
RECOMMENDED READING ........................................................................................................... 37
Enterprise Architect Series:
Using UML – Behavioral Modeling Diagrams UML 2 Case Tool by Sparx Systems http://www.sparxsystems.com
© Sparx Systems 2007 Page 5
Introduction The Unified Modeling Language (UML) has become the de-facto standard for building
Object-Oriented software. UML 2.1 builds on the already highly successful UML 2.0
standard, which has become an industry standard for modeling, design and construction
of software systems as well as more generalized business and scientific processes.
UML 2.1 defines thirteen basic diagram types, divided into two general sets: structural
modeling diagrams and behavioral modeling diagrams. Part two will deal with
behavioral modeling diagrams.
The Object Management Group (OMG) specification states:
“The Unified Modeling Language (UML) is a graphical language for
visualizing, specifying, constructing, and documenting the artifacts of a
software-intensive system. The UML offers a standard way to write a system’s
blueprints, including conceptual things such as business processes and system
functions as well as concrete things such as programming language statements,
database schemas, and reusable software components.”
The important point to note here is UML is a “language” for specifying and not a
method or procedure. The UML is used to define a software system – to detail the
artifacts in the systems, to document and construct; it is the language the blueprint is
written in. The UML may be used in a variety of ways to support a software
development methodology (such as the Rational Unified Process), but in itself does not
specify that methodology or process.
Behavior diagrams capture the varieties of interaction and instantaneous state within a
model as it “executes” over time.
Enterprise Architect Series:
Using UML – Behavioral Modeling Diagrams UML 2 Case Tool by Sparx Systems http://www.sparxsystems.com
© Sparx Systems 2007 Page 6
Use Case Model The use case model captures the requirements of a system. Use cases are a means of
communicating with users and other stakeholders what the system is intended to do.
Actors
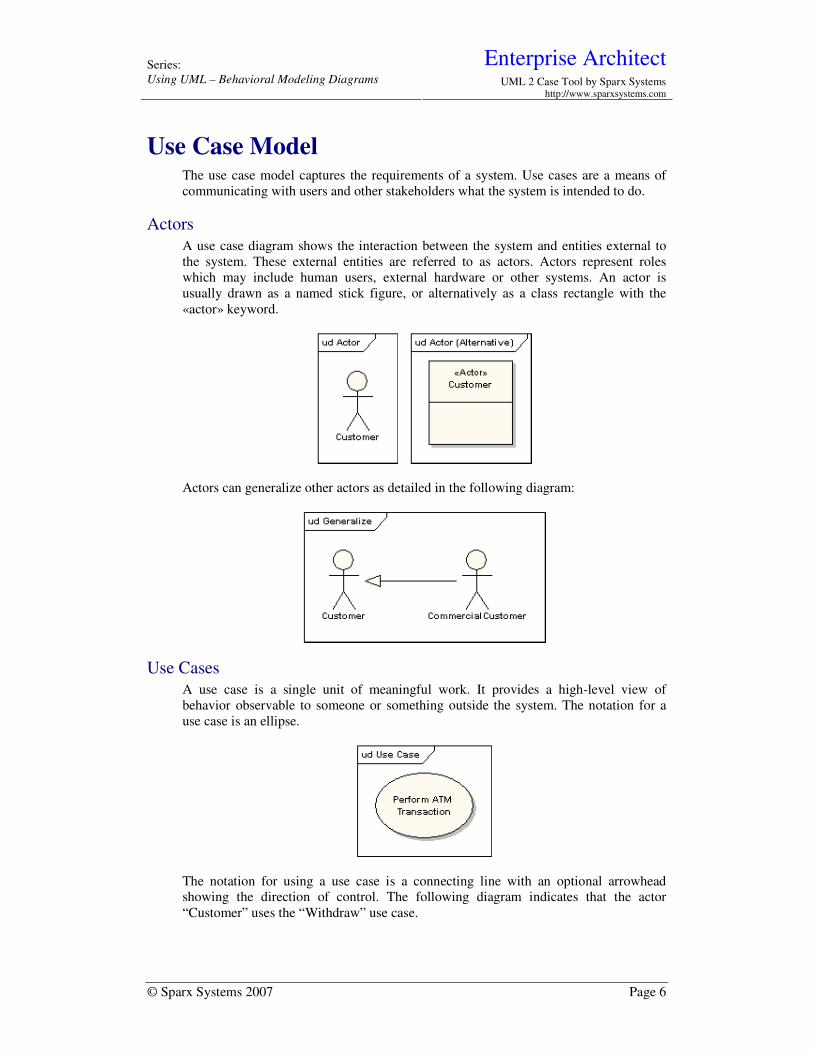
A use case diagram shows the interaction between the system and entities external to
the system. These external entities are referred to as actors. Actors represent roles
which may include human users, external hardware or other systems. An actor is
usually drawn as a named stick figure, or alternatively as a class rectangle with the
«actor» keyword.
Actors can generalize other actors as detailed in the following diagram:
Use Cases
A use case is a single unit of meaningful work. It provides a high-level view of
behavior observable to someone or something outside the system. The notation for a
use case is an ellipse.
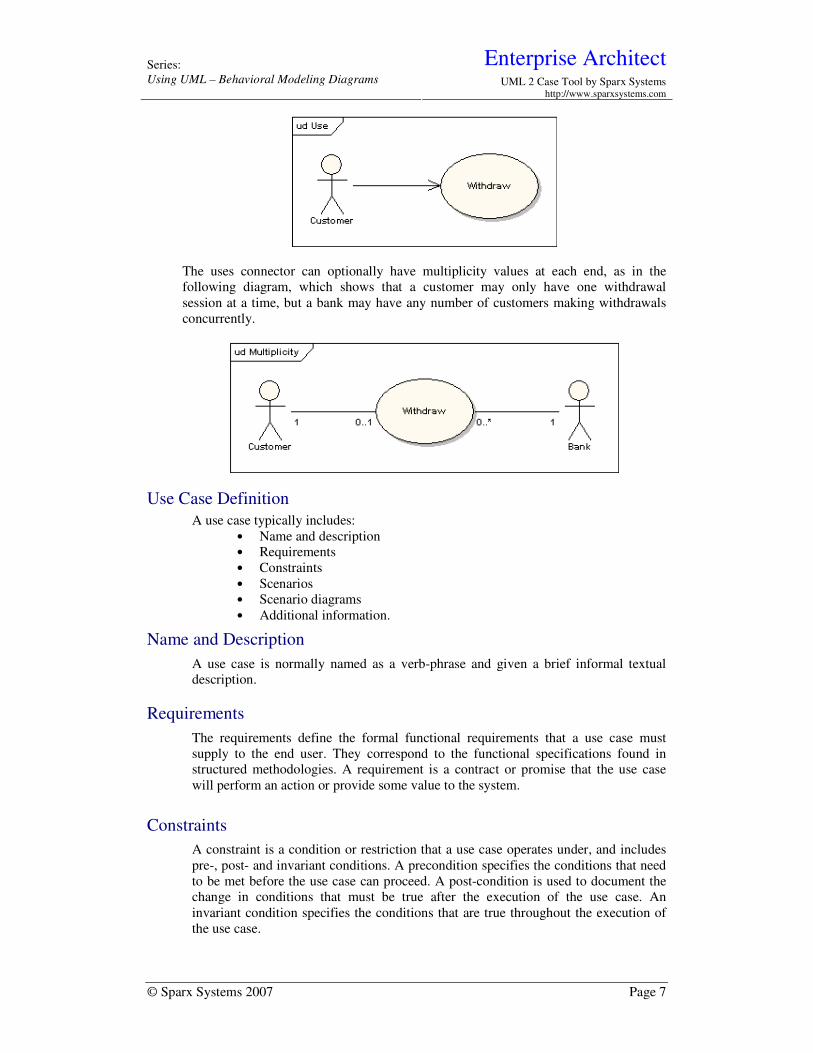
The notation for using a use case is a connecting line with an optional arrowhead
showing the direction of control. The following diagram indicates that the actor
“Customer” uses the “Withdraw” use case.
Enterprise Architect Series:
Using UML – Behavioral Modeling Diagrams UML 2 Case Tool by Sparx Systems http://www.sparxsystems.com
© Sparx Systems 2007 Page 7
The uses connector can optionally have multiplicity values at each end, as in the
following diagram, which shows that a customer may only have one withdrawal
session at a time, but a bank may have any number of customers making withdrawals
concurrently.
Use Case Definition
A use case typically includes:
• Name and description
• Requirements
• Constraints
• Scenarios
• Scenario diagrams
• Additional information.
Name and Description
A use case is normally named as a verb-phrase and given a brief informal textual
description.
Requirements
The requirements define the formal functional requirements that a use case must
supply to the end user. They correspond to the functional specifications found in
structured methodologies. A requirement is a contract or promise that the use case
will perform an action or provide some value to the system.
Constraints
A constraint is a condition or restriction that a use case operates under, and includes
pre-, post- and invariant conditions. A precondition specifies the conditions that need
to be met before the use case can proceed. A post-condition is used to document the
change in conditions that must be true after the execution of the use case. An
invariant condition specifies the conditions that are true throughout the execution of
the use case.
Enterprise Architect Series:
Using UML – Behavioral Modeling Diagrams UML 2 Case Tool by Sparx Systems http://www.sparxsystems.com
© Sparx Systems 2007 Page 8
Scenarios
A scenario is a formal description of the flow of events that occur during the
execution of a use case instance. It defines the specific sequence of events between
the system and the external actors. It is normally described in text and corresponds to
the textual representation of the sequence diagram.
Including Use Cases
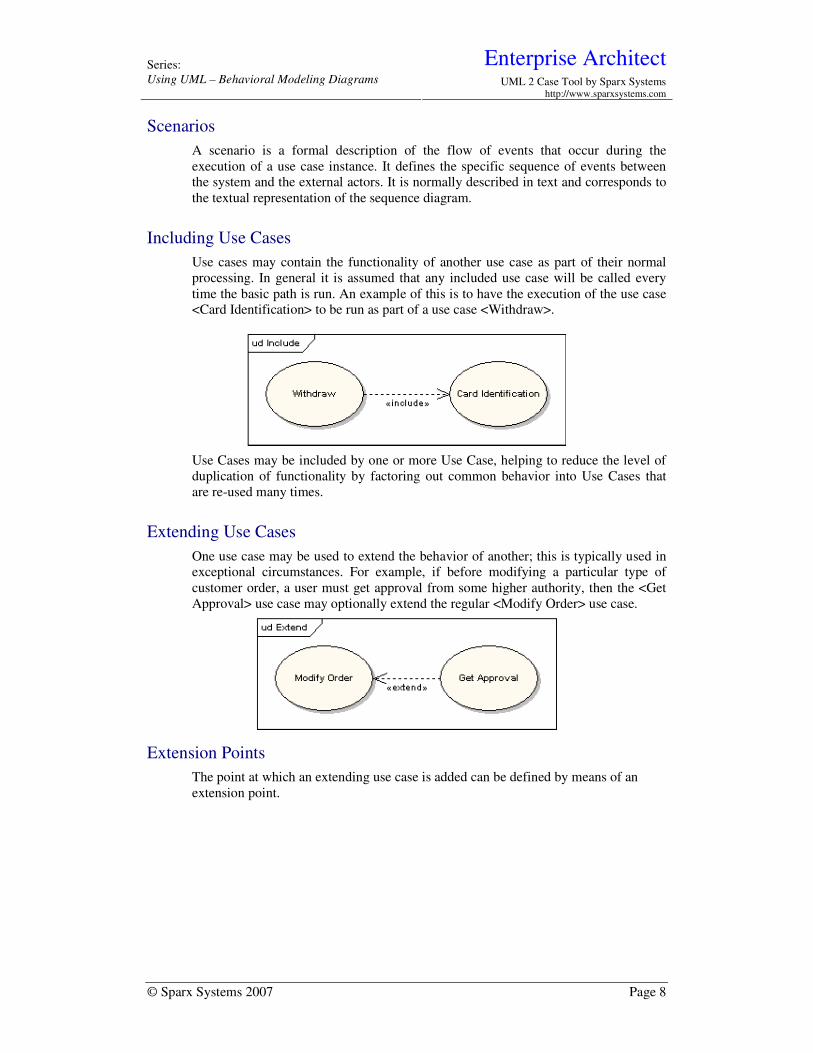
Use cases may contain the functionality of another use case as part of their normal
processing. In general it is assumed that any included use case will be called every
time the basic path is run. An example of this is to have the execution of the use case
<Card Identification> to be run as part of a use case <Withdraw>.
Use Cases may be included by one or more Use Case, helping to reduce the level of
duplication of functionality by factoring out common behavior into Use Cases that
are re-used many times.
Extending Use Cases
One use case may be used to extend the behavior of another; this is typically used in
exceptional circumstances. For example, if before modifying a particular type of
customer order, a user must get approval from some higher authority, then the <Get
Approval> use case may optionally extend the regular <Modify Order> use case.
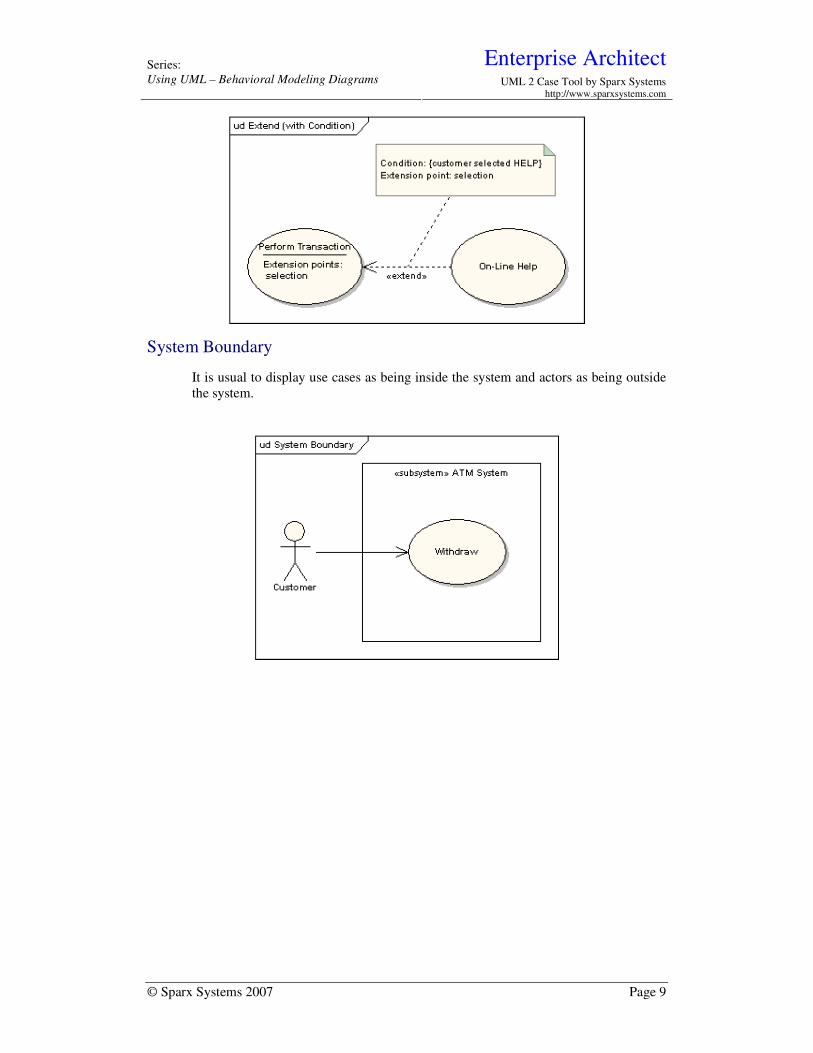
Extension Points
The point at which an extending use case is added can be defined by means of an
extension point.
Enterprise Architect Series:
Using UML – Behavioral Modeling Diagrams UML 2 Case Tool by Sparx Systems http://www.sparxsystems.com
© Sparx Systems 2007 Page 9
System Boundary
It is usual to display use cases as being inside the system and actors as being outside
the system.
Enterprise Architect Series:
Using UML – Behavioral Modeling Diagrams UML 2 Case Tool by Sparx Systems http://www.sparxsystems.com
© Sparx Systems 2007 Page 10
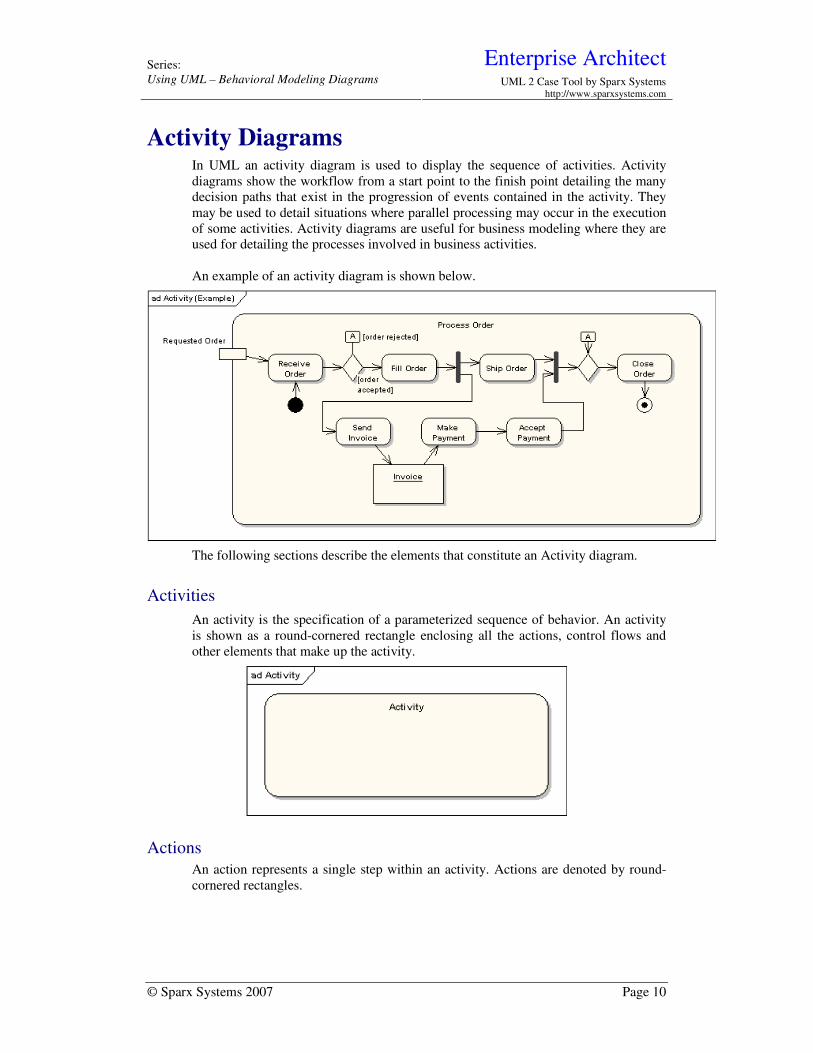
Activity Diagrams In UML an activity diagram is used to display the sequence of activities. Activity
diagrams show the workflow from a start point to the finish point detailing the many
decision paths that exist in the progression of events contained in the activity. They
may be used to detail situations where parallel processing may occur in the execution
of some activities. Activity diagrams are useful for business modeling where they are
used for detailing the processes involved in business activities.
An example of an activity diagram is shown below.
The following sections describe the elements that constitute an Activity diagram.
Activities
An activity is the specification of a parameterized sequence of behavior. An activity
is shown as a round-cornered rectangle enclosing all the actions, control flows and
other elements that make up the activity.
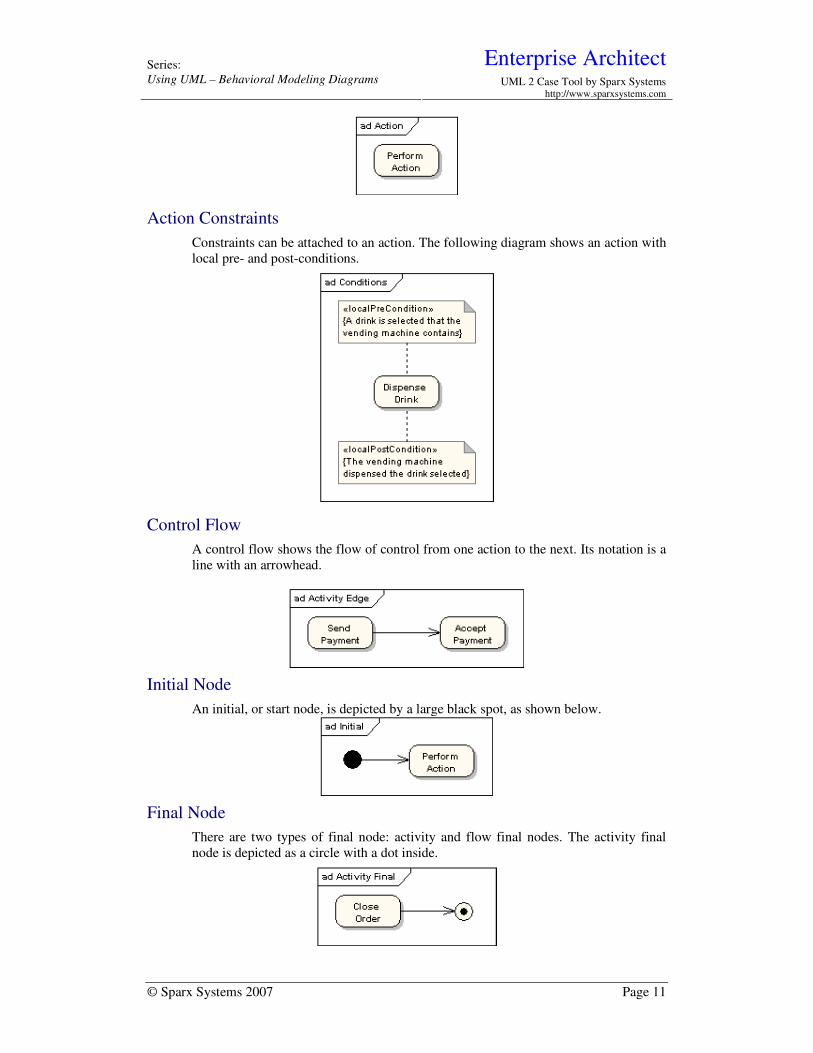
Actions
An action represents a single step within an activity. Actions are denoted by round-
cornered rectangles.
Enterprise Architect Series:
Using UML – Behavioral Modeling Diagrams UML 2 Case Tool by Sparx Systems http://www.sparxsystems.com
© Sparx Systems 2007 Page 11
Action Constraints
Constraints can be attached to an action. The following diagram shows an action with
local pre- and post-conditions.
Control Flow
A control flow shows the flow of control from one action to the next. Its notation is a
line with an arrowhead.
Initial Node
An initial, or start node, is depicted by a large black spot, as shown below.
Final Node
There are two types of final node: activity and flow final nodes. The activity final
node is depicted as a circle with a dot inside.
Enterprise Architect Series:
Using UML – Behavioral Modeling Diagrams UML 2 Case Tool by Sparx Systems http://www.sparxsystems.com
© Sparx Systems 2007 Page 12
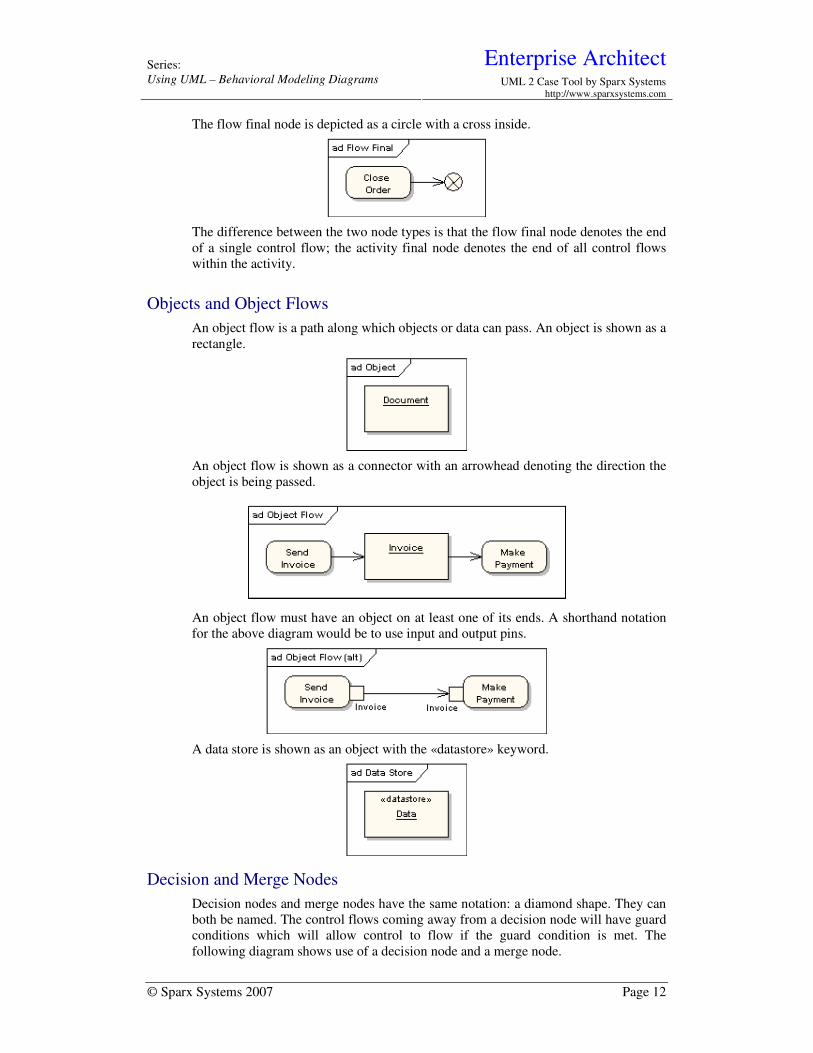
The flow final node is depicted as a circle with a cross inside.
The difference between the two node types is that the flow final node denotes the end
of a single control flow; the activity final node denotes the end of all control flows
within the activity.
Objects and Object Flows
An object flow is a path along which objects or data can pass. An object is shown as a
rectangle.
An object flow is shown as a connector with an arrowhead denoting the direction the
object is being passed.
An object flow must have an object on at least one of its ends. A shorthand notation
for the above diagram would be to use input and output pins.
A data store is shown as an object with the «datastore» keyword.
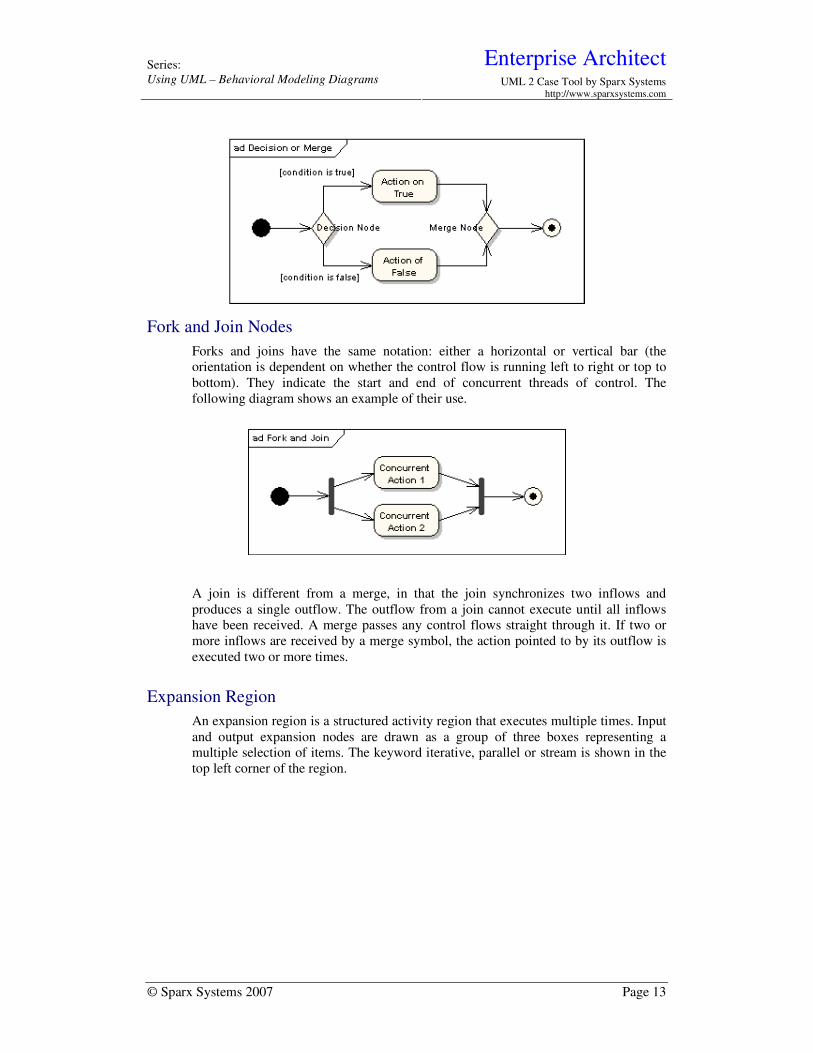
Decision and Merge Nodes
Decision nodes and merge nodes have the same notation: a diamond shape. They can
both be named. The control flows coming away from a decision node will have guard
conditions which will allow control to flow if the guard condition is met. The
following diagram shows use of a decision node and a merge node.
Enterprise Architect Series:
Using UML – Behavioral Modeling Diagrams UML 2 Case Tool by Sparx Systems http://www.sparxsystems.com
© Sparx Systems 2007 Page 13
Fork and Join Nodes
Forks and joins have the same notation: either a horizontal or vertical bar (the
orientation is dependent on whether the control flow is running left to right or top to
bottom). They indicate the start and end of concurrent threads of control. The
following diagram shows an example of their use.
A join is different from a merge, in that the join synchronizes two inflows and
produces a single outflow. The outflow from a join cannot execute until all inflows
have been received. A merge passes any control flows straight through it. If two or
more inflows are received by a merge symbol, the action pointed to by its outflow is
executed two or more times.
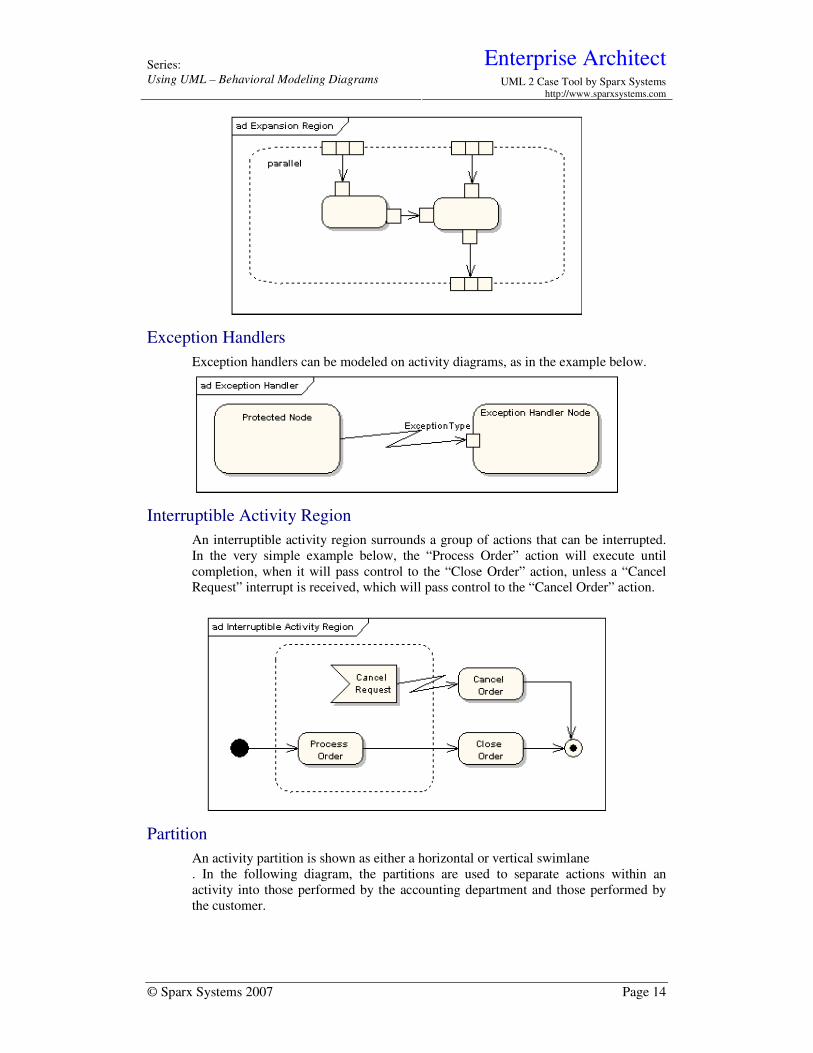
Expansion Region
An expansion region is a structured activity region that executes multiple times. Input
and output expansion nodes are drawn as a group of three boxes representing a
multiple selection of items. The keyword iterative, parallel or stream is shown in the
top left corner of the region.
Enterprise Architect Series:
Using UML – Behavioral Modeling Diagrams UML 2 Case Tool by Sparx Systems http://www.sparxsystems.com
© Sparx Systems 2007 Page 14
Exception Handlers
Exception handlers can be modeled on activity diagrams, as in the example below.
Interruptible Activity Region
An interruptible activity region surrounds a group of actions that can be interrupted.
In the very simple example below, the “Process Order” action will execute until
completion, when it will pass control to the “Close Order” action, unless a “Cancel
Request” interrupt is received, which will pass control to the “Cancel Order” action.
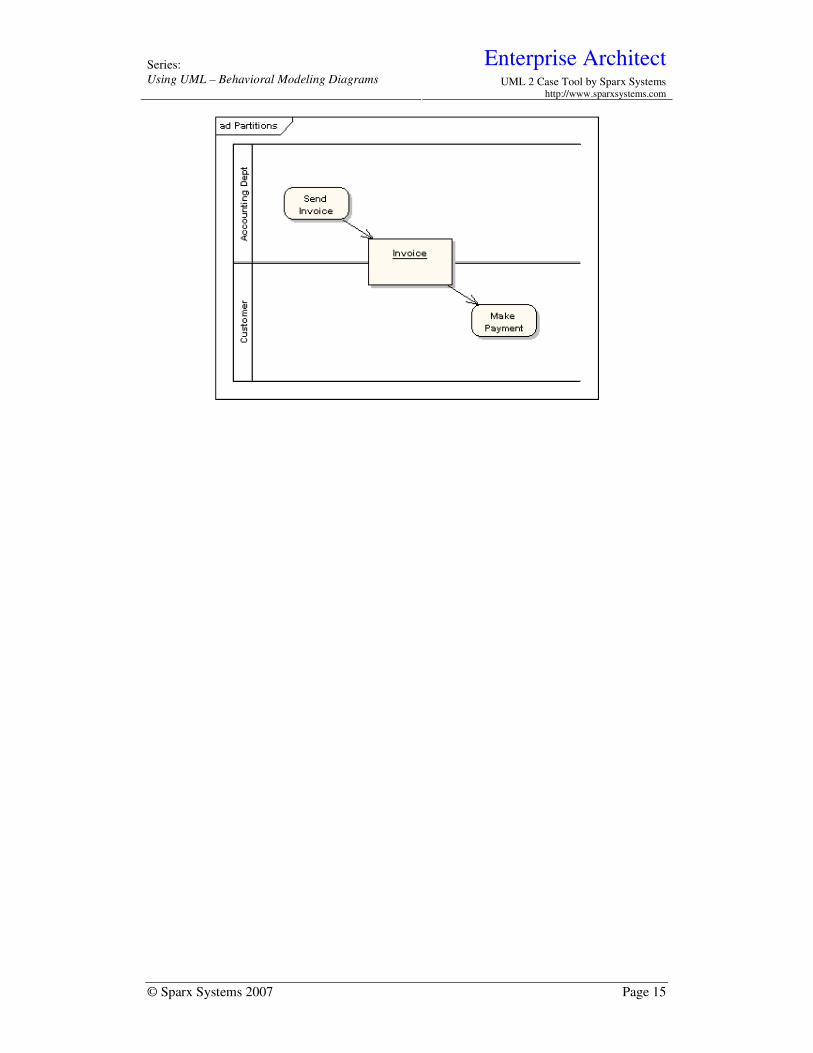
Partition
An activity partition is shown as either a horizontal or vertical swimlane
. In the following diagram, the partitions are used to separate actions within an
activity into those performed by the accounting department and those performed by
the customer.
Enterprise Architect Series:
Using UML – Behavioral Modeling Diagrams UML 2 Case Tool by Sparx Systems http://www.sparxsystems.com
© Sparx Systems 2007 Page 15
Enterprise Architect Series:
Using UML – Behavioral Modeling Diagrams UML 2 Case Tool by Sparx Systems http://www.sparxsystems.com
© Sparx Systems 2007 Page 16
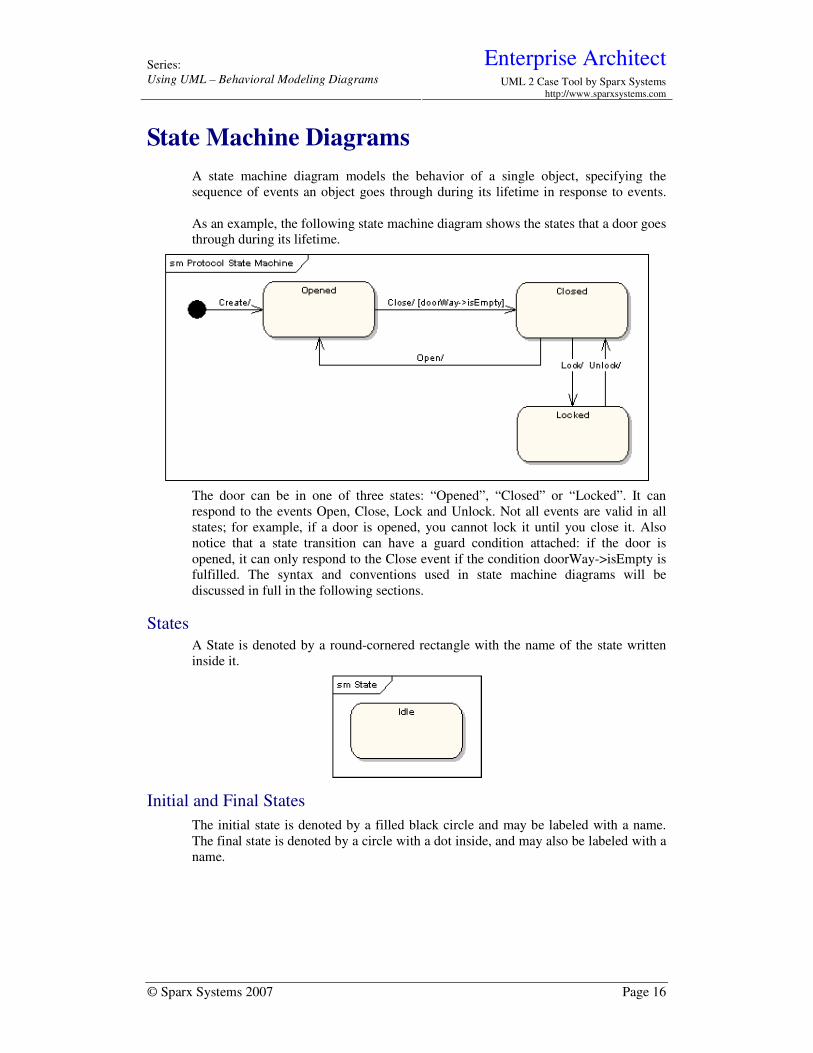
State Machine Diagrams
A state machine diagram models the behavior of a single object, specifying the
sequence of events an object goes through during its lifetime in response to events.
As an example, the following state machine diagram shows the states that a door goes
through during its lifetime.
The door can be in one of three states: “Opened”, “Closed” or “Locked”. It can
respond to the events Open, Close, Lock and Unlock. Not all events are valid in all
states; for example, if a door is opened, you cannot lock it until you close it. Also
notice that a state transition can have a guard condition attached: if the door is
opened, it can only respond to the Close event if the condition doorWay->isEmpty is
fulfilled. The syntax and conventions used in state machine diagrams will be
discussed in full in the following sections.
States
A State is denoted by a round-cornered rectangle with the name of the state written
inside it.
Initial and Final States
The initial state is denoted by a filled black circle and may be labeled with a name.
The final state is denoted by a circle with a dot inside, and may also be labeled with a
name.
Enterprise Architect Series:
Using UML – Behavioral Modeling Diagrams UML 2 Case Tool by Sparx Systems http://www.sparxsystems.com
© Sparx Systems 2007 Page 17
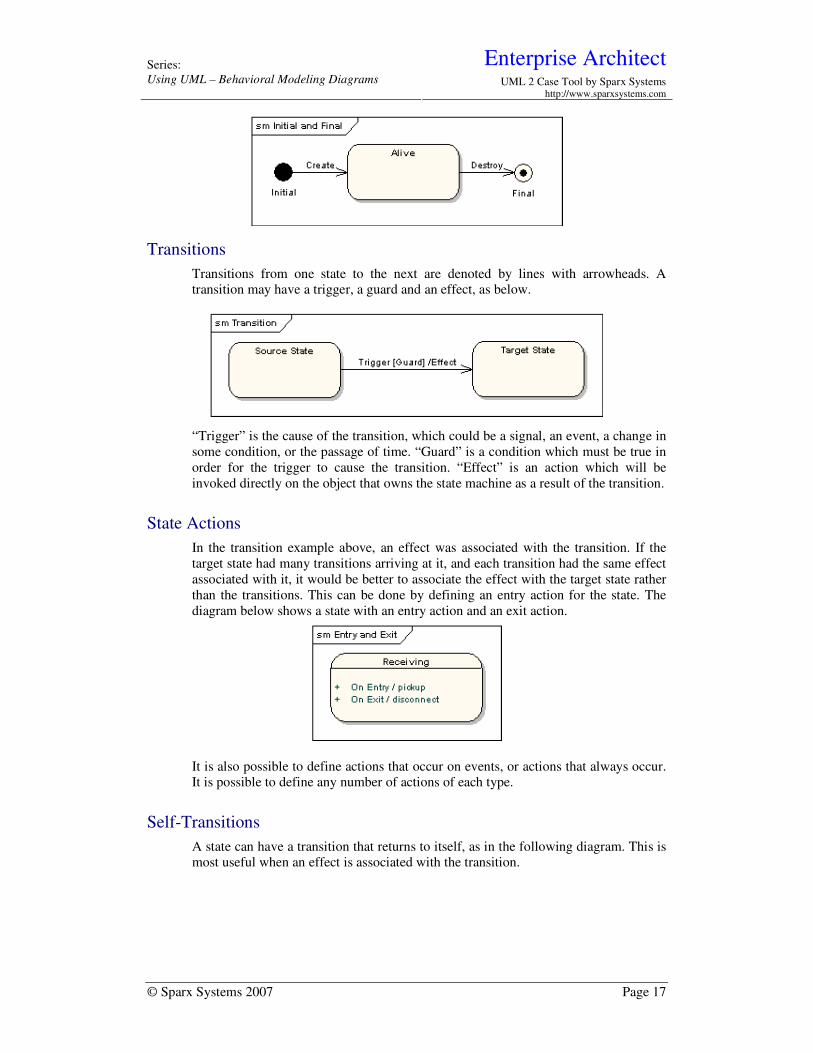
Transitions
Transitions from one state to the next are denoted by lines with arrowheads. A
transition may have a trigger, a guard and an effect, as below.
“Trigger” is the cause of the transition, which could be a signal, an event, a change in
some condition, or the passage of time. “Guard” is a condition which must be true in
order for the trigger to cause the transition. “Effect” is an action which will be
invoked directly on the object that owns the state machine as a result of the transition.
State Actions
In the transition example above, an effect was associated with the transition. If the
target state had many transitions arriving at it, and each transition had the same effect
associated with it, it would be better to associate the effect with the target state rather
than the transitions. This can be done by defining an entry action for the state. The
diagram below shows a state with an entry action and an exit action.
It is also possible to define actions that occur on events, or actions that always occur.
It is possible to define any number of actions of each type.
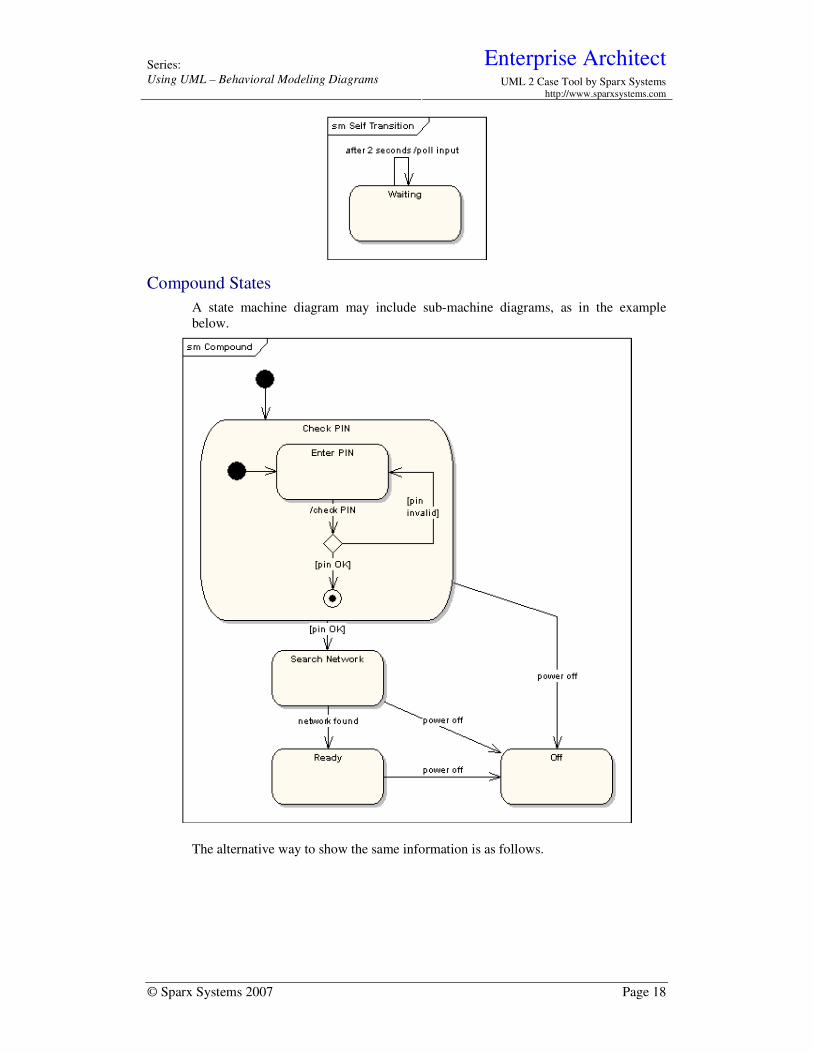
Self-Transitions
A state can have a transition that returns to itself, as in the following diagram. This is
most useful when an effect is associated with the transition.
Enterprise Architect Series:
Using UML – Behavioral Modeling Diagrams UML 2 Case Tool by Sparx Systems http://www.sparxsystems.com
© Sparx Systems 2007 Page 18
Compound States
A state machine diagram may include sub-machine diagrams, as in the example
below.
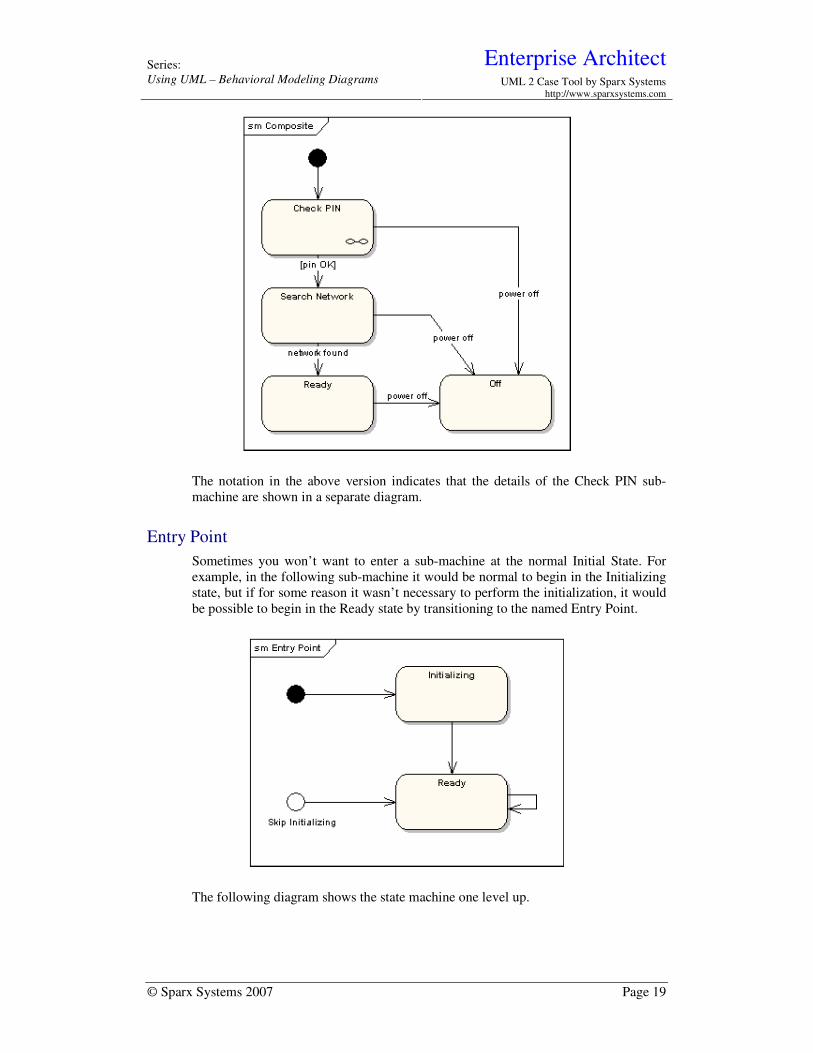
The alternative way to show the same information is as follows.
Enterprise Architect Series:
Using UML – Behavioral Modeling Diagrams UML 2 Case Tool by Sparx Systems http://www.sparxsystems.com
© Sparx Systems 2007 Page 19
The notation in the above version indicates that the details of the Check PIN sub-
machine are shown in a separate diagram.
Entry Point
Sometimes you won’t want to enter a sub-machine at the normal Initial State. For
example, in the following sub-machine it would be normal to begin in the Initializing
state, but if for some reason it wasn’t necessary to perform the initialization, it would
be possible to begin in the Ready state by transitioning to the named Entry Point.
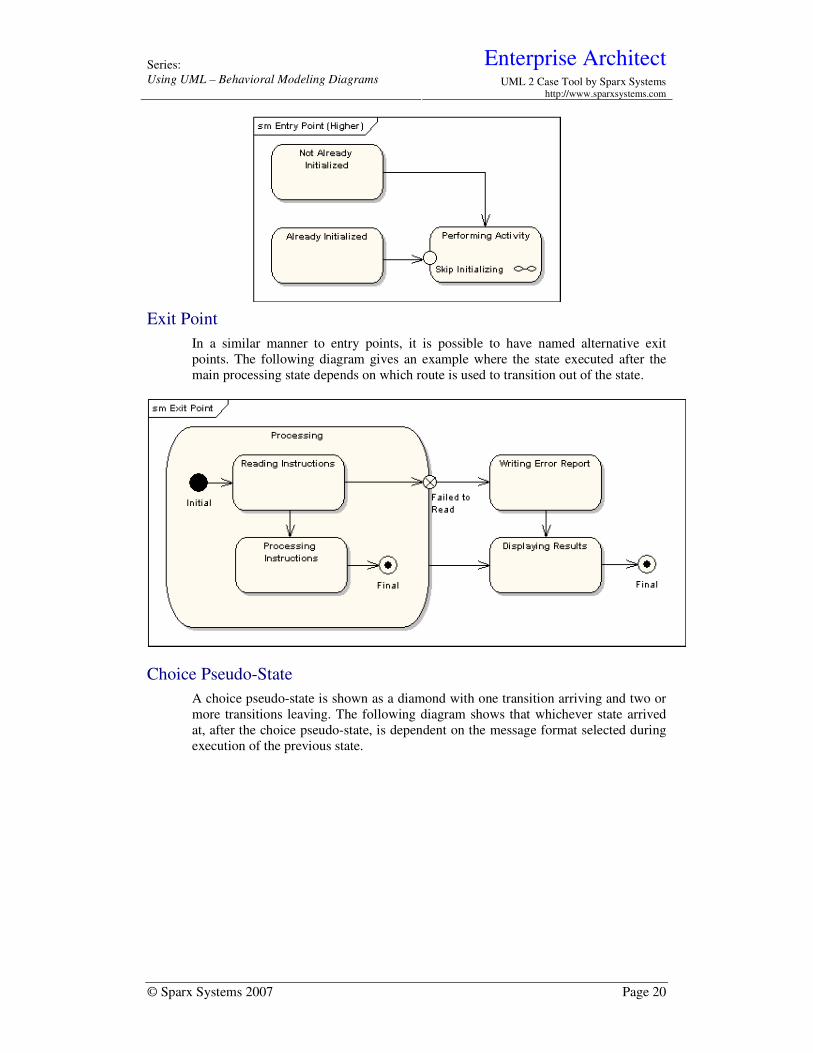
The following diagram shows the state machine one level up.
Enterprise Architect Series:
Using UML – Behavioral Modeling Diagrams UML 2 Case Tool by Sparx Systems http://www.sparxsystems.com
© Sparx Systems 2007 Page 20
Exit Point
In a similar manner to entry points, it is possible to have named alternative exit
points. The following diagram gives an example where the state executed after the
main processing state depends on which route is used to transition out of the state.
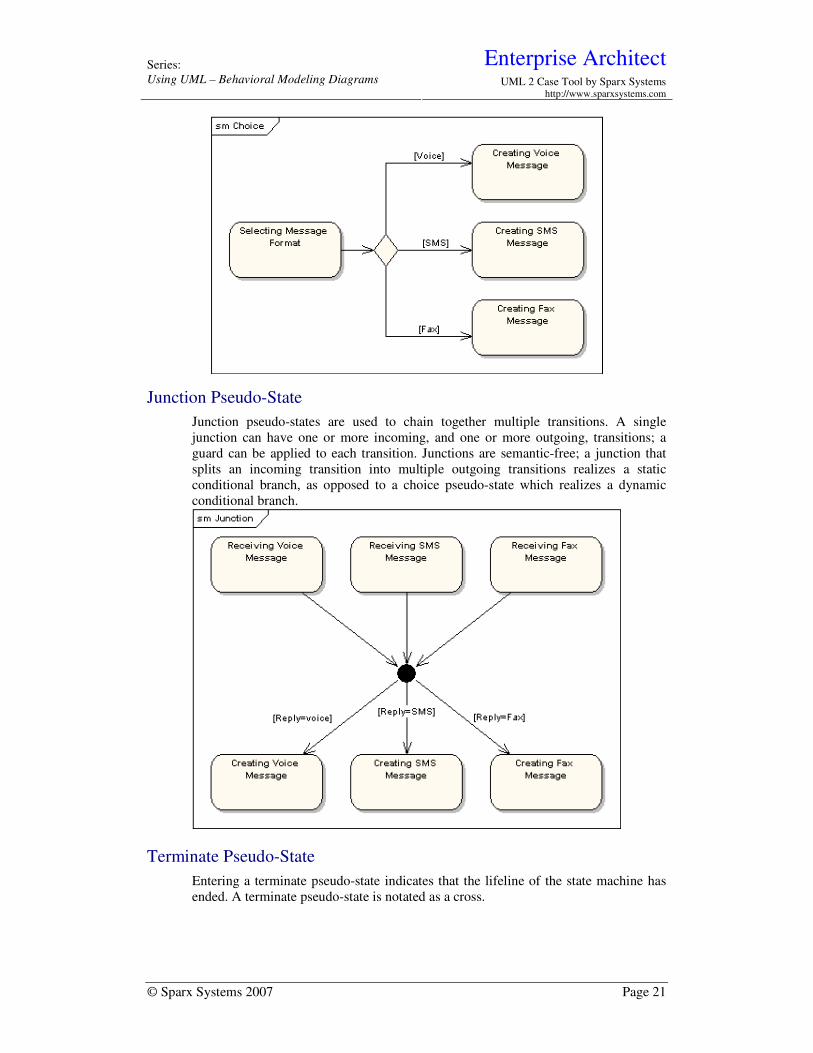
Choice Pseudo-State
A choice pseudo-state is shown as a diamond with one transition arriving and two or
more transitions leaving. The following diagram shows that whichever state arrived
at, after the choice pseudo-state, is dependent on the message format selected during
execution of the previous state.
Enterprise Architect Series:
Using UML – Behavioral Modeling Diagrams UML 2 Case Tool by Sparx Systems http://www.sparxsystems.com
© Sparx Systems 2007 Page 21
Junction Pseudo-State
Junction pseudo-states are used to chain together multiple transitions. A single
junction can have one or more incoming, and one or more outgoing, transitions; a
guard can be applied to each transition. Junctions are semantic-free; a junction that
splits an incoming transition into multiple outgoing transitions realizes a static
conditional branch, as opposed to a choice pseudo-state which realizes a dynamic
conditional branch.
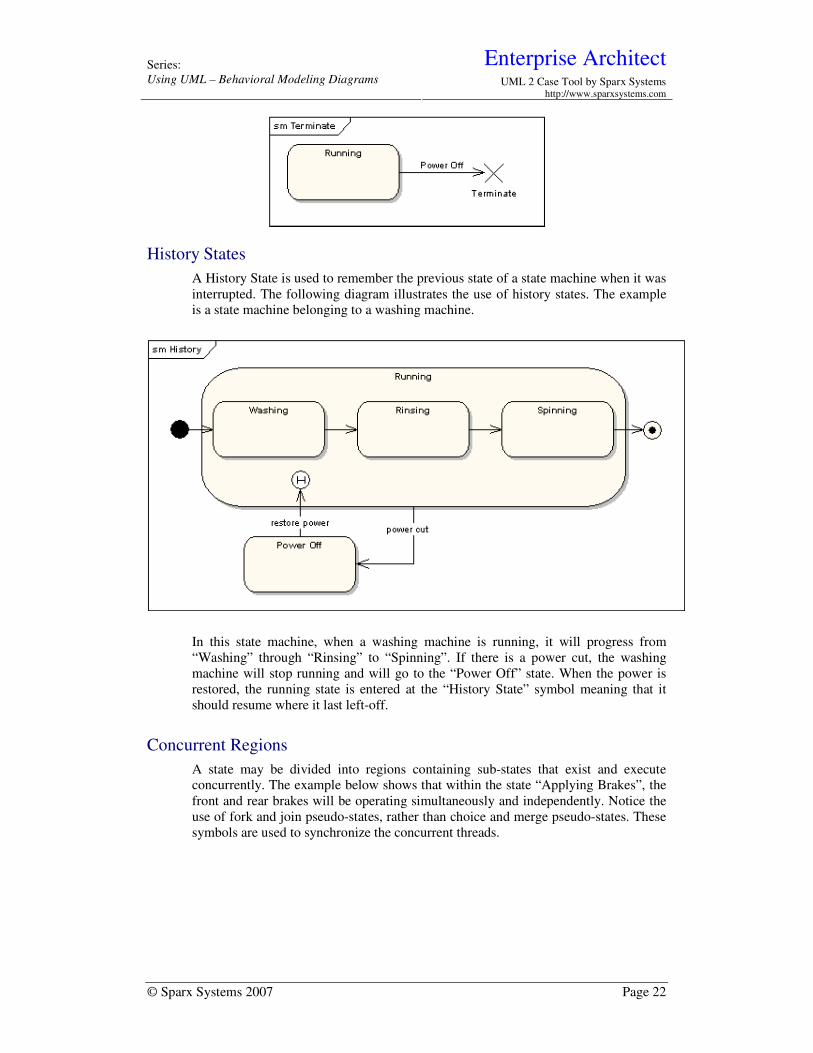
Terminate Pseudo-State
Entering a terminate pseudo-state indicates that the lifeline of the state machine has
ended. A terminate pseudo-state is notated as a cross.
Enterprise Architect Series:
Using UML – Behavioral Modeling Diagrams UML 2 Case Tool by Sparx Systems http://www.sparxsystems.com
© Sparx Systems 2007 Page 22
History States
A History State is used to remember the previous state of a state machine when it was
interrupted. The following diagram illustrates the use of history states. The example
is a state machine belonging to a washing machine.
In this state machine, when a washing machine is running, it will progress from
“Washing” through “Rinsing” to “Spinning”. If there is a power cut, the washing
machine will stop running and will go to the “Power Off” state. When the power is
restored, the running state is entered at the “History State” symbol meaning that it
should resume where it last left-off.
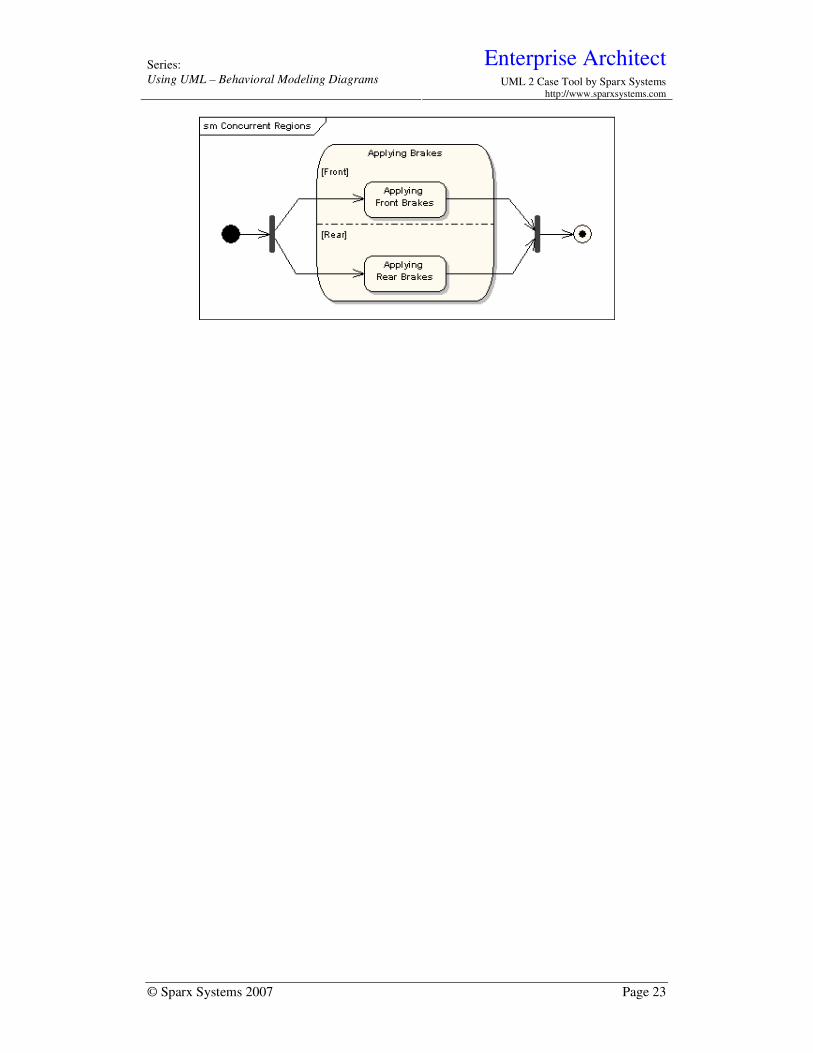
Concurrent Regions
A state may be divided into regions containing sub-states that exist and execute
concurrently. The example below shows that within the state “Applying Brakes”, the
front and rear brakes will be operating simultaneously and independently. Notice the
use of fork and join pseudo-states, rather than choice and merge pseudo-states. These
symbols are used to synchronize the concurrent threads.
Enterprise Architect Series:
Using UML – Behavioral Modeling Diagrams UML 2 Case Tool by Sparx Systems http://www.sparxsystems.com
© Sparx Systems 2007 Page 23
Enterprise Architect Series:
Using UML – Behavioral Modeling Diagrams UML 2 Case Tool by Sparx Systems http://www.sparxsystems.com
© Sparx Systems 2007 Page 24
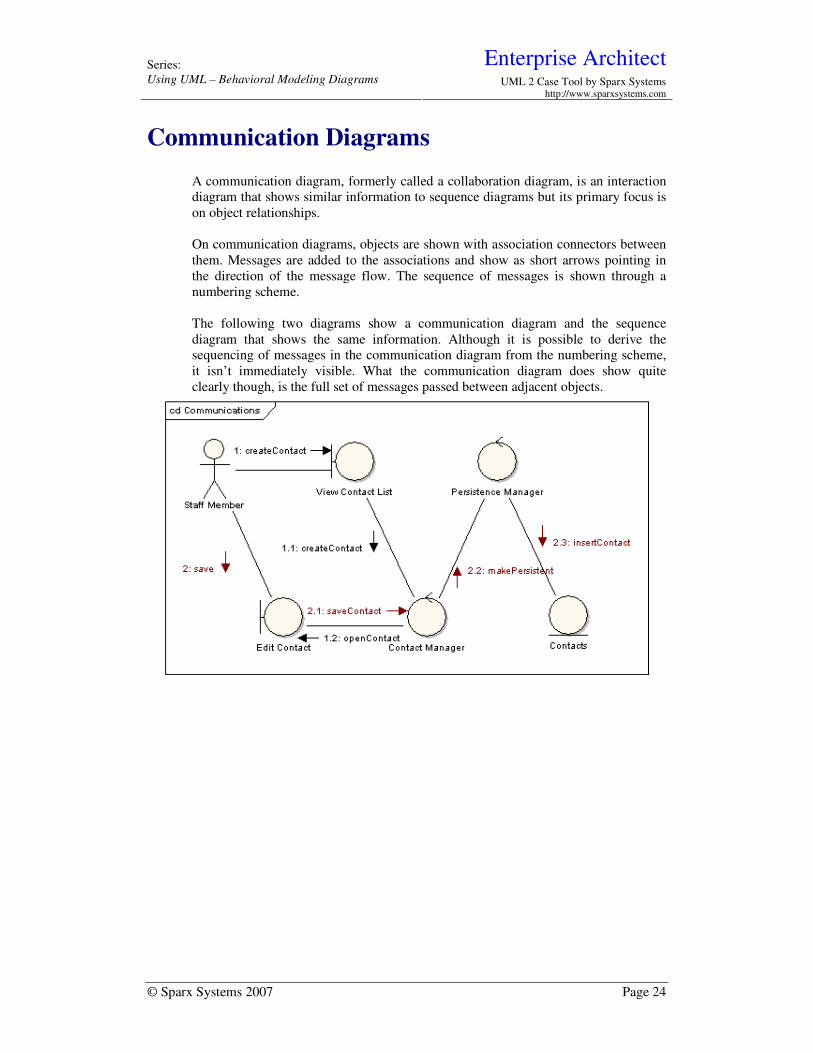
Communication Diagrams
A communication diagram, formerly called a collaboration diagram, is an interaction
diagram that shows similar information to sequence diagrams but its primary focus is
on object relationships.
On communication diagrams, objects are shown with association connectors between
them. Messages are added to the associations and show as short arrows pointing in
the direction of the message flow. The sequence of messages is shown through a
numbering scheme.
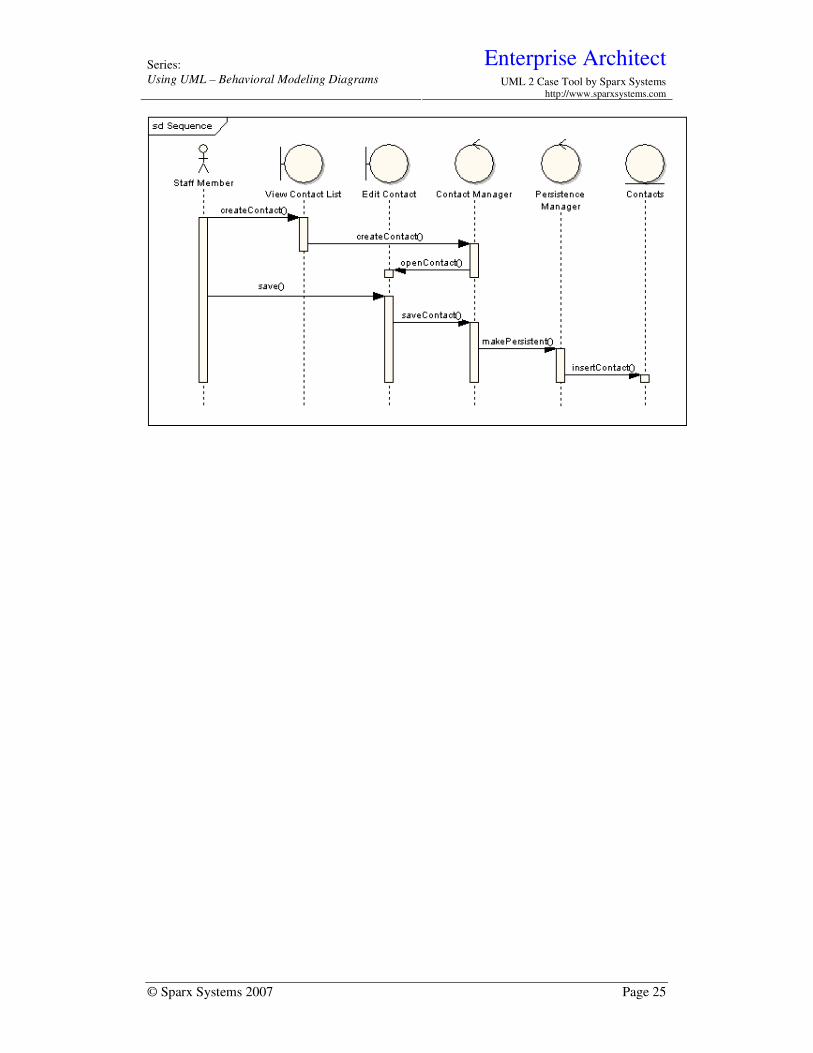
The following two diagrams show a communication diagram and the sequence
diagram that shows the same information. Although it is possible to derive the
sequencing of messages in the communication diagram from the numbering scheme,
it isn’t immediately visible. What the communication diagram does show quite
clearly though, is the full set of messages passed between adjacent objects.
Enterprise Architect Series:
Using UML – Behavioral Modeling Diagrams UML 2 Case Tool by Sparx Systems http://www.sparxsystems.com
© Sparx Systems 2007 Page 25
Enterprise Architect Series:
Using UML – Behavioral Modeling Diagrams UML 2 Case Tool by Sparx Systems http://www.sparxsystems.com
© Sparx Systems 2007 Page 26
Sequence Diagrams
A sequence diagram is a form of interaction diagram that shows objects as lifelines
running down the page, with their interactions over time represented as messages
drawn as arrows from the source lifeline to the target lifeline. Sequence diagrams are
good for showing which objects communicate with which other objects, and what
messages trigger those communications. Sequence diagrams are not intended for
showing complex procedural logic.
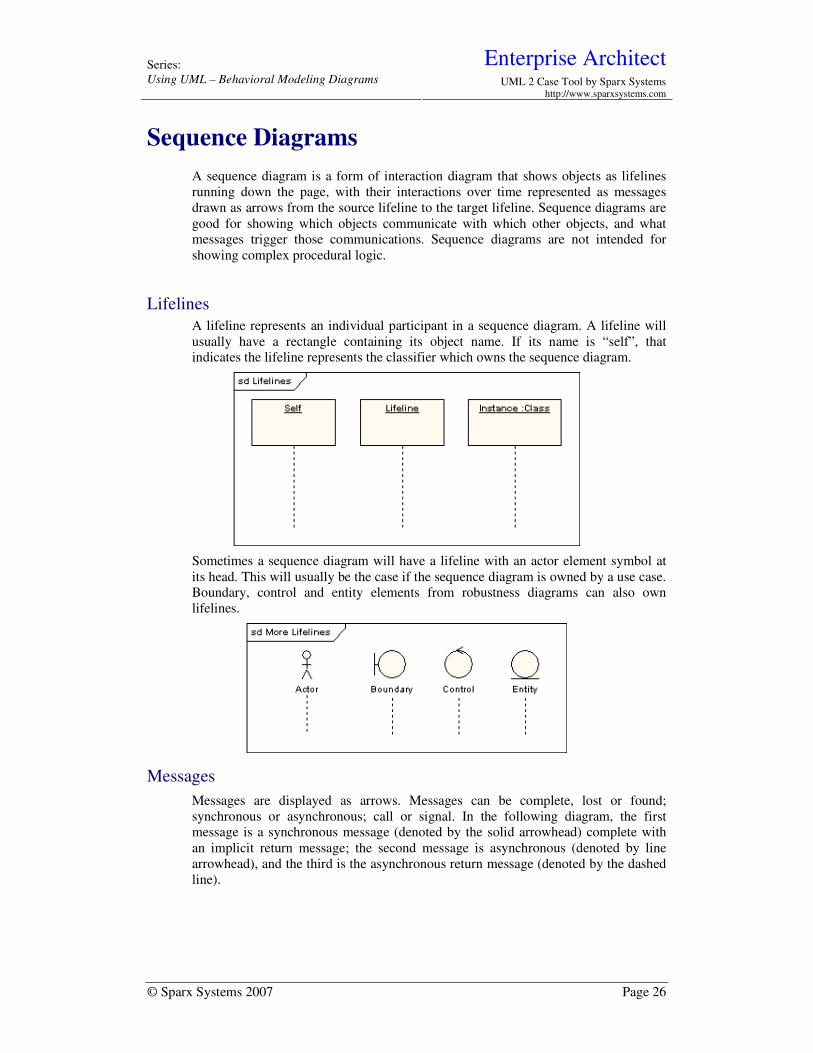
Lifelines
A lifeline represents an individual participant in a sequence diagram. A lifeline will
usually have a rectangle containing its object name. If its name is “self”, that
indicates the lifeline represents the classifier which owns the sequence diagram.
Sometimes a sequence diagram will have a lifeline with an actor element symbol at
its head. This will usually be the case if the sequence diagram is owned by a use case.
Boundary, control and entity elements from robustness diagrams can also own
lifelines.
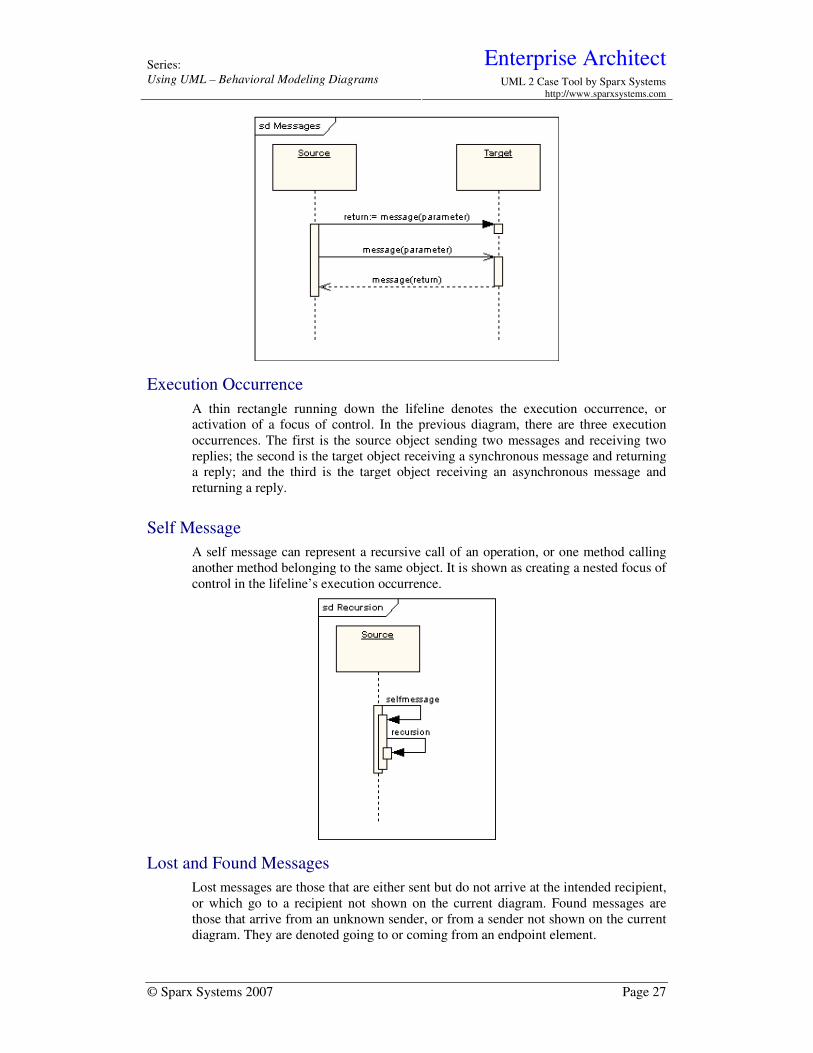
Messages
Messages are displayed as arrows. Messages can be complete, lost or found;
synchronous or asynchronous; call or signal. In the following diagram, the first
message is a synchronous message (denoted by the solid arrowhead) complete with
an implicit return message; the second message is asynchronous (denoted by line
arrowhead), and the third is the asynchronous return message (denoted by the dashed
line).
Enterprise Architect Series:
Using UML – Behavioral Modeling Diagrams UML 2 Case Tool by Sparx Systems http://www.sparxsystems.com
© Sparx Systems 2007 Page 27
Execution Occurrence
A thin rectangle running down the lifeline denotes the execution occurrence, or
activation of a focus of control. In the previous diagram, there are three execution
occurrences. The first is the source object sending two messages and receiving two
replies; the second is the target object receiving a synchronous message and returning
a reply; and the third is the target object receiving an asynchronous message and
returning a reply.
Self Message
A self message can represent a recursive call of an operation, or one method calling
another method belonging to the same object. It is shown as creating a nested focus of
control in the lifeline’s execution occurrence.
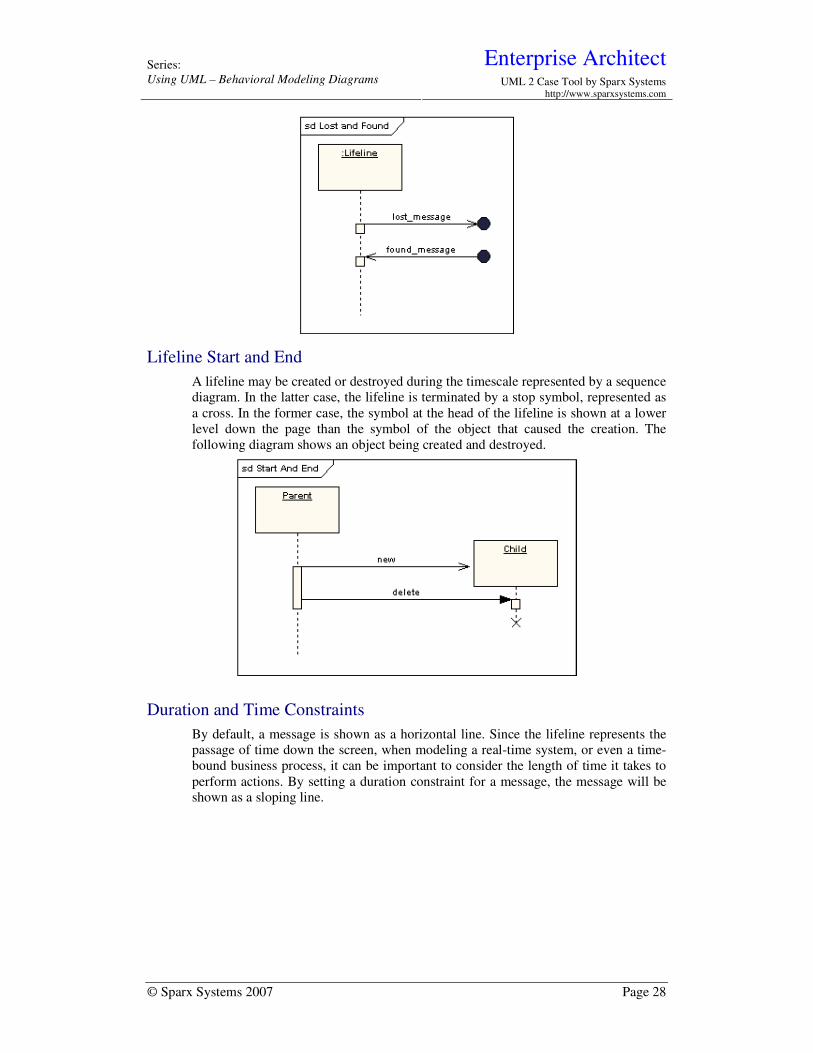
Lost and Found Messages
Lost messages are those that are either sent but do not arrive at the intended recipient,
or which go to a recipient not shown on the current diagram. Found messages are
those that arrive from an unknown sender, or from a sender not shown on the current
diagram. They are denoted going to or coming from an endpoint element.
Enterprise Architect Series:
Using UML – Behavioral Modeling Diagrams UML 2 Case Tool by Sparx Systems http://www.sparxsystems.com
© Sparx Systems 2007 Page 28
Lifeline Start and End
A lifeline may be created or destroyed during the timescale represented by a sequence
diagram. In the latter case, the lifeline is terminated by a stop symbol, represented as
a cross. In the former case, the symbol at the head of the lifeline is shown at a lower
level down the page than the symbol of the object that caused the creation. The
following diagram shows an object being created and destroyed.
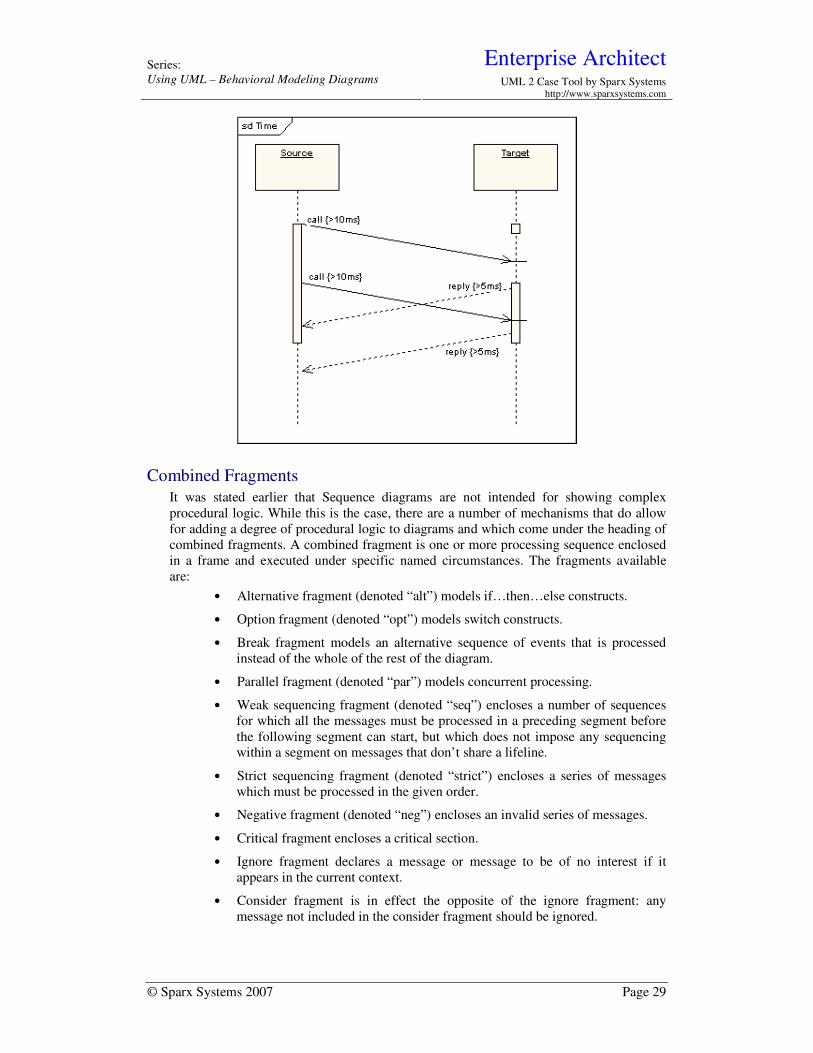
Duration and Time Constraints
By default, a message is shown as a horizontal line. Since the lifeline represents the
passage of time down the screen, when modeling a real-time system, or even a time-
bound business process, it can be important to consider the length of time it takes to
perform actions. By setting a duration constraint for a message, the message will be
shown as a sloping line.
Enterprise Architect Series:
Using UML – Behavioral Modeling Diagrams UML 2 Case Tool by Sparx Systems http://www.sparxsystems.com
© Sparx Systems 2007 Page 29
Combined Fragments
It was stated earlier that Sequence diagrams are not intended for showing complex
procedural logic. While this is the case, there are a number of mechanisms that do allow
for adding a degree of procedural logic to diagrams and which come under the heading of
combined fragments. A combined fragment is one or more processing sequence enclosed
in a frame and executed under specific named circumstances. The fragments available
are:
• Alternative fragment (denoted “alt”) models if…then…else constructs.
• Option fragment (denoted “opt”) models switch constructs.
• Break fragment models an alternative sequence of events that is processed
instead of the whole of the rest of the diagram.
• Parallel fragment (denoted “par”) models concurrent processing.
• Weak sequencing fragment (denoted “seq”) encloses a number of sequences
for which all the messages must be processed in a preceding segment before
the following segment can start, but which does not impose any sequencing
within a segment on messages that don’t share a lifeline.
• Strict sequencing fragment (denoted “strict”) encloses a series of messages
which must be processed in the given order.
• Negative fragment (denoted “neg”) encloses an invalid series of messages.
• Critical fragment encloses a critical section.
• Ignore fragment declares a message or message to be of no interest if it
appears in the current context.
• Consider fragment is in effect the opposite of the ignore fragment: any
message not included in the consider fragment should be ignored.
Enterprise Architect Series:
Using UML – Behavioral Modeling Diagrams UML 2 Case Tool by Sparx Systems http://www.sparxsystems.com
© Sparx Systems 2007 Page 30
• Assertion fragment (denoted “assert”) designates that any sequence not
shown as an operand of the assertion is invalid.
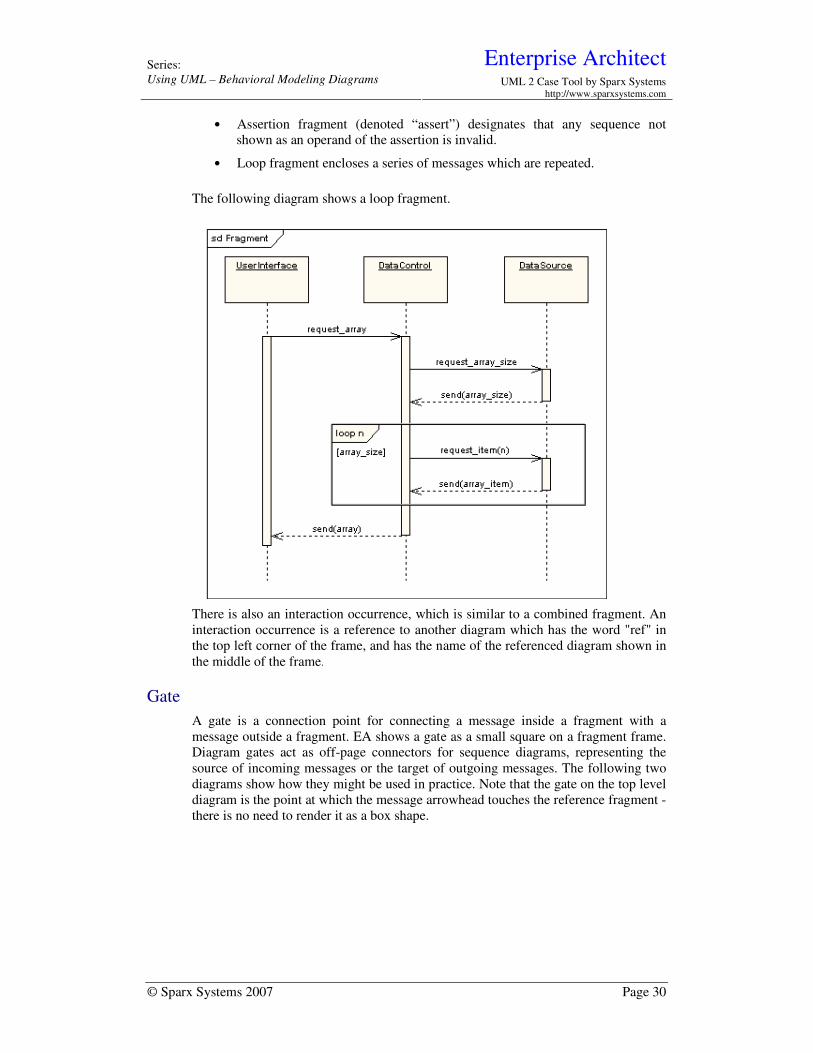
• Loop fragment encloses a series of messages which are repeated.
The following diagram shows a loop fragment.
There is also an interaction occurrence, which is similar to a combined fragment. An
interaction occurrence is a reference to another diagram which has the word "ref" in
the top left corner of the frame, and has the name of the referenced diagram shown in
the middle of the frame.
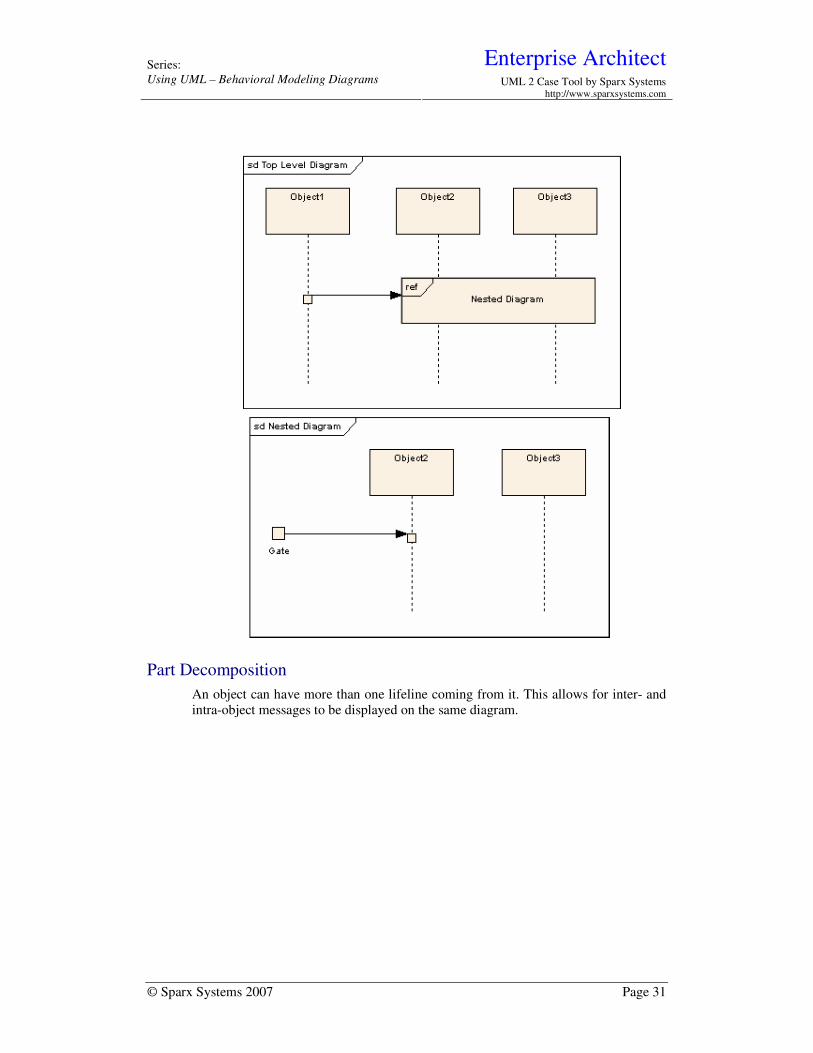
Gate
A gate is a connection point for connecting a message inside a fragment with a
message outside a fragment. EA shows a gate as a small square on a fragment frame.
Diagram gates act as off-page connectors for sequence diagrams, representing the
source of incoming messages or the target of outgoing messages. The following two
diagrams show how they might be used in practice. Note that the gate on the top level
diagram is the point at which the message arrowhead touches the reference fragment -
there is no need to render it as a box shape.
Enterprise Architect Series:
Using UML – Behavioral Modeling Diagrams UML 2 Case Tool by Sparx Systems http://www.sparxsystems.com
© Sparx Systems 2007 Page 31
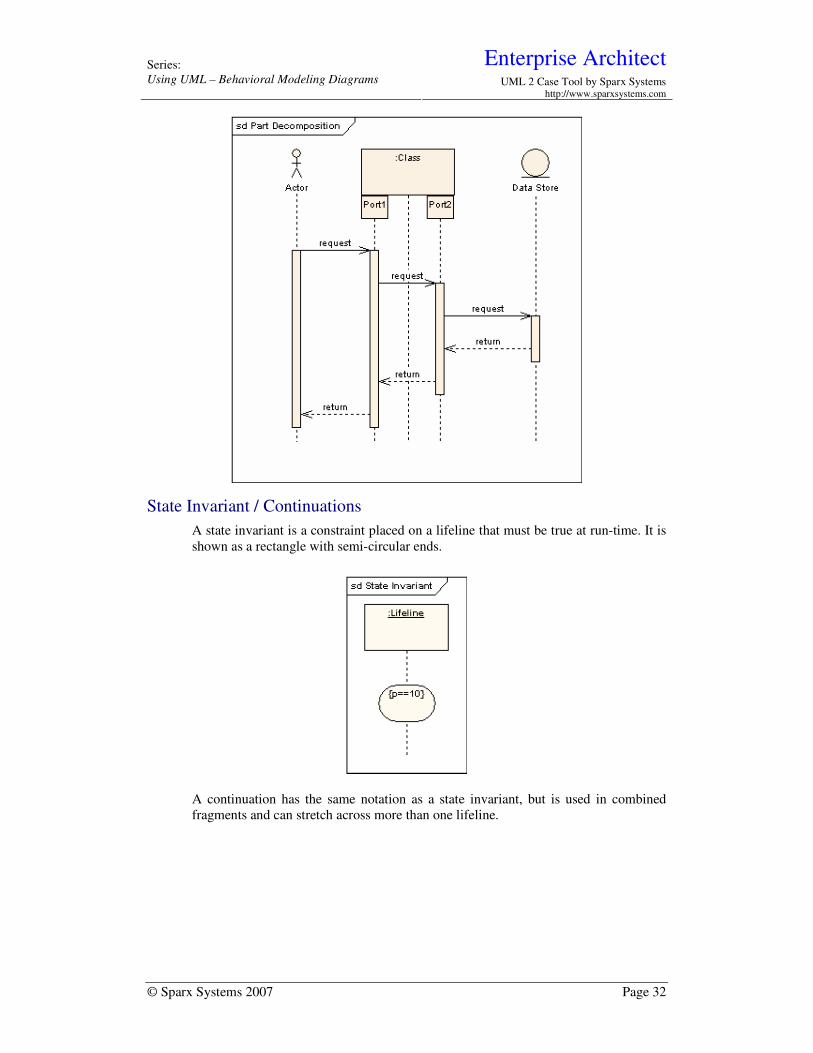
Part Decomposition
An object can have more than one lifeline coming from it. This allows for inter- and
intra-object messages to be displayed on the same diagram.
Enterprise Architect Series:
Using UML – Behavioral Modeling Diagrams UML 2 Case Tool by Sparx Systems http://www.sparxsystems.com
© Sparx Systems 2007 Page 32
State Invariant / Continuations
A state invariant is a constraint placed on a lifeline that must be true at run-time. It is
shown as a rectangle with semi-circular ends.
A continuation has the same notation as a state invariant, but is used in combined
fragments and can stretch across more than one lifeline.
Enterprise Architect Series:
Using UML – Behavioral Modeling Diagrams UML 2 Case Tool by Sparx Systems http://www.sparxsystems.com
© Sparx Systems 2007 Page 33
Timing Diagrams
UML timing diagrams are used to display the change in state or value of one or more
elements over time. It can also show the interaction between timed events and the
time and duration constraints that govern them.
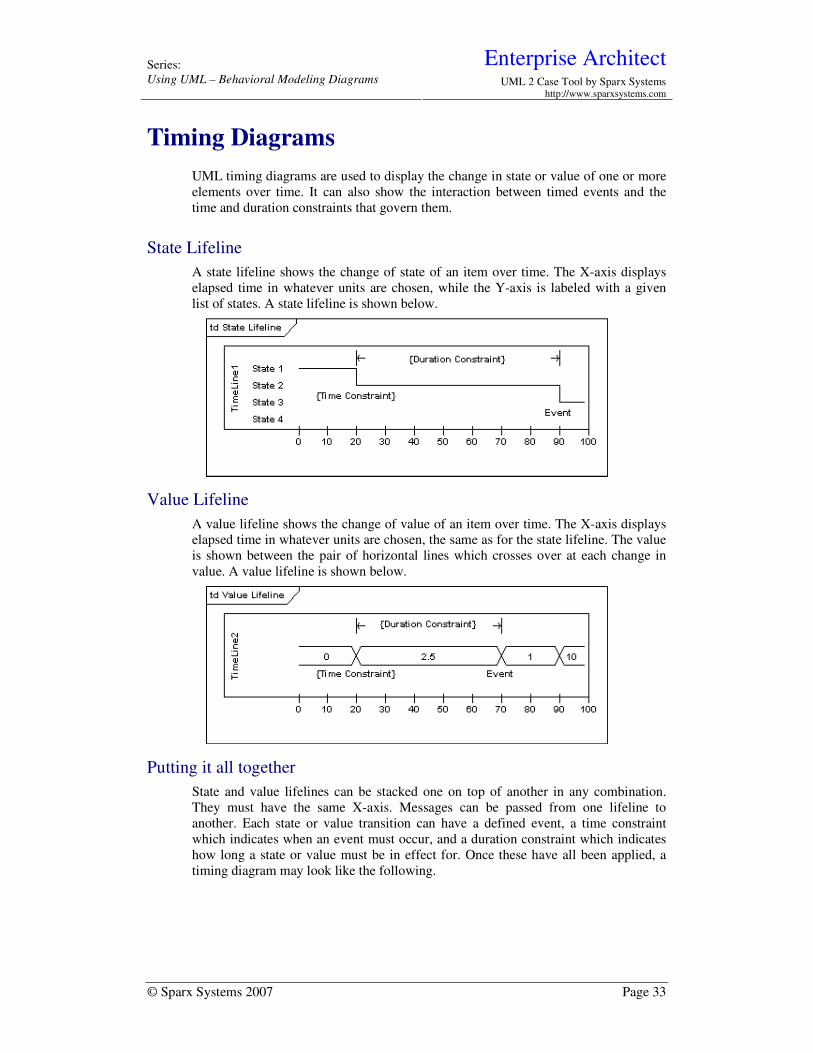
State Lifeline
A state lifeline shows the change of state of an item over time. The X-axis displays
elapsed time in whatever units are chosen, while the Y-axis is labeled with a given
list of states. A state lifeline is shown below.
Value Lifeline
A value lifeline shows the change of value of an item over time. The X-axis displays
elapsed time in whatever units are chosen, the same as for the state lifeline. The value
is shown between the pair of horizontal lines which crosses over at each change in
value. A value lifeline is shown below.
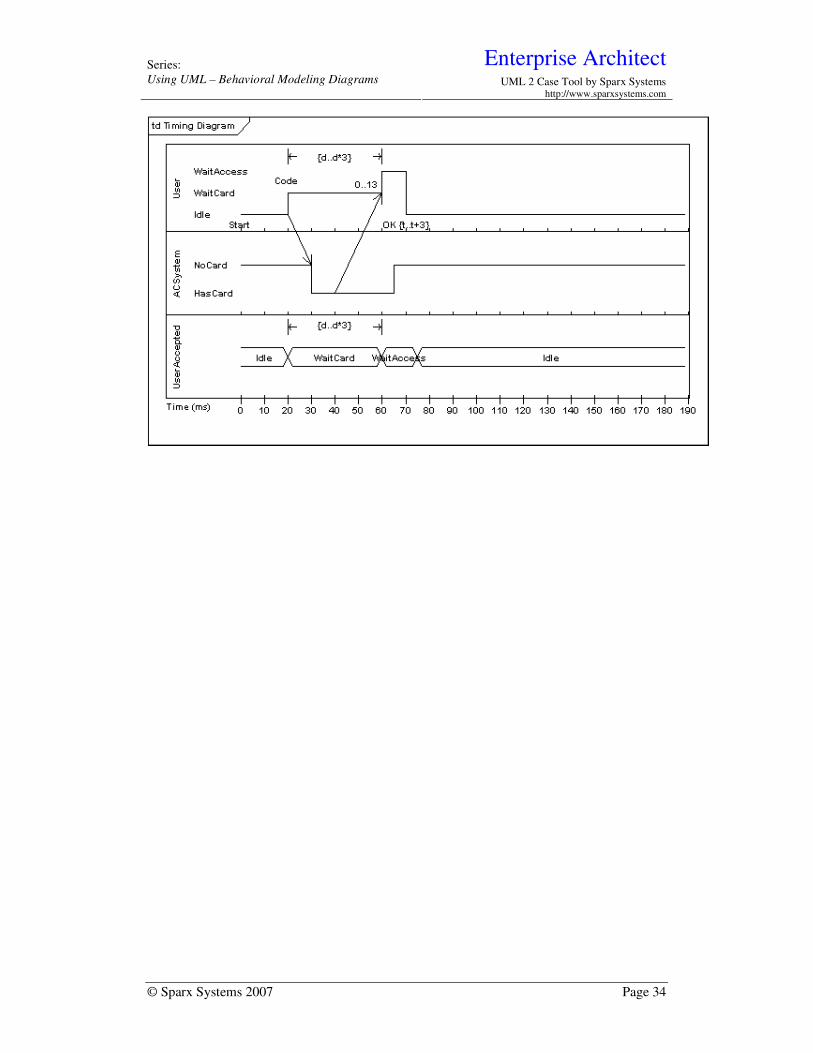
Putting it all together
State and value lifelines can be stacked one on top of another in any combination.
They must have the same X-axis. Messages can be passed from one lifeline to
another. Each state or value transition can have a defined event, a time constraint
which indicates when an event must occur, and a duration constraint which indicates
how long a state or value must be in effect for. Once these have all been applied, a
timing diagram may look like the following.
Enterprise Architect Series:
Using UML – Behavioral Modeling Diagrams UML 2 Case Tool by Sparx Systems http://www.sparxsystems.com
© Sparx Systems 2007 Page 34
Enterprise Architect Series:
Using UML – Behavioral Modeling Diagrams UML 2 Case Tool by Sparx Systems http://www.sparxsystems.com
© Sparx Systems 2007 Page 35
Interaction Overview Diagrams
An interaction overview diagram is a form of activity diagram in which the nodes
represent interaction diagrams. Interaction diagrams can include sequence,
communication, interaction overview, and timing diagrams. Most of the notation for
interaction overview diagrams is the same for activity diagrams. For example initial,
final, decision, merge, fork and join nodes are all the same. However, interaction
overview diagrams introduce two new elements: interaction occurrences and
interaction elements.
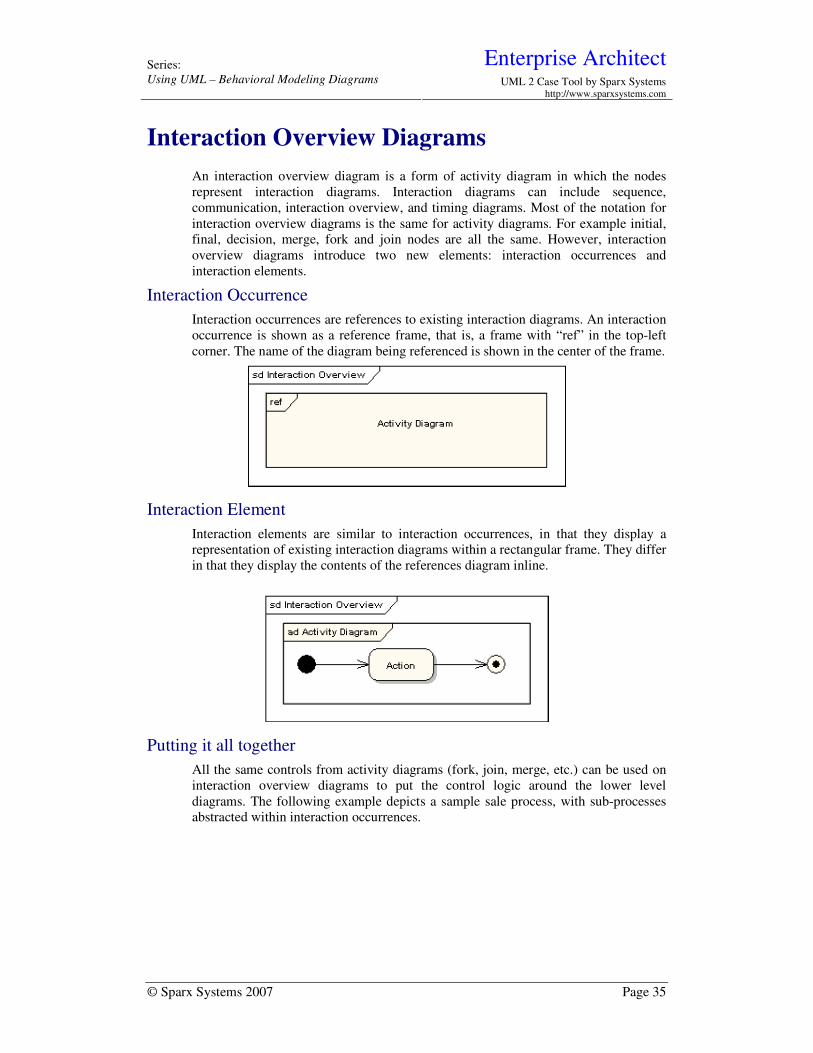
Interaction Occurrence
Interaction occurrences are references to existing interaction diagrams. An interaction
occurrence is shown as a reference frame, that is, a frame with “ref” in the top-left
corner. The name of the diagram being referenced is shown in the center of the frame.
Interaction Element
Interaction elements are similar to interaction occurrences, in that they display a
representation of existing interaction diagrams within a rectangular frame. They differ
in that they display the contents of the references diagram inline.
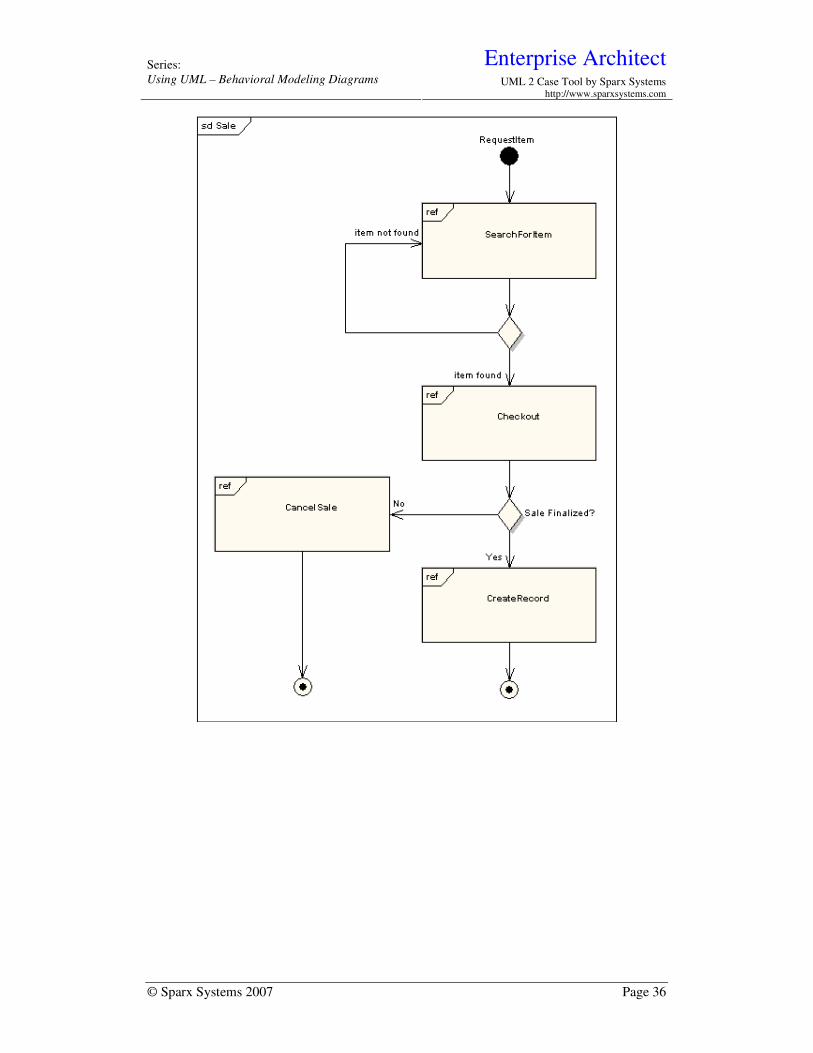
Putting it all together
All the same controls from activity diagrams (fork, join, merge, etc.) can be used on
interaction overview diagrams to put the control logic around the lower level
diagrams. The following example depicts a sample sale process, with sub-processes
abstracted within interaction occurrences.
Enterprise Architect Series:
Using UML – Behavioral Modeling Diagrams UML 2 Case Tool by Sparx Systems http://www.sparxsystems.com
© Sparx Systems 2007 Page 36

Enterprise Architect Series:
Using UML – Behavioral Modeling Diagrams UML 2 Case Tool by Sparx Systems http://www.sparxsystems.com
© Sparx Systems 2007 Page 37
Recommended Reading
For more information, please refer to:
Sparx Systems’ Web Site: www.sparxsystems.com
Object Management Group’s Web Site: www.omg.com
Object Management Group’s UML pages: www.uml.org